My Account
My Slides
Search by Category
Pricing
Templates
View All Templates
Download Template Slides
✦ AI Search
Feedback
Login
Logout
Get Started
Browse all Slides
Browse all Slides
Create a FREE Account
Instant access to 1,000+ real slides from top companies like McKinsey, BCG, Goldman Sachs, Google and many more!
First Name
Last Name
Email
Password
I agree to all
Terms & Privacy Policy
Thank you! Your submission has been received!
Oops! Something went wrong while submitting the form.
Have an account?
Sign in
Saved Slides
Total No. of slides saved
0
↻ Refresh
✖ Clear all
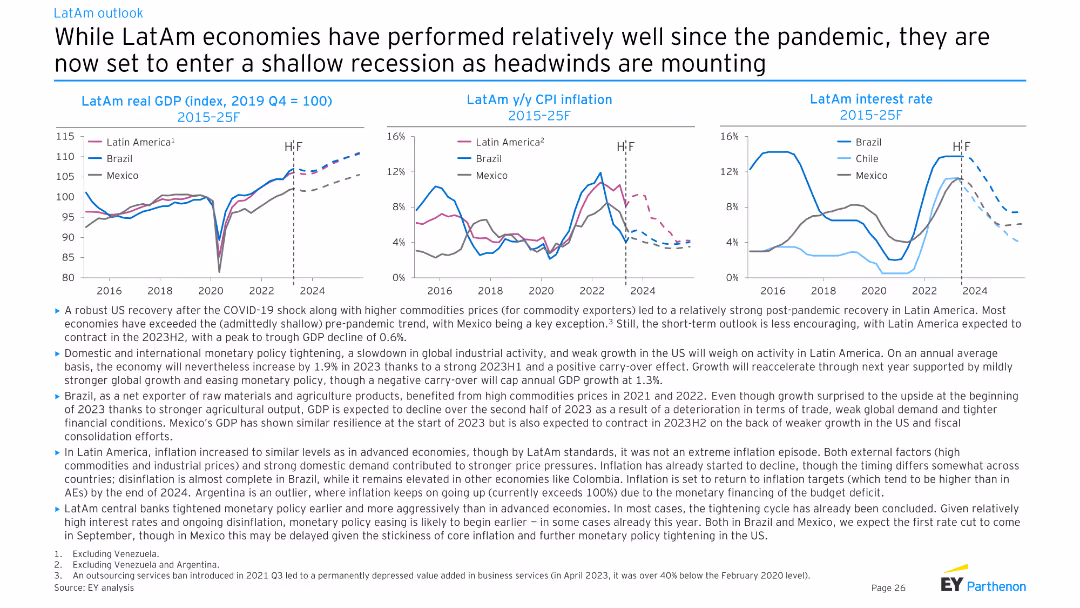
Three line charts depicting LatAm real GDP (index), y/y CPI inflation, and interest rate trends for Brazil, Chile, and Mexico from 2015-25F. Moderate complexity, well-suited for presenting regional economic trends.
Market Analysis and Trends
Financial Services
This slide provides an economic outlook for Latin American countries, highlighting post-pandemic recovery, commodity prices, and the anticipated shallow recession. It discusses GDP growth, inflation, and interest rate trends in Brazil, Chile, and Mexico.
LatAm, GDP, CPI, interest rate, recession
false
Market Analysis and Trends
Financial Services
Multiple Chart
EY
Add to my slides
Remove from favorites
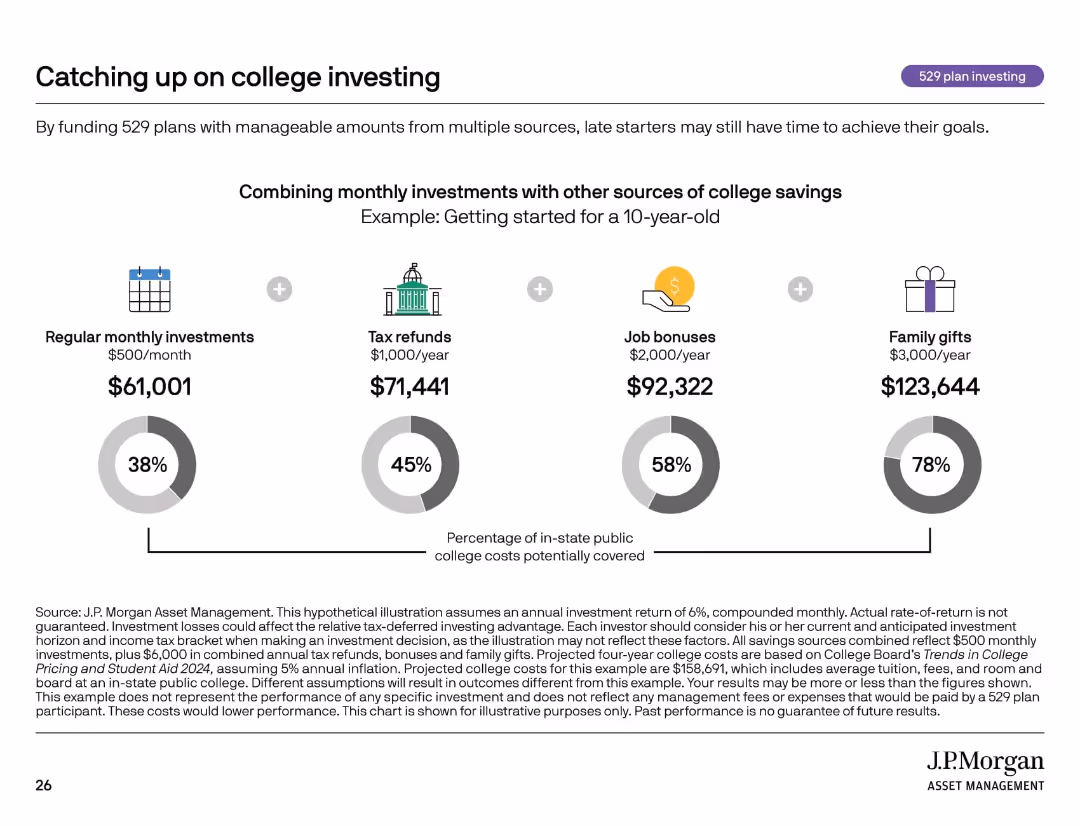
Horizontal bar visuals comparing sources of funding; icons used for each income stream.
Strategic Planning
Financial Services
The slide illustrates how families starting late can still achieve education savings goals by combining smaller contributions from multiple sources (e.g., refunds, bonuses, gifts). It shows the cumulative impact of each funding stream and what percentage of in-state college costs they can cover.
late saving, 529 plans, college investment, family finance, contributions
false
Strategic Planning
Financial Services
Mixed Chart
JP Morgan
Add to my slides
Remove from favorites
Contains a regional breakdown of banking operations in Latin America with performance highlights, using icons and a table format to detail country-specific operations.
Financial Performance
Financial Services
Reviews the profitability of banking operations across Latin America, highlighting key markets and strategic positions in retail and wholesale banking sectors.
Latin America, banking, profitability, operations, strategy
false
Financial Performance
Financial Services
Table
Barclays
Add to my slides
Remove from favorites
Contains three charts: a line chart of LatAm y/y real GDP (2019 Q4 = 100) from 2015-2025F, a column chart of 2024F y/y real GDP, and a line chart of LatAm employment.
Market Analysis and Trends
Financial Services
Examines Latin America's economic performance in 2023 and provides forecasts for 2024, highlighting GDP, employment trends, and economic challenges.
Latin America, GDP, Employment, 2024, Trends
false
Market Analysis and Trends
Financial Services
Multiple Chart
EY
Add to my slides
Remove from favorites
This slide has three main charts: a bar chart showing the year-over-year change in real GDP, a line chart tracking inflation rates, and another line chart depicting real policy rates by country (Brazil, Peru, Colombia, Mexico, Chile).
Market Analysis and Trends
Financial Services
The slide provides an overview of economic performance in Latin America, highlighting growth, inflation trends, and policy rates by country.
Latin America, GDP, inflation, policy rates, economic growth
false
Market Analysis and Trends
Financial Services
Multiple Chart
JP Morgan
Add to my slides
Remove from favorites
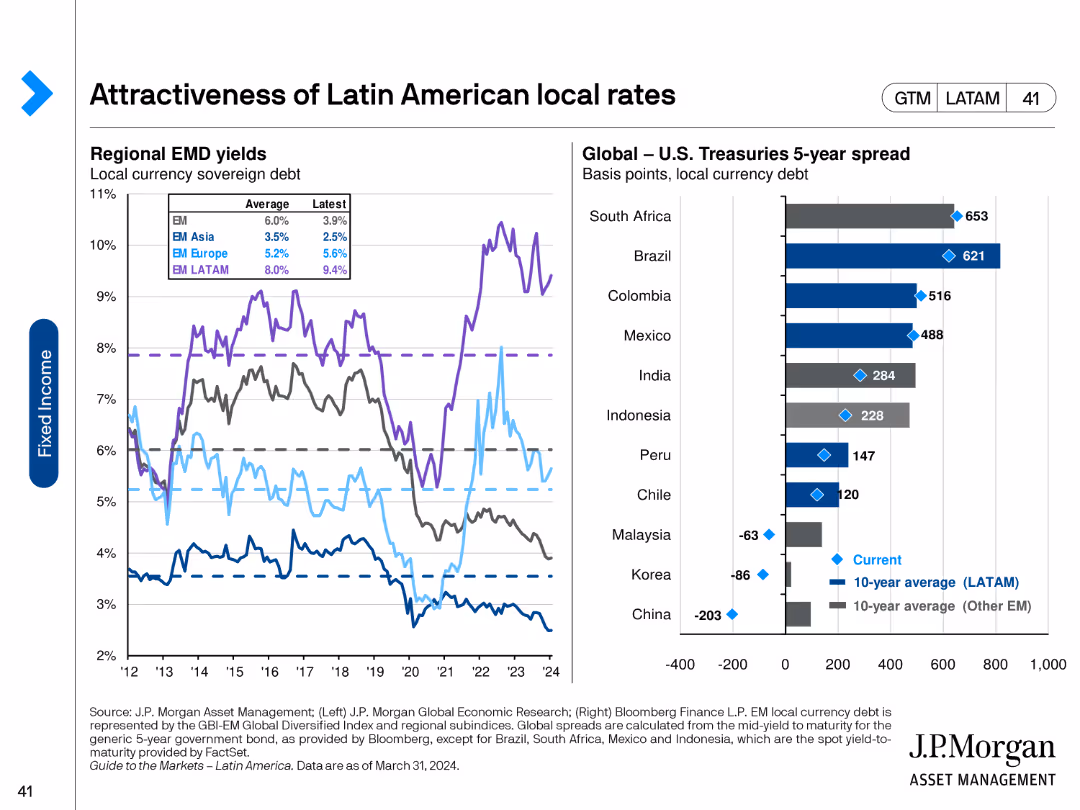
This slide features line charts showing regional EMD yields and a column chart comparing global U.S. Treasuries 5-year spread across various countries.
Market Analysis and Trends
Financial Services
The slide evaluates the attractiveness of Latin American local rates by comparing EMD yields and U.S. Treasury spreads across different countries, highlighting investment opportunities and risks.
Latin America, local rates, EMD yields, U.S. Treasuries, investment opportunities, investment risks, economic analysis
false
Market Analysis and Trends
Financial Services
Multiple Chart
JP Morgan
Add to my slides
Remove from favorites
The slide contains two charts: a bar chart showing the price-to-earnings ratios for various Latin American countries and a line chart depicting earnings per share (EPS) trends. The charts use multiple colors for different countries and time periods.
Market Analysis and Trends
Financial Services
It compares valuations and earnings across Latin American countries, providing insights into market performance and potential investment opportunities in these regions.
Latin America, valuations, earnings, price-to-earnings, EPS
false
Market Analysis and Trends
Financial Services
Multiple Chart
JP Morgan
Add to my slides
Remove from favorites
Slide features two column charts with annotations and icons indicative of legal categories. The color scheme is red and gray with legal symbols.
Regulatory and Compliance
Government & Public Sector
Analyzes the state of general law matters, including the volume of family law cases, federal law applications, and opportunities for improvement.
Law, legal statistics, federal cases, family law, migration matters, court applications, case triaging, judicial expertise
false
Regulatory and Compliance
Government & Public Sector
Multiple Chart
PwC/Strategy&
Add to my slides
Remove from favorites
Features text, a key opportunities header, and a bubble chart with axes representing cost and time to implement.
Regulatory and Compliance
Government & Public Sector
Discusses family law reform opportunities, rated by cost and implementation time, suggesting more efficient legal processes.
law reform, judicial efficiency, case management, legal processes, implementation cost, opportunity assessment
false
Regulatory and Compliance
Government & Public Sector
Mixed Chart
PwC/Strategy&
Add to my slides
Remove from favorites
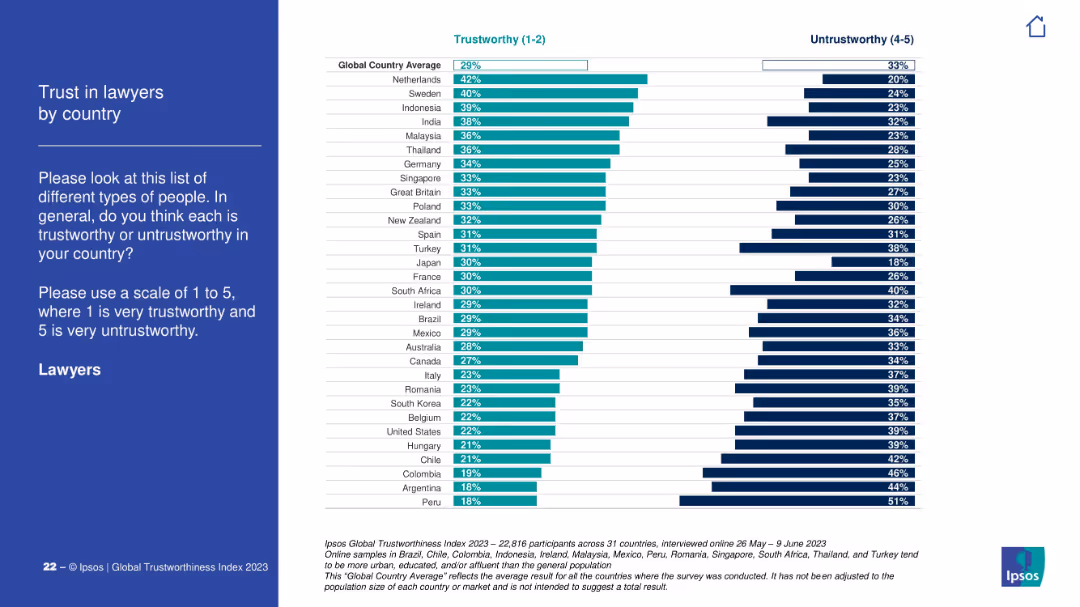
Country-ranking bar chart with global average benchmark. Trust and untrust scores displayed for each nation.
Customer and Market Segmentation
Professional Services
Lawyers are among the less trusted professions globally, with the global average trust score at 29%. The Netherlands, Sweden, and Indonesia top the trust rankings, while Peru and Argentina score lowest.
lawyers, public trust, legal professionals, Ipsos, global ranking, legal perception
false
Customer and Market Segmentation
Professional Services
Mixed Chart
IPSOS
Add to my slides
Remove from favorites
The slide includes a column chart showing announced layoffs by sector in the US from February 2022 to February 2023. Sectors include technology, media & telecom, health, and others. Commentary highlights key factors contributing to layoff trends.
Risk Assessment and Management
Technology & Software
The slide tracks layoffs in the US across different sectors, noting an overall decrease in February but a significant increase in media and telecom. It attributes layoffs to economic conditions, ad revenue declines, and tech sector adjustments post-pandemic.
layoffs, US, sectors, technology, trends, economic conditions
false
Risk Assessment and Management
Technology & Software
Mixed Chart
Accenture
Add to my slides
Remove from favorites
The slide features two bar charts titled "Total LBO loans issued declined across regions" and "Meanwhile, direct lending has been growing". The left chart shows a decline with a red arrow pointing to a 50% reduction. The right chart shows increasing trends in red for the year 22. Both have a y-axis with monetary values.
Market Analysis and Trends
Financial Services
This slide compares traditional bank lending trends with the rise of direct lending, highlighting a significant decline in leveraged buyout loans and the growth of alternative funding. It's used to analyze the shifts in financial strategies and impacts on large deals financing.
LBO, Financing, Direct Lending, Market Trends, Decline, Growth, Alternative Funding, Comparison
false
Market Analysis and Trends
Financial Services
Single Chart
Bain
Add to my slides
Remove from favorites
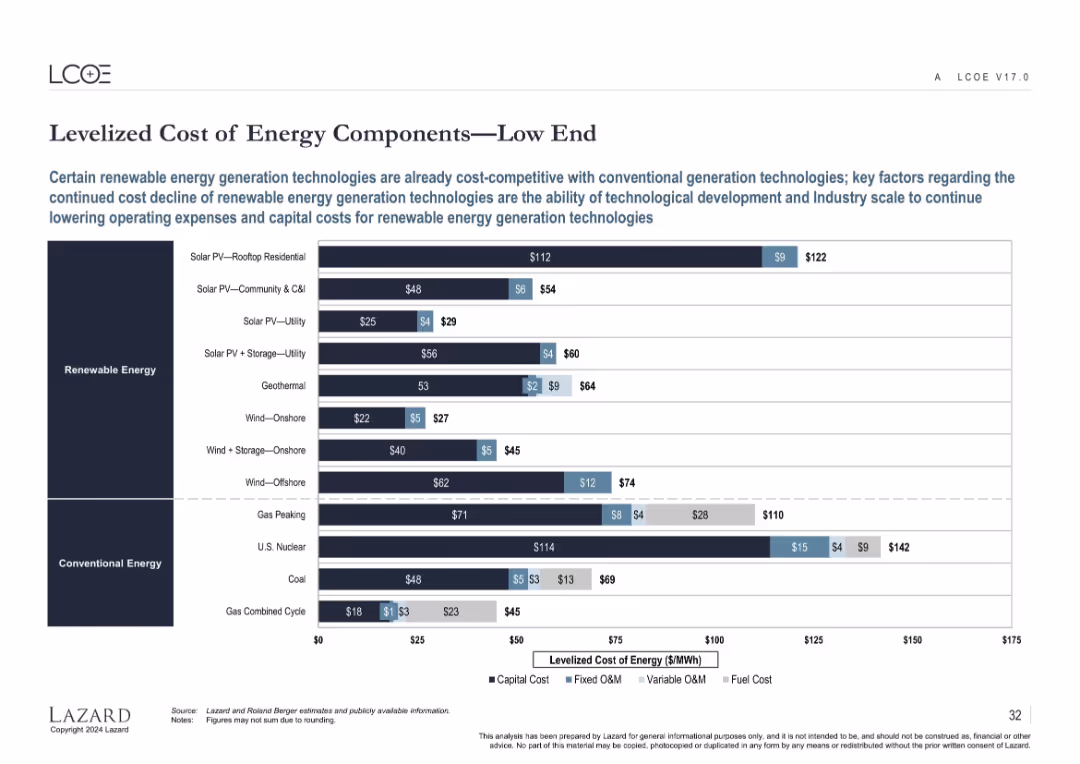
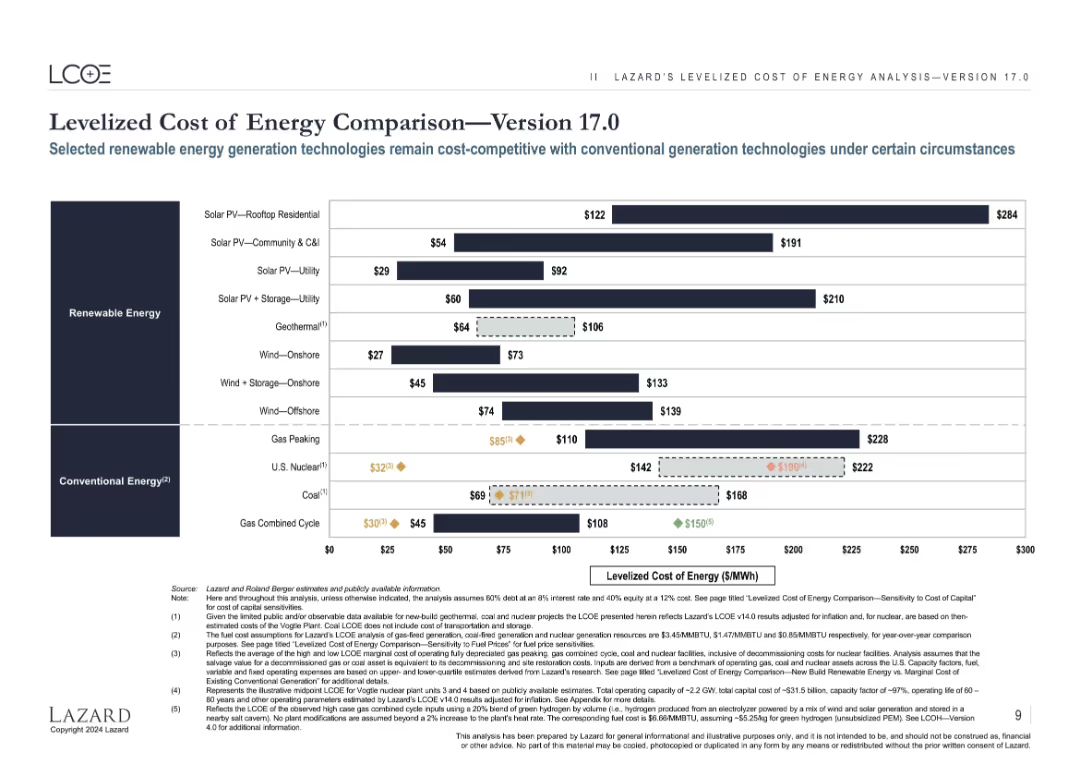
Horizontal bar chart decomposing LCOE for various renewable and conventional energy types at the low-cost end.
Performance Metrics and KPIs
Energy & Utilities
Shows the capital and operating cost breakdowns for renewable and conventional energy technologies at the low end of the cost spectrum. Highlights how some renewables are now cost-competitive or cheaper than fossil-based power generation.
LCOE, capital cost, fixed O&M, variable O&M, fuel cost, renewable energy, cost structure
false
Performance Metrics and KPIs
Energy & Utilities
Single Chart
Roland Berger
Add to my slides
Remove from favorites
This slide presents a horizontal bar chart detailing the high-end levelized cost components for various renewable and conventional energy technologies, including capital, fixed O&M, variable O&M, and fuel costs.
Operational Efficiency
Energy & Utilities
The slide analyzes the high-end levelized cost components for different energy sources, emphasizing the cost structures and potential areas for reducing overall costs in renewable and conventional energy generation.
LCOE Components, High-End Cost, Energy Efficiency, Cost Breakdown, Renewable Energy
false
Operational Efficiency
Energy & Utilities
Single Chart
Roland Berger
Add to my slides
Remove from favorites
This slide shows a horizontal bar chart detailing the low-end levelized cost components for various renewable and conventional energy technologies, including capital, fixed O&M, variable O&M, and fuel costs.
Operational Efficiency
Energy & Utilities
The slide breaks down the low-end levelized cost components for different energy sources, highlighting the factors contributing to overall cost efficiency and competitiveness of renewable vs. conventional energy.
LCOE Components, Low-End Cost, Energy Efficiency, Cost Breakdown, Renewable Energy
false
Operational Efficiency
Energy & Utilities
Single Chart
Roland Berger
Add to my slides
Remove from favorites
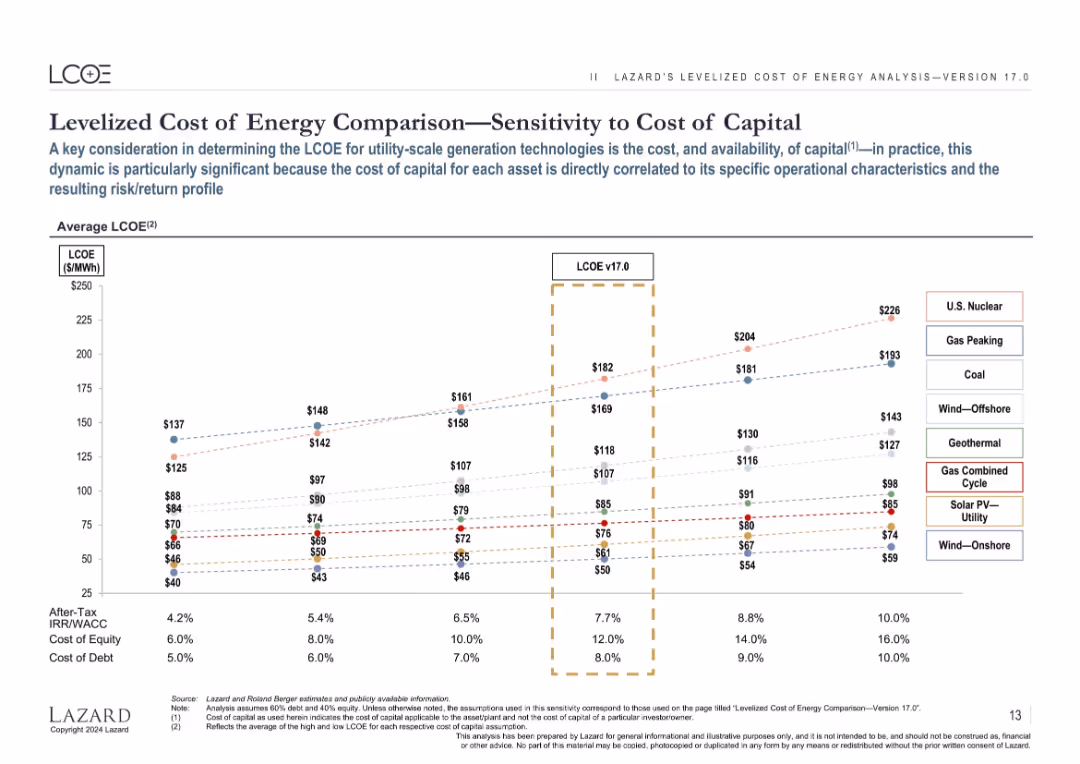
Line chart showing how LCOE varies with cost of capital for each energy source; each line represents one technology.
Investment Analysis
Financial Services
Explores how variations in the cost of capital influence the LCOE of different energy technologies, illustrating that renewables tend to have lower risk and better cost stability under financial fluctuations.
LCOE, cost of capital, IRR, equity, debt, investment, energy financing, WACC
false
Investment Analysis
Financial Services
Single Chart
Roland Berger
Add to my slides
Remove from favorites
The slide displays a column chart showing the Levelized Cost of Electricity (LCOE) for different fossil and low carbon energy sources in $/MWh for 2019. The chart compares costs across various energy sources such as coal, gas, nuclear, wind, and biomass.
Market Analysis and Trends
Energy & Utilities
The slide compares the LCOE of different energy sources, indicating that gas combined with CCUS falls within the range of other low carbon electricity sources and has the advantage of being dispatchable. It suggests that lower estimates for LCOE can cover a drop in these costs.
LCOE, electricity, energy sources, CCUS
false
Market Analysis and Trends
Energy & Utilities
Single Chart
Kearney
Add to my slides
Remove from favorites
The slide features a column chart comparing the levelized cost of energy (LCoE) by renewable energy source (solar, wind, geothermal, hydro, biomass) from 2010 to 2019. It highlights the improvements in feedstock economics and infrastructure compatibility.
Technology and Digital Transformation
Energy & Utilities
This slide presents the comparative costs of various renewable energy sources over time, emphasizing the competitive position of biomass and the potential for further cost reductions through improvements in feedstock and process economics.
LCoE, renewable energy, solar, wind, geothermal, hydro, biomass, feedstock economics, infrastructure compatibility
false
Technology and Digital Transformation
Energy & Utilities
Mixed Chart
Kearney
Add to my slides
Remove from favorites
Horizontal bar chart comparing LCOE for various renewable and conventional energy sources; categorized into two vertical sections with color-coded bars.
Market Analysis and Trends
Energy & Utilities
This slide compares the Levelized Cost of Energy (LCOE) across energy sources, highlighting the cost competitiveness of renewables vs. fossil fuels under typical assumptions.
LCOE, renewable, solar, wind, nuclear, coal, gas, comparison, $/MWh, energy costs
false
Market Analysis and Trends
Energy & Utilities
Single Chart
Roland Berger
Add to my slides
Remove from favorites
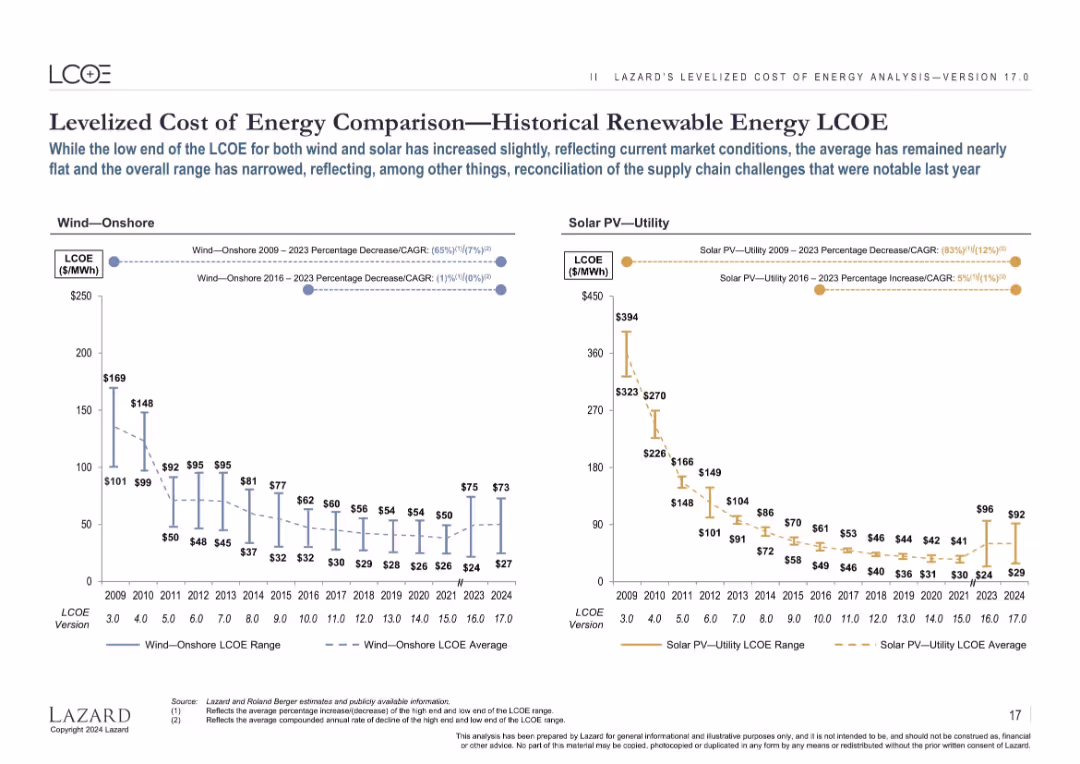
Two side-by-side line charts comparing LCOE ranges and averages for Wind—Onshore and Solar PV—Utility from 2009–2024.
Market Analysis and Trends
Energy & Utilities
The slide illustrates historical trends in the Levelized Cost of Energy (LCOE) for onshore wind and utility-scale solar PV. While prices dropped significantly from 2009 to 2020, recent years show slight increases and a narrowing range, reflecting market and supply chain dynamics.
LCOE, wind energy, solar PV, renewable energy, historical trends, pricing, market, CAGR
false
Market Analysis and Trends
Energy & Utilities
Multiple Chart
Roland Berger
Add to my slides
Remove from favorites
The slide features a line graph showing the relationship between capex and LCOH across various utilization rates, highlighting significant cost increases at low utilization.
Market Analysis and Trends
Energy & Utilities
The slide explains that while high load factors offset capex weight, LCOH can spike dramatically at low utilization rates, supported by the graph.
LCOH, capex, utilization rate, cost analysis, load factor
false
Market Analysis and Trends
Energy & Utilities
Single Chart
Kearney
Add to my slides
Remove from favorites
This slide features two bar charts showing the costs of conversion and reconversion for different hydrogen storage methods, emphasizing compression costs.
Market Analysis and Trends
Energy & Utilities
The slide explains that conversion and reconversion processes increase LCOH, with compression being the cheapest yet lowest energy-dense option, supported by the charts.
LCOH, conversion, reconversion, compression, storage costs
false
Market Analysis and Trends
Energy & Utilities
Multiple Chart
Kearney
Add to my slides
Remove from favorites
This slide contains two graphs: one showing the impact of capex on electrolysis costs and another depicting the effect of electricity prices and utilization rates.
Market Analysis and Trends
Energy & Utilities
The slide details how reducing capex and optimizing electricity prices and load factor can improve the LCOH for electrolysis, using visual data to support the points.
LCOH, electrolysis, capex, electricity price, load factor
false
Market Analysis and Trends
Energy & Utilities
Multiple Chart
Kearney
Add to my slides
Remove from favorites
This slide presents a column chart that breaks down the LCOH for a PEM electrolyzer, with electricity being the largest cost component.
Market Analysis and Trends
Energy & Utilities
The slide shows the breakdown of LCOH costs for a PEM electrolyzer, emphasizing the significant impact of electricity costs on overall expenses.
LCOH, electrolyzer, PEM, electricity costs, capex
false
Market Analysis and Trends
Energy & Utilities
Single Chart
Kearney
Add to my slides
Remove from favorites
The slide includes multiple column charts comparing the Levelized Cost of Hydrogen (LCOH) from different power sources over time (2019, 2025, 2030). Each chart shows cost variations for wind, solar, grid wind, and grid solar.
Market Analysis and Trends
Energy & Utilities
The slide analyzes the competitiveness of hydrogen production using electrolyzers powered by renewables versus grid-connected systems. It projects cost reductions over time and highlights the economic potential of renewable-powered electrolyzers.
LCOH, electrolyzer, renewable energy, hydrogen production, cost analysis
false
Market Analysis and Trends
Energy & Utilities
Multiple Chart
Kearney
Add to my slides
Remove from favorites
The slide features three sets of bar charts comparing LCOH reductions under different power control scenarios (positive, negative, combined). Each set shows cost comparisons for grid-only and with power control.
Risk Assessment and Management
Energy & Utilities
This slide examines how grid servicing by electrolyzers can significantly reduce the Levelized Cost of Hydrogen (LCOH). It presents various scenarios and quantifies potential cost savings through effective power control management.
LCOH, grid servicing, electrolyzers, power control, cost reduction
false
Risk Assessment and Management
Energy & Utilities
Multiple Chart
Kearney
Add to my slides
Remove from favorites
The slide includes a column chart depicting the estimated levelized cost of hydrogen (LCOH) per production technology, with data points for Brown, Blue, Green hydrogen, and an average line. It shows costs in $ per kg for various technologies like SMR, Coal Gasification, and Alkaline Electrolysis.
Financial Performance
Energy & Utilities
The slide compares the estimated LCOH for different hydrogen production technologies, highlighting the cost differences between brown, blue, and green hydrogen sources. It provides a financial analysis of hydrogen production costs.
LCOH, Hydrogen, Cost, Production, Technology
false
Financial Performance
Energy & Utilities
Single Chart
Kearney
Add to my slides
Remove from favorites
The slide features two graphs: one showing electricity spot prices over time and another depicting LCOH per load factor, highlighting optimal load factor ranges.
Market Analysis and Trends
Energy & Utilities
The slide analyzes the relationship between load factors and LCOH, noting that optimal LCOH is achieved between 70-90% load factors, with limited impact from spot prices.
LCOH, load factors, electricity spot price, utilization rate, cost analysis
false
Market Analysis and Trends
Energy & Utilities
Multiple Chart
Kearney
Add to my slides
Remove from favorites
This slide includes a line graph showing LCOH as a function of electricity price, along with a column chart comparing LCOH breakdown at different electricity prices.
Market Analysis and Trends
Energy & Utilities
The slide emphasizes the importance of securing favorable power purchase agreements (PPA) to reduce LCOH, demonstrated by the graphs.
LCOH, power price, PPA, electricity costs, market trends
false
Market Analysis and Trends
Energy & Utilities
Multiple Chart
Kearney
Add to my slides
Remove from favorites
The slide features a column chart showing the breakdown of LCOH for the SMR example, including segments for Capex, startup costs, fuel, water, catalysts, labor and overhead, maintenance, insurance, and electricity selling. Each segment's percentage of total LCOH is displayed.
Financial Performance
Energy & Utilities
This slide provides a detailed breakdown of the LCOH for SMR, illustrating the contributions of various cost factors like Capex, fuel, and maintenance to the overall cost. It offers a financial analysis of hydrogen production using SMR.
LCOH, SMR, Cost Breakdown, Hydrogen, Financial Analysis
false
Financial Performance
Energy & Utilities
Single Chart
Kearney
Add to my slides
Remove from favorites
This slide includes two line graphs showing the transmission and distribution LCOH for different hydrogen carriers over various distances.
Market Analysis and Trends
Energy & Utilities
The slide analyzes how transportation costs vary based on hydrogen form, carrier, and distance traveled, with data visualized in the line graphs.
LCOH, transportation costs, hydrogen carriers, distance, cost analysis
false
Market Analysis and Trends
Energy & Utilities
Multiple Chart
Kearney
Add to my slides
Remove from favorites
The slide features a scatter plot comparing levelized cost of mobility (LCOM) and range for various car models, including FCEV and BEV.
Financial Performance
Energy & Utilities
The slide highlights the comparison of hydrogen cars and battery electric vehicles in terms of range and levelized cost of mobility, noting the higher TCO for mid-end BEVs.
LCOM, FCEV, BEV, range, TCO, comparison
false
Financial Performance
Energy & Utilities
Single Chart
Kearney
Add to my slides
Remove from favorites
The slide includes column charts comparing the levelized cost of mobility per passenger for ICE buses, fuel cell buses, and BEV buses in 2030 under different scenarios.
Market Analysis and Trends
Energy & Utilities
The slide discusses the potential competitiveness of fuel cell electric buses compared to battery electric and internal combustion engine buses, highlighting cost projections and trends.
LCOM, FCEV buses, BEV, ICE, competitiveness
false
Market Analysis and Trends
Energy & Utilities
Mixed Chart
Kearney
Add to my slides
Remove from favorites
The slide includes column charts comparing the levelized cost of mobility per passenger for ICE buses, fuel cell buses, and BEV buses under different scenarios.
Operational Efficiency
Energy & Utilities
The slide compares the levelized cost of mobility per passenger for internal combustion engine buses, fuel cell buses, and battery electric buses, noting the higher cost for H2 buses.
LCOM, H2 buses, BEV, cost, passenger
false
Operational Efficiency
Energy & Utilities
Mixed Chart
Kearney
Add to my slides
Remove from favorites
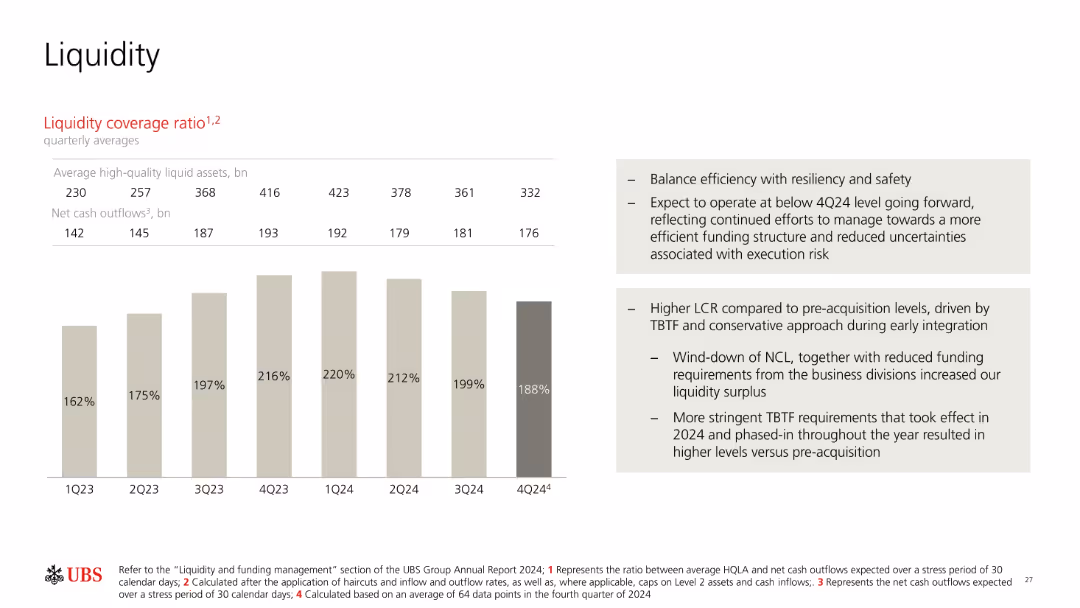
Bar chart showing liquidity coverage ratio (LCR) over 8 quarters; includes two text blocks explaining context and future expectations. Neutral color palette.
Risk Assessment and Management
Financial Services
Tracks UBS’s LCR over time from 1Q23 to 4Q24, noting shifts in liquid assets and net cash outflows. Provides interpretation regarding resilience, funding structure optimization, and higher post-acquisition LCRs due to regulatory requirements and risk management priorities.
LCR, liquidity, cash outflows, risk, funding structure, resilience
false
Risk Assessment and Management
Financial Services
Mixed Chart
UBS
Add to my slides
Remove from favorites
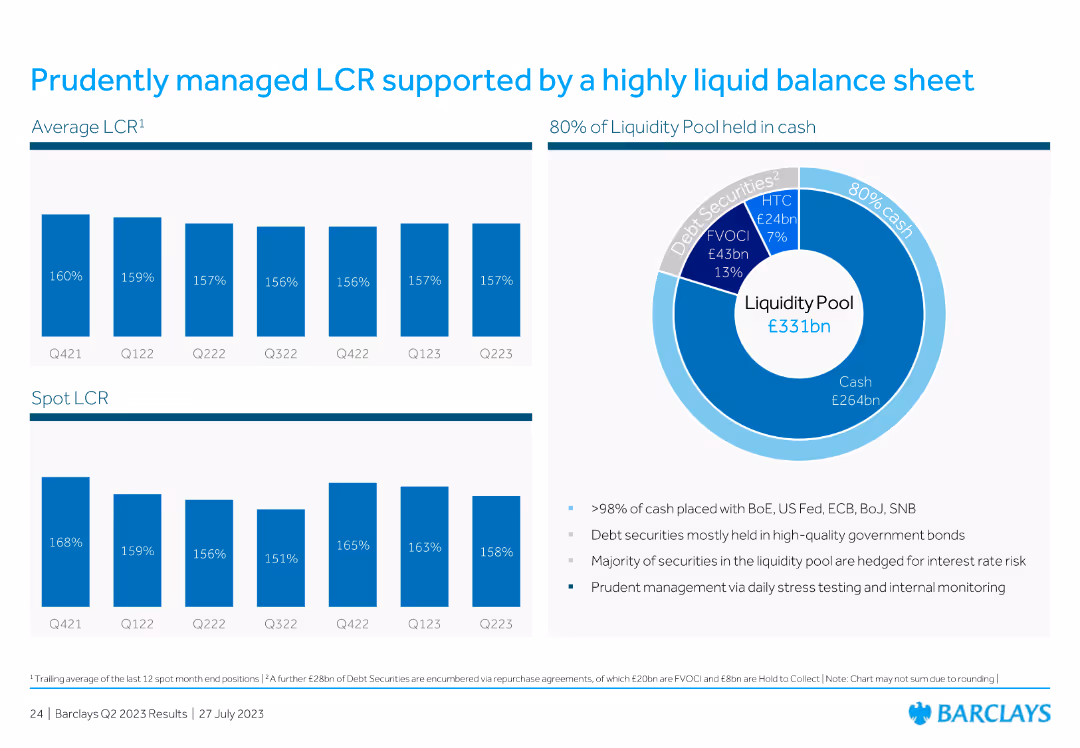
Includes bar charts and a pie chart showing liquidity coverage ratio (LCR) and the composition of the liquidity pool.
Financial Performance
Financial Services
Discusses prudent management of LCR with a highly liquid balance sheet, detailing the liquidity pool composition.
LCR, liquidity, management, balance sheet, pool
false
Financial Performance
Financial Services
Multiple Chart
Barclays
Add to my slides
Remove from favorites
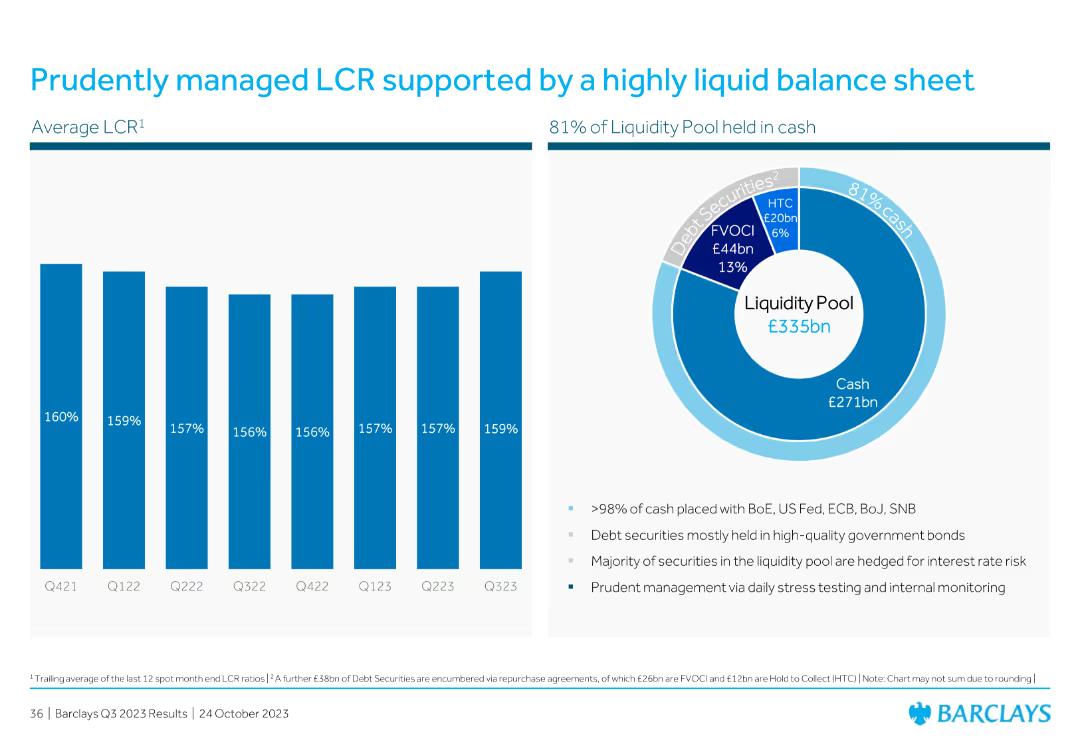
Left side features a bar chart showing quarterly average LCR ratios. Right side includes a pie chart breaking down the liquidity pool composition.
Risk Assessment and Management
Financial Services
Discusses Barclays' liquidity coverage ratio (LCR) management and the composition of its liquidity pool, highlighting prudent financial management practices.
LCR, liquidity, management, financial, Barclays, balance sheet, quarterly, ratio, pool
false
Risk Assessment and Management
Financial Services
Multiple Chart
Barclays
Add to my slides
Remove from favorites
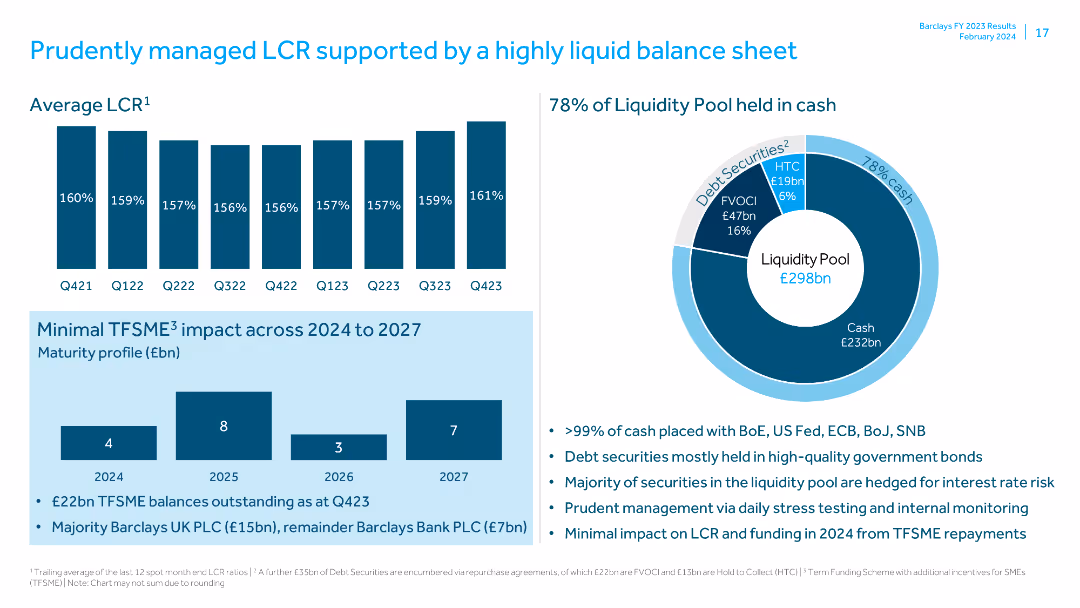
Features bar charts for average LCR over quarters and a pie chart showing the composition of the liquidity pool. Also includes text on TFSME impact.
Risk Assessment and Management
Financial Services
Discusses the management of Liquidity Coverage Ratio (LCR) and the composition of the liquidity pool, along with the impact of TFS balances over 2024-2027.
LCR, liquidity pool, TFSME, risk management, balance sheet, cash holdings, government bonds, stress testing, interest rate risk, FX
false
Risk Assessment and Management
Financial Services
Multiple Chart
Barclays
Add to my slides
Remove from favorites
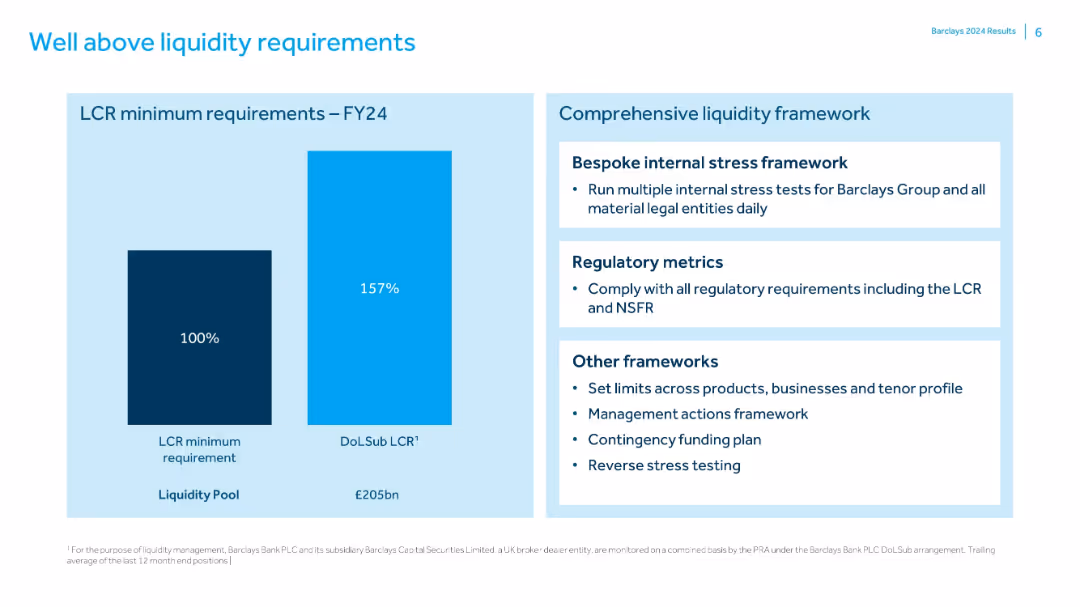
Bar chart comparing LCR requirement to Barclays’ actual liquidity coverage ratio; text box outlines liquidity frameworks and practices.
Regulatory and Compliance
Financial Services
Demonstrates that Barclays maintains a 157% LCR, significantly above the 100% minimum. Accompanied by a breakdown of liquidity management practices including stress testing, regulatory compliance, and contingency planning.
LCR, liquidity, stress testing, Barclays, compliance, NSFR, funding
false
Regulatory and Compliance
Financial Services
Mixed Chart
Barclays
Add to my slides
Remove from favorites
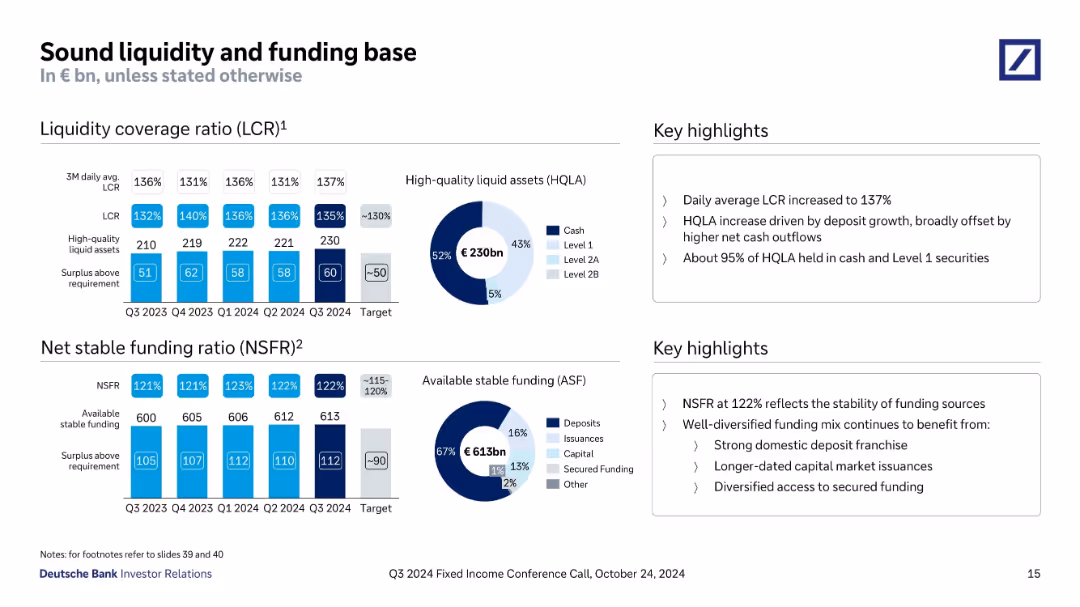
Dual sections with bar and donut charts showing liquidity coverage ratio (LCR), net stable funding ratio (NSFR), and breakdown of funding sources.
Risk Assessment and Management
Financial Services
The slide demonstrates robust liquidity and funding through LCR of 137% and NSFR of 122% in Q3 2024, supported by €230bn in HQLA and €613bn available stable funding. The bank emphasizes stability and diversified funding, with key metrics exceeding regulatory targets.
LCR, NSFR, liquidity, funding, HQLA, ASF, Deutsche Bank, Q3 2024, stability
false
Risk Assessment and Management
Financial Services
Multiple Chart
Deutsche Bank
Add to my slides
Remove from favorites
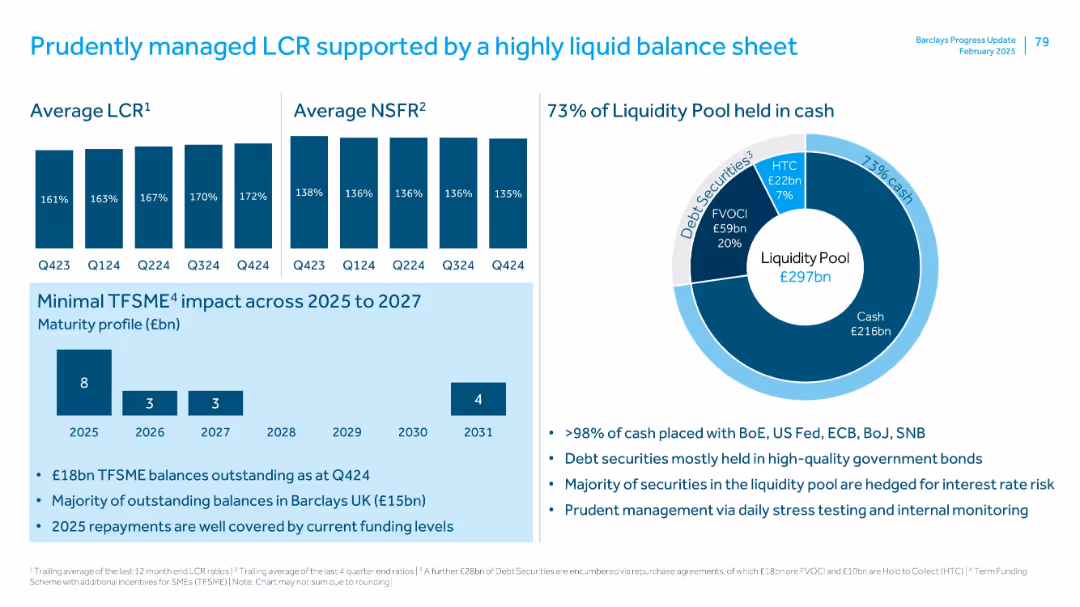
Left section contains LCR/NSFR bar charts. Right section includes a donut chart on liquidity pool composition. Bottom segment outlines TFSME maturity.
Risk Assessment and Management
Financial Services
Emphasizes strong liquidity ratios (LCR and NSFR) and £297bn liquidity pool, 73% in cash. Details maturity profile of TFSME, indicating low near-term refinancing risk. Highlights prudent portfolio and interest rate hedging strategy.
LCR, NSFR, liquidity pool, cash, debt securities, TFSME, stress testing
false
Risk Assessment and Management
Financial Services
Multiple Chart
Barclays
Add to my slides
Remove from favorites
Split into four sections: two bar charts (LCR and NSFR), one pie chart (liquidity pool), and one maturity profile bar chart with bullet points below. Uses consistent blue branding and typography.
Financial Performance
Financial Services
Highlights Barclays’ liquidity coverage and funding stability in Q1 2025, including strong LCR and NSFR ratios, liquidity pool composition (74% in cash), and low TFSME refinancing risk through 2027. Emphasizes prudent liquidity management and high-quality asset backing.
LCR, NSFR, liquidity pool, TFSME, funding profile, Q1 2025, Barclays, cash reserves, financial stability
false
Financial Performance
Financial Services
Multiple Chart
Barclays
Add to my slides
Remove from favorites
Column chart comparing the levelized cost of energy for large-scale LDES technologies, showing costs with and without subsidies for electrochemical, mechanical, and thermal systems.
Financial Performance
Energy & Utilities
The slide compares the costs of various long-duration energy storage technologies, highlighting differences in costs under subsidized and unsubsidized conditions.
LDES, Cost analysis, Energy storage, Subsidies, Technology comparison
false
Financial Performance
Energy & Utilities
Single Chart
Roland Berger
Add to my slides
Remove from favorites
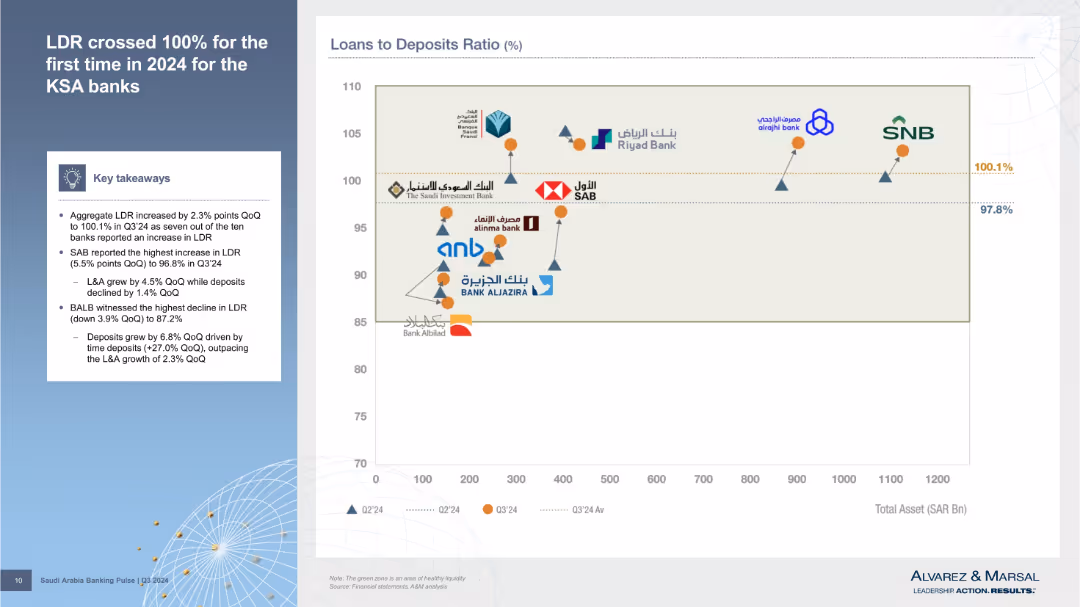
Left column outlines findings; right is a scatter plot comparing total assets vs. loan-to-deposit ratio for banks, with performance markers.
Risk Assessment and Management
Financial Services
Details Q3’24 increase in Loan-to-Deposit Ratio (LDR), crossing 100%. Visual comparison of banks’ asset sizes and LDR positions shows liquidity strength or risk exposure.
LDR, liquidity risk, total assets, Q3’24, KSA banks, deposit ratio, financial stress, risk indicators, balance sheet
false
Risk Assessment and Management
Financial Services
Mixed Chart
Alvarez & Marsal
Add to my slides
Remove from favorites
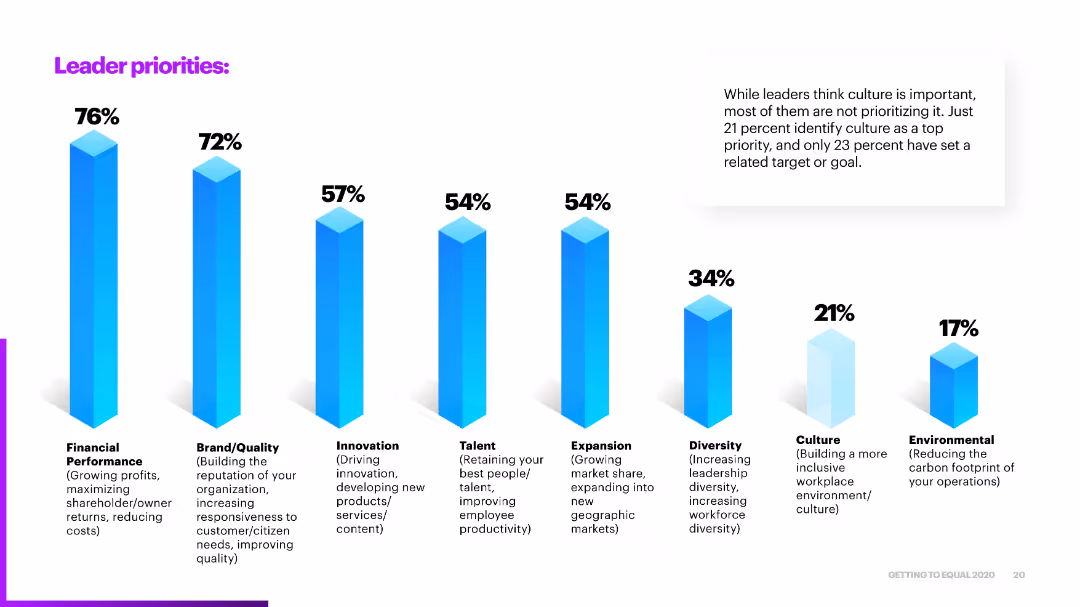
The slide features a series of vertical bars indicating various leader priorities such as financial performance, brand quality, innovation, and diversity, with percentages showing their importance.
Strategic Planning
Professional Services
It discusses the top priorities for leaders, with a focus on financial performance, brand, innovation, and diversity, indicating a lack of prioritization for culture.
leader priorities, financial performance, brand, innovation, diversity
false
Strategic Planning
Professional Services
Single Chart
Accenture
Add to my slides
Remove from favorites
This slide is moderate in visual complexity, including benefits and risks icons, and focused bullet points to summarize points for leaders to consider when engaging with bioengineering trends.
Regulatory and Compliance
Professional Services
Aims to guide leadership in considering the benefits and risks of bioengineering, emphasizing ethical and regulatory aspects.
leadership, bioengineering, benefits, risks, ethics, regulation, healthcare, environmental impact, sustainability, innovation
false
Regulatory and Compliance
Professional Services
Boxed
McKinsey
Add to my slides
Remove from favorites
Bar graphs and statistics, blue theme with white text, section titled and numbered in the corner.
Strategic Planning
Healthcare & Pharmaceuticals
Outlines the impact of bioengineering on business and society, with statistical evidence.
Leadership, Bioengineering, Business Impact, Statistics
false
Strategic Planning
Healthcare & Pharmaceuticals
Header Horizontal
McKinsey
Add to my slides
Remove from favorites
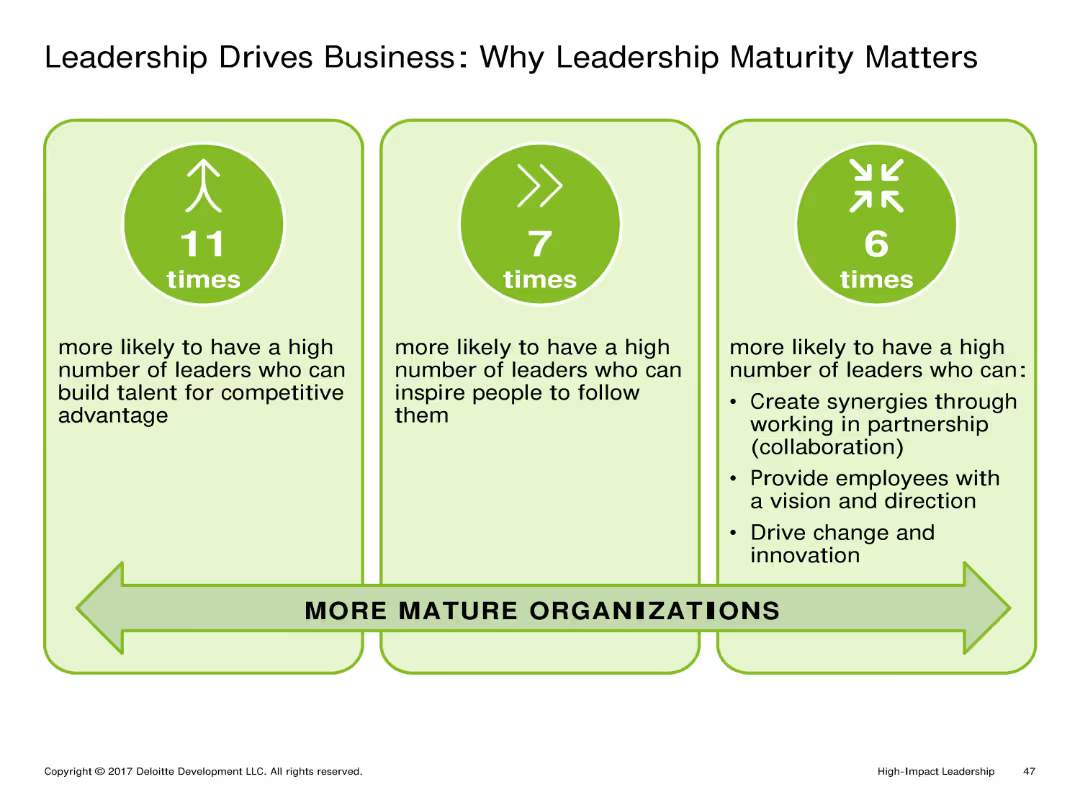
This slide includes three vertical columns with icons and text explaining the importance of leadership maturity. Each column is dedicated to a different aspect: building talent, inspiring followers, and driving innovation.
Market Analysis and Trends
Professional Services
The slide emphasizes the significant impact of leadership maturity on business success. It highlights how mature leaders are more likely to build competitive talent, inspire their teams, and drive innovation within their organizations.
Leadership, Business Success, Talent, Inspiration, Innovation
false
Market Analysis and Trends
Professional Services
Pillar
Deloitte
Add to my slides
Remove from favorites
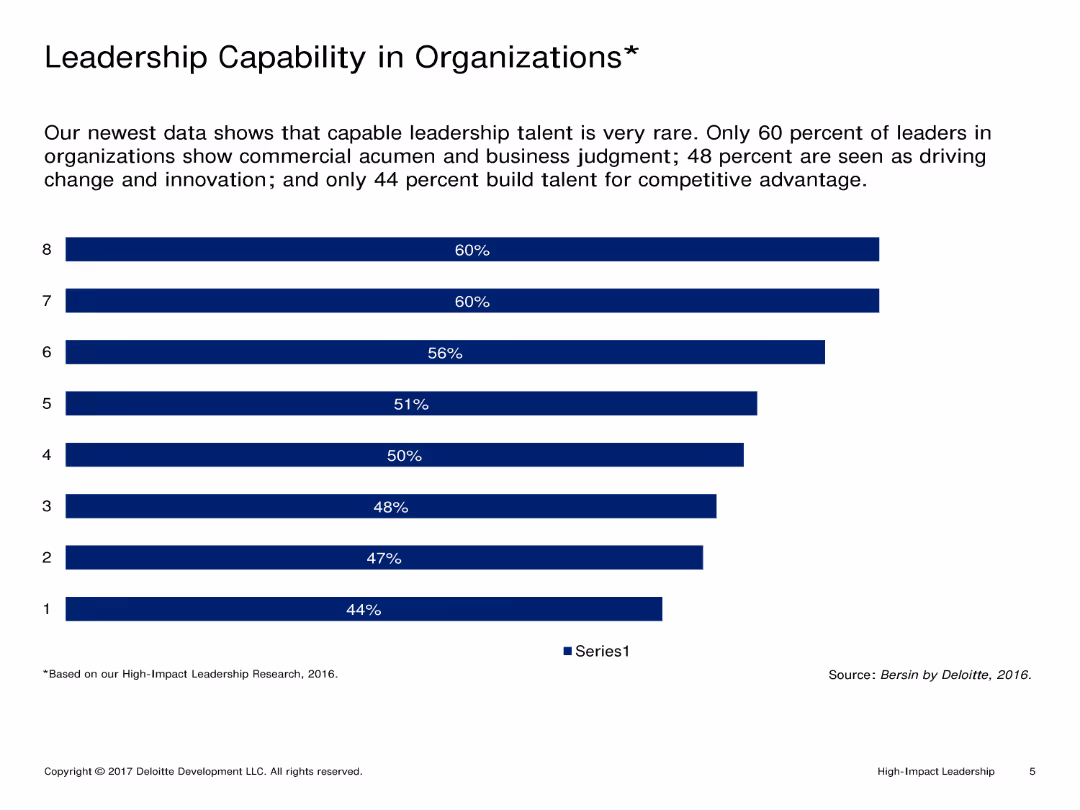
Single-column layout with text at the top and a column chart showing percentages of leadership capabilities below. Text is minimal.
Market Analysis and Trends
Professional Services
Analyzes leadership capabilities in organizations, highlighting areas such as commercial acumen, business judgment, innovation, and competitive advantage.
Leadership, Capability, Organizations, Commercial acumen, Business judgment, Innovation, Competitive advantage
false
Market Analysis and Trends
Professional Services
Single Chart
Deloitte
Add to my slides
Remove from favorites
Text slide with photos of leadership team members, their roles, and descriptions of the benefits of risk-aligned, divisional/regional, and centralized teams. Text highlights the refreshed leadership and its focus on strong leadership and talent.
Organizational Structure and Change
Financial Services
Highlights the refreshed leadership and simplified structure of the CCO organization, emphasizing the benefits of risk-aligned teams, stronger seniority, and increased leadership bandwidth. It focuses on organizational change and talent management.
leadership, CCO organization, risk-aligned teams, seniority, organizational change
false
Organizational Structure and Change
Financial Services
Header Horizontal
Credit Suisse
Add to my slides
Remove from favorites
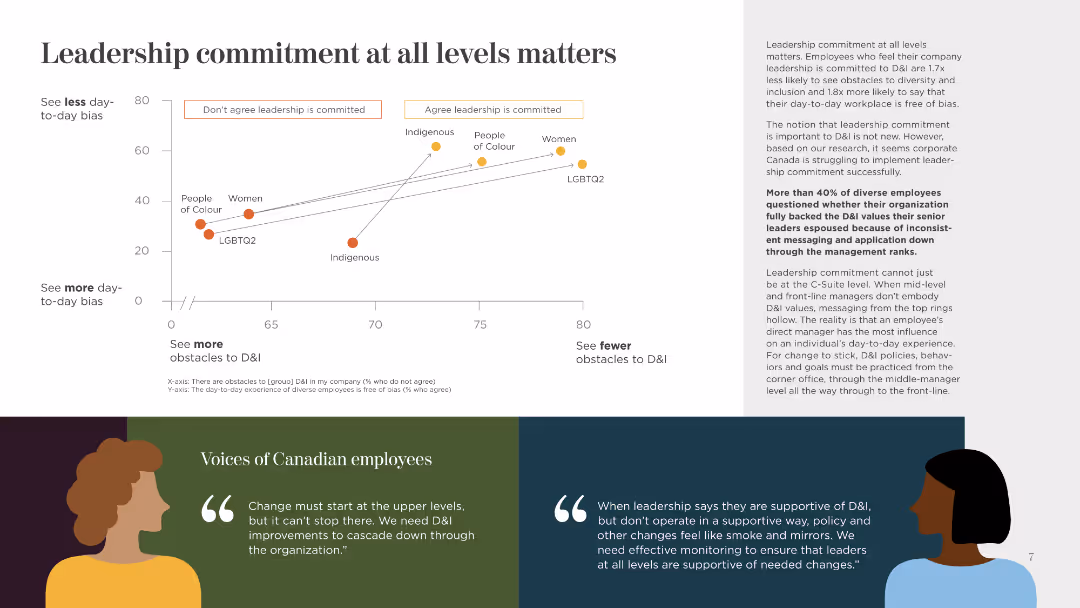
This slide features a scatter plot showing the correlation between perceived leadership commitment and daily bias. It includes quotes and uses distinct color coding for clarity.
Human Resources and Talent Management
Government & Public Sector
The slide discusses the importance of leadership commitment to reducing day-to-day bias and obstacles in diversity and inclusion, supported by employee quotes and a scatter plot analysis.
Leadership, Commitment, Bias, Diversity, Inclusion, Day-to-Day, Employee Quotes, Correlation, Analysis
false
Human Resources and Talent Management
Government & Public Sector
Mixed Chart
BCG
Add to my slides
Remove from favorites
Featuring a balance between text and diagram, this slide focuses on leadership's role in shaping company culture, illustrated with a blue and teal color scheme and icons representing different mechanisms.
Organizational Structure and Change
Professional Services
Discusses the responsibility of leadership in setting and maintaining company culture, outlining formal and informal mechanisms to align vision and culture, pertinent to management strategy discussions.
leadership, company culture, responsibility, alignment, vision, strategy, management, mechanisms, informal, formal
false
Organizational Structure and Change
Professional Services
Diagram
Kearney
Add to my slides
Remove from favorites
Contains bullet points and small icons that correspond to each section, using a clean and professional layout with blue accents to highlight key aspects.
Strategic Planning
Professional Services
Highlights the unique aspects of Alvarez & Marsal's approach to business challenges, including leadership focus, managing complexity, and a practical orientation towards results. The slide is structured to clearly delineate the company's strengths in handling complex business situations.
leadership, complexity management, business solutions, operational heritage
false
Strategic Planning
Professional Services
Header Vertical
Alvarez & Marsal
Add to my slides
Remove from favorites
Slide with three sections containing bullet points, each detailing a different aspect of digital trust challenges.
Technology and Digital Transformation
Professional Services
Discusses the considerations leaders should have regarding zero-trust architecture, digital identity, and overarching risks.
leadership considerations, zero-trust, digital identity, AI, privacy engineering, technology risks
false
Technology and Digital Transformation
Professional Services
Boxed
McKinsey
Add to my slides
Remove from favorites
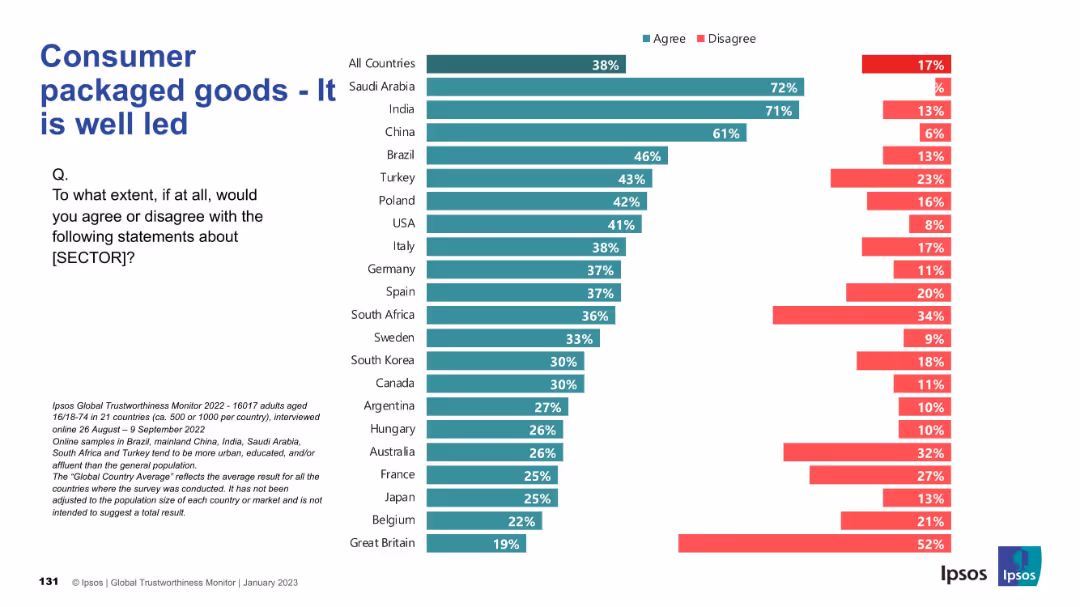
Horizontal bar chart comparing leadership perceptions in the consumer goods sector across countries; consistent Ipsos chart style.
Product and Service Analysis
Consumer Goods
This slide analyzes how well-led consumer packaged goods companies are perceived to be. Trust is highest in Saudi Arabia, India, and China, while European and Western countries show lower confidence in industry leadership.
leadership, corporate governance, trust, consumer sector, international analysis
false
Product and Service Analysis
Consumer Goods
Mixed Chart
IPSOS
Add to my slides
Remove from favorites
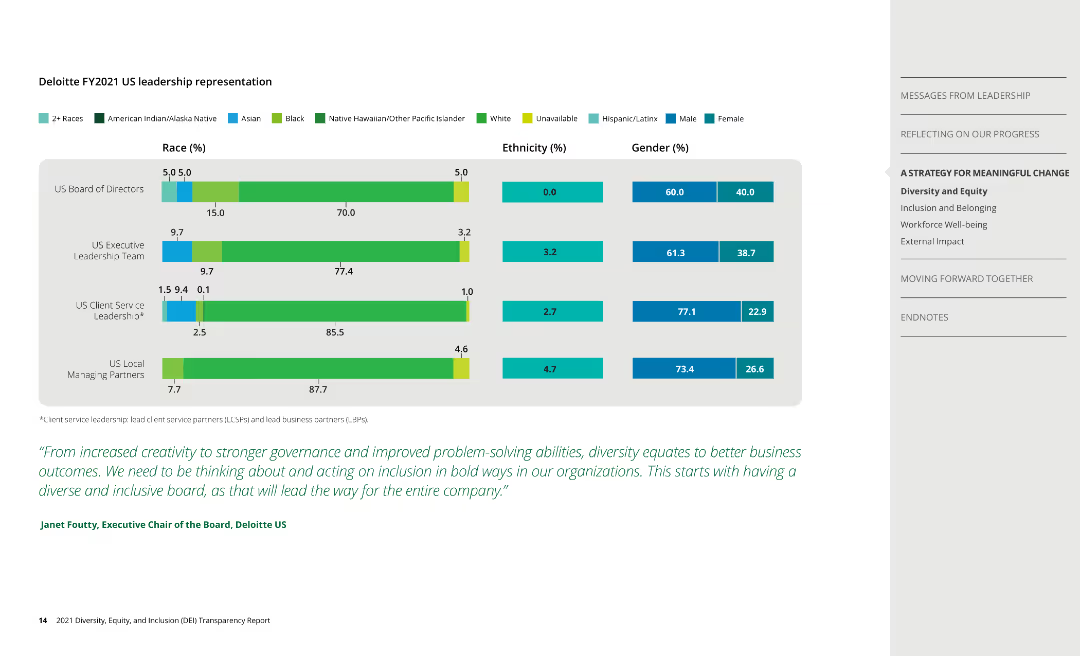
Column charts show representation by race, ethnicity, and gender within Deloitte's leadership teams.
Human Resources and Talent Management
Professional Services
Analyzes diversity in leadership positions, emphasizing the need for improved representation.
leadership, diversity, race, ethnicity, gender
false
Human Resources and Talent Management
Professional Services
Mixed Chart
Deloitte
Add to my slides
Remove from favorites
Standard layout with horizontal bars colored by response; historical % agreement data on the right; title spans two lines due to length.
Strategic Planning
Government & Public Sector
This slide explores the extent to which citizens support strong leadership that challenges elite dominance. The global average is 63% agreement, highlighting support for populist-style governance. Some countries (e.g., Thailand, South Africa) show overwhelming agreement, pointing to deep frustrations with the political status quo.
leadership, elite, governance, reform, trust, populism, survey, Ipsos, inequality
false
Strategic Planning
Government & Public Sector
Mixed Chart
IPSOS
Add to my slides
Remove from favorites
A radar chart comparing various aspects like employee training, customer experience, and data sovereignty between leaders and laggards. The layout is balanced with text on one side and chart on the other.
Strategic Planning
Professional Services
This slide discusses how leaders create value by focusing on areas such as employee training and data sovereignty. The radar chart highlights differences between leaders and laggards.
Leadership, Employee Training, Data Sovereignty, Customer Experience, Innovation
false
Strategic Planning
Professional Services
Mixed Chart
Accenture
Add to my slides
Remove from favorites
The slide contains a column chart and pie charts comparing leadership positions in product rankings across regions, using shades of blue and gray.
Market Analysis and Trends
Financial Services
Showcases a financial institution's leadership status in various product rankings globally, and regionally with improvements over time.
leadership, financial products, global market, regional comparison, rankings
false
Market Analysis and Trends
Financial Services
Multiple Chart
JP Morgan
Add to my slides
Remove from favorites
A text-focused layout with two pie charts demonstrating contract mix and business win rates.
Investment Analysis
Financial Services
The slide showcases the company’s industry leadership with key highlights, financial data, and contract distribution, asserting its position and financial stability to stakeholders.
Leadership, Financial Stability, Contract Distribution, Revenue
false
Investment Analysis
Financial Services
Multiple Chart
Booz Allen Hamilton
Add to my slides
Remove from favorites
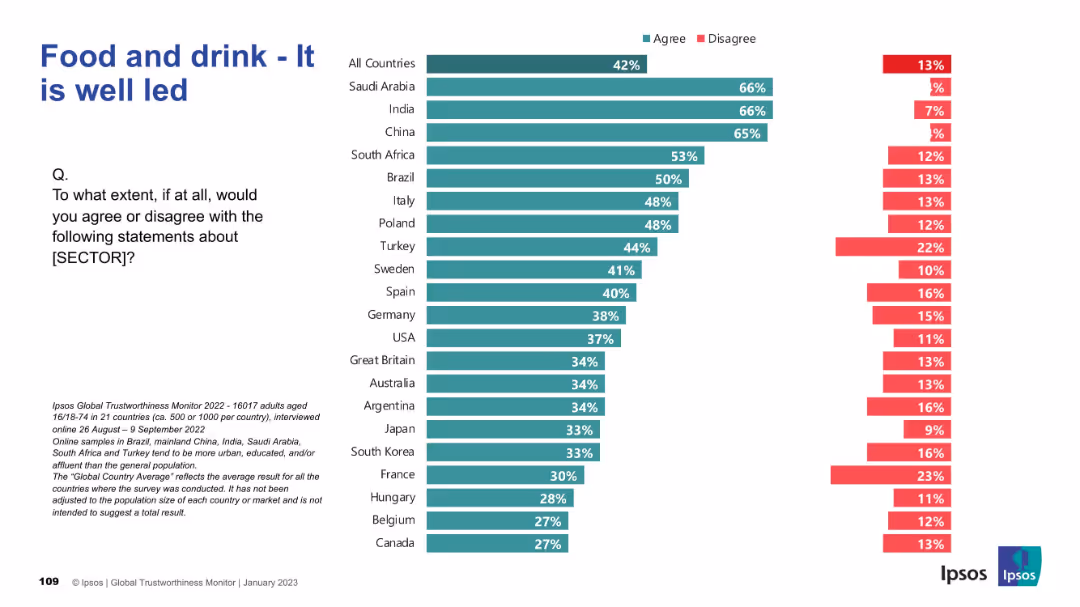
Consistent bar chart format; evaluates perceived leadership quality in the food and drink industry.
Performance Metrics and KPIs
Consumer Goods
Compares countries on how well they believe the food and drink sector is led. Emerging markets again rank highest in confidence, while Western countries show more skepticism. Leadership perception impacts brand and sector trust.
leadership, food industry, public opinion, Ipsos, global trust, consumer goods
false
Performance Metrics and KPIs
Consumer Goods
Mixed Chart
IPSOS
Add to my slides
Remove from favorites
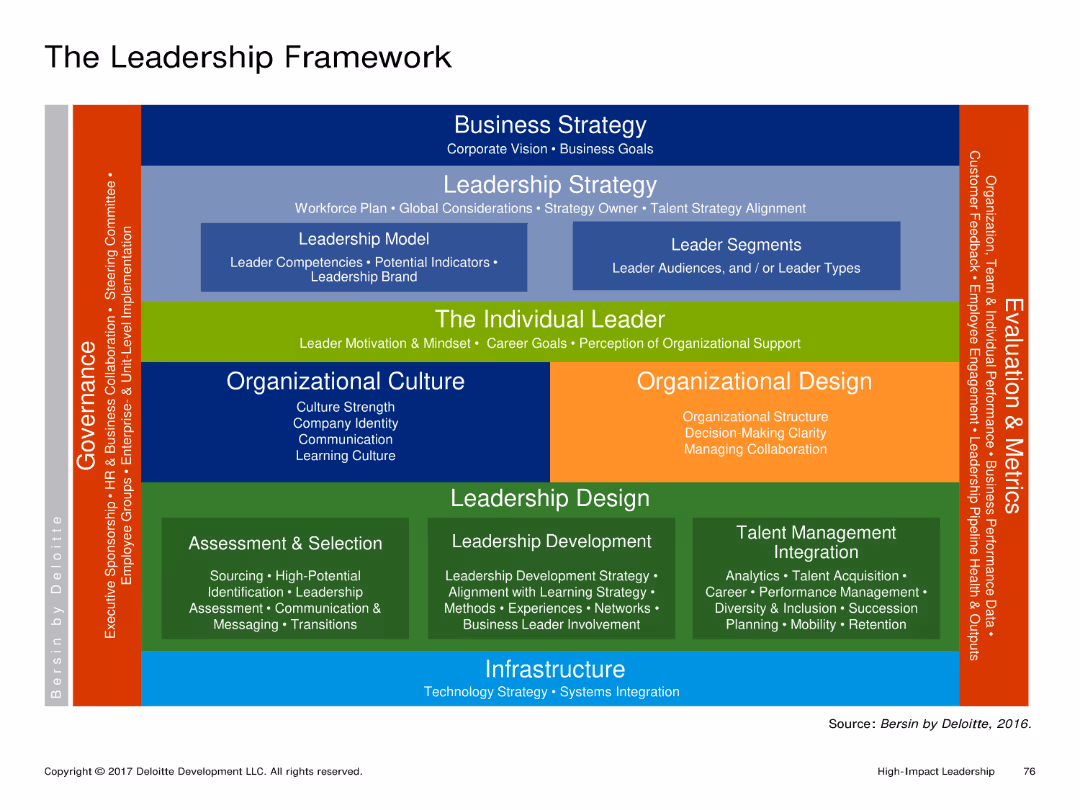
A complex diagram depicting various aspects of leadership including Business Strategy, Leadership Strategy, The Individual Leader, Organizational Culture, and more. The diagram is color-coded and detailed with multiple sections and labels.
Organizational Structure and Change
Professional Services
The slide explains the components of a leadership framework by Deloitte, detailing areas like Business Strategy, Leadership Strategy, and Organizational Culture. It serves as a comprehensive guide for understanding leadership in an organizational context.
Leadership, Framework, Organizational, Strategy, Culture
false
Organizational Structure and Change
Professional Services
Framework
Deloitte
Add to my slides
Remove from favorites
Teal/red bar chart by country on leadership perception. Layout consistent with previous slides: title left, chart right, question included.
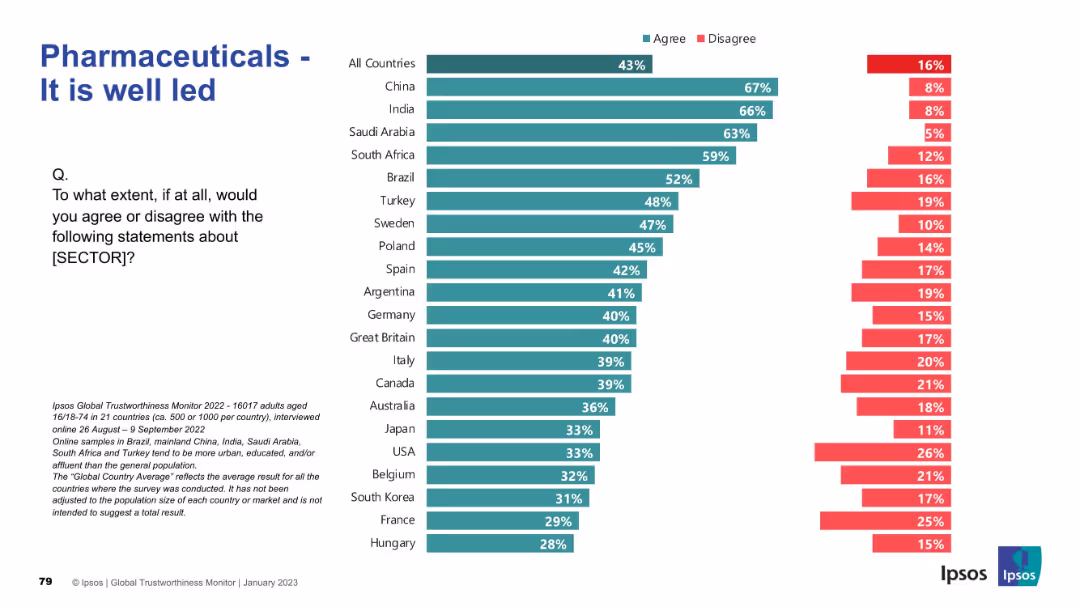
Market Analysis and Trends
Healthcare & Pharmaceuticals
The slide assesses leadership perceptions in the pharmaceutical sector. China, India, and Saudi Arabia lead in agreement about strong leadership, while Japan, Hungary, and France score lowest. Global sentiment is mixed, reflecting trust gaps in governance.
leadership, governance, public trust, survey, Ipsos, pharma sector, healthcare, country comparison, management, global perception
false
Market Analysis and Trends
Healthcare & Pharmaceuticals
Mixed Chart
IPSOS
Add to my slides
Remove from favorites
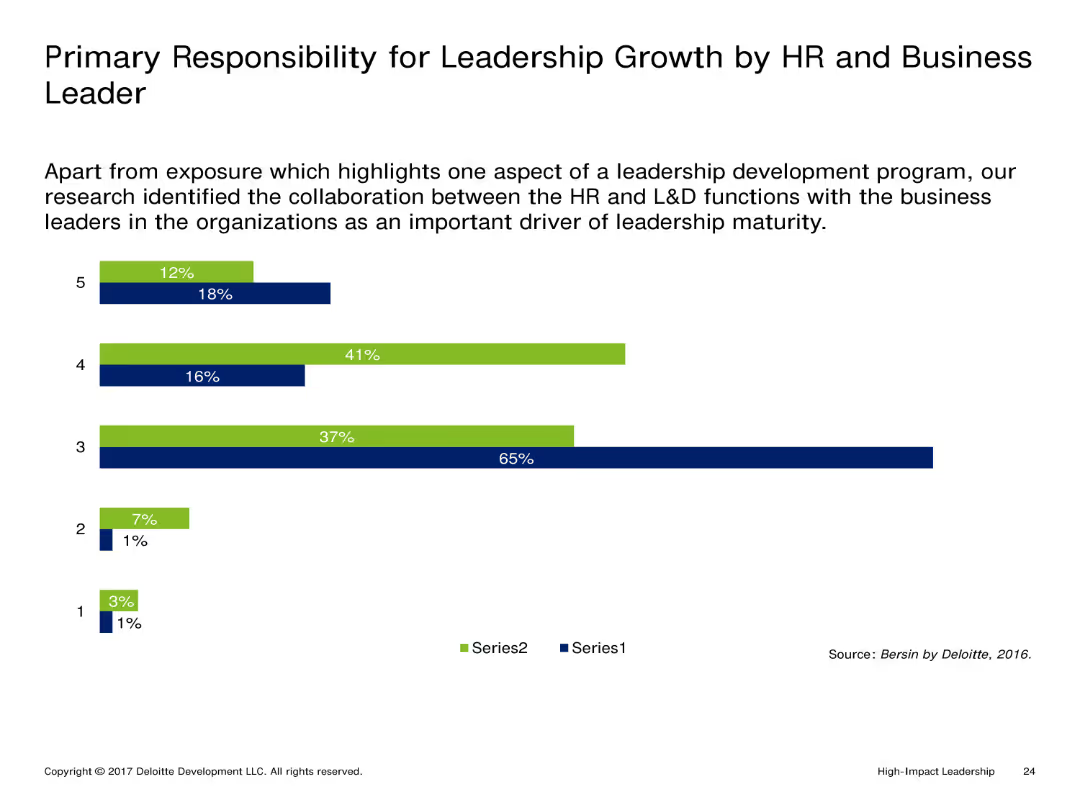
This slide features a vertical column chart with two series of data, each series represented by different colors (blue and green). The columns indicate the percentage responsibility of HR and business leaders in leadership growth.
Market Analysis and Trends
Professional Services
The slide compares the responsibility for leadership growth between HR and business leaders. The chart highlights the significant collaboration between these functions as a crucial factor for leadership maturity.
Leadership, Growth, HR, Business Leaders, Collaboration
false
Market Analysis and Trends
Professional Services
Single Chart
Deloitte
Add to my slides
Remove from favorites
Three-panel design illustrating phases of stabilization, sustainable growth, and future leadership aspirations with icons.
Strategic Planning
Financial Services
This slide outlines the bank's strategic roadmap post-2019, focusing on past achievements and future goals aimed at establishing industry leadership, highlighting key phases in strategy implementation.
Leadership, Growth, Strategy, Aspirations, Roadmap, Industry, Future
false
Strategic Planning
Financial Services
Linear Flow
Deutsche Bank
Add to my slides
Remove from favorites
The slide features a list of sectors with rank, three bar graphs representing sub-sectors for 2017-19 and 2020-22 averages, and a pie chart indicating a 20% gap in the global IB industry wallet.
Market Analysis and Trends
Financial Services
Demonstrates sector leadership and growth in priority sub-sectors, highlighting opportunities where there are gaps.
Leadership, Growth, Sub-Sectors, Market Share, Wallet, Energy, Fintech, Retail
false
Market Analysis and Trends
Financial Services
Multiple Chart
JP Morgan
Add to my slides
Remove from favorites
Complex line chart tracking U.S. leadership behaviors in I&D across various strategic levels, with color differentiation for regional and demographic distinctions.
Strategic Planning
Professional Services
Highlights critical views of U.S. leadership in I&D practices, showing lower favorable assessments compared to global standards.
leadership, I&D, U.S., line chart, assessment, strategic levels, unfavorable comparisons, global standards
false
Strategic Planning
Professional Services
Mixed Chart
Accenture
Add to my slides
Remove from favorites
Slide displays icons next to headers summarizing behaviors promoting innovation like 'Believe & Value', 'Frame & Champion', and more, each accompanied by descriptions.
Human Resources and Talent Management
Professional Services
Describes leadership behaviors that foster an innovation-friendly environment, focusing on empowerment, symbolic actions, and the promotion of innovation as a core value.
leadership, innovation, behaviors, culture, empowerment, symbols, value
false
Human Resources and Talent Management
Professional Services
Table
McKinsey
Add to my slides
Remove from favorites
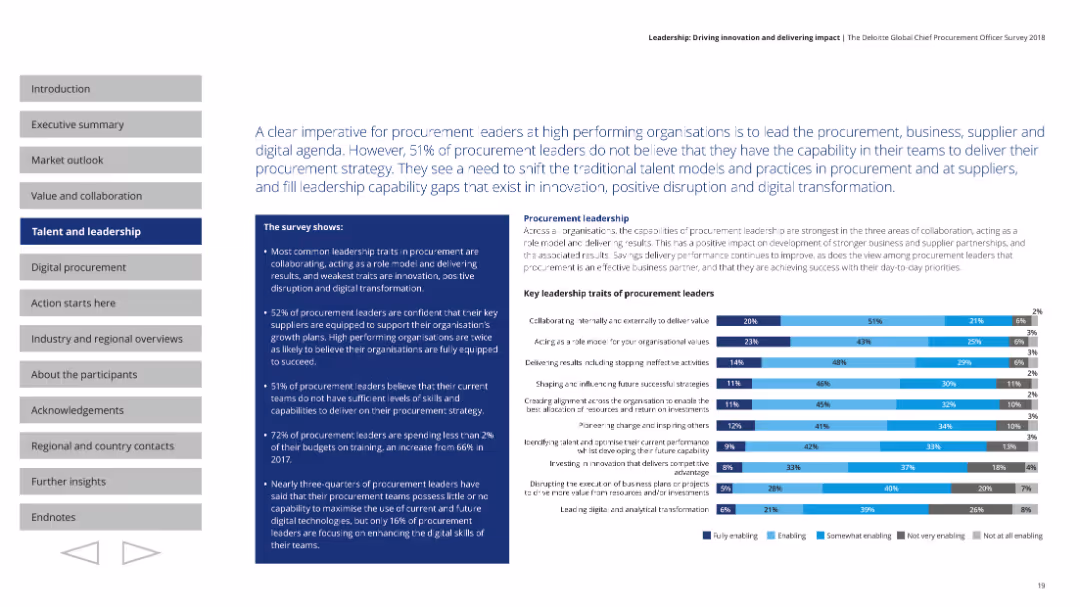
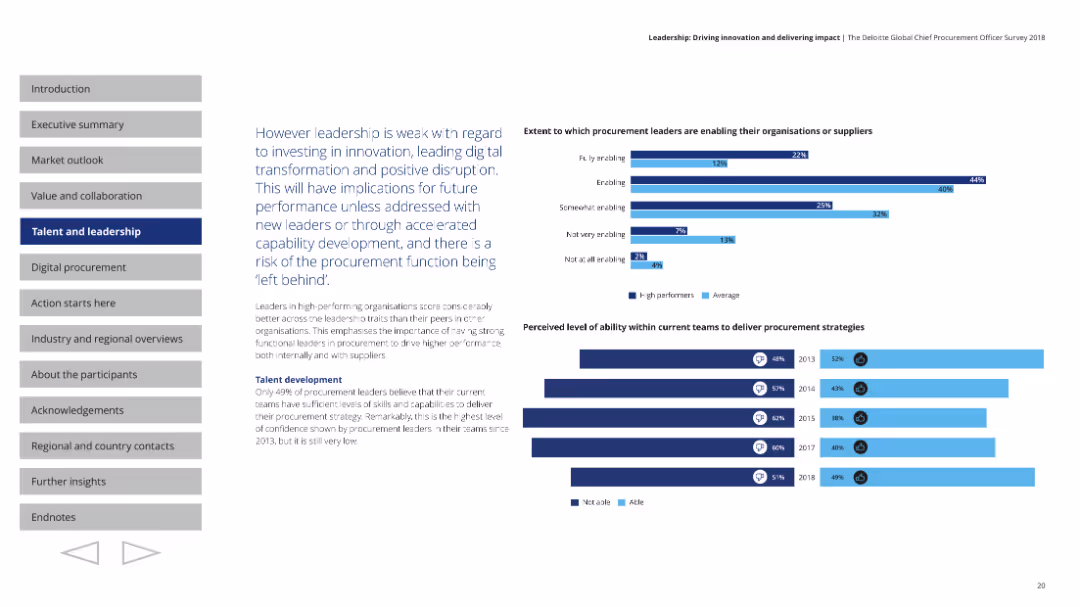
A column chart comparing the extent to which procurement leaders enable their organizations or suppliers. Additional bar charts show the perceived ability of current teams to deliver procurement strategies over the years. Text on the left and data visualizations on the right.
Human Resources and Talent Management
Professional Services
Highlights weaknesses in leadership concerning innovation and digital transformation. Emphasizes the need for capability development and improved leadership to avoid procurement function falling behind. Discusses historical trends in team capabilities.
leadership, innovation, procurement, capability, development
false
Human Resources and Talent Management
Professional Services
Multiple Chart
Deloitte
Add to my slides
Remove from favorites
This slide features bar charts comparing today's critical leadership roles with projections for the next 2-4 years. The design is straightforward with clear labels for easier comprehension.
Human Resources and Talent Management
Professional Services
This slide discusses the evolving roles of leaders in a boundaryless business world, focusing on harnessing disruption, resilience, and engagement across geographies. It shows current and future trends in leadership focus areas, particularly highlighting the increased need for innovation and adaptability in the coming years.
Leadership, Innovation, Resilience, Future, Roles
false
Human Resources and Talent Management
Professional Services
Multiple Chart
Deloitte
Add to my slides
Remove from favorites
This visually complex slide combines pie charts, bar charts, and icons to convey growth and strategic focus areas. It displays a market trend pie chart, a bar chart illustrating segment share over time, and four iconographic sections highlighting strategies. The design includes a blue and yellow color scheme, consistent with the company's branding. There is a mix of large text for headlines and smaller text for details.
Strategic Planning
Transportation & Logistics
The slide demonstrates strategic planning for market leadership in tire segments, focusing on growth and the introduction of a new product. It emphasizes the importance of specific market segments and geographical strategies for the company.
leadership, market segments, growth, strategy, tire, product launch, geographical focus, planning, market trends
false
Strategic Planning
Transportation & Logistics
Multiple Chart
Morgan Stanley
Add to my slides
Remove from favorites
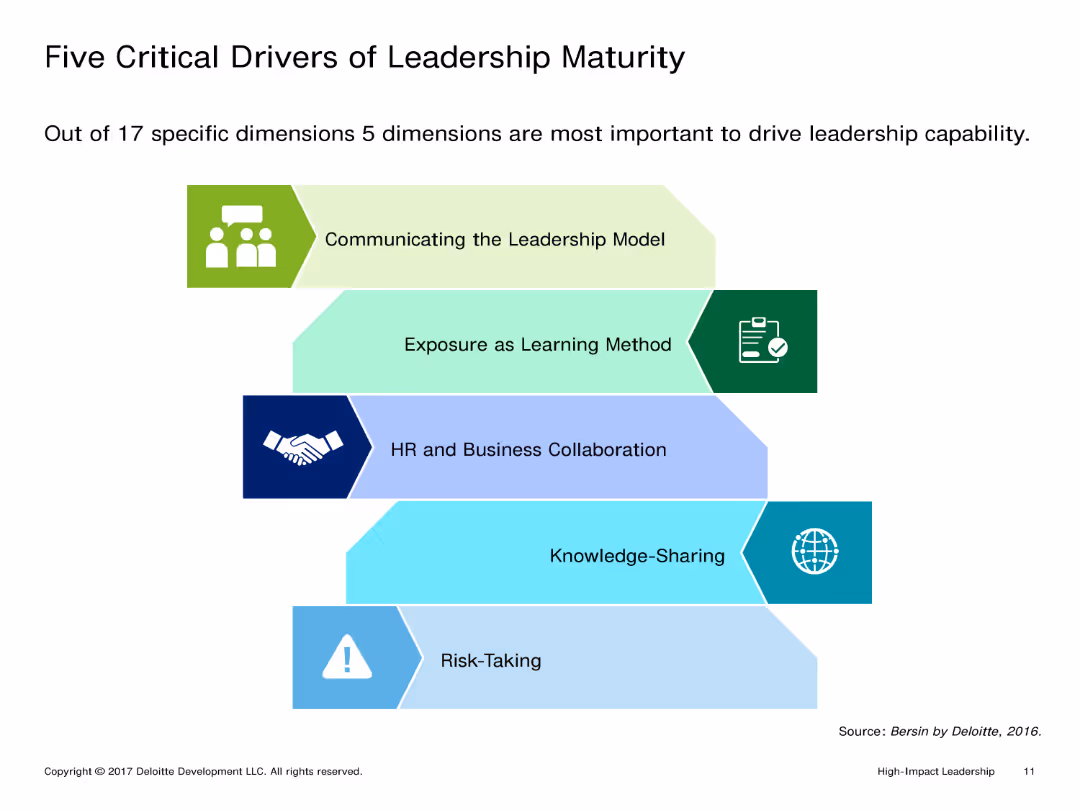
Single-column layout with text at the top and a diagram illustrating five critical drivers of leadership maturity below. Text is concise.
Market Analysis and Trends
Professional Services
Identifies and explains five key dimensions crucial for driving leadership capability: communicating the leadership model, exposure as a learning method, HR collaboration, knowledge-sharing, and risk-taking.
Leadership maturity, Critical drivers, Communication, Learning exposure, HR collaboration, Knowledge-sharing, Risk-taking
false
Market Analysis and Trends
Professional Services
Vertical Flow
Deloitte
Add to my slides
Remove from favorites
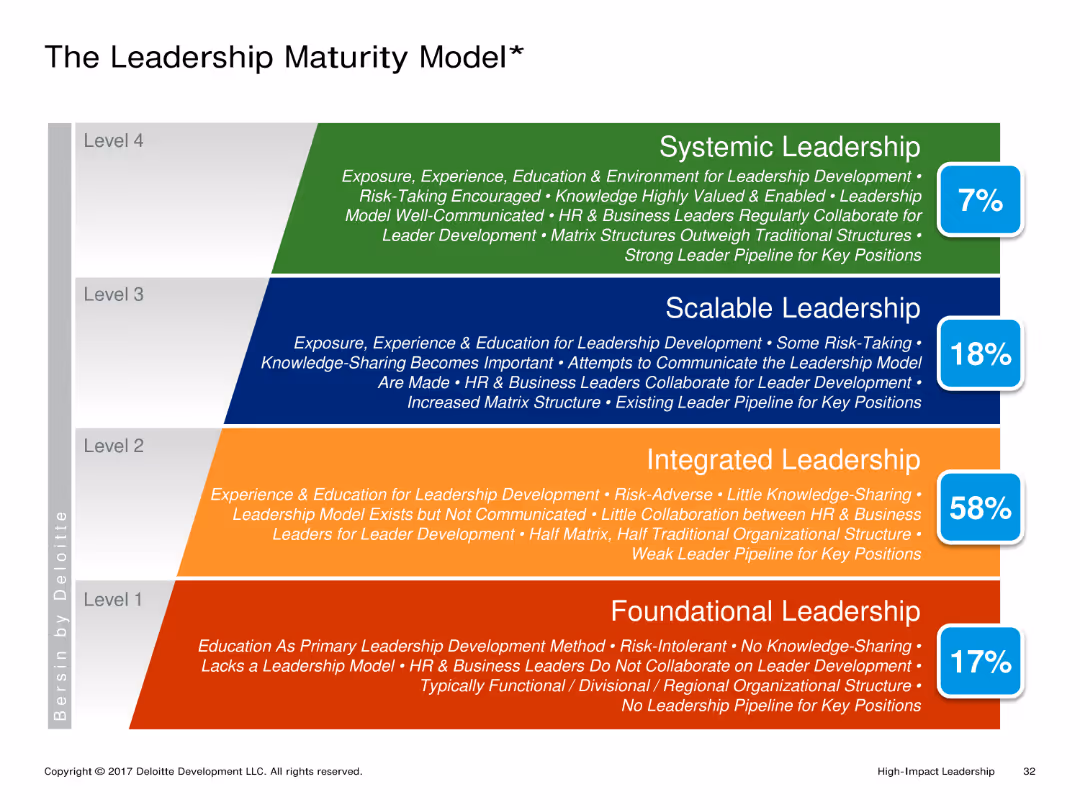
A hierarchical diagram with four levels of leadership maturity: Foundational, Integrated, Scalable, and Systemic Leadership. Each level is described with key characteristics and a percentage indicating prevalence.
Market Analysis and Trends
Professional Services
The slide explains the different levels of leadership maturity, from basic foundational leadership to advanced systemic leadership. It describes the characteristics and prevalence of each level within organizations.
Leadership Maturity, Hierarchical, Foundational, Integrated, Scalable, Systemic
false
Market Analysis and Trends
Professional Services
Framework
Deloitte
Add to my slides
Remove from favorites
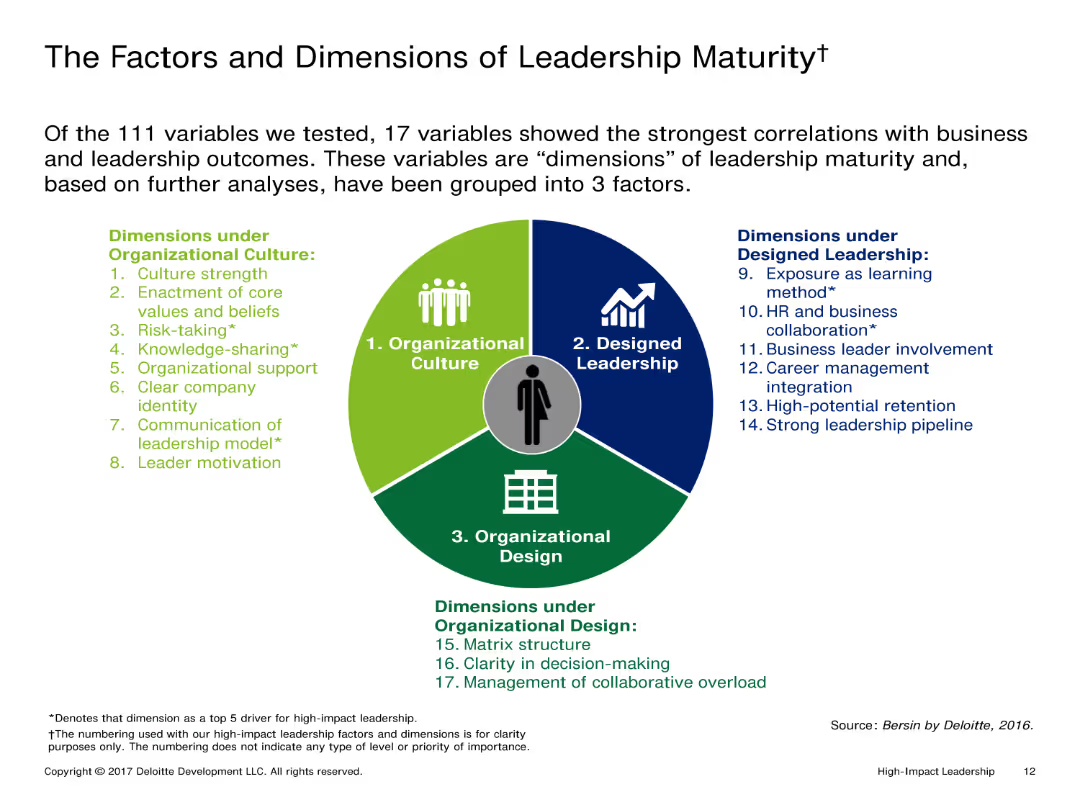
This slide features a circular diagram divided into three segments, each representing different factors of leadership maturity. The diagram is colorful, with icons and text annotations explaining each segment.
Market Analysis and Trends
Professional Services
The slide outlines 17 variables of leadership maturity, grouped into three main factors: Organizational Culture, Designed Leadership, and Organizational Design. It emphasizes the correlation between these variables and leadership outcomes.
Leadership, Maturity, Organizational Culture, Design, Development
false
Market Analysis and Trends
Professional Services
Diagram
Deloitte
Add to my slides
Remove from favorites
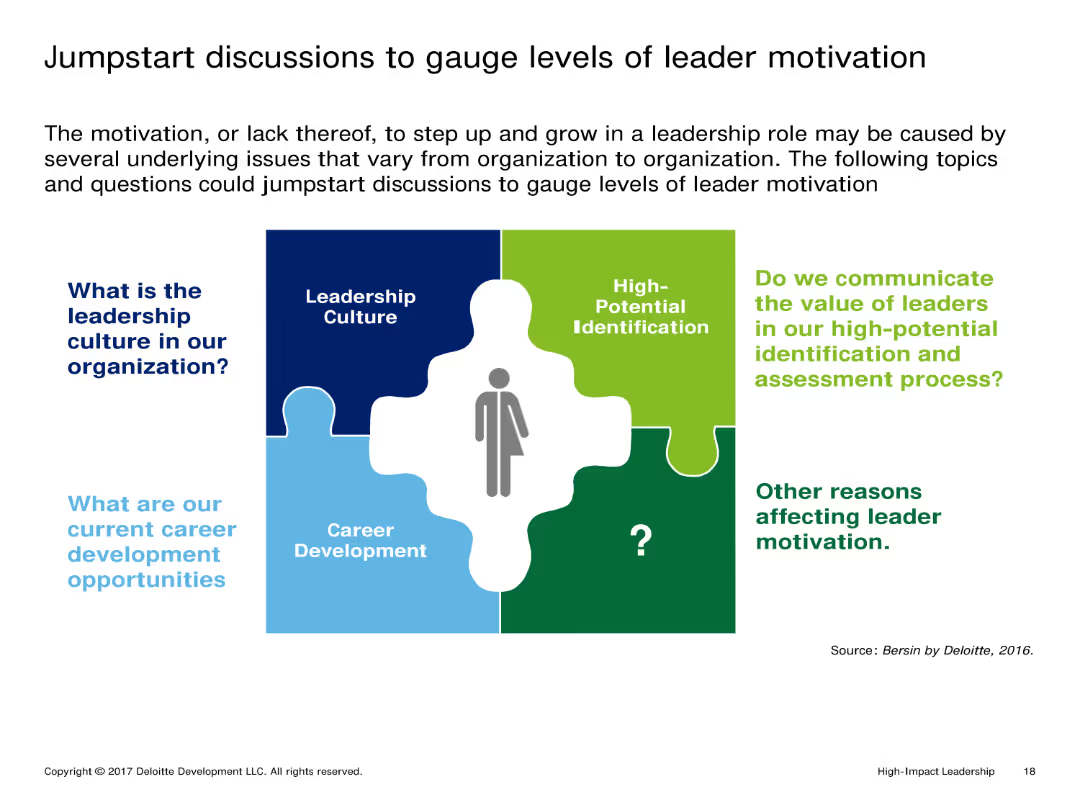
The slide uses a puzzle piece layout, with each piece representing different aspects of leader motivation. There is a mix of text and icons, with a person icon in the center linking the components together.
Market Analysis and Trends
Professional Services
It discusses various factors affecting leader motivation, including leadership culture, career development opportunities, and the value communicated to leaders in high-potential identification and assessment processes.
Leadership, Motivation, Career Development, Culture, Assessment
false
Market Analysis and Trends
Professional Services
Diagram
Deloitte
Add to my slides
Remove from favorites
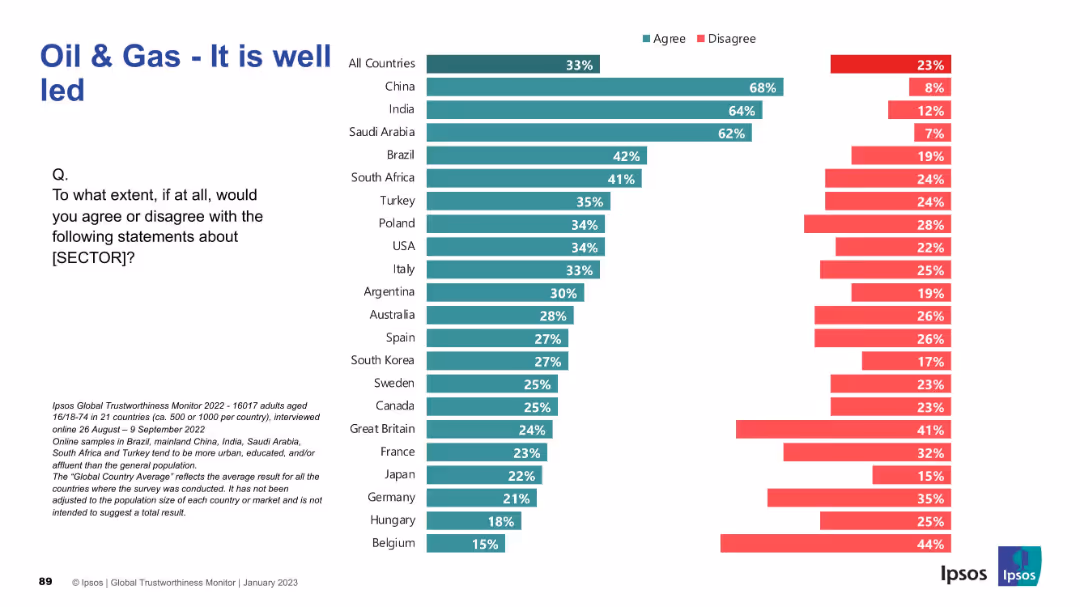
Similar layout with bar chart split by country. Green and red bars for agree/disagree; title on top left; Ipsos source and methodology noted.
Market Analysis and Trends
Energy & Utilities
This slide evaluates perceptions of leadership in the oil & gas sector. Leadership credibility is rated highest in China, India, and Saudi Arabia, while European countries show lower levels of agreement and higher disagreement.
Leadership, Oil & Gas, Ipsos, Trustworthiness, Global Opinion, Energy Sector, Management, Governance, Public Views, Country Trends
false
Market Analysis and Trends
Energy & Utilities
Mixed Chart
IPSOS
Add to my slides
Remove from favorites
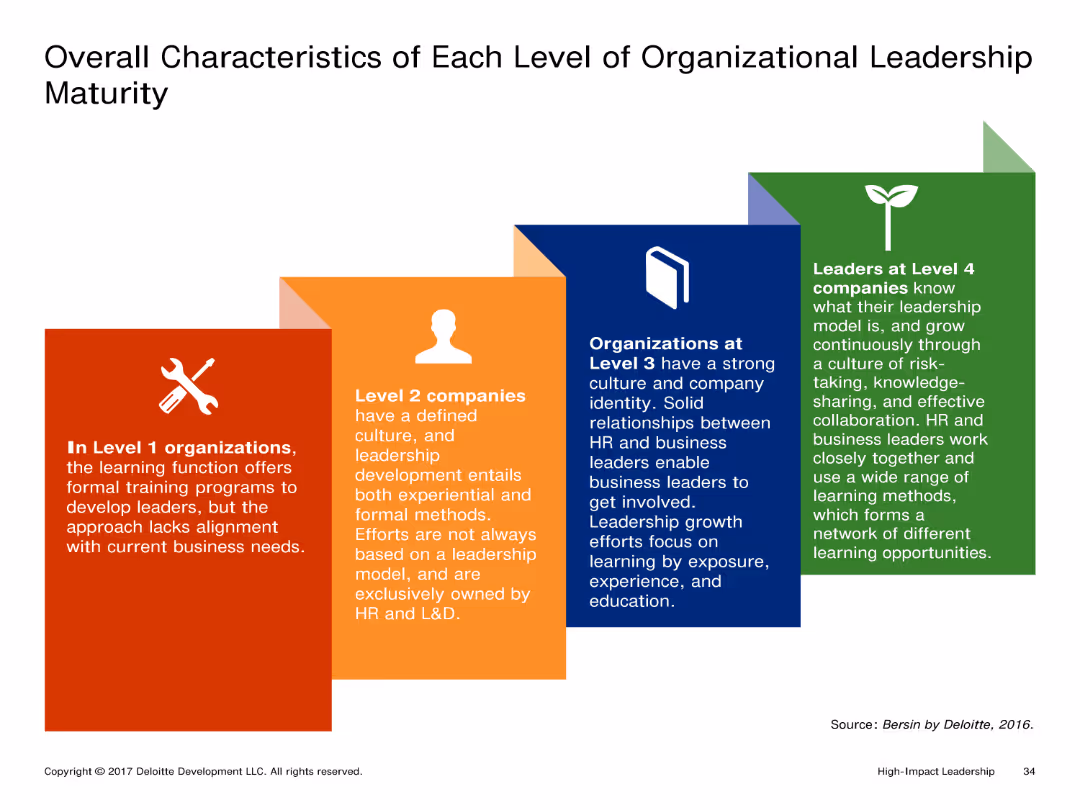
The slide shows a visual representation of different levels of organizational leadership maturity with distinct boxes for each level. Each box contains detailed text describing the characteristics of that level.
Market Analysis and Trends
Professional Services
It outlines the characteristics of organizations at different levels of leadership maturity, from Level 1 to Level 4. Each level's description highlights the leadership development approach and involvement of HR and business leaders.
Leadership, Organizational Maturity, Levels, Characteristics, Development
false
Market Analysis and Trends
Professional Services
Pillar
Deloitte
Add to my slides
Remove from favorites
Horizontal bar chart with country-wise data, agree/disagree percentages; blue and red color scheme.
Market Analysis and Trends
Retail & E-commerce
This slide shows how people across different countries perceive the leadership of the retail sector. India, Saudi Arabia, and China lead in agreement percentages.
leadership, perception, global, Ipsos, survey, retail, trust, countries, comparison, opinions
false
Market Analysis and Trends
Retail & E-commerce
Mixed Chart
IPSOS
Add to my slides
Remove from favorites
Country-level bar chart split between agreement and disagreement; visual structure mirrors previous slides
Human Resources and Talent Management
Financial Services
The slide assesses leadership perceptions in financial services. China, Saudi Arabia, and India again lead in agreement. Western Europe and Latin America score lower, showing regional skepticism about leadership quality.
leadership, perception, trust, financial, Ipsos, countries, agreement, talent, management, governance
false
Human Resources and Talent Management
Financial Services
Mixed Chart
IPSOS
Add to my slides
Remove from favorites
Bar chart and segmented response distribution; standard Ipsos slide format.
Market Analysis and Trends
Government & Public Sector
Explores the belief that a strong leader is needed to reclaim control from the wealthy elite. 63% of respondents agree across 28 countries, with Thailand and South Africa at the top, reflecting a populist sentiment globally.
leadership, populism, strong leader, elite, power distribution, survey
false
Market Analysis and Trends
Government & Public Sector
Mixed Chart
IPSOS
Add to my slides
Remove from favorites
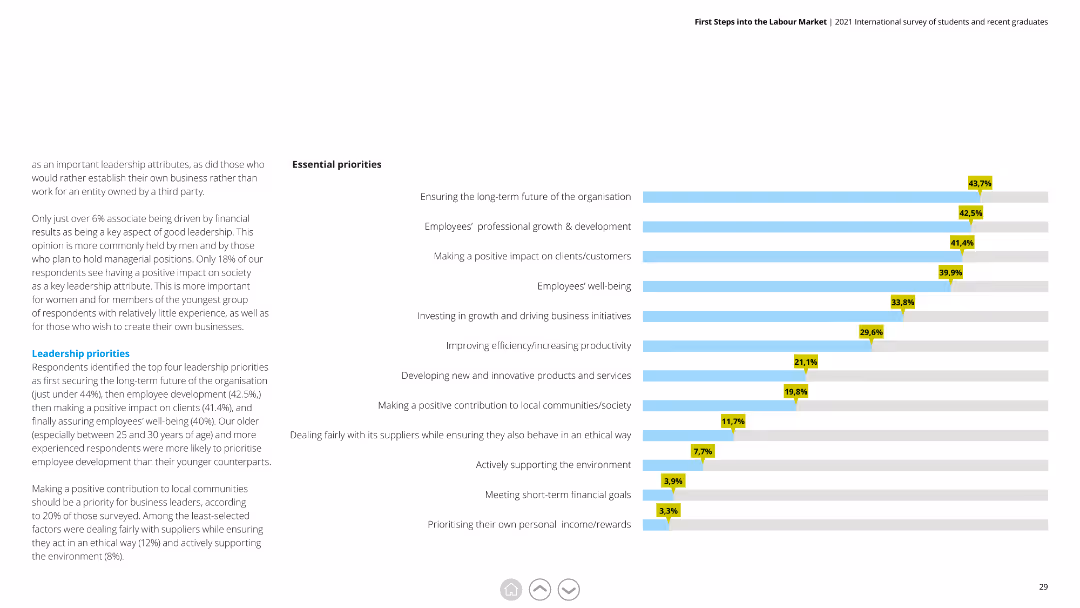
Horizontal bar chart listing leadership priorities with corresponding percentages, with detailed text on the left explaining each priority's importance.
Human Resources and Talent Management
Education & Training
This slide outlines key priorities for leaders, emphasizing long-term organizational goals, employee growth, and positive societal impact.
leadership priorities, organizational goals, employee growth, societal impact, long-term
false
Human Resources and Talent Management
Education & Training
Mixed Chart
Deloitte
Add to my slides
Remove from favorites
A column chart showing key leadership traits of procurement leaders. Text on the left, and multiple bar charts comparing the traits' effectiveness. The layout is structured with emphasis on blue shades for highlighting data.
Human Resources and Talent Management
Professional Services
Discusses the key leadership traits required for procurement leaders, including collaboration and innovation. Highlights survey results showing gaps in current leadership capabilities and the need for improvement to support procurement strategies.
leadership, procurement, talent, capabilities, strategy
false
Human Resources and Talent Management
Professional Services
Mixed Chart
Deloitte
Add to my slides
Remove from favorites
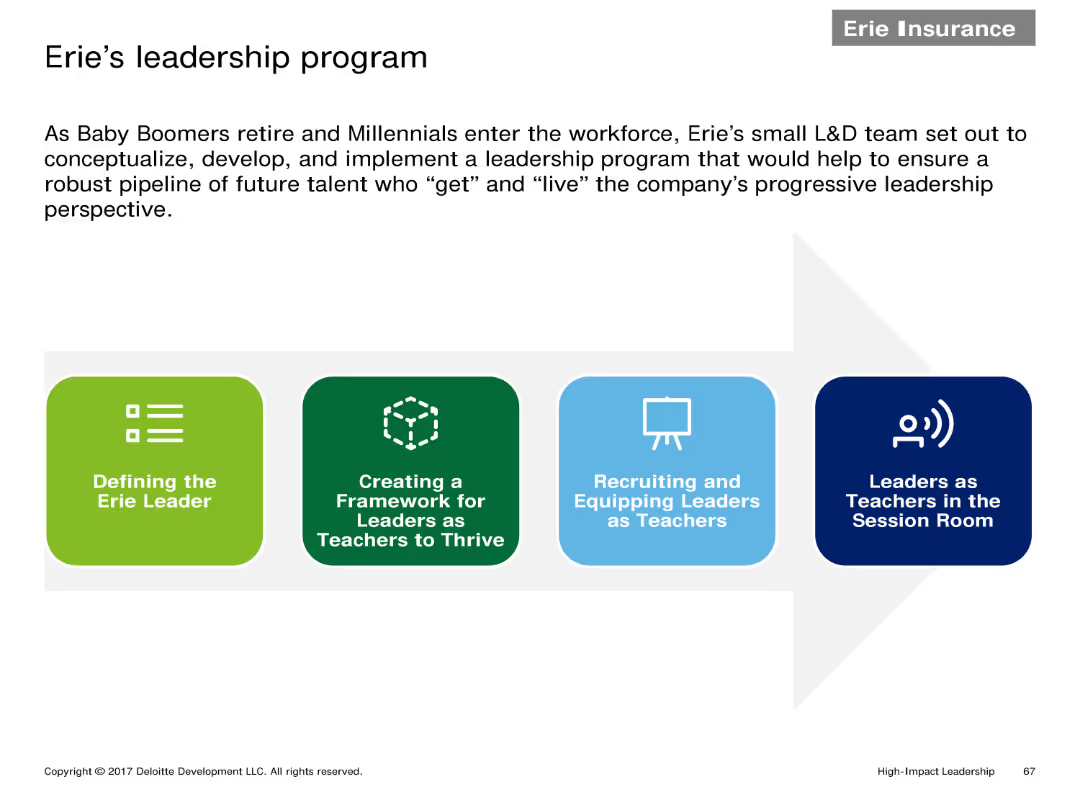
A horizontal flowchart with four stages: Defining the Erie Leader, Creating a Framework for Leaders, Recruiting and Equipping Leaders, Leaders as Teachers.
Human Resources and Talent Management
Financial Services
Describes the steps of Erie's leadership program aimed at developing future leaders within the organization by focusing on defining, creating frameworks, and equipping leaders.
Leadership program, flowchart, future leaders, Erie, framework
false
Human Resources and Talent Management
Financial Services
Linear Flow
Deloitte
Add to my slides
Remove from favorites
Two large pie charts depicting leadership capabilities against a plain background, with a summary text on leadership challenges.
Strategic Planning
Professional Services
Focuses on the readiness of leadership in a boundaryless world, emphasizing the challenges in prioritizing and managing disruptions.
leadership, readiness, boundaryless, pie chart, disruptions
false
Strategic Planning
Professional Services
Multiple Chart
Deloitte
Add to my slides
Remove from favorites
Featuring bold color blocks and clear statistical highlights, the slide offers a snapshot of economic indicators. The layout is segmented to draw attention to key metrics like unemployment rates, GDP growth, and inflation, all of which are crucial for assessing real estate investment risks.
Risk Assessment and Management
Real Estate & Construction
The slide is designed to prompt real estate portfolio reassessments by leadership teams, given current economic challenges. It offers a concise, high-level view of economic data that could influence strategic decisions in portfolio management, emphasizing the need for adaptability in uncertain times.
Leadership, Real Estate, Economic Indicators, Portfolio Management, Adaptability
false
Risk Assessment and Management
Real Estate & Construction
Boxed
EY
Add to my slides
Remove from favorites
Circular diagrams compare leadership structures pre and post-merger, highlighting streamlining and reduction of management layers.
Strategic Planning
Financial Services
Explains the restructuring of leadership to streamline operations post-merger, enhancing focus and efficiency.
leadership, restructuring, merger, efficiency, circular diagram
false
Strategic Planning
Financial Services
Linear Flow
Barclays
Add to my slides
Remove from favorites
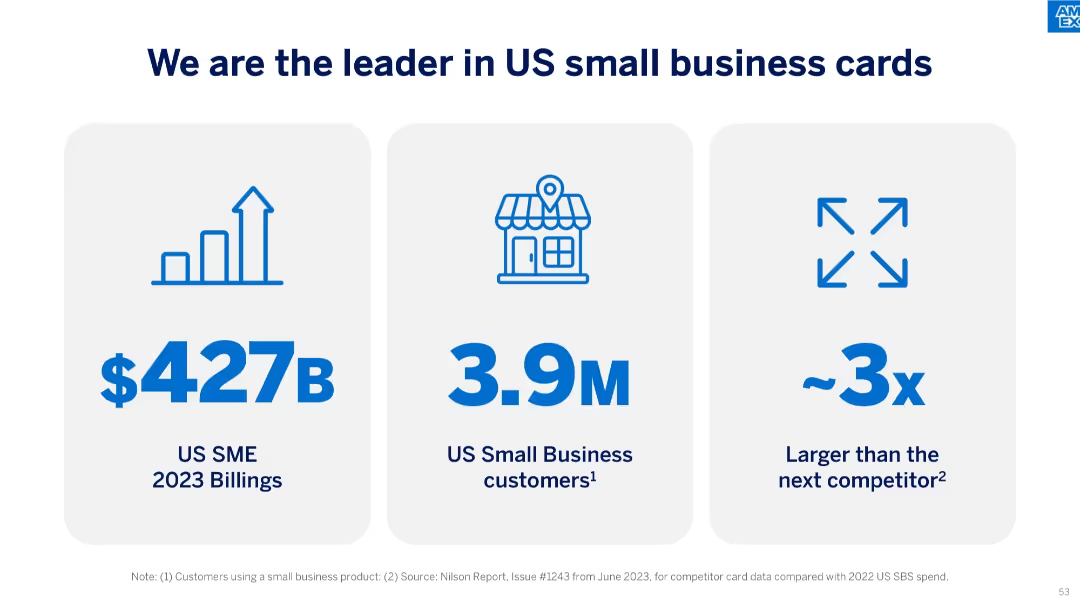
A 3-column layout using icons and large text, showing 2023 US SME billings, customer count, and scale vs. competition.
Strategic Planning
Financial Services
This slide emphasizes American Express’ leadership in the small business card sector, highlighting $427B in 2023 billings, 3.9M customers, and being roughly three times larger than the next competitor.
leadership, SME, billings, customer base, scale advantage, US market, credit cards, strategic positioning
false
Strategic Planning
Financial Services
Pillar
McKinsey
Add to my slides
Remove from favorites
Bar chart layout with green and red horizontal bars representing agreement/disagreement by country; left-aligned title and question; legend for agree/disagree colors; Ipsos logo in bottom corners.
Market Analysis and Trends
Technology & Software
This slide presents public perceptions of leadership quality in social media companies across 21 countries. It shows that agreement levels vary significantly, with India and China reporting high trust and countries like France and Belgium showing low trust in leadership.
leadership, social media, perception, international, Ipsos, trust, agree, disagree, global, reputation
false
Market Analysis and Trends
Technology & Software
Mixed Chart
IPSOS
Add to my slides
Remove from favorites
Horizontal bar chart showing traits of a 'true leader' with percentages, accompanied by detailed text discussing gender differences in leadership preferences.
Human Resources and Talent Management
Education & Training
This slide examines essential leadership traits according to respondents, highlighting strategic thinking and employee development as top characteristics.
leadership, strategic thinking, employee development, gender differences, traits
false
Human Resources and Talent Management
Education & Training
Mixed Chart
Deloitte
Add to my slides
Remove from favorites
This slide is divided into three main sections with icons and headers indicating different strategies. It uses a combination of flat icons, brief text explanations, and numbered bullet points to outline steps for leaders to adapt to changing consumer demands and capitalize on market opportunities.
Strategic Planning
Professional Services
Focuses on strategic recommendations for business leaders to understand and adapt to changing consumer needs and market dynamics post-COVID-19. It provides a structured approach to leveraging data, innovating, and rethinking customer journeys to stay competitive and responsive to evolving consumer behaviors.
leadership, strategy, consumer needs, market adaptation, innovation, data-driven, automation, demand forecasting
false
Strategic Planning
Professional Services
Vertical Flow
BCG
Add to my slides
Remove from favorites
Utilizes text blocks and simple line drawings to depict leadership approaches, integrating visual and textual information with color highlights for separation.
Operational Efficiency
Professional Services
Integrates head, heart, and hands in leadership, outlining strategies for business management and planning during crises with real-world leadership actions from a mining company example.
Leadership, Strategy, Crisis management, Empowerment, Communication
false
Operational Efficiency
Professional Services
Header Vertical
BCG
Add to my slides
Remove from favorites
Complex layout with three main columns and multiple icons, and interconnected sections representing different strategies.
Strategic Planning
Financial Services
This slide outlines J.P.Morgan's strategy for maintaining discipline, optimizing current models, and future transformation, focusing on agility, growth, talent, technology, and innovation. Designed for strategic corporate presentations.
leadership, strategy, discipline, optimization, future-proofing, agility, growth, innovation, technology, talent
false
Strategic Planning
Financial Services
Pillar
JP Morgan
Add to my slides
Remove from favorites
Features four circular icons representing different actions (CEO and board engagement, employee and stakeholder engagement, performance measures, and cultural integration), each with a brief descriptor.
Organizational Structure and Change
Professional Services
This slide outlines four critical actions to successfully integrate sustainability into a company’s core strategy, emphasizing the roles of leadership, employee engagement, performance metrics, and cultural adaptation to embed sustainability deeply within organizational practices.
Leadership, Sustainability, Engagement, Performance Metrics, Organizational Culture
false
Organizational Structure and Change
Professional Services
Pillar
McKinsey
Add to my slides
Remove from favorites
Visual of a person on a beach, with text and circular data graphs showing % of leadership representation in N100 and G250.
Human Resources and Talent Management
Professional Services
This slide discusses the relatively low adoption of sustainability-focused leadership roles. Just 34% of N100 and 45% of G250 companies have board-level sustainability roles. The UK, Taiwan, and France lead.
leadership, sustainability roles, ESG governance, board-level, G250, N100, accountability, representation
false
Human Resources and Talent Management
Professional Services
Mixed Chart
KPMG
Add to my slides
Remove from favorites
Includes a large pie chart with statistical data and a list of three strategic actions for CEOs with associated icons.
Human Resources and Talent Management
Professional Services
This slide emphasizes the importance of leadership in the successful integration of SDGs into business strategy, presenting statistical evidence and actionable recommendations for CEOs to foster a sustainability-focused culture at all organizational levels.
Leadership, Sustainability, SDGs, Strategic Recommendations, Business Strategy
false
Human Resources and Talent Management
Professional Services
Mixed Chart
McKinsey
Add to my slides
Remove from favorites
Full slide width used for horizontal bars; header and question on the left; Ipsos note at bottom.
Organizational Structure and Change
Technology & Software
Global public views on the quality of leadership in technology companies, using bar chart data to compare levels of agreement across various countries.
leadership, tech companies, trust, Ipsos, global opinion, executive quality, management, governance, perception, public trust
false
Organizational Structure and Change
Technology & Software
Mixed Chart
IPSOS
Add to my slides
Remove from favorites
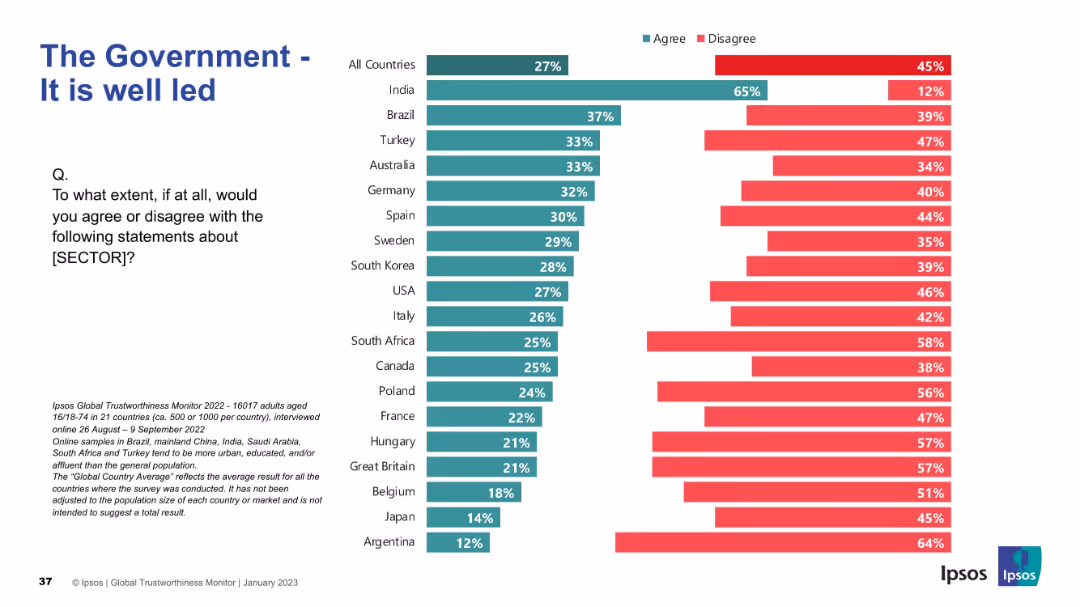
Split green/red bar chart by country indicating perception of leadership quality
Strategic Planning
Government & Public Sector
This slide measures perceptions of how well governments are led. Agreement is low globally, with India highest and Argentina lowest. Disagreement is widespread.
leadership, trust, governance, Ipsos, public administration, perception, effectiveness, international survey
false
Strategic Planning
Government & Public Sector
Mixed Chart
IPSOS
Add to my slides
Remove from favorites
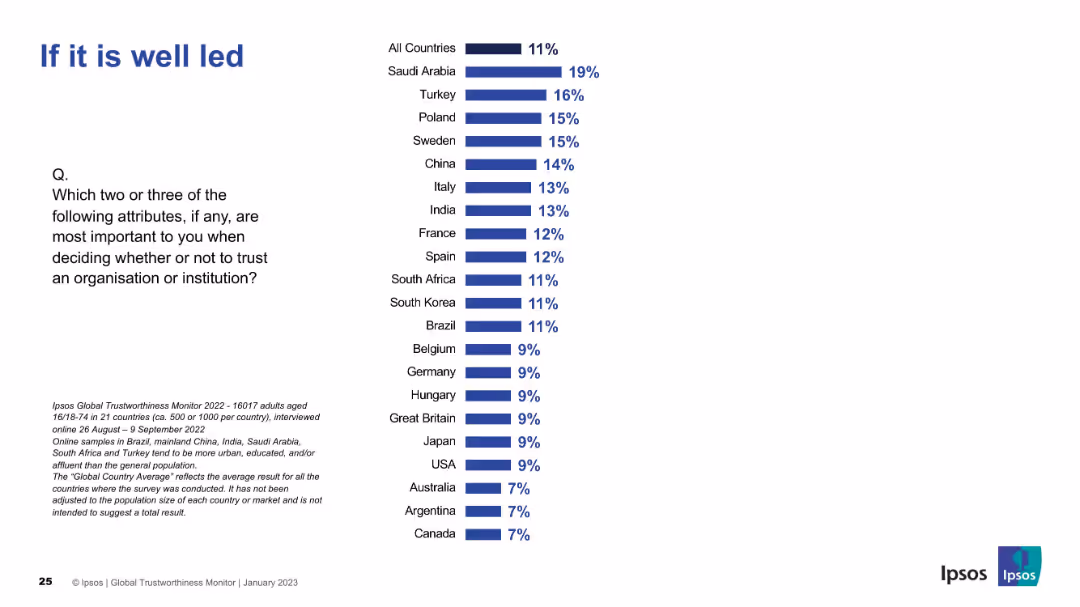
Country comparison bar chart with "All Countries" at top. Standard layout used across slides, emphasizing leadership perception.
Market Analysis and Trends
Professional Services
Reflects global perceptions of leadership's impact on organizational trust. Leadership is least important globally (11%), but higher in Saudi Arabia and Turkey.
leadership, trustworthiness, perception, Ipsos survey, global data, country ranking
false
Market Analysis and Trends
Professional Services
Mixed Chart
IPSOS
Add to my slides
Remove from favorites
Contains three overlapping circles, each representing a different aspect of engaging with Web3 (Explore, Partner, Upskill), set against a dark background.
Strategic Planning
Technology & Software
Offers guidance for business leaders on how to begin engaging with Web3, suggesting a reevaluation of business models and partnerships, and highlighting the importance of upskilling the workforce in Web3 technologies.
Leadership, Web3, Business Strategy, Partnerships, Training
false
Strategic Planning
Technology & Software
Diagram
McKinsey
Add to my slides
Remove from favorites
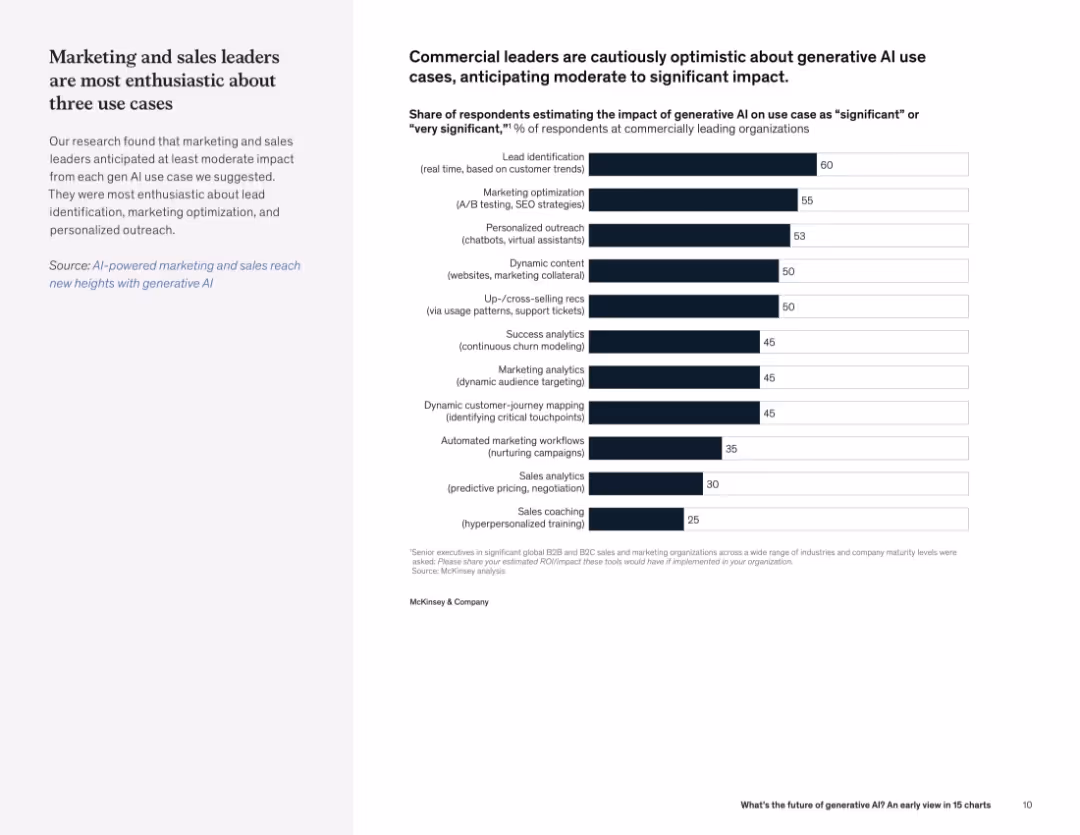
Split layout with text on left and horizontal bar chart on right listing use cases and perceived impact levels.
Product and Service Analysis
Artificial Intelligence
The slide presents survey results showing the perceived business impact of generative AI across use cases. Lead identification, marketing optimization, and personalized outreach rank highest in expected impact.
lead identification, personalized outreach, AI use cases, business impact, marketing, survey, optimism
false
Product and Service Analysis
Artificial Intelligence
Mixed Chart
McKinsey
Add to my slides
Remove from favorites
Previous
Next
You don't have any favorites yet.
Please wait loading your favorites slides...
Create a FREE account to continue browsing
Receive Instant Access to 1,000+ slides from companies like McKinsey, Google, and Goldman Sachs
First Name
Last Name
Email
Password
I agree to all
Terms & Privacy Policy
Thank you! Your submission has been received!
Oops! Something went wrong while submitting the form.
Have an account?
Sign in
Upgrade to PRO to Save slides
Advanced Search and Filters
Access to 15,000+ slides
Access to Category Pages
Save/Bookmark Slides
PowerPoint Template Library
Pick a Plan
MONTHLY
$12/month
Billed every month, Cancel anytime.
YEARLY
$9/year
Billed $108 annually, Cancel anytime.
Checkout for $12/month
Checkout for $108/yr
Secured by Stripe | AES-256 bit encryption


![[Country] needs a strong leader to take the country back from the rich...](https://cdn.prod.website-files.com/654e70fb59937215cac87b19/6899bd3eb729b6bf115e9eef_u0_ZdJ92NzTCNHzn3Ah1dmWgF7vw7YFkZ2bFnbYyaX4.avif)


![[Country] needs a strong leader to take the country back from the rich and powerful](https://cdn.prod.website-files.com/654e70fb59937215cac87b19/6899be25e994d73c414c2f03_ivbtJ5_oX5UD25LQNL6zyH4CbF1iZINXCnNo22TqM-0.avif)