My Account
My Slides
Search by Category
Pricing
Templates
View All Templates
Download Template Slides
✦ AI Search
Feedback
Login
Logout
Get Started
Browse all Slides
Browse all Slides
Create a FREE Account
Instant access to 1,000+ real slides from top companies like McKinsey, BCG, Goldman Sachs, Google and many more!
First Name
Last Name
Email
Password
I agree to all
Terms & Privacy Policy
Thank you! Your submission has been received!
Oops! Something went wrong while submitting the form.
Have an account?
Sign in
Saved Slides
Total No. of slides saved
0
↻ Refresh
✖ Clear all
Includes column charts showing LGBT+ comfort levels in business environments across countries.
Human Resources and Talent Management
Professional Services
Discusses LGBT+ individuals' readiness to disclose their sexual orientation in professional settings.
LGBT+, business environment, disclosure, professional setting
false
Human Resources and Talent Management
Professional Services
Single Chart
BCG
Add to my slides
Remove from favorites
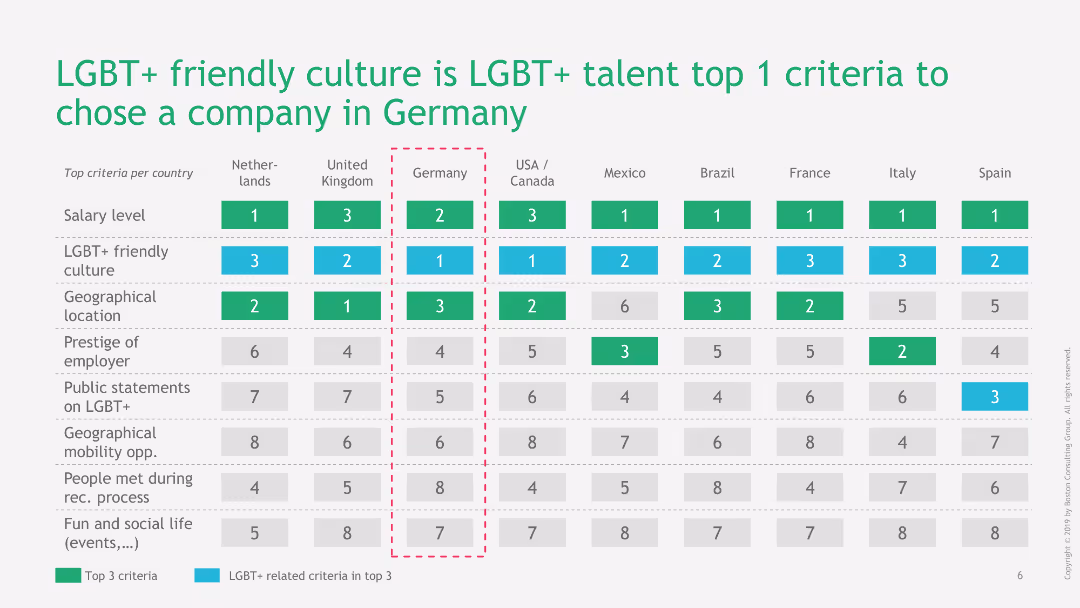
A table outlines the top criteria LGBT+ talents consider when choosing an employer in various countries.
Human Resources and Talent Management
Professional Services
Prioritizes the aspects most important to LGBT+ talents in their employment decisions.
LGBT+, employment criteria, employer choice, top criteria
false
Human Resources and Talent Management
Professional Services
Table
BCG
Add to my slides
Remove from favorites
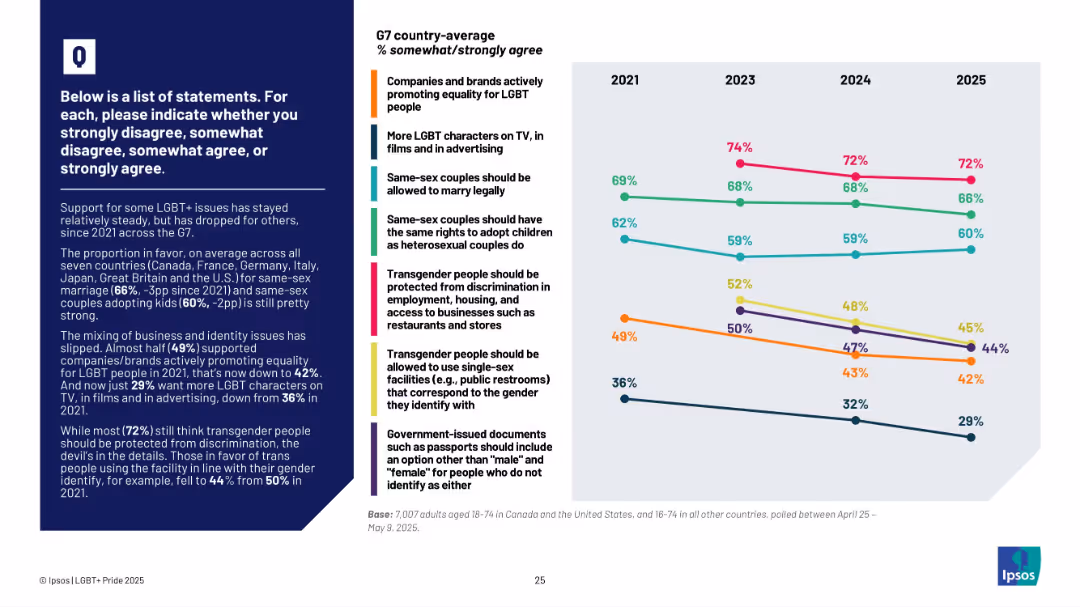
Line graph showing trends from 2021–2025 by issue; text box at left with summary insights
Market Analysis and Trends
Government & Public Sector
This slide tracks changes in public support for LGBT+ rights among G7 countries. It shows declining support in areas like brand promotion of LGBT causes and transgender rights, with the most consistent support for same-sex marriage and anti-discrimination protections.
LGBT+, G7, support trends, policy opinions, transgender, marriage, adoption, brand support, Ipsos
false
Market Analysis and Trends
Government & Public Sector
Mixed Chart
IPSOS
Add to my slides
Remove from favorites
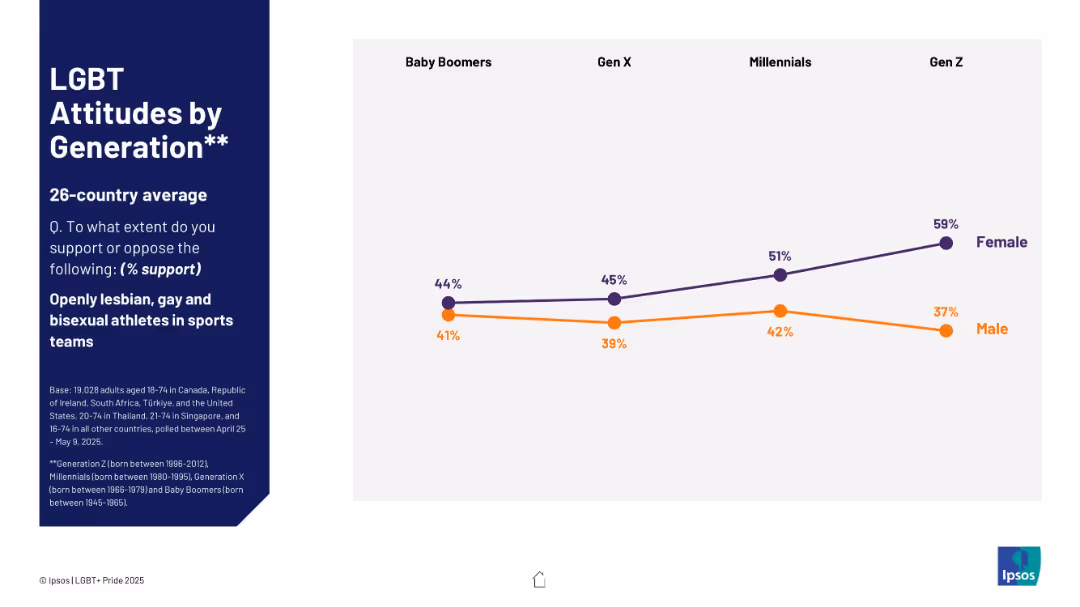
Split-screen layout; left section has text on a dark blue background; right side shows a dual-line chart.
Market Analysis and Trends
Government & Public Sector
This slide compares generational support for openly LGB athletes in sports teams across four generations. It highlights a consistent gender gap, with women showing higher support across all groups.
LGBT, generation, sports, gender, support, Baby Boomers, Gen X, Millennials, Gen Z, attitudes
false
Market Analysis and Trends
Government & Public Sector
Mixed Chart
IPSOS
Add to my slides
Remove from favorites
Table ranking top criteria for choosing a company across various countries, with color-coded highlights for top three criteria and LGBT+ related factors.
Regulatory and Compliance
Professional Services
This slide details the top criteria LGBT+ talents consider when choosing a company, with LGBT+ friendly culture being the top factor in Germany.
LGBT+, Germany, workplace, company choice, diversity
false
Regulatory and Compliance
Professional Services
Table
BCG
Add to my slides
Remove from favorites
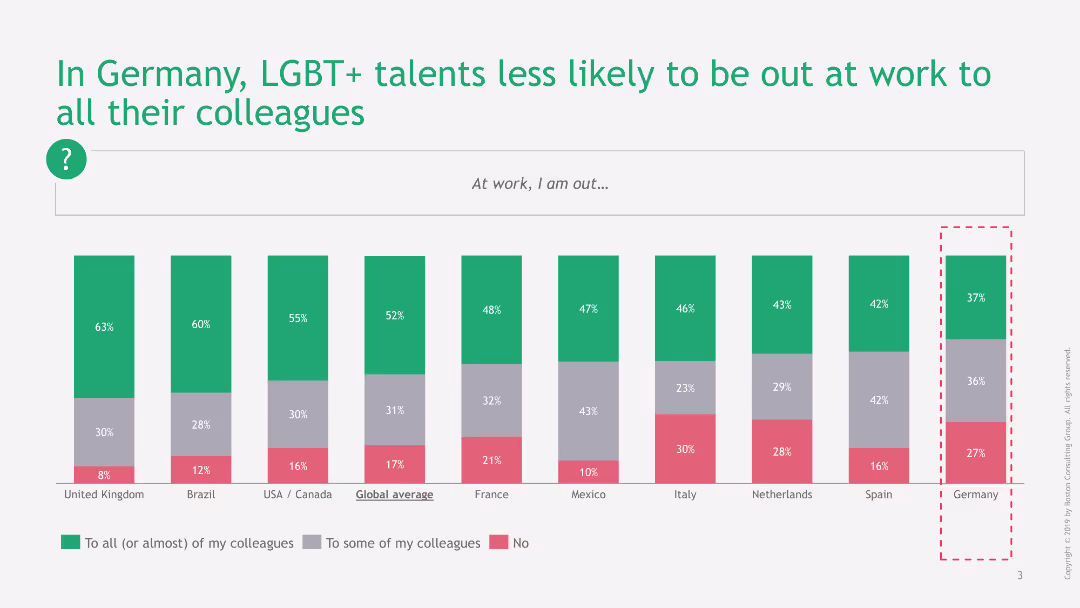
Column chart displaying percentage of LGBT+ talents out at work in various countries. Green, gray, and red bars indicate different levels of openness. Minimalist design.
Regulatory and Compliance
Professional Services
The slide compares the percentage of LGBT+ talents who are out at work across multiple countries, highlighting that Germany has a lower percentage of openly out employees compared to other nations.
LGBT+, Germany, workplace, diversity, inclusion
false
Regulatory and Compliance
Professional Services
Single Chart
BCG
Add to my slides
Remove from favorites
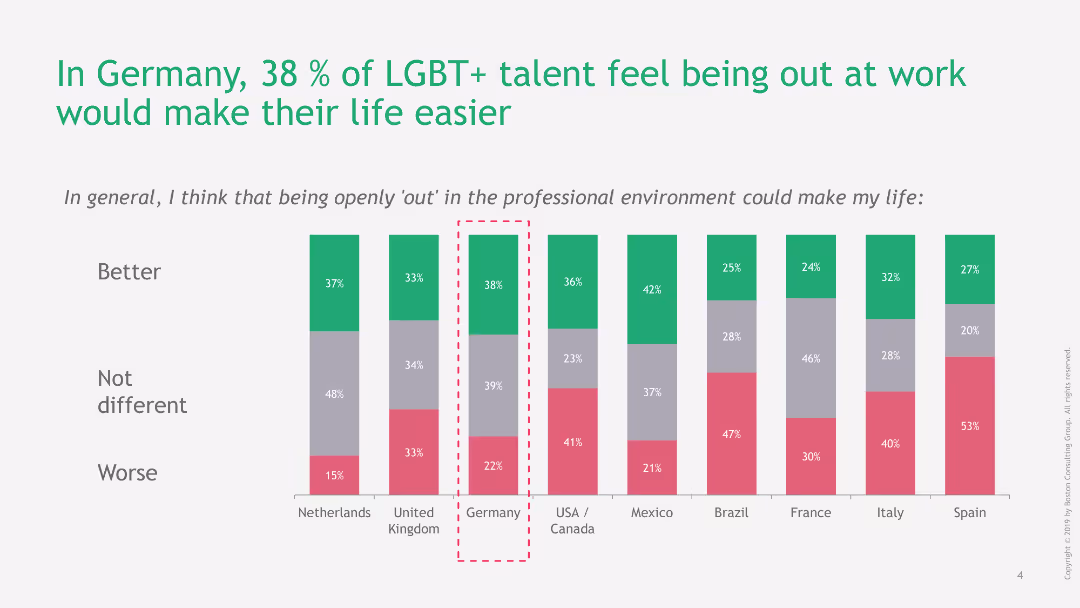
Column chart showing percentages of LGBT+ talents' opinions on how being out would affect their work life. Green, gray, and red bars represent different impacts.
Regulatory and Compliance
Professional Services
The slide presents data on the perceived impact of being openly out at work among LGBT+ talents, with a focus on Germany where 38% feel it would improve their life.
LGBT+, Germany, workplace, diversity, life impact
false
Regulatory and Compliance
Professional Services
Single Chart
BCG
Add to my slides
Remove from favorites
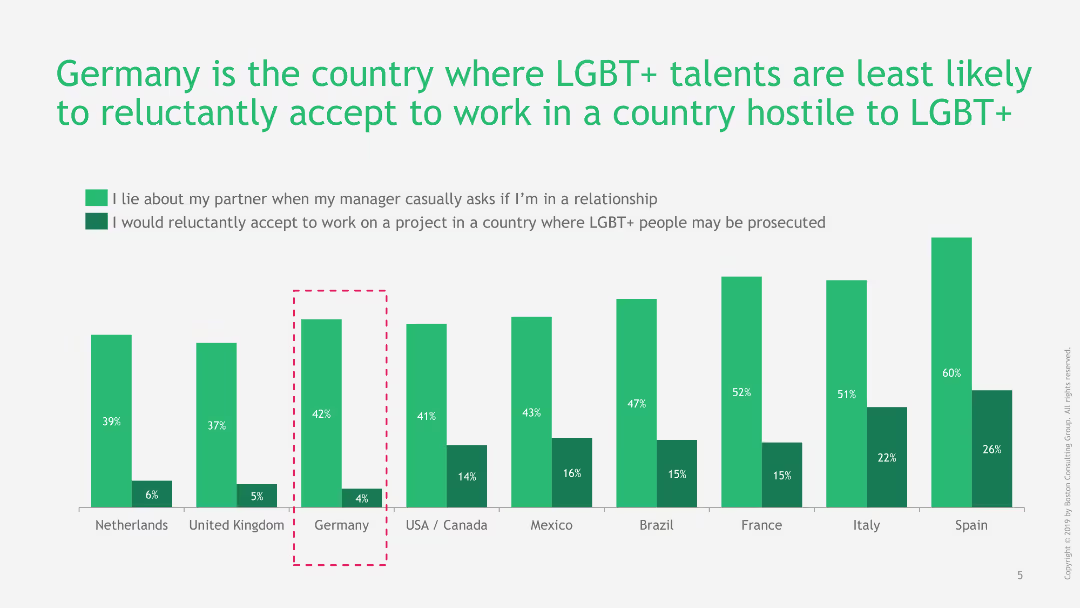
Column chart illustrating the willingness of LGBT+ talents to work in hostile countries and to lie about their partner. Green and dark green bars show different scenarios.
Regulatory and Compliance
Professional Services
The slide illustrates Germany's position where LGBT+ talents are least likely to accept work in hostile countries, and their tendency to lie about their partners when asked by managers.
LGBT+, Germany, workplace, hostile countries, diversity
false
Regulatory and Compliance
Professional Services
Single Chart
BCG
Add to my slides
Remove from favorites
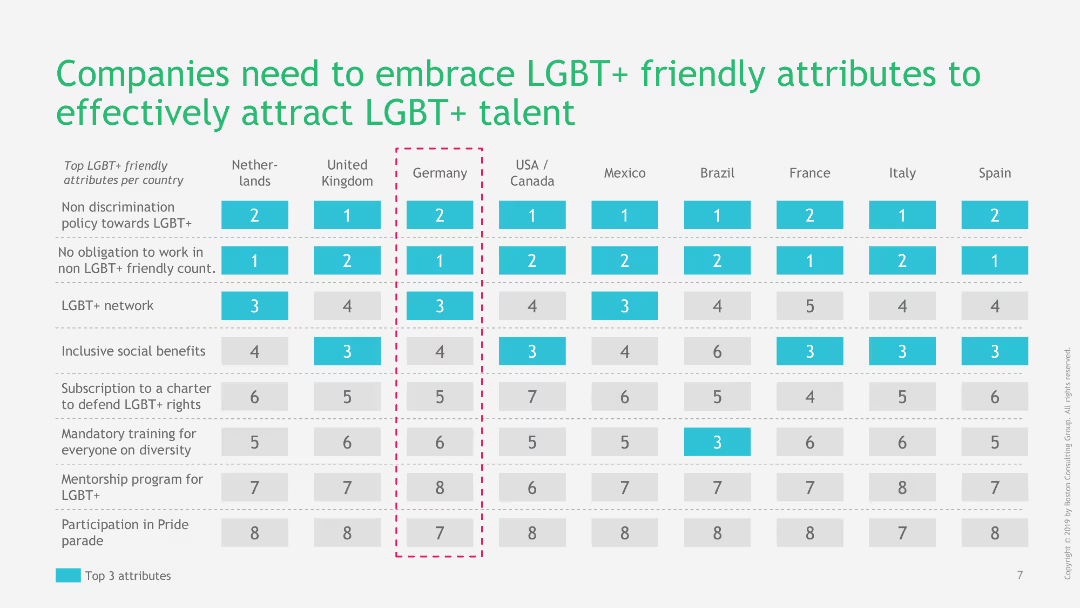
Table listing LGBT+ friendly attributes by country with rankings and highlights for top attributes.
Regulatory and Compliance
Professional Services
The slide shows which LGBT+ friendly attributes are most valued by talents in different countries, emphasizing the importance of non-discrimination policies and inclusive benefits.
LGBT+, Germany, workplace, talent attraction, diversity
false
Regulatory and Compliance
Professional Services
Table
BCG
Add to my slides
Remove from favorites
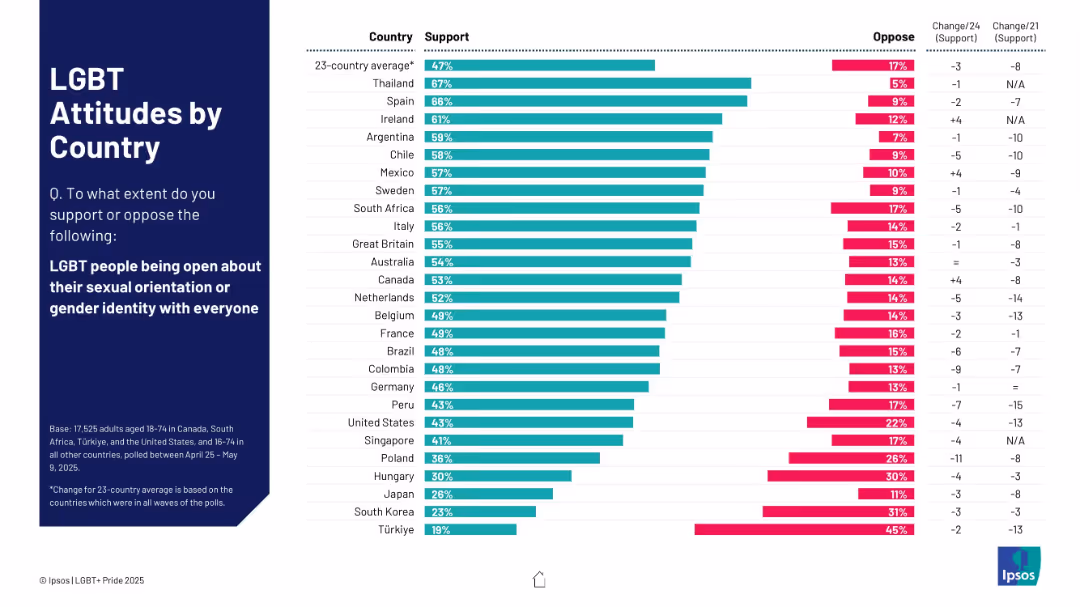
Horizontal bar chart with countries ranked by LGBT support. Bars show support/oppose rates and % change over time.
Market Analysis and Trends
Government & Public Sector
Global comparison of support for LGBT people being open about their identity. Shows wide variation between countries; Great Britain ranks mid-high. Includes historical trend change (2021–2024).
LGBT, global attitudes, openness, Ipsos, support levels, identity
false
Market Analysis and Trends
Government & Public Sector
Mixed Chart
IPSOS
Add to my slides
Remove from favorites
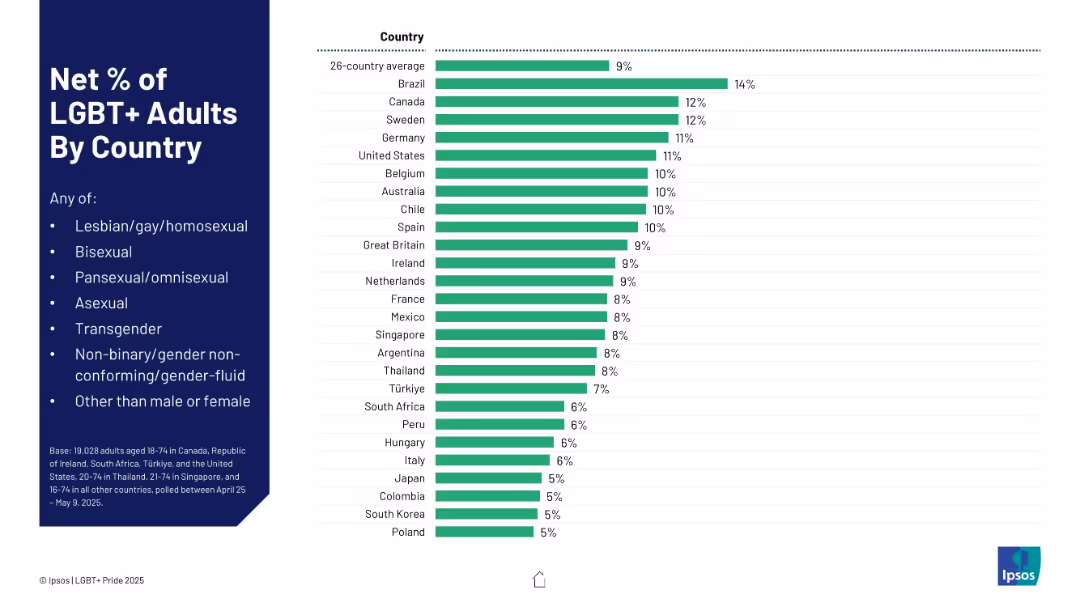
Horizontal bar chart ranking countries by percentage. Left-aligned legend and title; right-aligned bars.
Market Analysis and Trends
Government & Public Sector
This slide visualizes the net percentage of LGBT+ adults in 26 countries, showing Brazil, Canada, and Sweden at the top, with a global average of 9%. Categories include various sexual and gender identities.
LGBT+, global comparison, demographics, country stats, sexuality, identity
false
Market Analysis and Trends
Government & Public Sector
Mixed Chart
IPSOS
Add to my slides
Remove from favorites
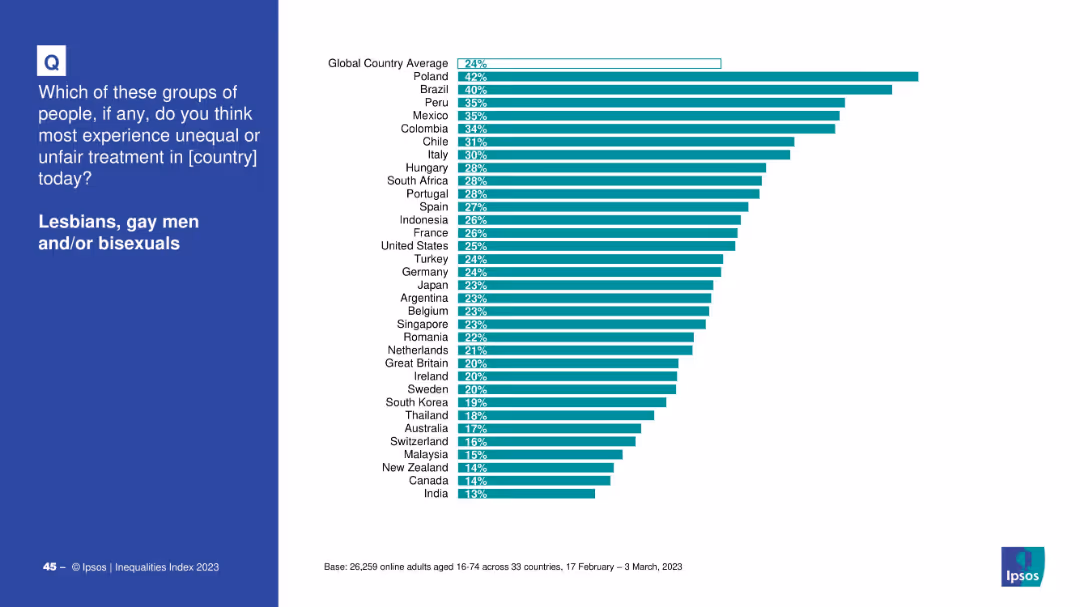
Bar chart with teal bars on white background showing percentage by country, blue panel on left side
Market Analysis and Trends
Government & Public Sector
This slide presents a country-wise breakdown of perceptions regarding unequal treatment faced by lesbians, gay men, and/or bisexuals. It compares responses from 33 countries, showing where the perception of unfairness is highest, with Poland, Brazil, and Peru at the top.
LGBT, inequality, global survey, country comparison, Ipsos, discrimination, public opinion, bar chart, fairness, 2023
false
Market Analysis and Trends
Government & Public Sector
Mixed Chart
IPSOS
Add to my slides
Remove from favorites
Features column charts on attitudes towards working in countries hostile to LGBT+.
Risk Assessment and Management
Professional Services
Evaluates the willingness of LGBT+ talents to work in countries with unfavorable attitudes towards LGBT+.
LGBT+, international work, hostility, willingness
false
Risk Assessment and Management
Professional Services
Single Chart
BCG
Add to my slides
Remove from favorites
Contains multiple bar graphs showing the status of LGBTQI+ laws in 2020 by country, split into categories like LGBT discrimination, homosexual activity, and marriage rights. Each graph uses horizontal bars colored differently.
Market Analysis and Trends
Government & Public Sector
This slide presents an overview of the global status of LGBTQI+ laws as of 2020. It categorizes data into areas like discrimination protections, legality of homosexual activities, same-sex marriage rights, and legal gender change rights, illustrating global variations.
LGBT, laws, global, discrimination, rights
false
Market Analysis and Trends
Government & Public Sector
Multiple Chart
Roland Berger
Add to my slides
Remove from favorites
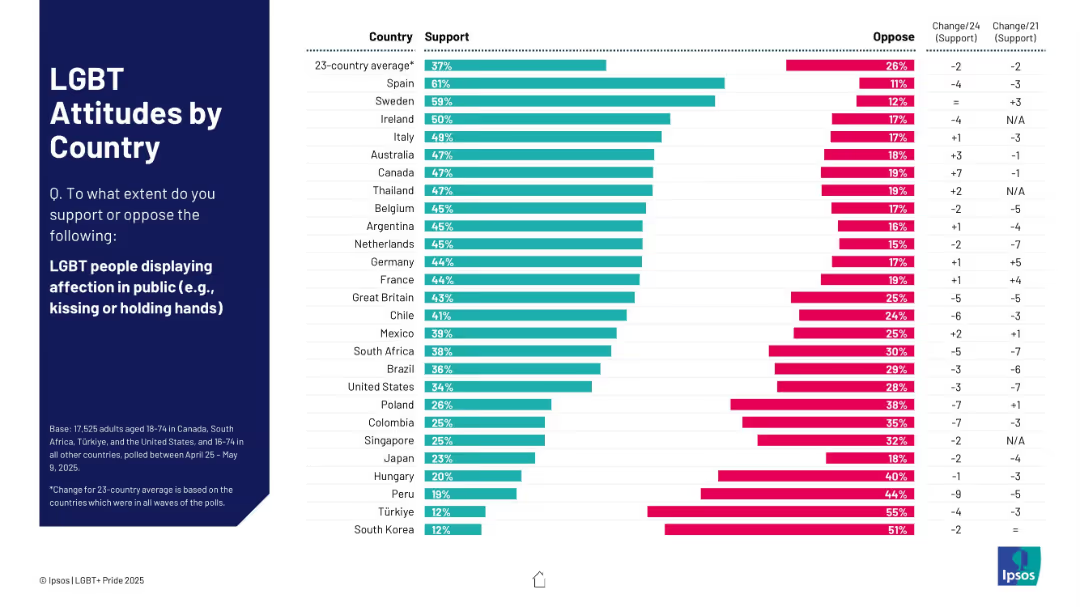
Similar to 19718 but focused on support for LGBT people displaying affection in public. Countries ranked by support with trend columns.
Market Analysis and Trends
Government & Public Sector
Compares support for public LGBT affection across 23 countries. Spain and Sweden lead; UK ranks mid-range. Notable opposition in South Korea and Türkiye. Trend data shows shifting attitudes since 2021.
LGBT, public affection, country comparison, trend analysis, Ipsos
false
Market Analysis and Trends
Government & Public Sector
Mixed Chart
IPSOS
Add to my slides
Remove from favorites
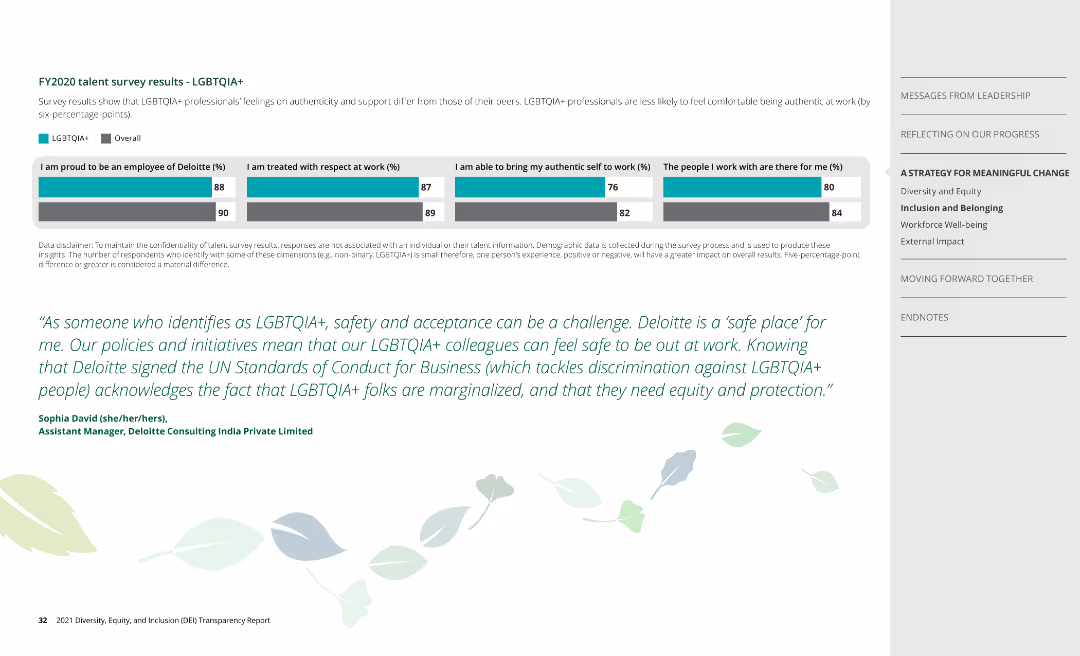
This slide contains a series of horizontal bar charts comparing responses between LGBTQIA+ employees and the overall employee population at Deloitte on various aspects like pride in the company, respect at work, authenticity, and support.
Human Resources and Talent Management
Professional Services
The slide presents survey results showing differences in feelings of authenticity and support at work between LGBTQIA+ professionals and their peers at Deloitte, highlighting a testimonial and the company's commitment to LGBTQIA+ inclusivity.
LGBTQIA+, survey, Deloitte, inclusion, authenticity, support, testimonial, commitment
false
Human Resources and Talent Management
Professional Services
Mixed Chart
Deloitte
Add to my slides
Remove from favorites
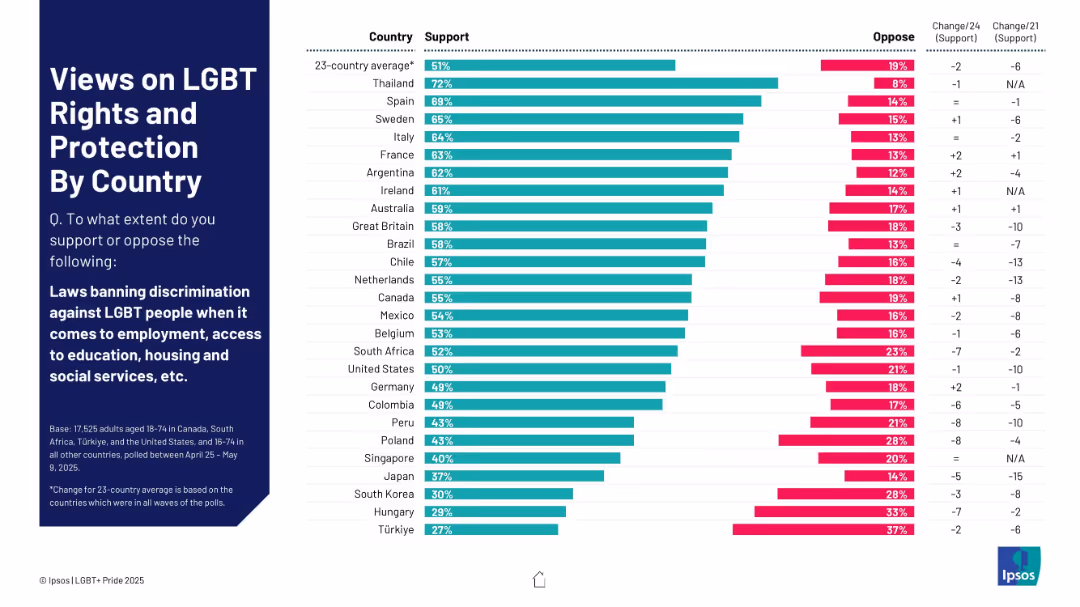
Horizontal bar chart showing levels of support/opposition to anti-discrimination laws by country
Regulatory and Compliance
Government & Public Sector
The slide measures support for laws banning LGBT discrimination in employment, education, housing, and social services across 23 countries. Thailand leads in support (72%), while Türkiye ranks lowest (27%). Change indicators over time highlight sociopolitical trends.
LGBT rights, anti-discrimination, support levels, employment, legislation, opinion data, countries
false
Regulatory and Compliance
Government & Public Sector
Mixed Chart
IPSOS
Add to my slides
Remove from favorites
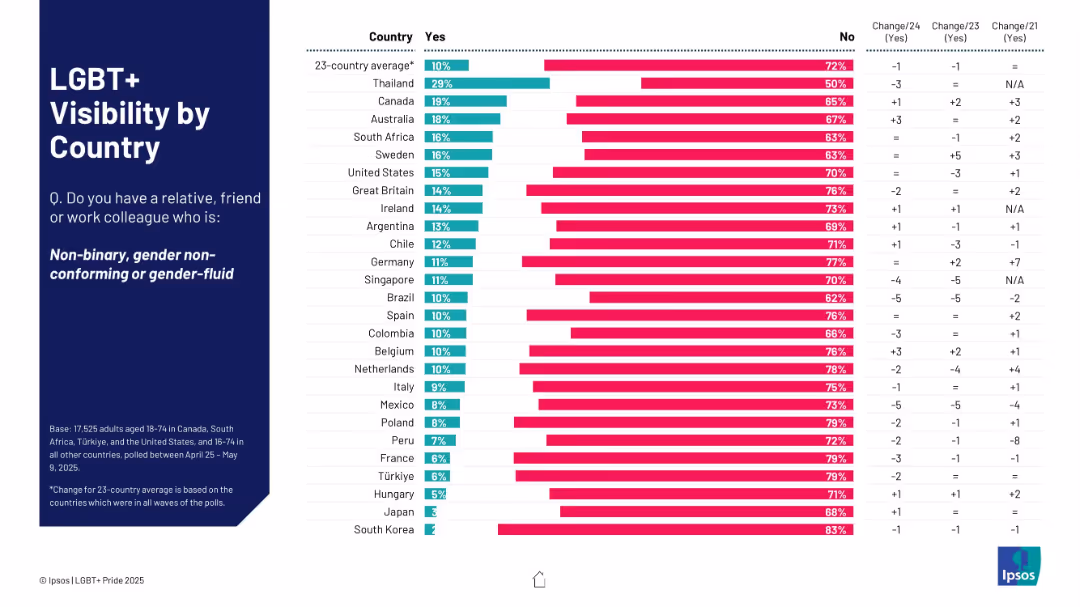
Bar chart with country-wise comparisons (Yes/No) on having non-binary, gender non-conforming, or gender-fluid contacts
Market Analysis and Trends
Government & Public Sector
The slide displays the visibility of non-binary or gender non-conforming individuals globally. It compares 23 countries on the percentage of respondents who know someone from the LGBT+ spectrum. Thailand ranks highest in visibility. Trend data over three years is also included.
LGBT+, visibility, countries, gender-fluid, awareness, trends, Ipsos, data, bar chart, diversity
false
Market Analysis and Trends
Government & Public Sector
Mixed Chart
IPSOS
Add to my slides
Remove from favorites
Features four images, each depicting different workplace experiences of LGBT+ individuals, with quotes.
Organizational Structure and Change
Professional Services
Examines various experiences of LGBT+ employees in the workplace, highlighting differing levels of comfort and openness.
LGBT+, workplace, employee experience, diversity, inclusion
false
Organizational Structure and Change
Professional Services
Header Horizontal
BCG
Add to my slides
Remove from favorites
Column charts show perceptions of life improvement by being openly LGBT+ at work in various countries.
Human Resources and Talent Management
Professional Services
Assesses how being openly LGBT+ at work impacts individuals' professional and personal lives.
LGBT+, workplace, life improvement, personal impact
false
Human Resources and Talent Management
Professional Services
Single Chart
BCG
Add to my slides
Remove from favorites
Displays column charts comparing LGBT+ openness at work across several countries.
Organizational Structure and Change
Professional Services
Explores the level of openness about sexual orientation among LGBT+ employees in different countries.
LGBT+, workplace, openness, international comparison
false
Organizational Structure and Change
Professional Services
Single Chart
BCG
Add to my slides
Remove from favorites
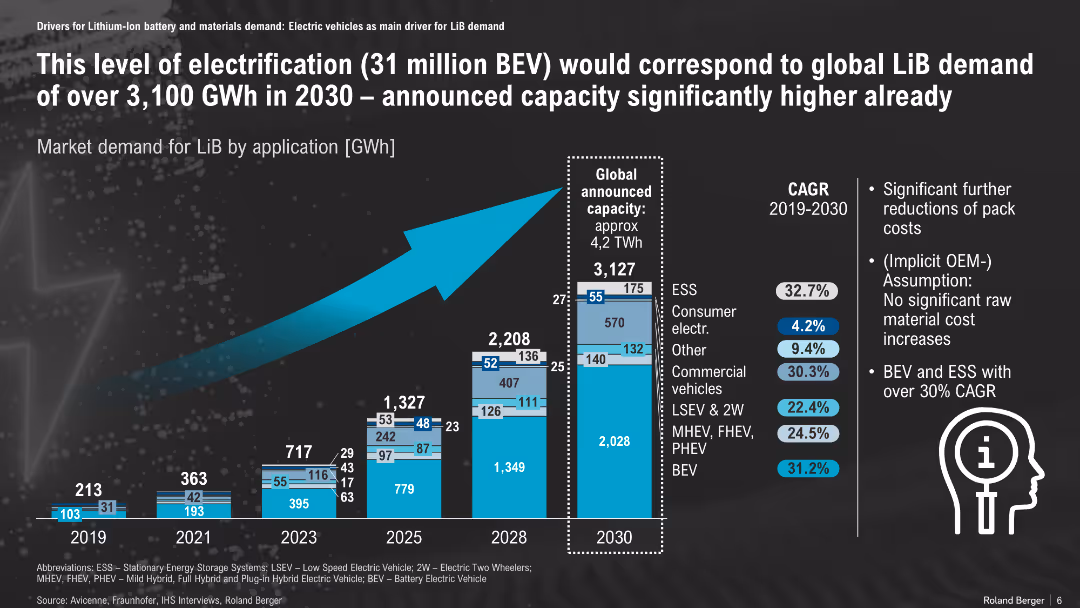
Bar chart showing LiB demand growth by application; forecast to 2030
Market Analysis and Trends
Energy & Utilities
Projected lithium-ion battery demand by application suggests a 3,100 GWh requirement by 2030 driven by BEV growth. The supply capacity is expected to exceed this, with BEV and ESS leading CAGR over 30%.
LiB demand, energy storage, BEV, GWh forecast, CAGR, application mix
false
Market Analysis and Trends
Energy & Utilities
Mixed Chart
Roland Berger
Add to my slides
Remove from favorites
The slide includes a line chart displaying the 3-month London Interbank Offered Rate (LIBOR) from 2002 to 2040 with forecasts.
Financial Performance
Financial Services
This slide analyzes the historical and projected trends of borrowing costs using LIBOR rates, indicating expected future increases.
LIBOR, borrowing costs, interest rates, financial forecast, historical trends
false
Financial Performance
Financial Services
Single Chart
UBS
Add to my slides
Remove from favorites
This slide has a blue and green color scheme with a pie chart showing outstanding debt and preferred shares. It contains bullet points with checkmarks and three text sections on the left side. The slide is marked as number 7.
Regulatory and Compliance
Financial Services
The slide presents actions taken for a seamless LIBOR transition, including leadership roles, meeting investor needs, and managing LIBOR exposure. It uses a pie chart to show the composition of outstanding debt and shares, and bullet points for structured information.
LIBOR, transition, debt, shares, derivatives, risk management
false
Regulatory and Compliance
Financial Services
Mixed Chart
Goldman Sachs
Add to my slides
Remove from favorites
The layout is text-focused with a section for bullet points on the left and a pie chart on the right that shows 'Outstanding Vanilla Debt and Preferred Shares Referencing USD LIBOR as of 1Q20'. The text addresses the firm’s strategy and commitments related to the LIBOR transition.
Regulatory and Compliance
Financial Services
Addresses the upcoming LIBOR transition, outlining the company's preparedness and strategic plans, which is critical for stakeholders monitoring regulatory shifts and risk exposure.
LIBOR transition, regulatory compliance, risk management, pie chart, financial strategy, debt management, preferred shares, corporate strategy, market adaptation, stakeholder assurance
false
Regulatory and Compliance
Financial Services
Mixed Chart
Goldman Sachs
Add to my slides
Remove from favorites
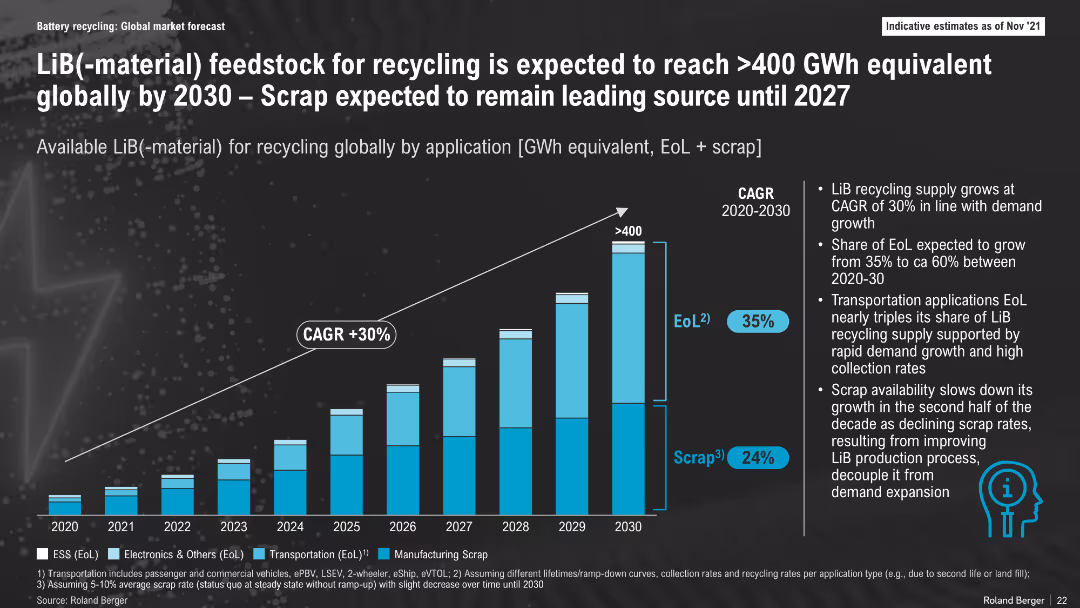
Stacked bar chart with CAGR trajectory, breakdown by application types (ESS, Electronics, Transportation, Scrap); dark theme, annotated with notes on trends
Market Analysis and Trends
Energy & Utilities
This slide forecasts LiB-material feedstock for recycling to exceed 400 GWh by 2030, driven by growing End-of-Life volumes and early scrap. Scrap remains dominant until 2027 before EoL overtakes it, indicating changes in battery production maturity and recycling dynamics.
LiB Recycling, GWh Feedstock, Scrap, End-of-Life, CAGR, Battery Materials, 2030, Market Growth
false
Market Analysis and Trends
Energy & Utilities
Mixed Chart
Roland Berger
Add to my slides
Remove from favorites
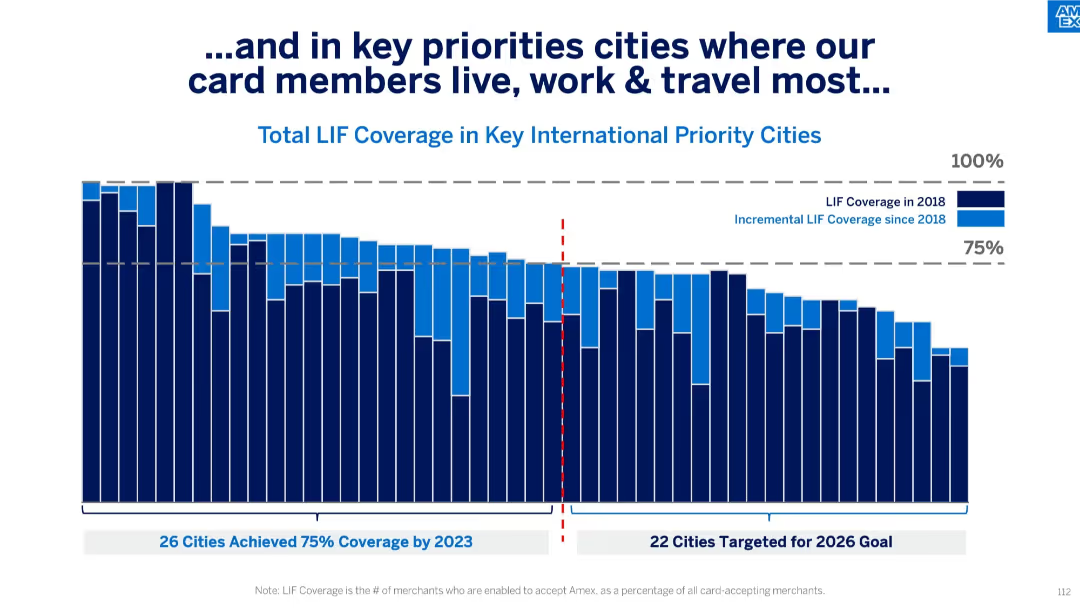
Vertical stacked bar chart split by year (2018 and incremental growth), segmented by 75% threshold and future target cities; uses bold blue tones and annotations.
Performance Metrics and KPIs
Financial Services
The slide illustrates LIF (Locations in Force) coverage across international cities where card members are most active. It differentiates between coverage levels as of 2018 and the progress made since then, showing how many cities have surpassed the 75% target and setting goals for 2026.
LIF coverage, cities, card members, merchant acceptance, 2023 goal, 2026 target, incremental growth, Amex, bar chart
false
Performance Metrics and KPIs
Financial Services
Single Chart
McKinsey
Add to my slides
Remove from favorites
Slide showcases a client lifecycle on a gentle curve graph, with text boxes and icons for different stages and a data section detailing financial services.
Investment Analysis
Financial Services
Outlines the firm's coverage and solutions throughout the client's growth phases, providing financial insights.
Lifecycle, IB Coverage, Solutions, Growth, M&A, Private Equity, IPO, Strategic Growth
false
Investment Analysis
Financial Services
Table
JP Morgan
Add to my slides
Remove from favorites
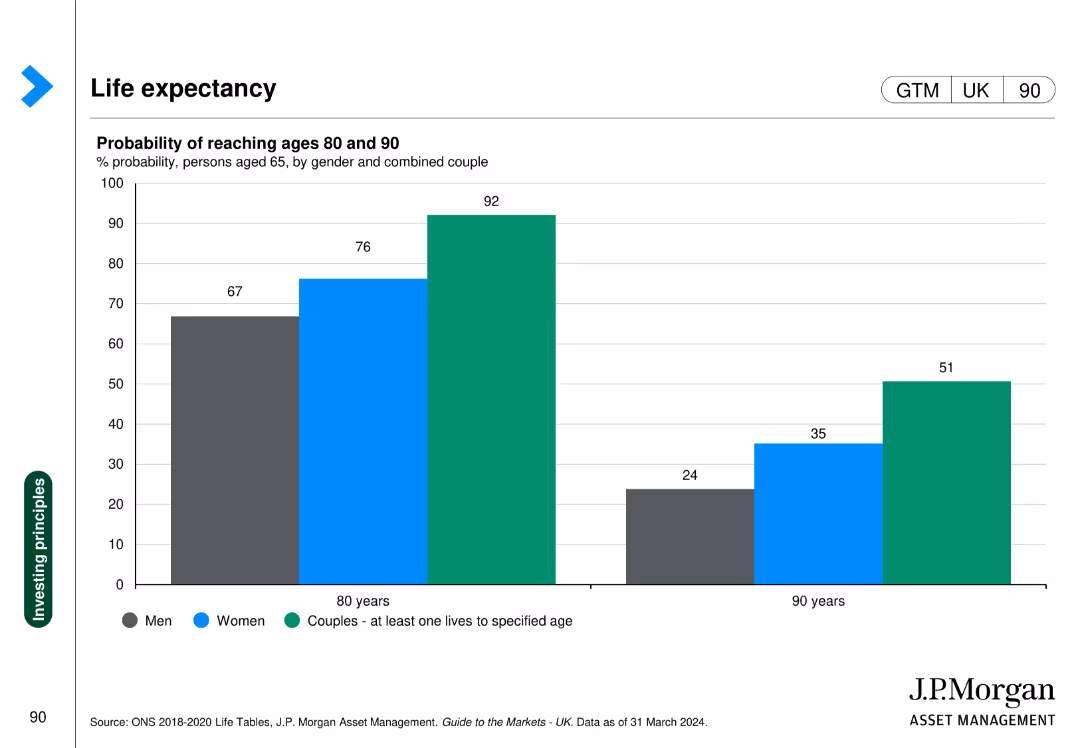
The slide contains a column chart showing the probability of reaching ages 80 and 90 for men, women, and couples. The chart is color-coded and includes percentages for each category.
Market Analysis and Trends
Healthcare & Pharmaceuticals
This slide provides statistical insights into life expectancy probabilities for different demographics, useful for healthcare planning and actuarial analysis.
life expectancy, healthcare, demographics, aging, actuarial analysis
false
Market Analysis and Trends
Healthcare & Pharmaceuticals
Single Chart
JP Morgan
Add to my slides
Remove from favorites
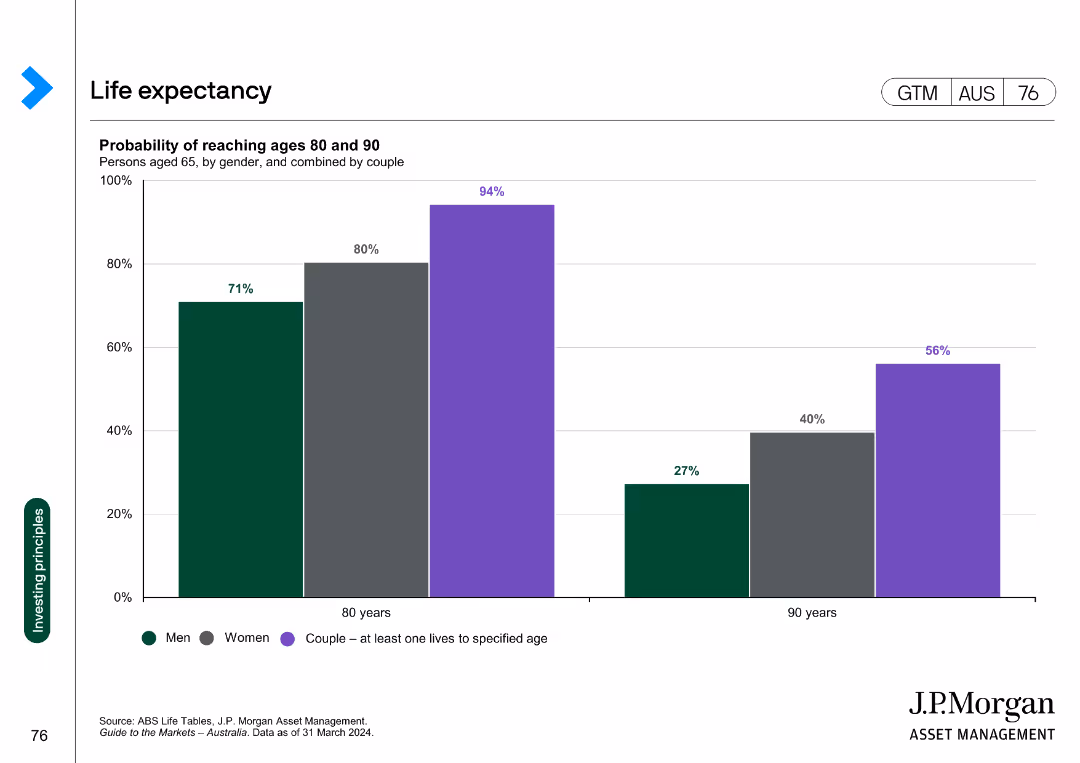
A column chart displaying the probability of men, women, and couples reaching ages 80 and 90. The bars represent the percentages for each group, with different colors for each category.
Market Analysis and Trends
Financial Services
The slide shows the probability of men, women, and couples reaching the ages of 80 and 90. It is used to illustrate longevity statistics relevant to financial planning.
Life expectancy, longevity, financial planning, retirement, demographics
false
Market Analysis and Trends
Financial Services
Single Chart
JP Morgan
Add to my slides
Remove from favorites
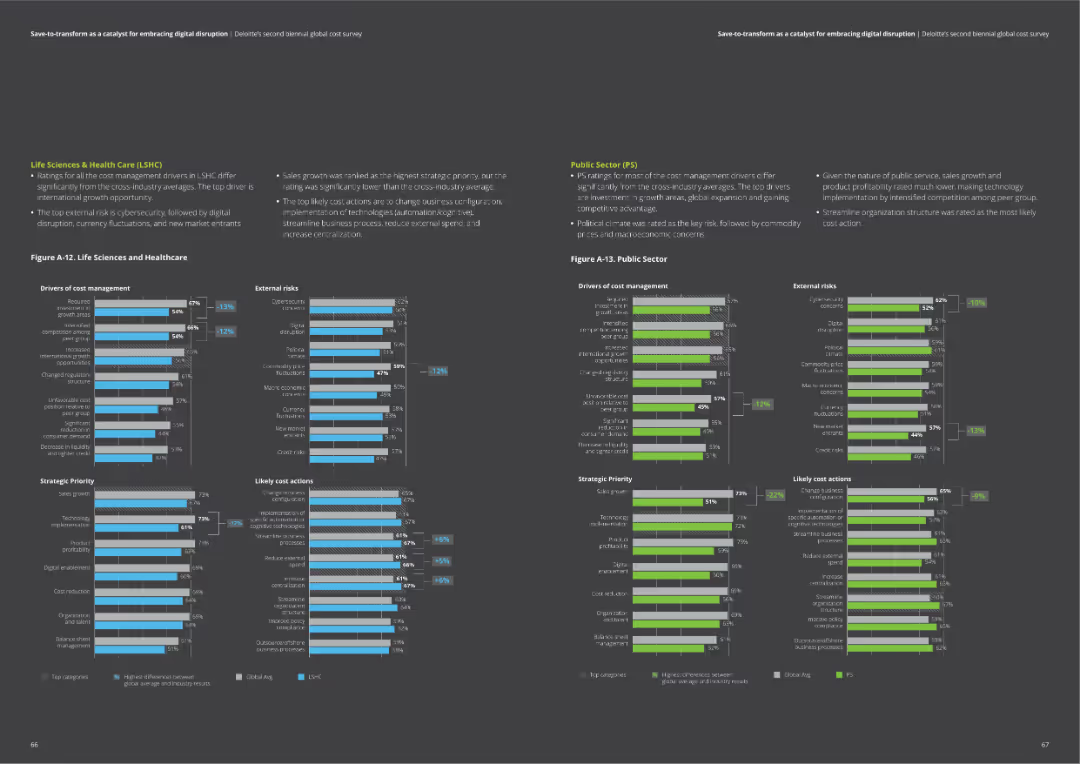
This slide features two column charts detailing drivers of cost management, external risks, strategic priorities, and likely cost actions for Life Sciences & Health Care, and Public Sector.
Market Analysis and Trends
Professional Services
Analyzes cost management in Life Sciences & Health Care and Public Sector, focusing on specific drivers and strategies.
life sciences, public sector, cost management, risks, priorities
false
Market Analysis and Trends
Professional Services
Multiple Chart
Deloitte
Add to my slides
Remove from favorites
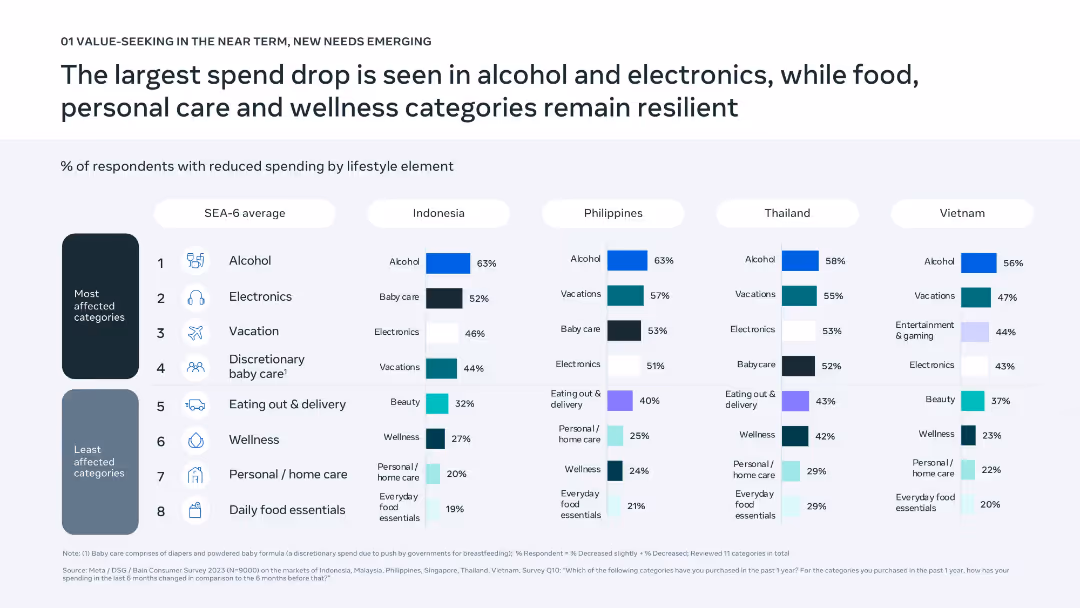
Comparative bar chart matrix by country and category; well-structured visual layout with icons for clarity.
Market Analysis and Trends
Consumer Goods
The slide details which lifestyle categories have seen the most spending reductions across Southeast Asian countries, with alcohol and electronics hit hardest. Food and wellness-related categories have remained relatively stable.
lifestyle spending, SEA-6, electronics, alcohol, consumer cuts, discretionary categories, personal care, resilience, category analysis, wellness
false
Market Analysis and Trends
Consumer Goods
Single Chart
Bain
Add to my slides
Remove from favorites
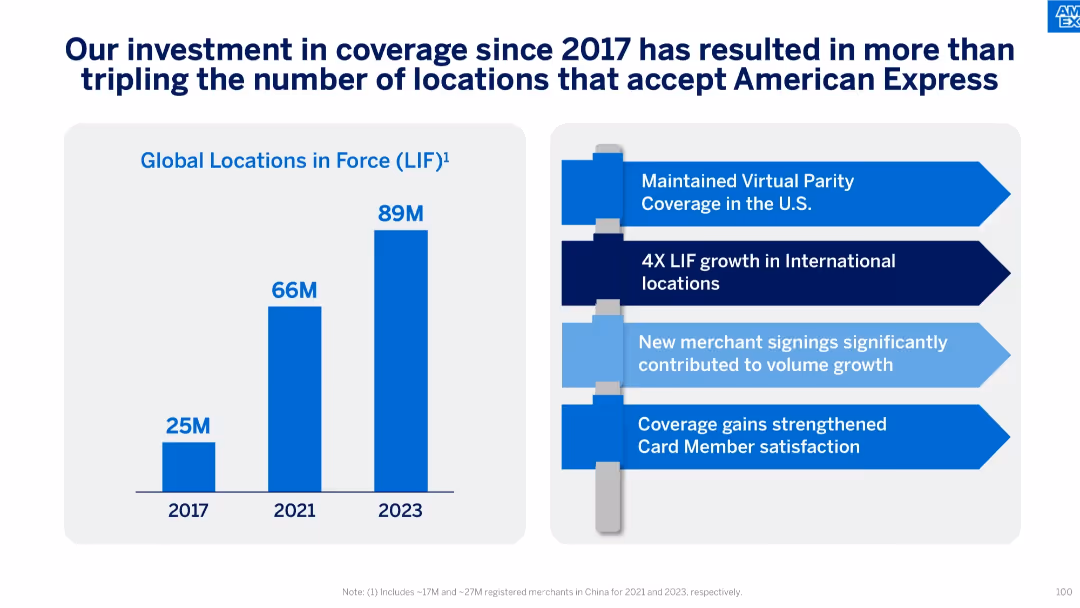
Bar chart (left) showing global LIF growth and a bullet list (right) with strategic initiatives and outcomes.
Operational Efficiency
Financial Services
This slide emphasizes the expansion in Global Locations in Force (LIF) from 25M in 2017 to 89M in 2023. It outlines strategic outcomes like virtual parity in the U.S., 4x growth internationally, and improved cardholder satisfaction.
LIF, Global Locations, Coverage, Strategy, Virtual Parity, International Growth, Merchant Signings
false
Operational Efficiency
Financial Services
Mixed Chart
McKinsey
Add to my slides
Remove from favorites
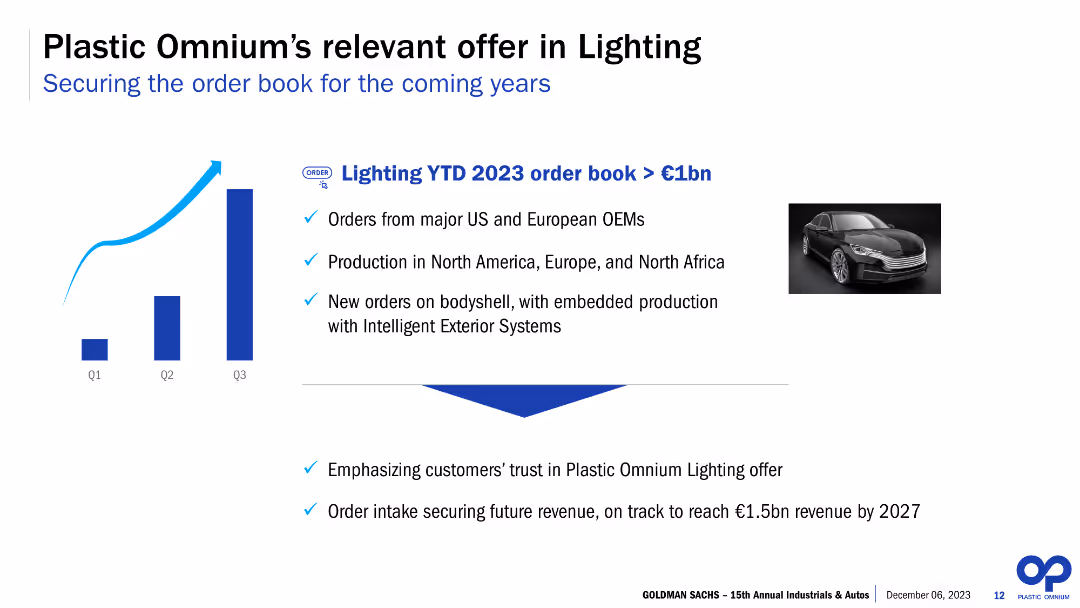
The slide includes a column chart showing the year-to-date order book for 2023, along with bullet points detailing major orders, production locations, and new orders on bodyshells with embedded production. It also features an image of a car.
Product and Service Analysis
Industrial & Manufacturing
The slide outlines Plastic Omnium’s offerings in the lighting sector, showcasing significant orders from major OEMs, production spread across regions, and new orders with embedded production capabilities. It emphasizes the strategic importance and customer trust in their lighting solutions.
Lighting, order book, OEMs, production, bodyshells, embedded production, customer trust, strategic importance, Plastic Omnium, year-to-date
false
Product and Service Analysis
Industrial & Manufacturing
Mixed Chart
Goldman Sachs
Add to my slides
Remove from favorites
The slide combines a column chart with an upward trend for three quarters, an accompanying high-quality image of a car, and bullet points outlining key facts about the company's offer in lighting. The visual focus is balanced between the chart and the image, with both elements prominently displayed against a clean white background. The text is concise, using bold fonts for emphasis.
Product and Service Analysis
Industrial & Manufacturing
This slide highlights the company's significant order book in lighting, emphasizing orders from major automotive OEMs and production across regions. It discusses new orders and projects future revenue targets. This visual and textual combination effectively conveys the company's capabilities in lighting and its market relevance, likely aimed at investors or partners.
Lighting, Order Book, OEMs, Production, Growth, Revenue Targets, Column Chart, Automotive, Market Relevance, Forecast
false
Product and Service Analysis
Industrial & Manufacturing
Mixed Chart
Goldman Sachs
Add to my slides
Remove from favorites
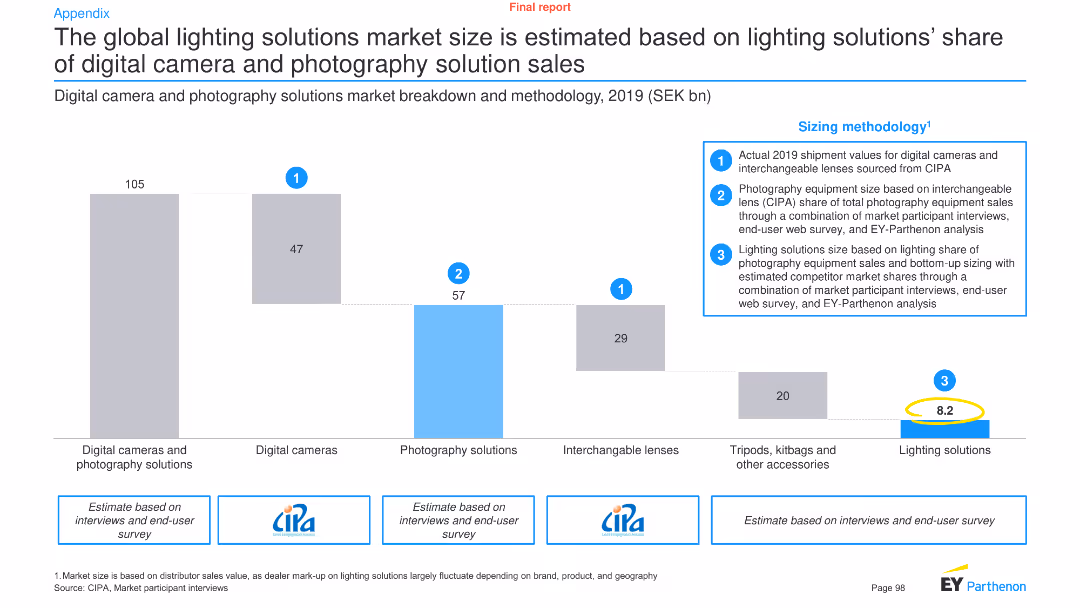
This slide features a column chart and text to illustrate the market size of lighting solutions in relation to digital cameras and photography solutions, along with sizing methodology.
Market Analysis and Trends
Technology & Software
It estimates the global market size of lighting solutions based on their share of digital camera and photography solution sales, providing a detailed breakdown and methodology.
Lighting solutions, market size, digital cameras, photography, global market, sizing methodology, technology, analysis, trends
false
Market Analysis and Trends
Technology & Software
Mixed Chart
EY
Add to my slides
Remove from favorites
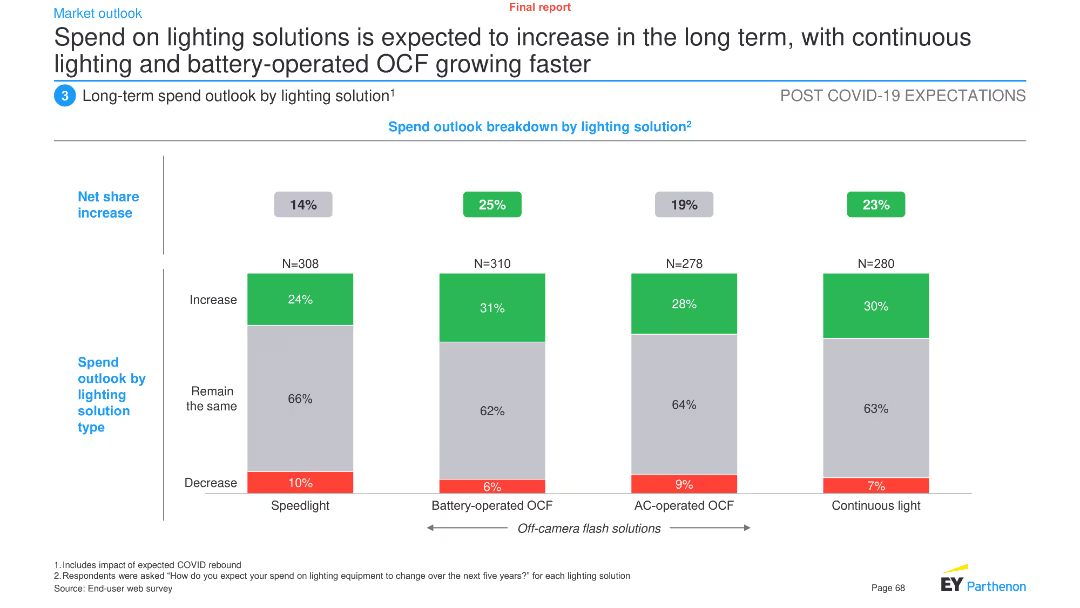
This slide features a column chart showing the net share increase in spend outlook by different lighting solutions: speedlight, battery-operated OCF, AC-operated OCF, and continuous light.
Market Analysis and Trends
Industrial & Manufacturing
The slide projects an increase in spending on lighting solutions, particularly battery-operated and continuous lighting, over the long term. It provides a breakdown of expected changes in spending across various lighting technologies.
Lighting solutions, spend outlook, long-term trends, battery-operated OCF, continuous light, speedlight, AC-operated OCF, market forecast
false
Market Analysis and Trends
Industrial & Manufacturing
Single Chart
EY
Add to my slides
Remove from favorites
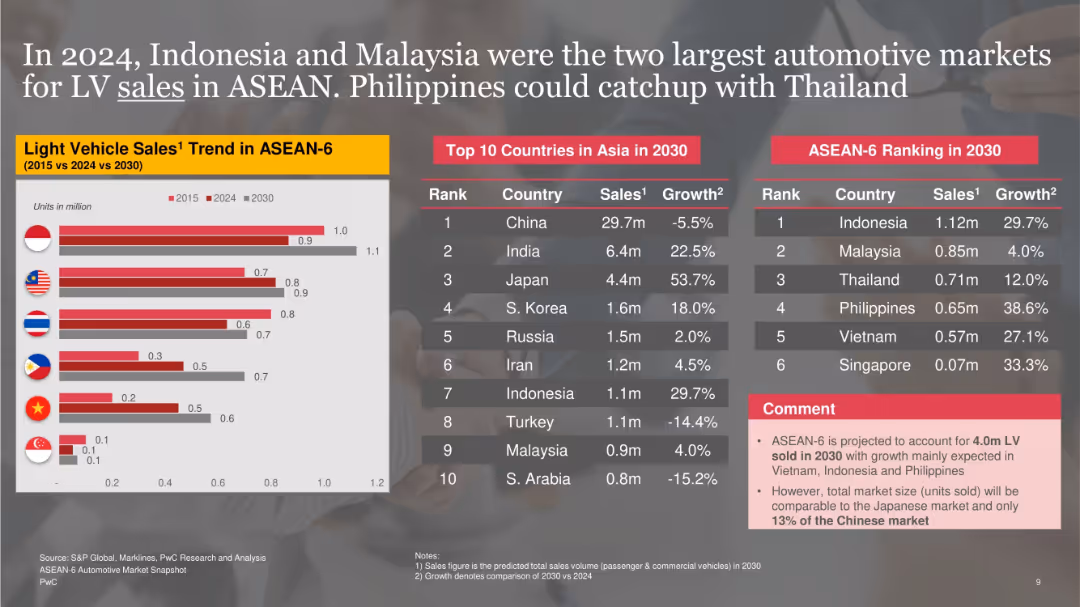
Left bar chart compares 2015, 2024, and 2030 projections for ASEAN-6 countries; right side has two ranking tables and a comment box on sales volume trends.
Market Analysis and Trends
Industrial & Manufacturing
Compares historic, current, and projected light vehicle sales in ASEAN-6. Indonesia and Malaysia remain top markets in 2024, with the Philippines expected to catch up with Thailand by 2030. Comments highlight that the region's market will remain much smaller than China’s despite internal growth.
light vehicle sales, projections, ASEAN-6, Indonesia, Malaysia, 2030, automotive market
false
Market Analysis and Trends
Industrial & Manufacturing
Mixed Chart
PwC/Strategy&
Add to my slides
Remove from favorites
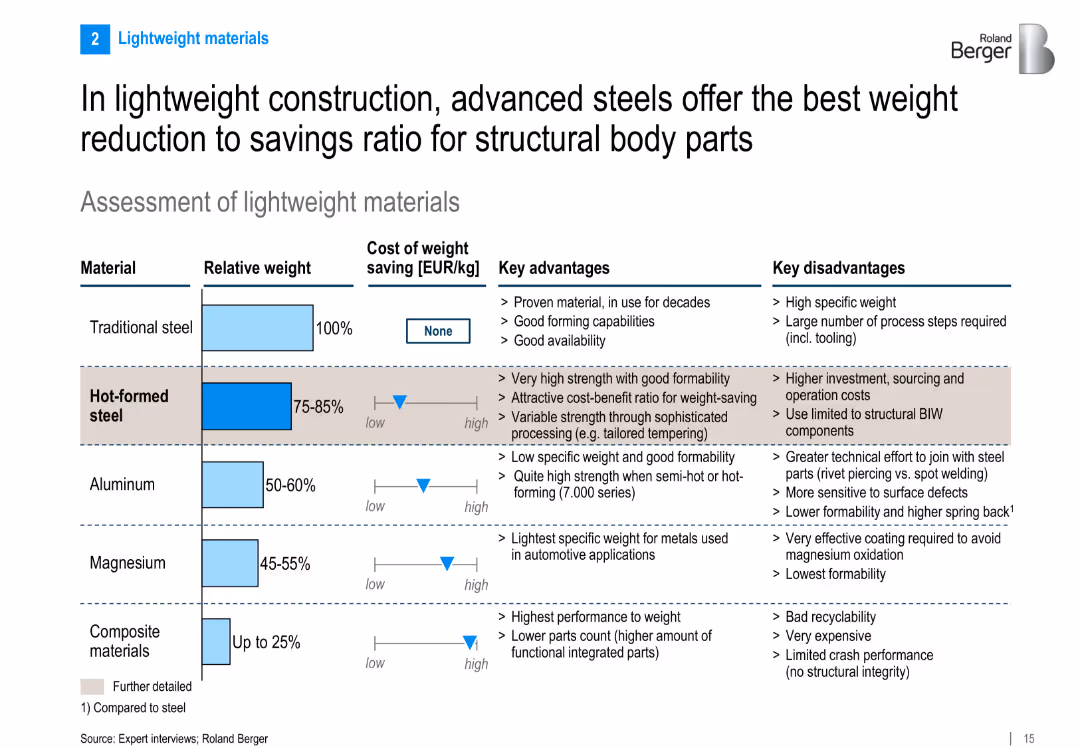
Tabular layout comparing materials (steel, aluminum, magnesium, composites) in terms of relative weight, cost of weight saving, advantages, and disadvantages
Product and Service Analysis
Industrial & Manufacturing
Compares various lightweight materials used in vehicle construction, highlighting hot-formed steel for its cost-efficiency and strength. Offers a detailed look at trade-offs in cost, formability, and recyclability across material types.
lightweight, advanced steel, cost savings, material comparison, aluminum, magnesium, composites, vehicle body
false
Product and Service Analysis
Industrial & Manufacturing
Mixed Chart
Roland Berger
Add to my slides
Remove from favorites
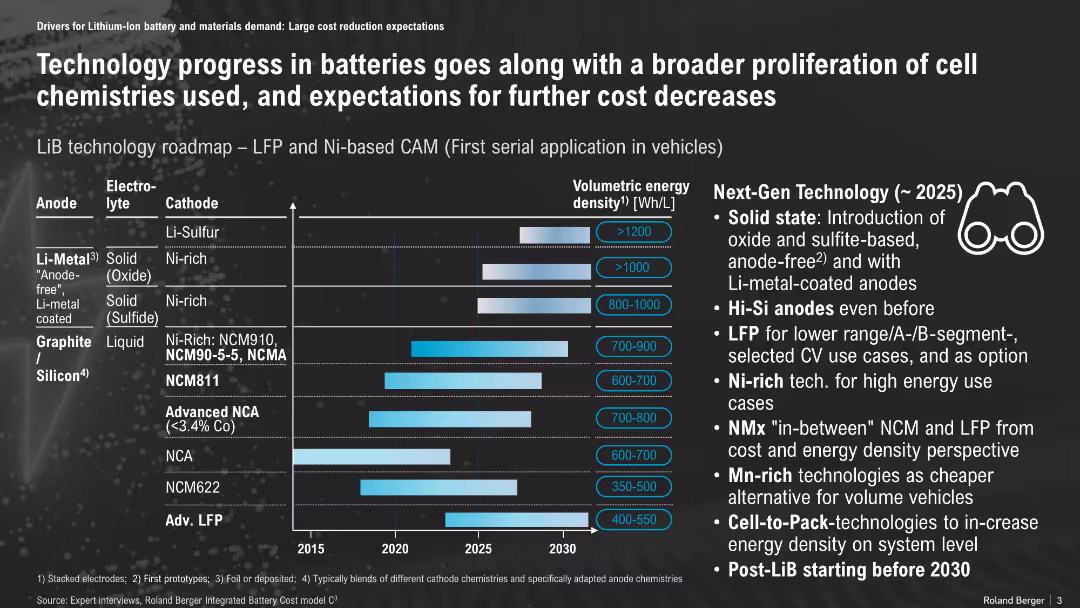
Horizontal timeline with bar chart, matrix of anode/electrolyte/cathode types and energy density projections; icons and callouts on the right
Technology and Digital Transformation
Energy & Utilities
The slide presents a roadmap of lithium-ion battery technologies, showing progress in energy density from different material combinations and their expected commercialization timeline. It emphasizes upcoming advancements like solid-state batteries, Hi-Si anodes, and LFP for specific vehicle segments.
Li-ion, battery roadmap, solid-state, energy density, LFP, NCM, anode, cathode, vehicle, cost reduction
false
Technology and Digital Transformation
Energy & Utilities
Mixed Chart
Roland Berger
Add to my slides
Remove from favorites
Dark blue background with a large vertical column chart detailing the global demand for Li-ion battery cells from 2015 to 2040, split into three sectors: mobility, energy storage systems, and consumer electronics.
Market Analysis and Trends
Energy & Utilities
The slide analyzes the growing demand for Li-ion batteries, emphasizing the impact of electric vehicles on this increase. It highlights key insights about market growth expectations and sector contributions.
Li-ion, electric vehicles, market growth, energy storage, consumer electronics
false
Market Analysis and Trends
Energy & Utilities
Mixed Chart
McKinsey
Add to my slides
Remove from favorites
This slide features a line chart comparing the likelihood of purchasing an investment property over several years. It uses two lines: one for very/somewhat likely (purple) and another for very likely (teal).
Market Analysis and Trends
Real Estate & Construction
The slide analyzes survey data on the likelihood of purchasing investment properties, indicating trends in buyer behavior and market sentiment over time.
likelihood, investment property, survey, buyer behavior, market sentiment
false
Market Analysis and Trends
Real Estate & Construction
Single Chart
IPSOS
Add to my slides
Remove from favorites
This slide features a line chart comparing the likelihood of homeowners listing their homes for sale over several years. It uses two lines: one for very/somewhat likely (purple) and another for very likely (orange).
Market Analysis and Trends
Real Estate & Construction
The slide analyzes survey data on the likelihood of homeowners listing their homes for sale, indicating trends in seller behavior and market sentiment.
likelihood, listing home, survey, seller behavior, market sentiment
false
Market Analysis and Trends
Real Estate & Construction
Single Chart
IPSOS
Add to my slides
Remove from favorites
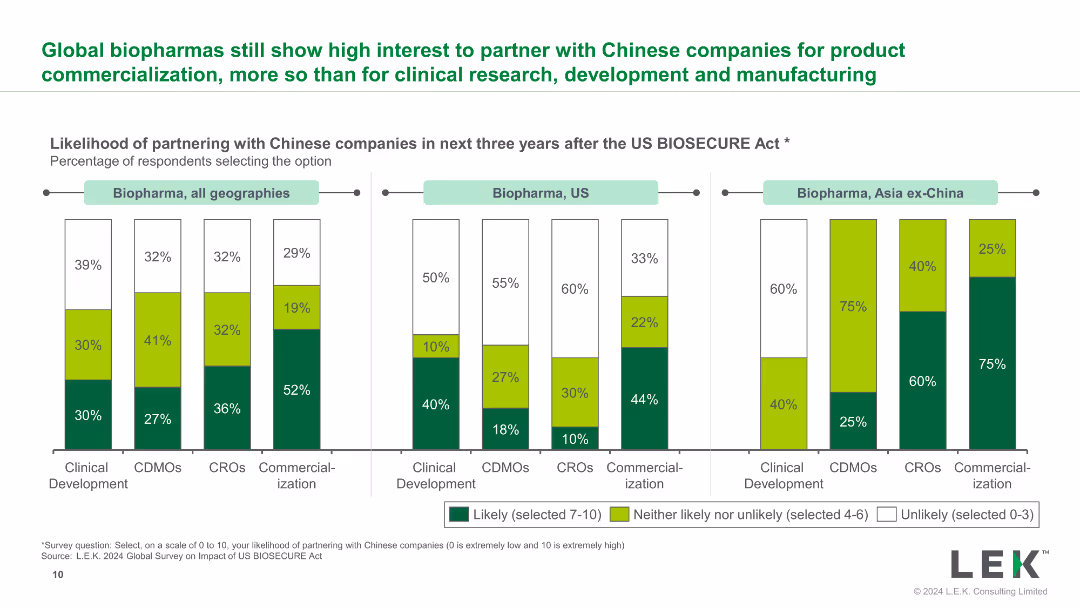
The slide features multiple bar charts indicating the likelihood of partnering with Chinese companies for various activities such as clinical development and commercialization across different regions.
Investment Analysis
Healthcare & Pharmaceuticals
This slide analyzes the likelihood of partnering with Chinese companies in the next three years post the US BIOSECURE Act, focusing on different regions and activities.
likelihood, partnering, Chinese companies, clinical development, commercialization
false
Investment Analysis
Healthcare & Pharmaceuticals
Multiple Chart
LEK
Add to my slides
Remove from favorites
Contains bar charts showing the likelihood of quitting by gender, income, generation, and caregiving responsibilities.
Market Analysis and Trends
Professional Services
Discusses the likelihood of employees quitting based on factors like gender, income, generation, and caregiving responsibilities, highlighting differences in flexibility needs.
Likelihood to quit, Gender, Income, Generation, Caregiving responsibilities
false
Market Analysis and Trends
Professional Services
Multiple Chart
EY
Add to my slides
Remove from favorites
The slide includes a donut chart and text, analyzing the likelihood of Canadians facing unexpected expenses due to COVID-19.
Risk Assessment and Management
Financial Services
It assesses the chances of Canadians encountering unexpected expenses over $5,000, with pandemic-related insights.
Likelihood, Unexpected Expenses, COVID-19, Canadians, $5,000, Donut Chart, Financial, Risk, Assessment, Analysis
false
Risk Assessment and Management
Financial Services
Mixed Chart
IPSOS
Add to my slides
Remove from favorites
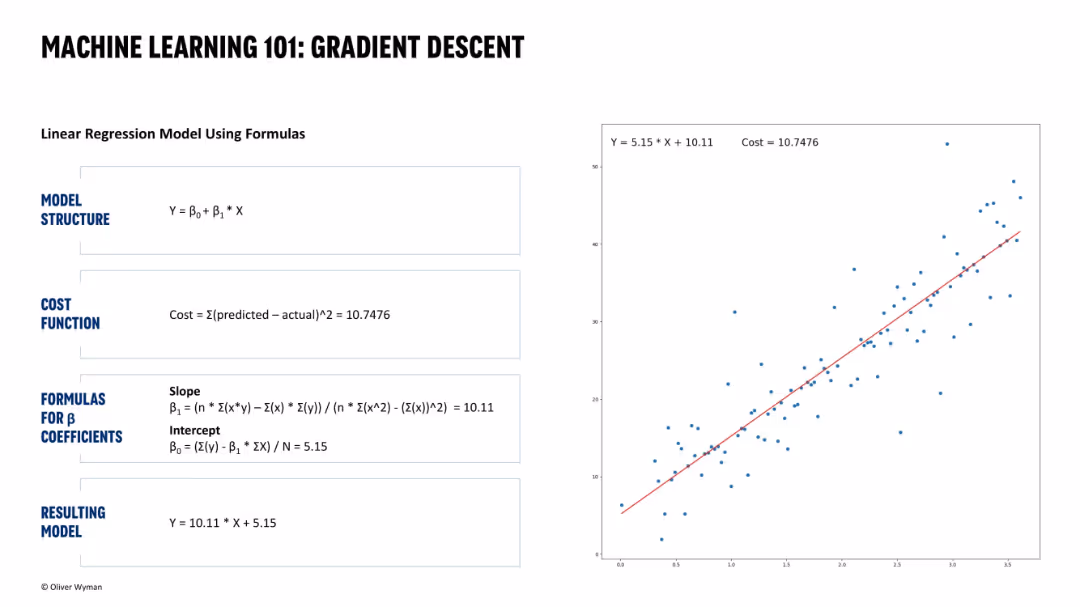
Left panel with text boxes explaining linear regression structure, cost function, formulas, and resulting model. Right side has a scatter plot with a regression line overlay.
Technology and Digital Transformation
Artificial Intelligence
Demonstrates how a linear regression model is derived using mathematical formulas, including the cost function and coefficients. The plot visualizes the model fit and cost.
linear regression, gradient descent, cost function, beta coefficients, machine learning, scatter plot, model fitting, regression line, predictive modeling, statistics
false
Technology and Digital Transformation
Artificial Intelligence
Single Chart
Oliver Wyman
Add to my slides
Remove from favorites
A line chart depicting the viewership decline of top movies over time, including titles like Don’t Look Up, Red Notice, and Encanto.
Performance Metrics and KPIs
Media & Entertainment
This slide analyzes the sharp decline in viewership minutes for popular movies shortly after release, emphasizing the transient nature of interest.
line chart, movies, viewership, decline, entertainment, trends
false
Performance Metrics and KPIs
Media & Entertainment
Single Chart
Nielsen
Add to my slides
Remove from favorites
A line chart showing minutes watched for various TV shows over 13 weeks. The chart includes series like Shameless, NCIS, Cocomelon, Seinfeld, and Criminal Minds.
Performance Metrics and KPIs
Media & Entertainment
The slide tracks the viewing minutes for different TV shows, illustrating their performance stability over time.
line chart, TV shows, viewing minutes, performance, stability, entertainment
false
Performance Metrics and KPIs
Media & Entertainment
Single Chart
Nielsen
Add to my slides
Remove from favorites
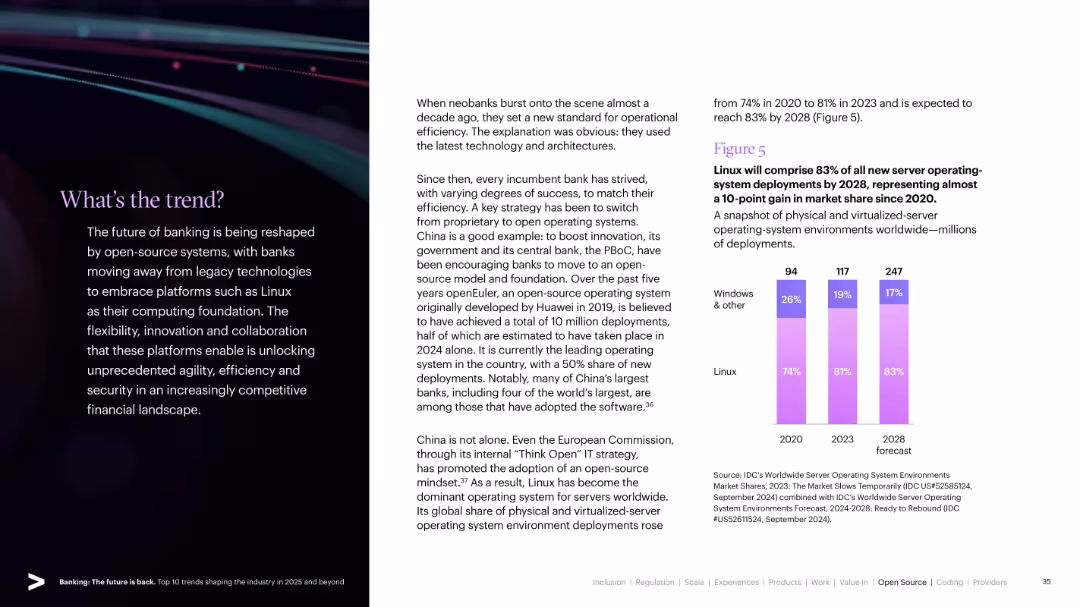
Split design with stylized visuals and trend text on left; bar chart on right showing growth of Linux server deployments.
Technology and Digital Transformation
Technology & Software
Explores the adoption of open-source platforms, particularly Linux, in banking IT systems. Highlights operational efficiency and future server OS dominance projected by 2028.
Linux, Open Source, Banking IT, Efficiency, Server Deployment, Digital Core, Technology Shift
false
Technology and Digital Transformation
Technology & Software
Mixed Chart
Accenture
Add to my slides
Remove from favorites
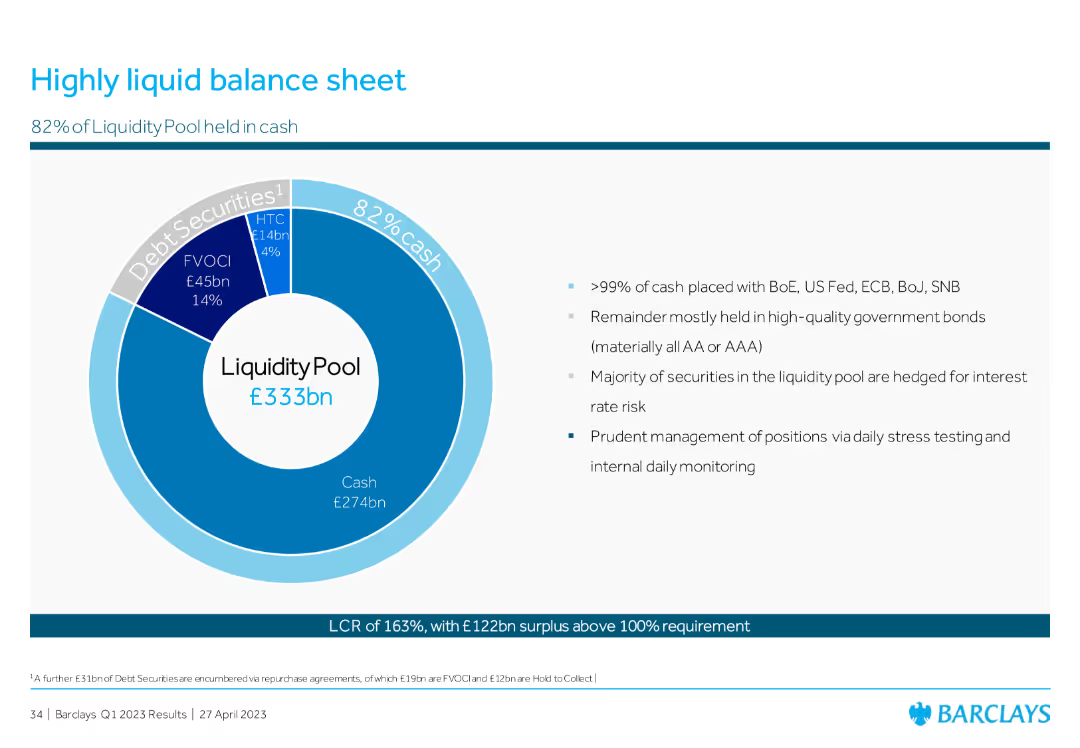
The slide contains a pie chart detailing the composition of the liquidity pool and bullet points explaining liquidity management strategies.
Financial Performance
Financial Services
This slide highlights the liquidity position, focusing on the composition and management of the liquidity pool, showing a high percentage of cash and prudent management practices to ensure financial stability.
liquidity, balance sheet, cash, management, stability
false
Financial Performance
Financial Services
Mixed Chart
Barclays
Add to my slides
Remove from favorites
Bar chart of liquidity coverage ratio trends and a donut chart of liquidity pool composition, emphasizing high-quality liquid assets and securities.
Financial Performance
Financial Services
Presentation of liquidity coverage ratio and the composition of UBS's liquidity pool, highlighting high-quality liquid assets.
Liquidity, coverage, assets, securities, cash
false
Financial Performance
Financial Services
Multiple Chart
UBS
Add to my slides
Remove from favorites
Column chart shows liquidity coverage ratio changes from 3Q22 to 4Q22. Bullets highlight key actions taken to rebuild liquidity.
Risk Assessment and Management
Financial Services
Describes actions taken to improve the liquidity coverage ratio to 144%, supported by capital raises and deleveraging, improving financial stability.
liquidity coverage, financial stability, capital raises, deleveraging, risk management
false
Risk Assessment and Management
Financial Services
Mixed Chart
Credit Suisse
Add to my slides
Remove from favorites
The slide features a column chart showing the liquidity coverage ratio over quarters and a doughnut chart displaying asset composition. The layout is balanced with clear labels and minimal text.
Financial Performance
Financial Services
This slide provides an overview of liquidity coverage ratios and the composition of high-quality liquid assets, highlighting key figures for 2Q23.
liquidity, coverage ratio, assets, financial, stability, UBS, 2Q23, high-quality, liquid, stress testing
false
Financial Performance
Financial Services
Multiple Chart
UBS
Add to my slides
Remove from favorites
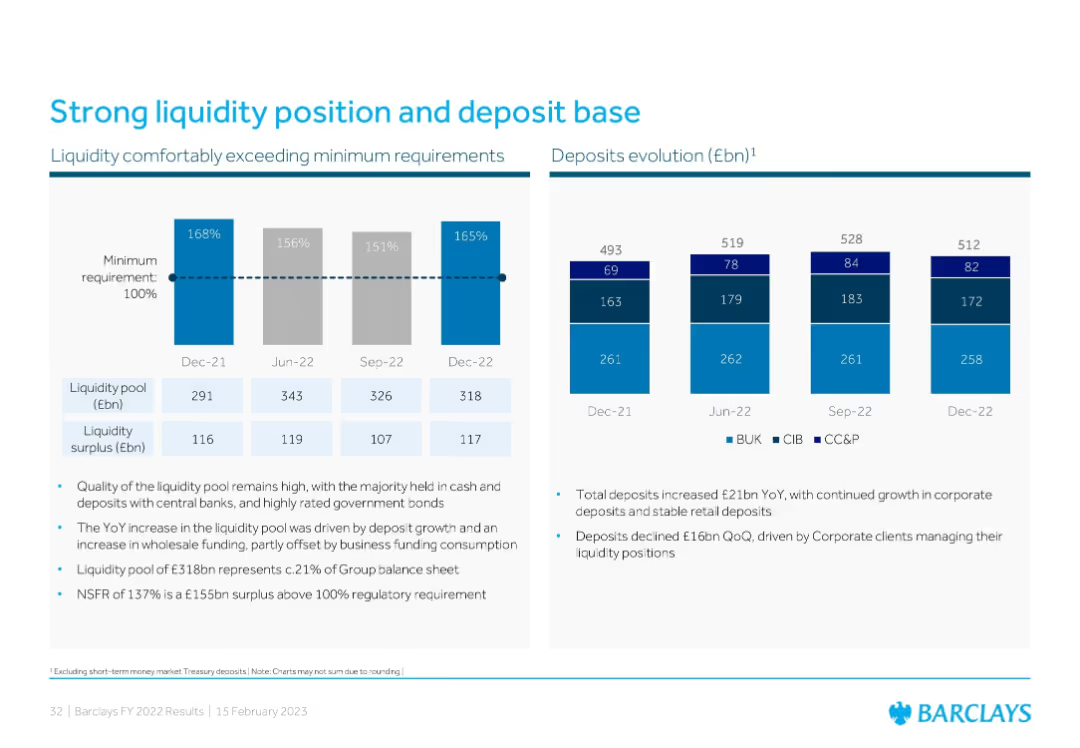
Two visual sections: bar chart for liquidity ratios and pool sizes over four dates; another bar chart tracking deposit base evolution by business unit.
Financial Performance
Financial Services
This slide emphasizes Barclays' strong liquidity position and stable deposit base. It highlights how liquidity comfortably exceeds minimum regulatory requirements and details year-over-year and quarter-over-quarter deposit movements across BUK, CIB, and CC&P segments.
liquidity, deposit base, regulatory compliance, Barclays, surplus
false
Financial Performance
Financial Services
Multiple Chart
Barclays
Add to my slides
Remove from favorites
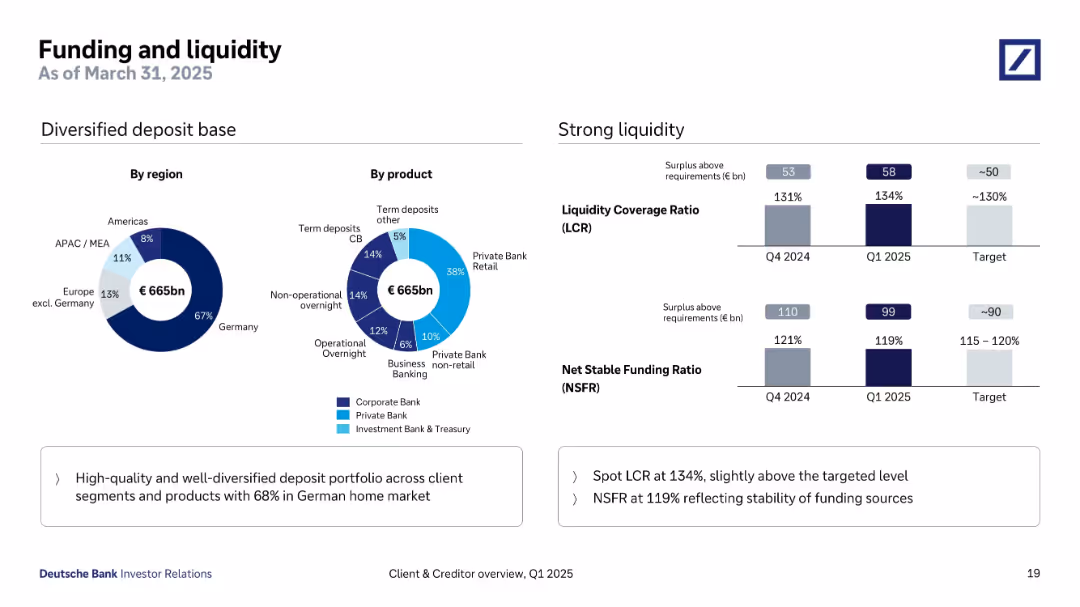
Two donut charts (by region and product) on left, bar graphs on right (LCR and NSFR), with explanatory text boxes beneath each section. Balanced use of corporate blue tones and intuitive icons.
Financial Performance
Financial Services
Demonstrates a diversified €665bn deposit base by region and product, with strong liquidity metrics (LCR 134%, NSFR 119%). Reinforces Deutsche Bank’s funding stability and excess coverage over regulatory liquidity requirements.
liquidity, deposits, LCR, NSFR, diversification, funding sources
false
Financial Performance
Financial Services
Multiple Chart
Deutsche Bank
Add to my slides
Remove from favorites
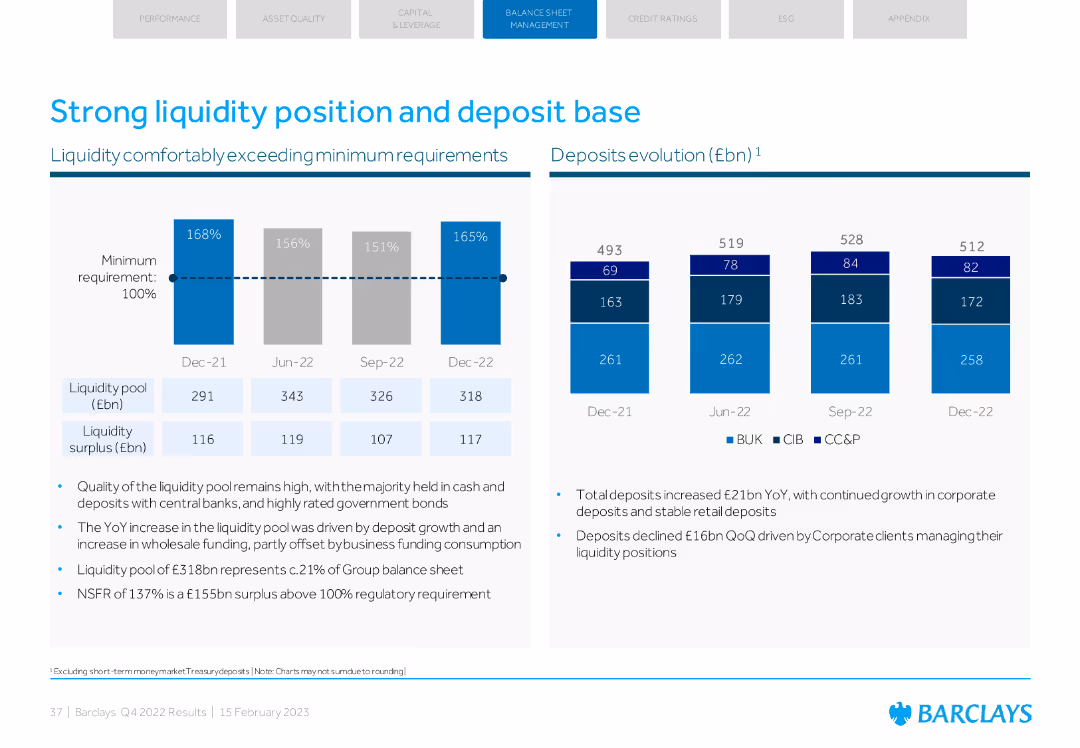
Bar and column charts depicting liquidity ratios, pool size, and deposit evolution.
Risk Assessment and Management
Financial Services
Highlights Barclays' liquidity position, exceeding minimum requirements, and deposit evolution over the year, showcasing stability and growth in deposits.
liquidity, deposits, stability, growth, requirements
false
Risk Assessment and Management
Financial Services
Multiple Chart
Barclays
Add to my slides
Remove from favorites
This slide presents a column chart depicting liquidity. The column chart shows 'Cash & Equivalents' and 'ESG linked RCF 2021', and shows 'Unconfirmed Credit Lines' and 'Available Liquidity', highlighted in red. Each bar/column has a monetary value labeled.
Financial Performance
Financial Services
The slide details the group's financial flexibility through available credit lines and cash in hand. New ESG Credit Line and existing credit lines are quantified, culminating in total liquidity. Used for illustrating financial stability and analyzing credit strategy.
liquidity, ESG, credit, financial flexibility, stability
false
Financial Performance
Financial Services
Single Chart
Goldman Sachs
Add to my slides
Remove from favorites
Contains pie and column charts detailing liquidity coverage and net stable funding ratios, with qualitative key highlights.
Financial Performance
Financial Services
Reviews the bank's liquidity and funding status, highlighting improvements and strategies to maintain robust financial health.
liquidity, funding, finance, LCR, NSFR, stability
false
Financial Performance
Financial Services
Multiple Chart
Deutsche Bank
Add to my slides
Remove from favorites
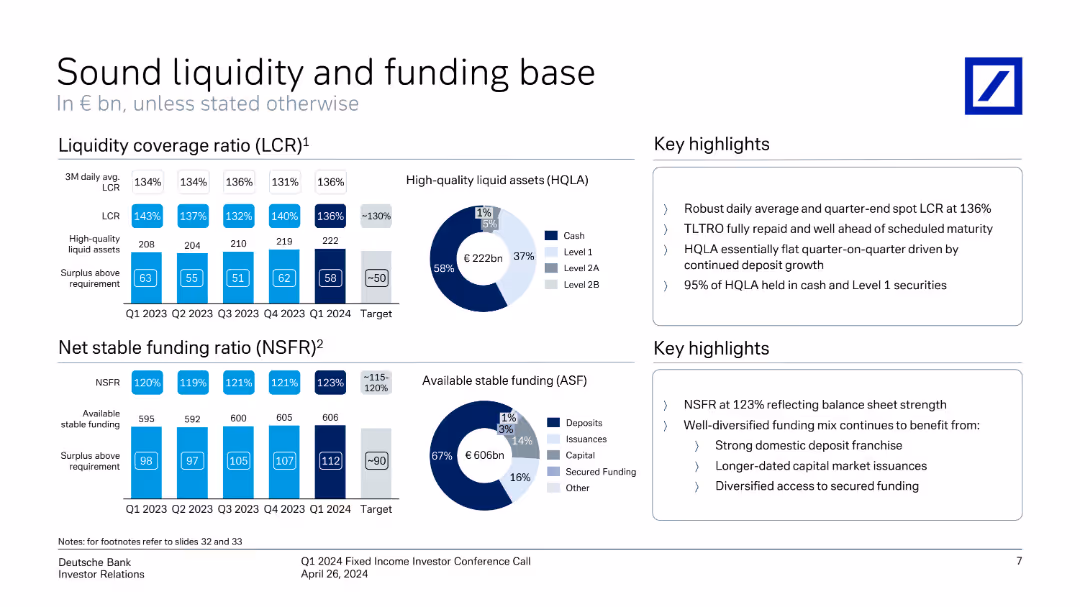
The slide features vertical column charts and a pie chart showing liquidity coverage ratios and net stable funding ratios, with key highlights on the right.
Financial Performance
Financial Services
The slide demonstrates Deutsche Bank's robust liquidity and funding base, presenting ratios and the composition of high-quality liquid assets and funding sources.
liquidity, funding, financial stability, ratios, Deutsche Bank, Q1 2024, investor relations, high-quality liquid assets, net stable funding, financial health
false
Financial Performance
Financial Services
Multiple Chart
Deutsche Bank
Add to my slides
Remove from favorites
Features column charts and pie charts on bank's funding and liquidity status, depicting diverse deposit bases and liquidity ratios with target comparisons.
Investment Analysis
Financial Services
Evaluates the bank's liquidity management and funding diversity, critical for understanding its capacity to meet financial obligations and investment needs.
Liquidity, funding, ratios, financial health
false
Investment Analysis
Financial Services
Multiple Chart
Deutsche Bank
Add to my slides
Remove from favorites
The slide features a blue and white color scheme with two main charts showing the Liquidity Coverage Ratio (LCR) and Net Stable Funding Ratio (NSFR) over several quarters. Key highlights are presented in bullet points alongside the charts.
Financial Performance
Financial Services
This slide provides a quarterly analysis of liquidity and funding metrics, detailing trends in Liquidity Coverage Ratio and Net Stable Funding Ratio, highlighting compliance with financial regulatory requirements, and implications for financial stability and strategic financial planning.
liquidity, funding, regulatory, financial, stability
false
Financial Performance
Financial Services
Multiple Chart
Deutsche Bank
Add to my slides
Remove from favorites
This slide features a vertical column chart illustrating the drawn SNB liquidity facilities over various dates. On the left, there is text highlighting key liquidity ratios (LCR and NSFR) and repayment details.
Financial Performance
Financial Services
The slide presents UBS's management of liquidity and funding, highlighting key ratios like LCR and NSFR, and showing the repayment of SNB facilities over time. It is used to show financial stability and management effectiveness.
Liquidity, funding, SNB facilities, LCR, NSFR
false
Financial Performance
Financial Services
Mixed Chart
UBS
Add to my slides
Remove from favorites
Features a divided column chart and a stacked bar chart with legends and percentages. The layout is clear, directing focus to the composition changes over time.
Risk Assessment and Management
Financial Services
Focuses on liquidity levels and high-quality liquid assets (HQLA), useful in discussions about financial stability and risk management.
liquidity, HQLA, stability, financial management
false
Risk Assessment and Management
Financial Services
Single Chart
JP Morgan
Add to my slides
Remove from favorites
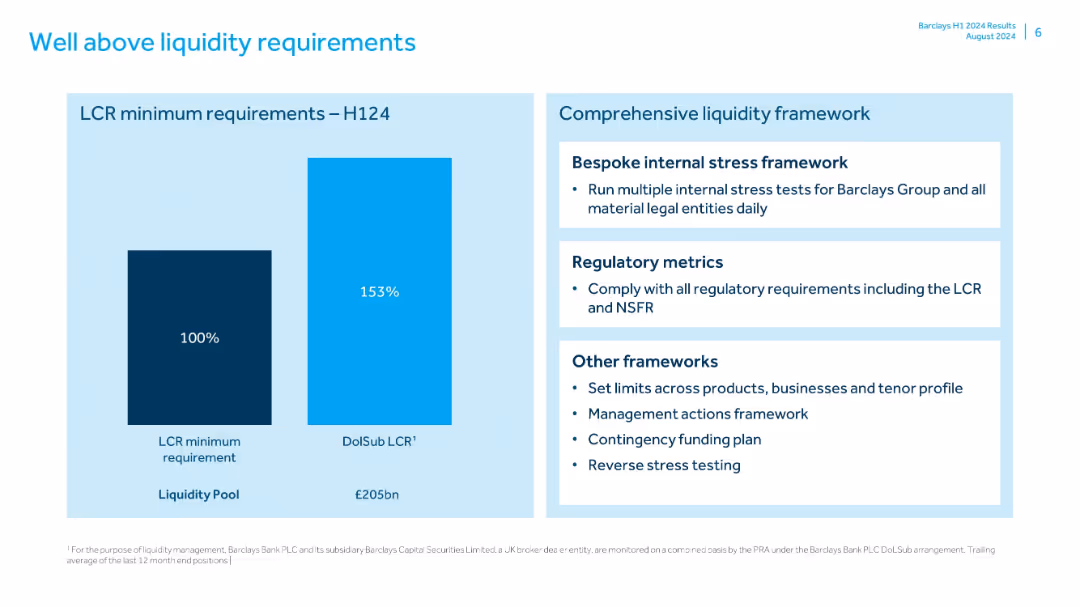
Two-part layout: bar chart on left and bullet summary on right; simple visual style with blue color theme
Risk Assessment and Management
Financial Services
Highlights Barclays’ liquidity coverage ratio (LCR) significantly above minimums in H1 2024. Also describes the comprehensive liquidity framework including stress testing, regulatory compliance, and contingency planning.
liquidity, LCR, Barclays, H1 2024, stress testing, funding plan, risk management, liquidity pool
false
Risk Assessment and Management
Financial Services
Mixed Chart
Barclays
Add to my slides
Remove from favorites
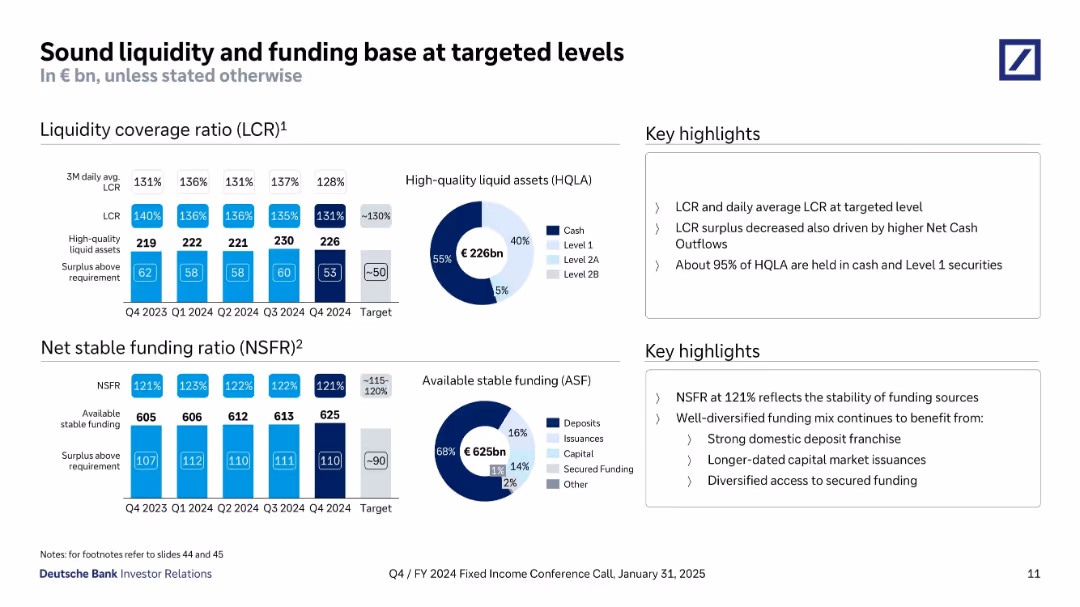
Two panels with grouped bar charts for LCR and NSFR on the left; donut charts for asset and funding composition on the right. Text highlights align with respective metrics.
Risk Assessment and Management
Financial Services
This slide evaluates Deutsche Bank’s liquidity and funding positions, showing a Liquidity Coverage Ratio around 130% and a Net Stable Funding Ratio of 121%. Composition of high-quality liquid assets and available stable funding is detailed.
liquidity, LCR, NSFR, funding, HQLA, ASF, risk management
false
Risk Assessment and Management
Financial Services
Multiple Chart
Deutsche Bank
Add to my slides
Remove from favorites
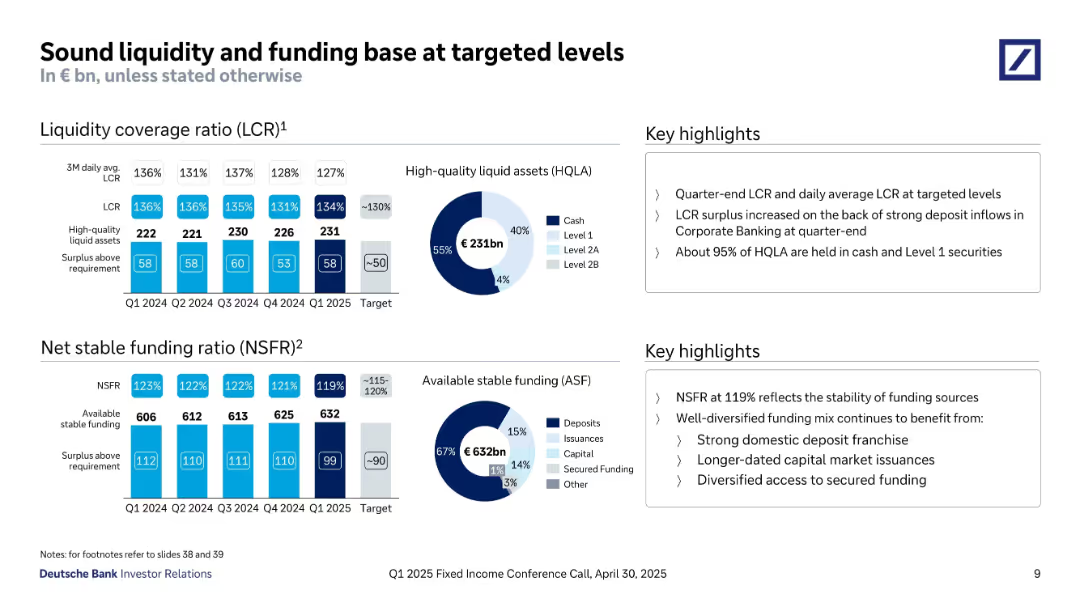
Two major sections with bar charts (LCR & NSFR), donut charts (liquidity and funding composition), and textual highlights on the right.
Risk Assessment and Management
Financial Services
The slide outlines Deutsche Bank’s liquidity and funding ratios in Q1 2025. LCR stands at 127%, NSFR at 119%, both within target ranges. It emphasizes stable high-quality liquid assets and strong deposit-based funding structure.
Liquidity, LCR, NSFR, Funding, Stability, HQLA, Surplus, Risk Management, Targeted Levels, Q1 2025
false
Risk Assessment and Management
Financial Services
Multiple Chart
Deutsche Bank
Add to my slides
Remove from favorites
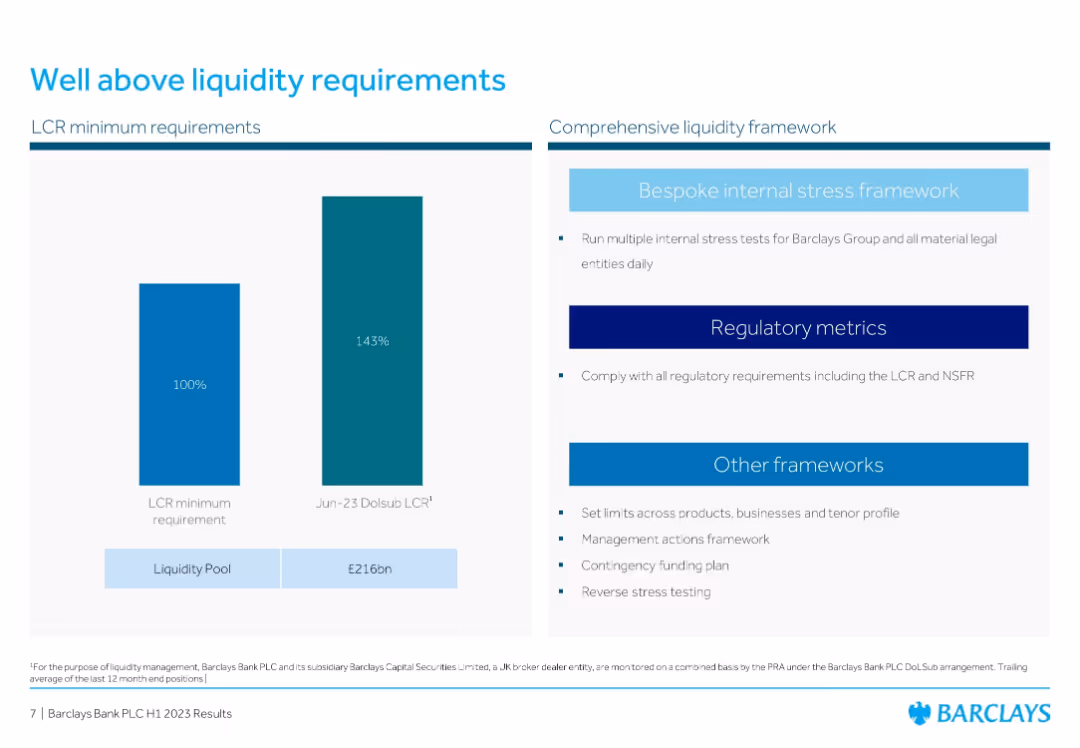
Two-bar comparison chart (LCR min vs. Barclays) and bullet list of liquidity frameworks
Risk Assessment and Management
Financial Services
Highlights Barclays' liquidity coverage ratio of 143% against a 100% requirement, supported by a £216bn liquidity pool. Also outlines the bank's internal and regulatory frameworks to manage liquidity risks.
Liquidity, LCR, Stress Testing, Barclays, Risk Management, Financial Compliance, Resilience
false
Risk Assessment and Management
Financial Services
Mixed Chart
Barclays
Add to my slides
Remove from favorites
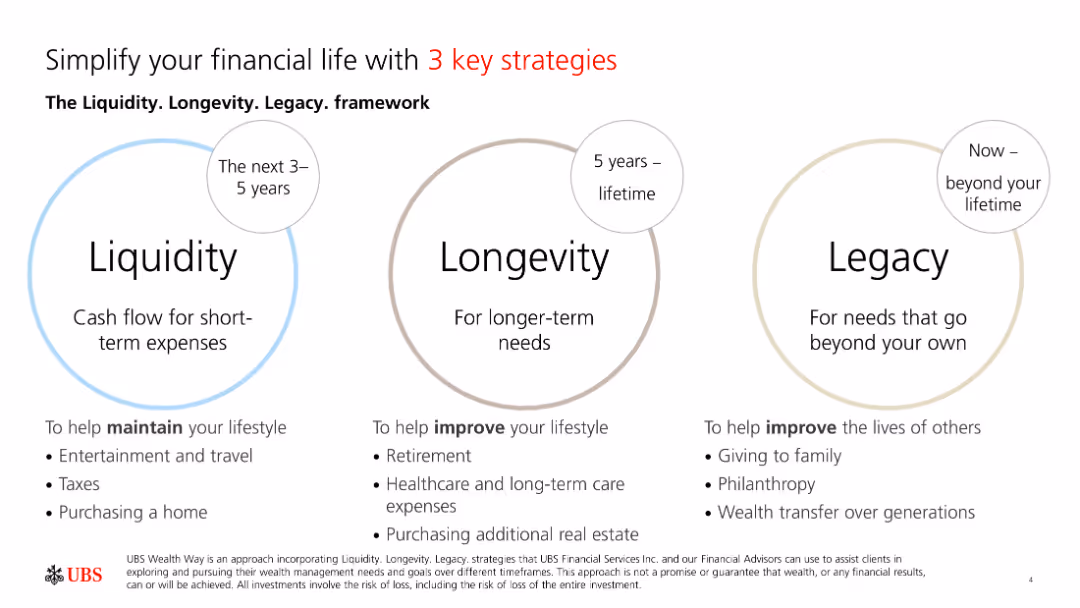
The slide contains three circular diagrams labeled Liquidity, Longevity, and Legacy, each representing different financial strategies over timeframes.
Strategic Planning
Financial Services
The slide introduces the Liquidity, Longevity, and Legacy framework, highlighting strategies for maintaining lifestyle, long-term needs, and beyond lifetime.
Liquidity, Longevity, Legacy, Strategies, Finance
false
Strategic Planning
Financial Services
Framework
UBS
Add to my slides
Remove from favorites
The slide contains a dual-section layout with text-based principles on the left and key liquidity metrics on the right in rectangular callouts. The design is straightforward and focused on clarity of information.
Risk Assessment and Management
Financial Services
Discussing principles of liquidity management, the slide highlights the firm's strategies to maintain a robust liquidity position. Appropriate for briefings on financial risk management, illustrating conservative liquidity principles and current liquidity metrics.
Liquidity Management, Financial Risk, Principles, Metrics, Conservative Approach
false
Risk Assessment and Management
Financial Services
Header Horizontal
Goldman Sachs
Add to my slides
Remove from favorites
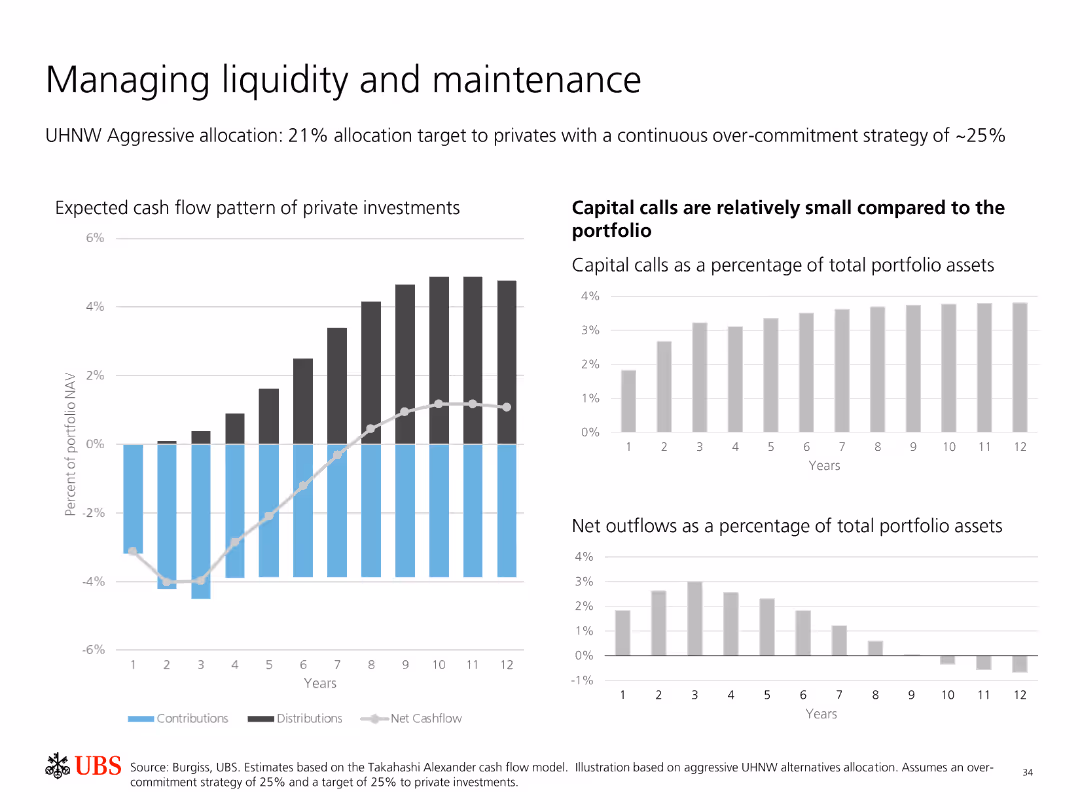
Contains multiple bar charts showing expected cash flow patterns of private investments, capital calls, and net outflows as a percentage of total portfolio assets.
Financial Performance
Financial Services
Analyzes liquidity management and maintenance in private investments, highlighting expected cash flows, capital calls, and net outflows relative to portfolio assets.
Liquidity Management, Private Investments, Cash Flow, Capital Calls, Net Outflows, Portfolio, Strategy, Analysis, Maintenance
false
Financial Performance
Financial Services
Multiple Chart
UBS
Add to my slides
Remove from favorites
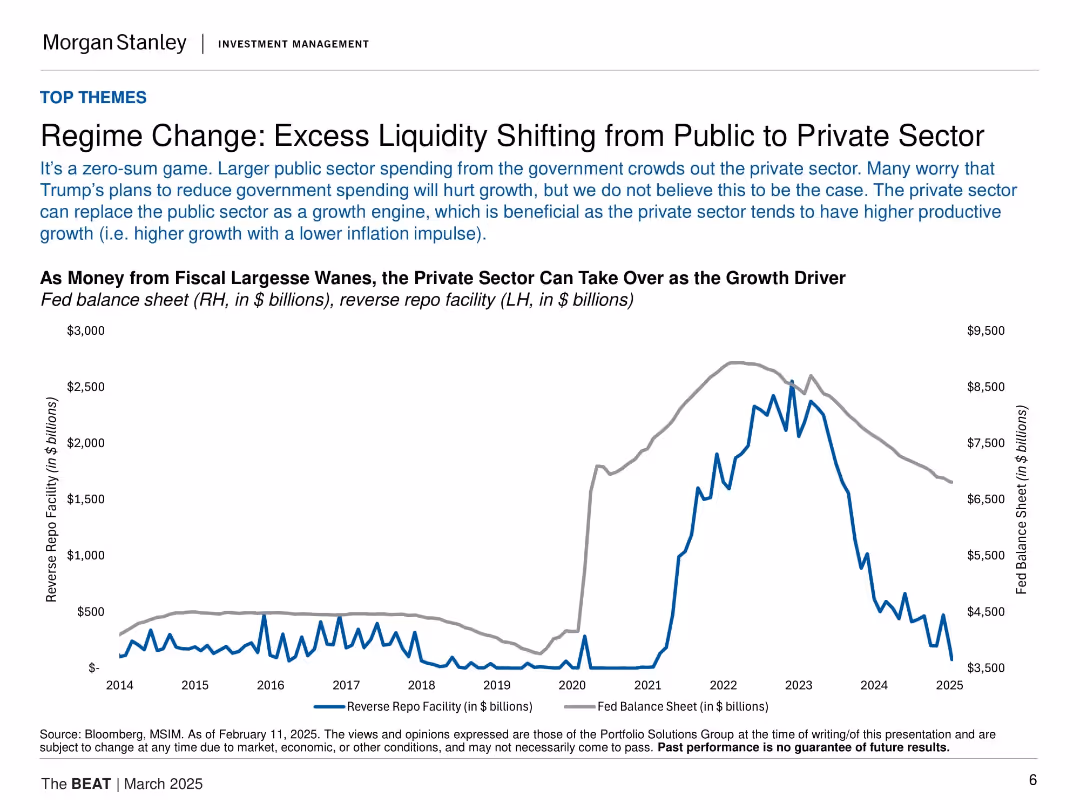
Title at top, dual-axis line chart in center showing Fed balance sheet and reverse repo facility over time. Plain white background, minimal layout.
Market Analysis and Trends
Financial Services
The slide argues that reduced government spending shifts liquidity to the private sector, which may boost economic productivity. It uses data on the Fed's balance sheet and reverse repo facility to highlight this liquidity shift from 2014 to 2025.
liquidity, public sector, private sector, Fed, balance sheet, reverse repo, economic growth, inflation, monetary policy
false
Market Analysis and Trends
Financial Services
Single Chart
Morgan Stanley
Add to my slides
Remove from favorites
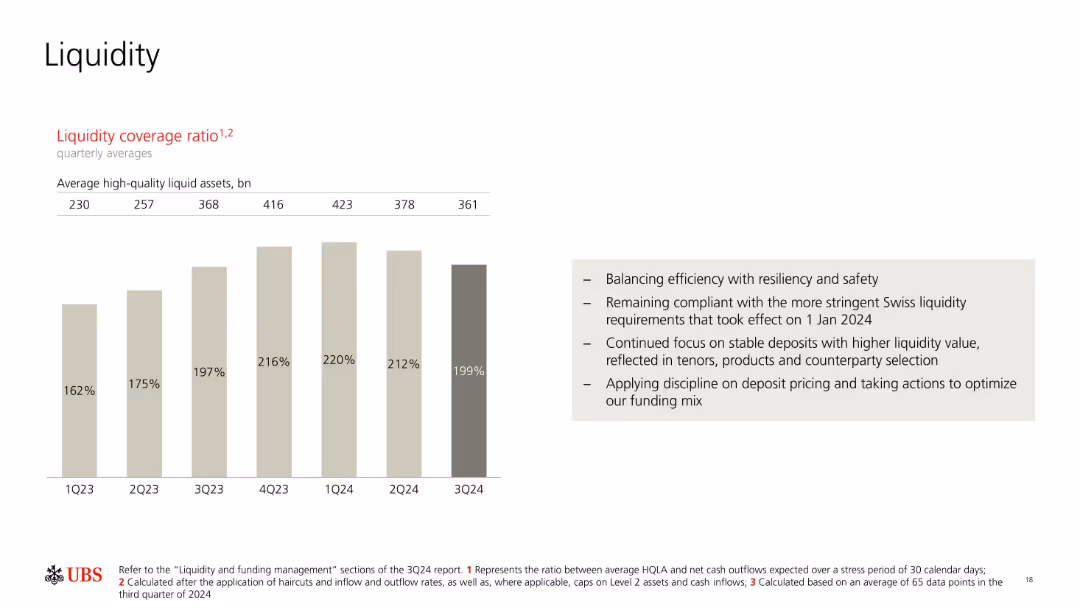
Bar chart with light beige and gray tones showing liquidity coverage ratio across quarters; bulleted text box on right with summary points.
Risk Assessment and Management
Financial Services
The slide presents UBS’s liquidity coverage ratio from 1Q23 to 3Q24, showing a steady rise and recent decline. Supporting notes highlight the bank’s focus on balancing safety and efficiency, regulatory compliance, and disciplined funding strategies to optimize deposits.
liquidity ratio, high-quality assets, funding mix, UBS, compliance, Swiss regulation, deposits, quarterly trends, liquidity management
false
Risk Assessment and Management
Financial Services
Mixed Chart
UBS
Add to my slides
Remove from favorites
Pie chart showing liquidity pool composition; column charts show LCR trends and TF SME impacts.
Regulatory and Compliance
Financial Services
Discusses liquidity coverage ratios and balance sheet management strategies over the coming years.
liquidity, regulations, balance sheet, cash management, LCR
false
Regulatory and Compliance
Financial Services
Multiple Chart
Barclays
Add to my slides
Remove from favorites
Displays a structured list of client challenges and solutions next to a blue column graph depicting product results.
Risk Assessment and Management
Financial Services
Explains how leveraging risk management expertise provides scalable liquidity solutions, resulting in market leadership.
liquidity, risk expertise, scalable solutions, electronic trading, market leadership, Goldman Sachs, institutional liquidity
false
Risk Assessment and Management
Financial Services
Table
Goldman Sachs
Add to my slides
Remove from favorites
The slide features a title, a checklist describing the liquidity management approach, and a column chart showing the "Average Liquidity Coverage Ratio" trend over quarters, with a comparison to U.S. peer average.
Risk Assessment and Management
Financial Services
This slide communicates Goldman Sachs' conservative approach to liquidity risk management, highlighting its methodologies and asset allocations, complemented by a column chart showing liquidity coverage ratios over time in comparison to industry peers.
liquidity, risk management, trend analysis, financial stability, benchmarking
false
Risk Assessment and Management
Financial Services
Mixed Chart
Goldman Sachs
Add to my slides
Remove from favorites
A column chart shows liquidity coverage ratio trends alongside bullet points detailing liquidity risk management strategies, presented on a white and blue slide.
Risk Assessment and Management
Financial Services
The slide describes liquidity risk management strategies and trends in liquidity coverage ratios, underlining the company's robust position and regulatory compliance. It's meant to communicate a strong and adaptable approach to liquidity risk.
liquidity risk, management, trends, compliance
false
Risk Assessment and Management
Financial Services
Mixed Chart
Goldman Sachs
Add to my slides
Remove from favorites
This slide is text-heavy with a split layout. The left side displays a column chart titled 'Liquidity Ratio Components', and the right side features a column chart comparing 'Average Liquidity Coverage Ratio Trend' across different quarters. Text content explains the liquidity risk management strategy.
Risk Assessment and Management
Financial Services
Focuses on liquidity risk, showcasing components and trends in coverage ratios, and is ideal for financial managers or analysts looking at liquidity risk preparedness and regulatory compliance.
liquidity risk, risk management, bar chart, financial stability, coverage ratio, regulatory compliance, risk assessment, asset management, stress scenario, financial oversight
false
Risk Assessment and Management
Financial Services
Multiple Chart
Goldman Sachs
Add to my slides
Remove from favorites
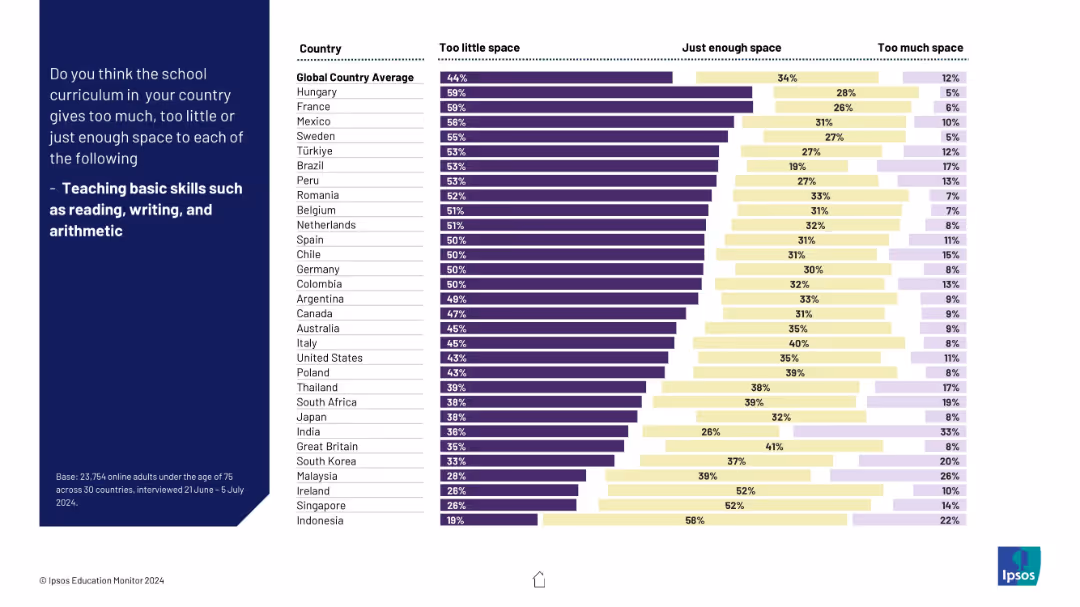
Horizontal bar chart by country with “Too little”, “Just enough”, and “Too much” segments; bold text blocks.
Market Analysis and Trends
Education & Training
This slide examines whether the public believes core skills (reading, writing, arithmetic) are adequately covered in school curricula. Many countries rate this area as underrepresented, particularly in emerging markets.
literacy, arithmetic, education basics, curriculum, foundational skills, public opinion, global, Ipsos, education focus, country ranking
false
Market Analysis and Trends
Education & Training
Mixed Chart
IPSOS
Add to my slides
Remove from favorites
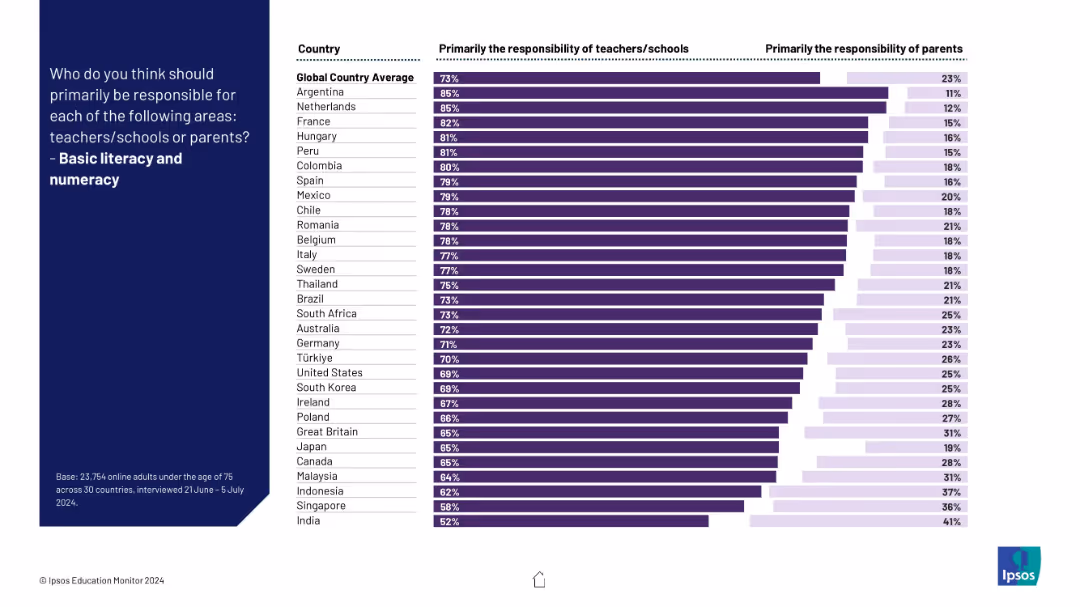
Bar chart comparing countries on whether teachers/schools or parents are viewed as primarily responsible; dark purple for schools, light purple for parents.
Strategic Planning
Education & Training
This slide presents survey results from 30 countries showing which group—teachers/schools or parents—is considered primarily responsible for basic literacy and numeracy.
literacy, numeracy, education, responsibility, global survey, schools, parents, Ipsos, countries, chart
false
Strategic Planning
Education & Training
Mixed Chart
IPSOS
Add to my slides
Remove from favorites
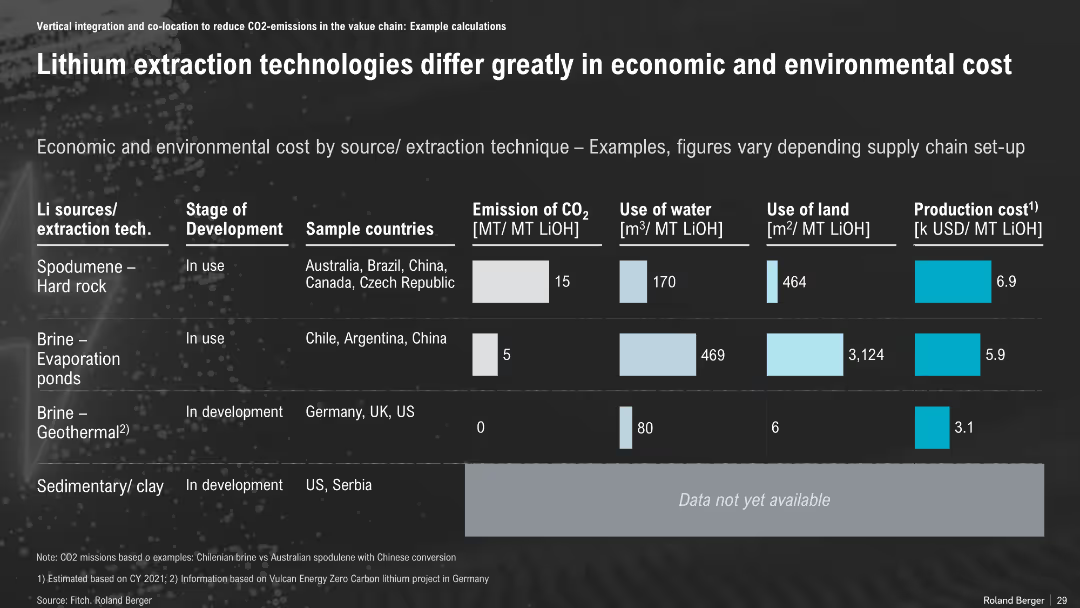
Table format comparing lithium extraction methods; includes emissions, water use, land use, and cost across extraction types
Technology and Digital Transformation
Environmental Services & Sustainability
The slide compares four lithium extraction technologies, highlighting trade-offs in CO₂ emissions, land and water use, and costs. Geothermal brine shows strong environmental and economic performance, while evaporation ponds are most resource-intensive.
Lithium Extraction, Environmental Cost, Geothermal, Hard Rock, Brine, CO₂, Water Use, Land Use
false
Technology and Digital Transformation
Environmental Services & Sustainability
Single Chart
Roland Berger
Add to my slides
Remove from favorites
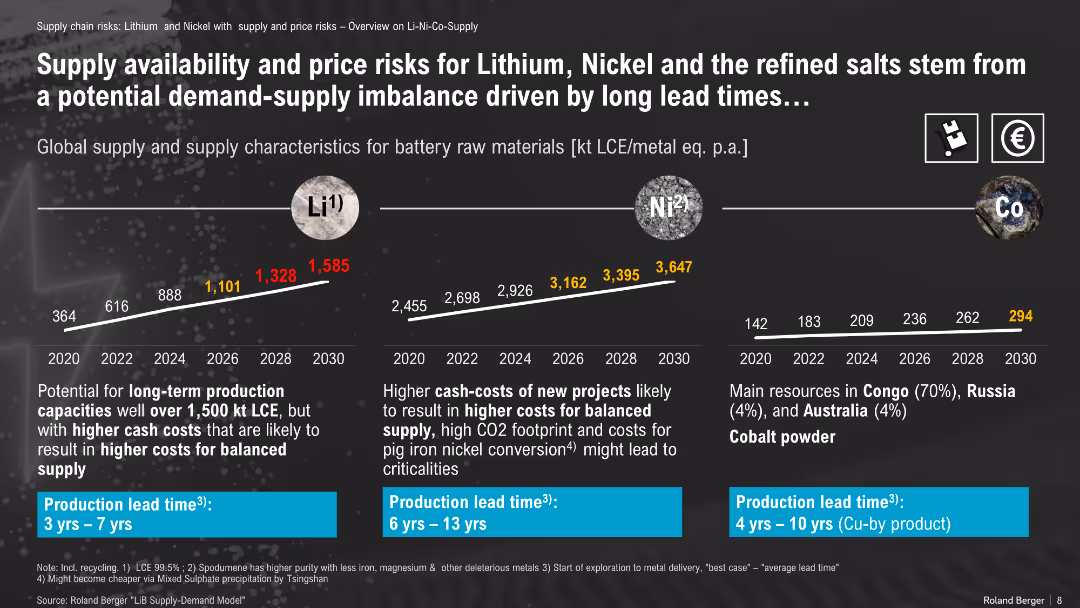
Line graph projections of material supply (Li, Ni, Co); includes mining lead times and cost risks
Risk Assessment and Management
Energy & Utilities
This slide outlines projected global supply of key battery materials (Li, Ni, Co) and highlights risks like high lead times and cost volatility due to mining complexity, regional concentration, and new project economics.
lithium, nickel, cobalt, supply chain, price risk, mining lead time, critical materials
false
Risk Assessment and Management
Energy & Utilities
Mixed Chart
Roland Berger
Add to my slides
Remove from favorites
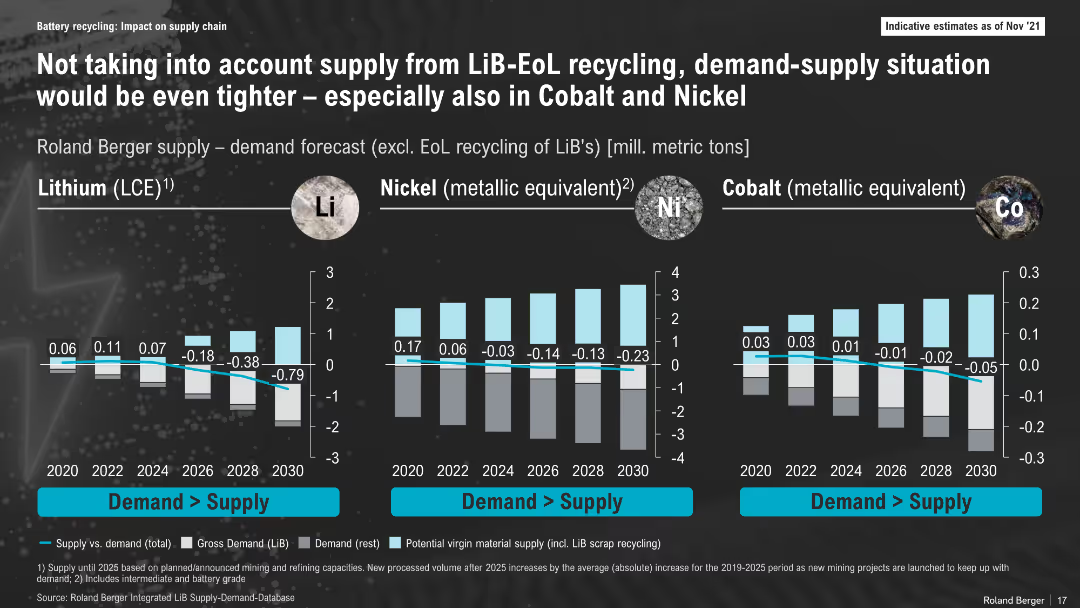
Bar chart layout comparing lithium, nickel, and cobalt supply-demand gaps over time (2020–2030); dark background, labeled vertical axes, colored bars and annotations for deficits
Risk Assessment and Management
Energy & Utilities
This slide illustrates projected shortfalls in lithium, nickel, and cobalt supply versus demand, excluding End-of-Life (EoL) recycling. It highlights a worsening deficit, particularly for lithium, emphasizing the importance of integrating recycling into future supply models.
Lithium, Nickel, Cobalt, Supply Gap, Forecast, Battery Materials, 2030, Mining, Recycling, Shortfall
false
Risk Assessment and Management
Energy & Utilities
Multiple Chart
Roland Berger
Add to my slides
Remove from favorites
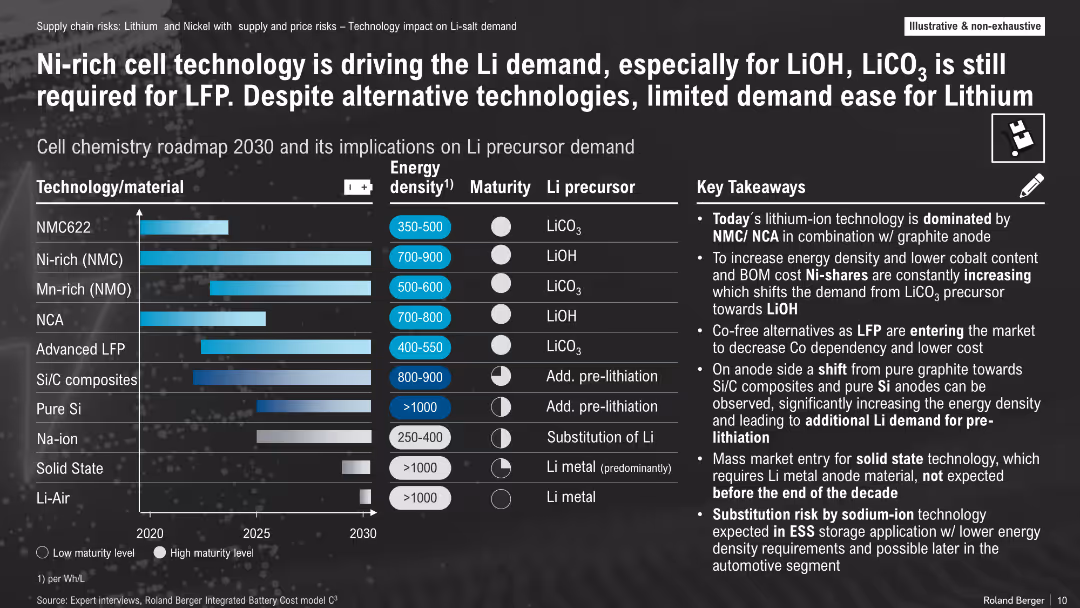
Matrix of technologies vs. energy density, maturity, and lithium precursor types; bulleted takeaways
Product and Service Analysis
Energy & Utilities
The slide analyzes Li-ion technologies by chemistry and lithium precursor dependency, with Ni-rich cells pushing demand for LiOH. Despite LFP and emerging solid-state/Na-ion alternatives, lithium demand remains high.
lithium precursor, NMC, LFP, LiOH, LiCO₃, battery chemistry, roadmap
false
Product and Service Analysis
Energy & Utilities
Multiple Chart
Roland Berger
Add to my slides
Remove from favorites
Utilizes boxes with numbers and a comparison table of mineral reserves by country to show Australia's resource wealth.
Market Analysis and Trends
Energy & Utilities
Highlights Australia's significant reserves of critical battery minerals, positioning it as a leader in lithium production.
lithium production, Australia, mineral reserves, critical resources
false
Market Analysis and Trends
Energy & Utilities
Table
Accenture
Add to my slides
Remove from favorites
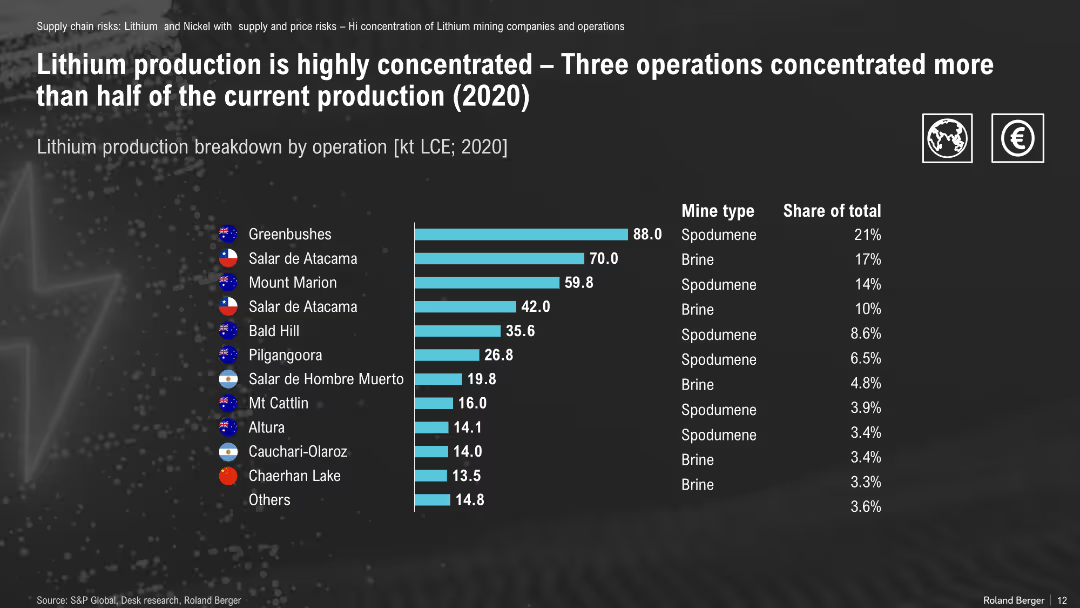
Horizontal bar chart of lithium mines by production volume and type; country flags and shares
Market Analysis and Trends
Energy & Utilities
This slide shows that lithium production is concentrated among a few operations, with over 50% from just three sites. The chart highlights the dominance of Australia and Chile in global spodumene and brine production.
lithium production, concentration, spodumene, brine, mining, resource distribution
false
Market Analysis and Trends
Energy & Utilities
Single Chart
Roland Berger
Add to my slides
Remove from favorites
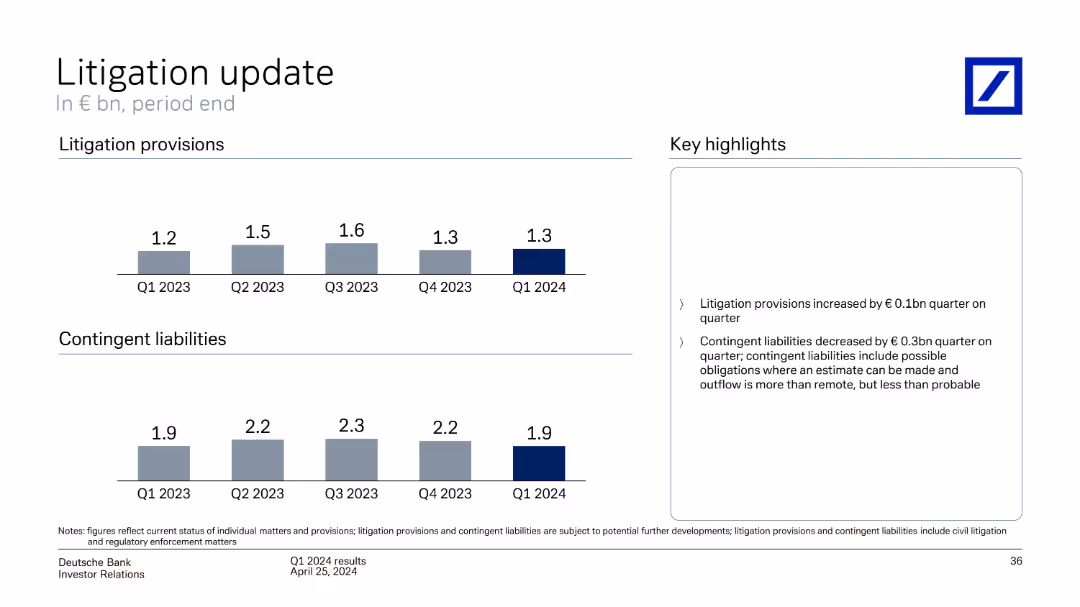
Slide contains column charts tracking litigation provisions and contingent liabilities across multiple quarters, complemented by textual highlights that summarize key changes and implications for the bank.
Regulatory and Compliance
Financial Services
Offers an update on the bank's litigation provisions and contingent liabilities, essential for legal and financial risk management. Provides insights into potential financial impacts and compliance issues, aiding in strategic planning and investor relations.
litigation, contingent liabilities, risk management, financial impact, legal compliance
false
Regulatory and Compliance
Financial Services
Multiple Chart
Deutsche Bank
Add to my slides
Remove from favorites
A complex flow diagram details the litigation process cost and duration, with red and orange color coding for different court paths.
Regulatory and Compliance
Government & Public Sector
Analyzes the litigation process for family law in different courts, discussing costs and duration, emphasizing efficiency.
litigation, family law, court costs, process timeline, case study, legal system
false
Regulatory and Compliance
Government & Public Sector
Diagram
PwC/Strategy&
Add to my slides
Remove from favorites
This slide features comparative column charts for litigation provisions and contingent liabilities over several quarters.
Regulatory and Compliance
Financial Services
Focuses on the bank’s financial provisions for litigation and contingent liabilities, indicating trends and changes over recent quarters.
litigation, financial, provisions, liabilities, risk management, trends, banking, compliance
false
Regulatory and Compliance
Financial Services
Multiple Chart
Deutsche Bank
Add to my slides
Remove from favorites
Column charts showing trends in litigation provisions and contingent liabilities over several quarters.
Regulatory and Compliance
Financial Services
Provides updates on litigation and contingent liabilities, highlighting slight increases and the impact on financial planning. Aimed at investors and regulators.
litigation, liabilities, trends, Q3 2023
false
Regulatory and Compliance
Financial Services
Multiple Chart
Deutsche Bank
Add to my slides
Remove from favorites
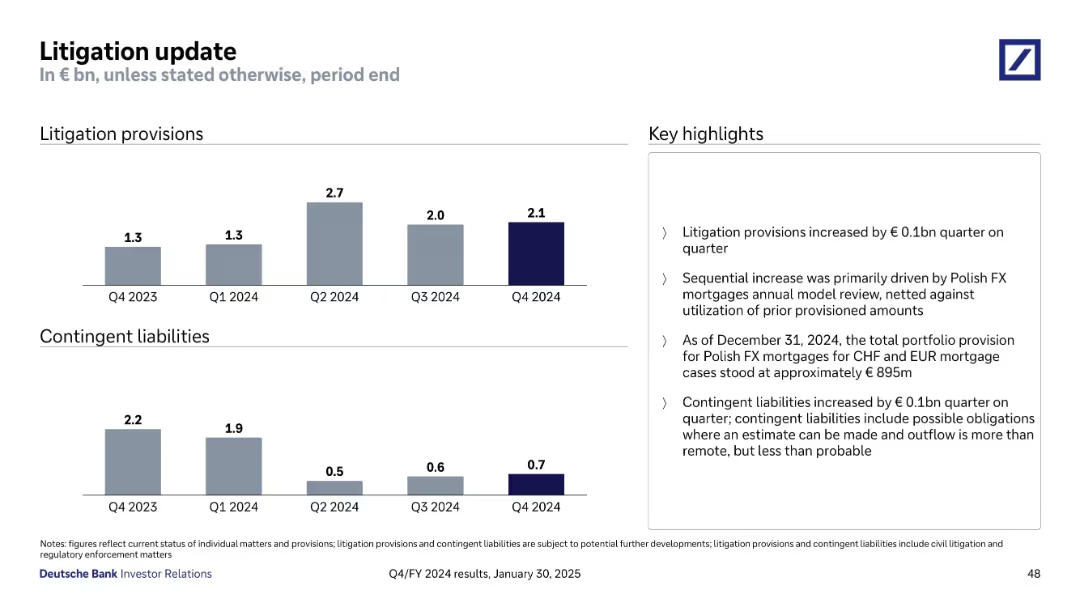
Two bar charts tracking litigation provisions and contingent liabilities over time; highlight box explains recent changes
Regulatory and Compliance
Financial Services
Reports a quarterly increase in litigation provisions and contingent liabilities, mainly due to FX mortgage cases in Poland. Describes the legal status, valuation impacts, and trends in civil and regulatory matters, highlighting exposure to uncertain but possible financial obligations.
litigation, provisions, contingent liabilities, FX mortgages, legal risk
false
Regulatory and Compliance
Financial Services
Mixed Chart
Deutsche Bank
Add to my slides
Remove from favorites
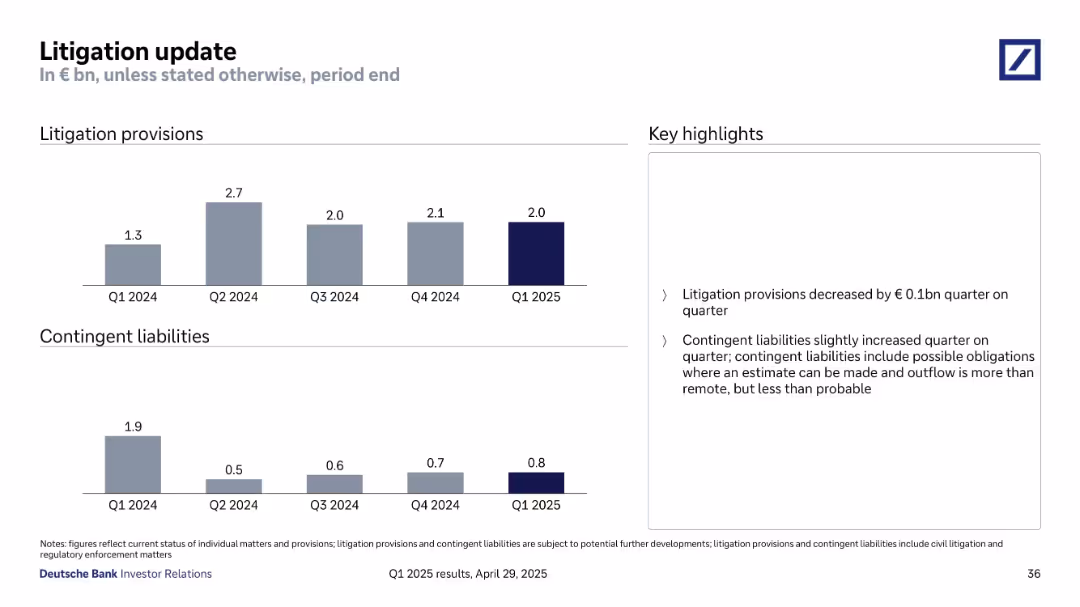
Bar charts display litigation provisions and contingent liabilities by quarter. Key highlights summarized in right-side text box.
Risk Assessment and Management
Financial Services
Deutsche Bank's legal risks are outlined through quarterly trends in litigation provisions and contingent liabilities from Q1 2024 to Q1 2025. The slide notes a slight decrease in provisions and a marginal increase in contingent liabilities, while emphasizing ongoing regulatory developments and potential obligations.
litigation, provisions, contingent liabilities, legal risk, compliance
false
Risk Assessment and Management
Financial Services
Mixed Chart
Deutsche Bank
Add to my slides
Remove from favorites
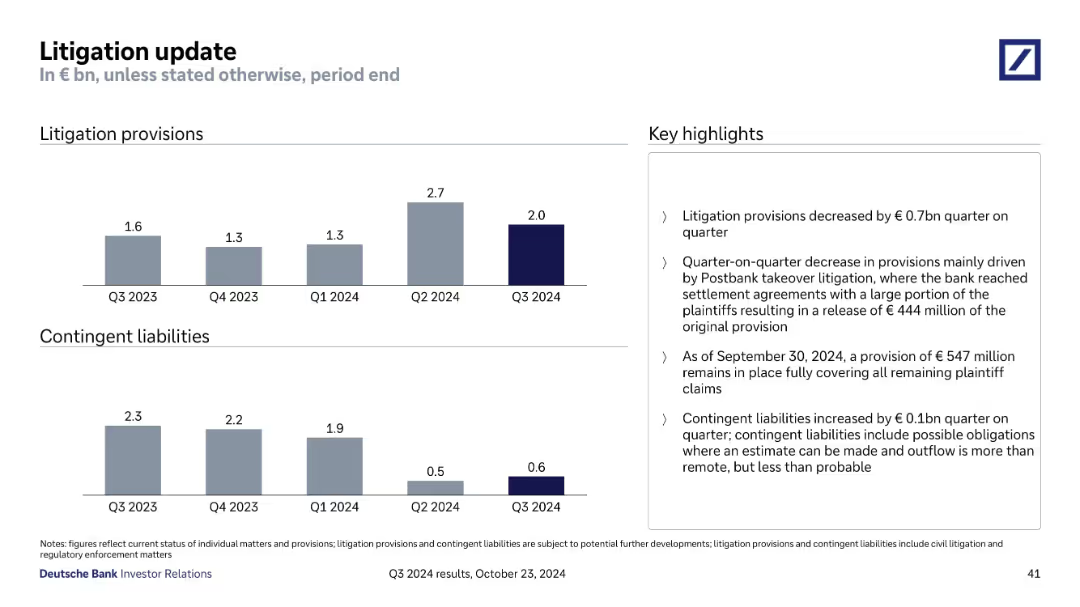
Two bar charts showing litigation provisions and contingent liabilities over time, with highlights explaining changes.
Regulatory and Compliance
Financial Services
Tracks litigation provisions and contingent liabilities from Q3 2023 to Q3 2024. Notes Q2 2024 spike and Q3 reduction driven by Postbank litigation settlement. Indicates €547m provision remains for outstanding claims and slight increase in contingent liabilities.
Litigation, Provisions, Contingent Liabilities, Postbank, Legal Risk
false
Regulatory and Compliance
Financial Services
Multiple Chart
Deutsche Bank
Add to my slides
Remove from favorites
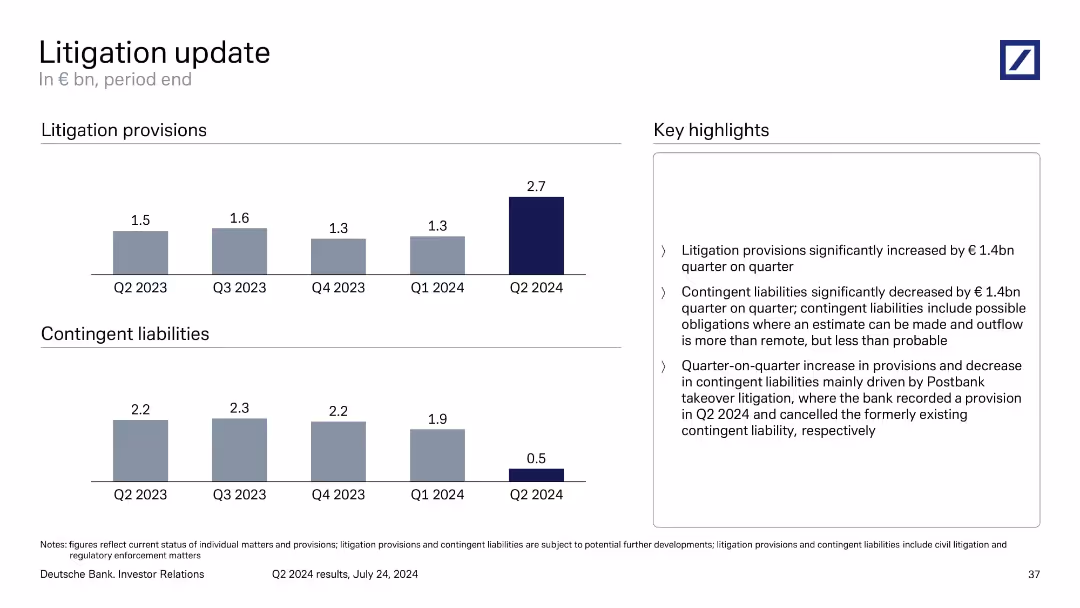
Split layout with bar charts for provisions and contingent liabilities on the left and explanatory text on the right.
Regulatory and Compliance
Financial Services
The slide highlights a significant increase in litigation provisions (€2.7bn in Q2 2024) and a corresponding drop in contingent liabilities. The changes are mainly attributed to the Postbank takeover litigation. It underscores how litigation events can impact financial reporting and provisioning requirements.
litigation, provisions, contingent liabilities, Postbank, legal risks
false
Regulatory and Compliance
Financial Services
Multiple Chart
Deutsche Bank
Add to my slides
Remove from favorites
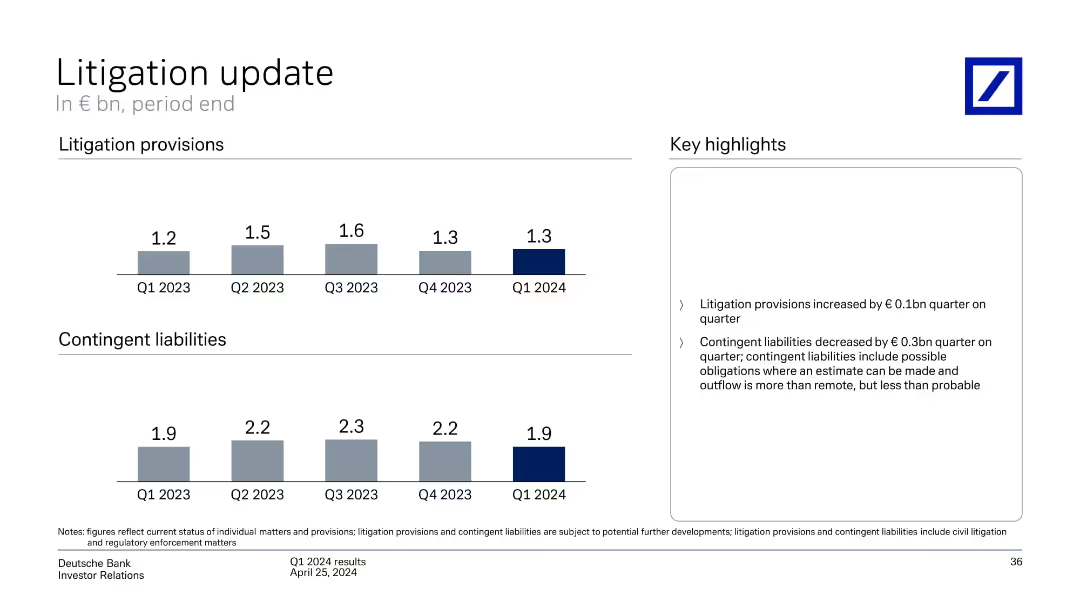
Two bar charts show litigation provisions and contingent liabilities from Q1 2023 to Q1 2024; notes and highlights summarize changes.
Risk Assessment and Management
Financial Services
Illustrates litigation provisions and contingent liabilities over five quarters. Litigation provisions increased slightly in Q1 2024 while contingent liabilities decreased. Highlights indicate expected changes and factors influencing liability recognition.
litigation provisions, contingent liabilities, Q1 2024, legal risk, Deutsche Bank
false
Risk Assessment and Management
Financial Services
Multiple Chart
Deutsche Bank
Add to my slides
Remove from favorites
Simple layout with two column charts focusing on litigation provisions and contingent liabilities.
Regulatory and Compliance
Financial Services
Provides an update on Deutsche Bank's litigation provisions and contingent liabilities across several quarters.
litigation, provisions, liabilities, financial services
false
Regulatory and Compliance
Financial Services
Multiple Chart
Deutsche Bank
Add to my slides
Remove from favorites
Bar charts for litigation provisions and contingent liabilities over time, accompanied by a summary bullet box to the right. Grayscale color theme with emphasis on Q1 2025 values.
Regulatory and Compliance
Financial Services
Provides updates on litigation reserves (€2.0bn) and contingent liabilities (€0.8bn) as of Q1 2025. Notes a minor quarter-on-quarter reduction in provisions and a slight increase in contingent liabilities, indicating ongoing legal exposure management.
litigation, provisions, liabilities, Q1 2025, compliance, risk exposure
false
Regulatory and Compliance
Financial Services
Multiple Chart
Deutsche Bank
Add to my slides
Remove from favorites
The slide shows two sets of column charts, one for litigation provisions and another for contingent liabilities across different quarters, with a key highlights section.
Risk Assessment and Management
Financial Services
Provides an update on litigation provisions and contingent liabilities over the past five quarters, noting changes and key highlights regarding provisions.
litigation, update, provisions, contingent liabilities, key highlights, risk management
false
Risk Assessment and Management
Financial Services
Multiple Chart
Deutsche Bank
Add to my slides
Remove from favorites
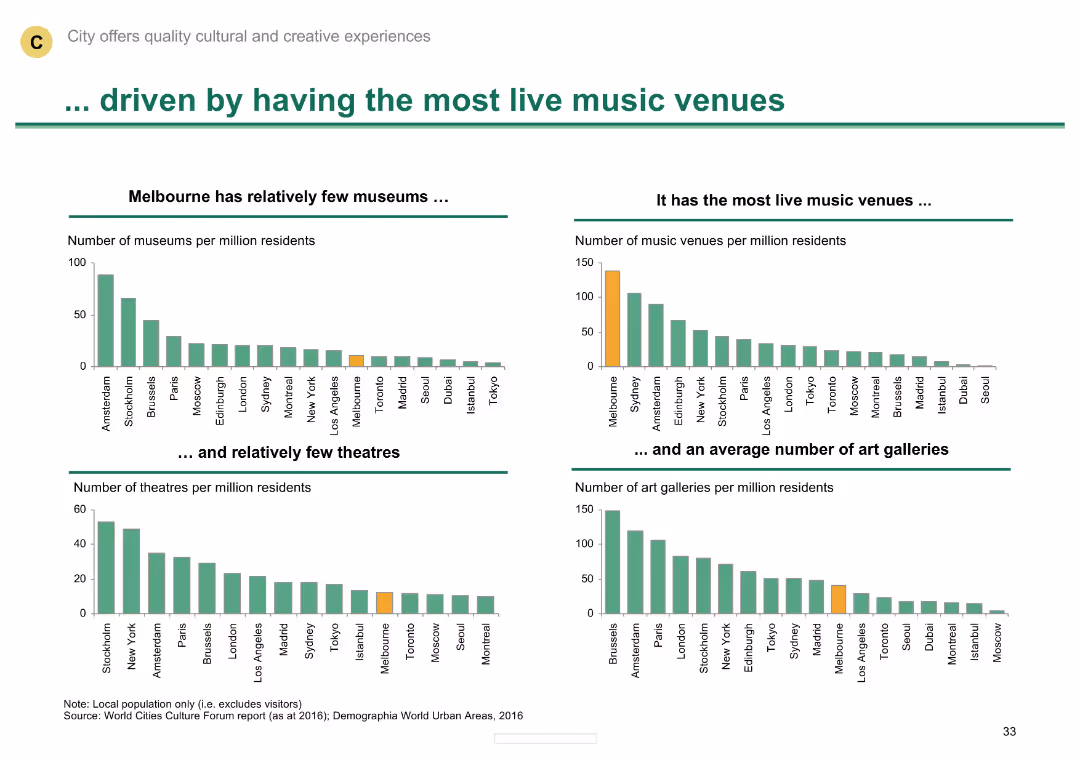
Multiple column charts comparing the number of museums, music venues, theatres, and art galleries
Market Analysis and Trends
Media & Entertainment
Shows Melbourne's leadership in live music venues and its relatively average number of theatres and galleries.
Live music venues, museums, theatres, art galleries, Melbourne
false
Market Analysis and Trends
Media & Entertainment
Multiple Chart
BCG
Add to my slides
Remove from favorites
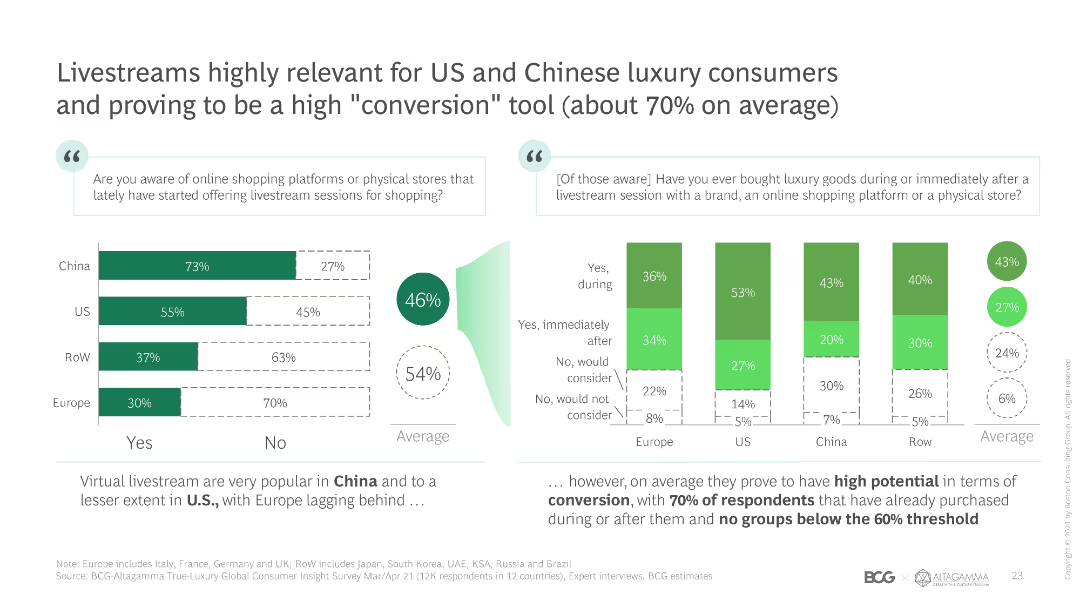
Bar chart showing awareness and purchase behavior related to livestream shopping among luxury consumers in different regions. Includes text with insights on conversion rates.
Market Analysis and Trends
Media & Entertainment
Discusses the relevance and impact of livestream shopping for luxury consumers, focusing on awareness and purchase conversion rates across regions.
livestream, luxury consumers, conversion, awareness, purchase behavior
false
Market Analysis and Trends
Media & Entertainment
Multiple Chart
BCG
Add to my slides
Remove from favorites
Previous
Next
You don't have any favorites yet.
Please wait loading your favorites slides...
Create a FREE account to continue browsing
Receive Instant Access to 1,000+ slides from companies like McKinsey, Google, and Goldman Sachs
First Name
Last Name
Email
Password
I agree to all
Terms & Privacy Policy
Thank you! Your submission has been received!
Oops! Something went wrong while submitting the form.
Have an account?
Sign in
Upgrade to PRO to Save slides
Advanced Search and Filters
Access to 15,000+ slides
Access to Category Pages
Save/Bookmark Slides
PowerPoint Template Library
Pick a Plan
MONTHLY
$12/month
Billed every month, Cancel anytime.
YEARLY
$9/year
Billed $108 annually, Cancel anytime.
Checkout for $12/month
Checkout for $108/yr
Secured by Stripe | AES-256 bit encryption