My Account
My Slides
Search by Category
Pricing
Templates
View All Templates
Download Template Slides
✦ AI Search
Feedback
Login
Logout
Get Started
Browse all Slides
Browse all Slides
Create a FREE Account
Instant access to 1,000+ real slides from top companies like McKinsey, BCG, Goldman Sachs, Google and many more!
First Name
Last Name
Email
Password
I agree to all
Terms & Privacy Policy
Thank you! Your submission has been received!
Oops! Something went wrong while submitting the form.
Have an account?
Sign in
Saved Slides
Total No. of slides saved
0
↻ Refresh
✖ Clear all
This slide features a combination of vertical bar charts and a graphic of a person interacting with a mobile device, representing livestream shopping trends. Different colors distinguish various engagement levels.
Market Analysis and Trends
Retail & E-commerce
The slide shows high engagement with livestream shopping in Vietnam, with 94% having heard of it, 74% accessed it, and 94% of those who accessed it made purchases. It emphasizes the popularity of livestream shopping as a marketing trend in Vietnam for 2021.
livestream shopping, marketing trends, Vietnam, e-commerce, consumer behavior
false
Market Analysis and Trends
Retail & E-commerce
Single Chart
IPSOS
Add to my slides
Remove from favorites
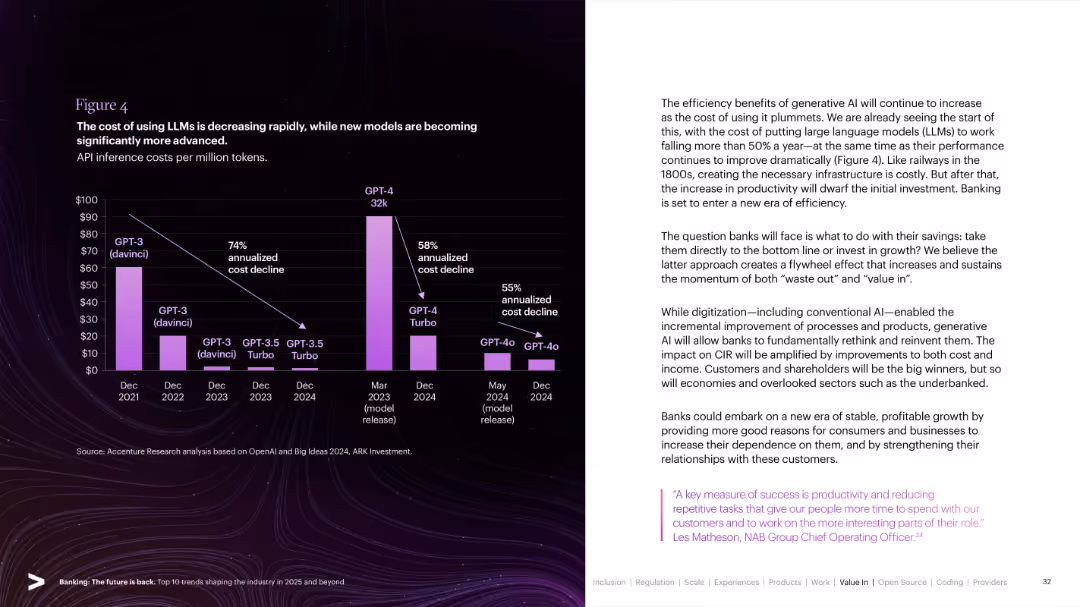
Bar chart over a dark background showing API cost decline of various LLMs (GPT-3, GPT-4 etc.). Explanatory text on the right.
Technology and Digital Transformation
Artificial Intelligence
Depicts the rapid reduction in API inference costs of large language models (LLMs) from 2021–2024, alongside advancements in model performance. Discusses how this cost efficiency drives productivity in banking and beyond.
LLM, GPT-4, Inference Cost, AI Efficiency, API Costs, AI Adoption, Banking Innovation, Digital Transformation
false
Technology and Digital Transformation
Artificial Intelligence
Mixed Chart
Accenture
Add to my slides
Remove from favorites
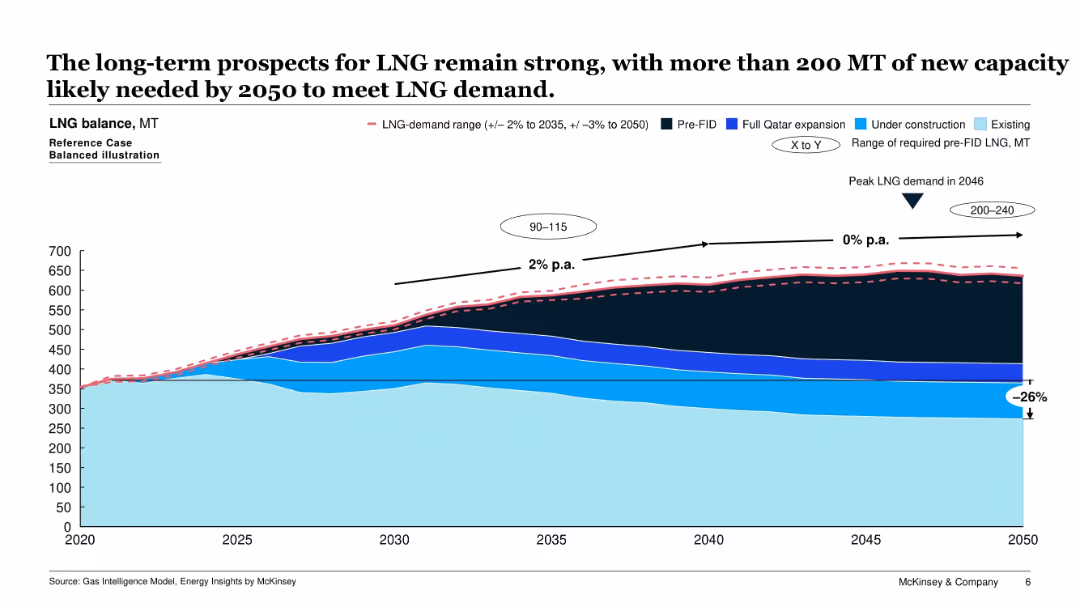
Area chart depicting LNG supply and demand balance from 2020 to 2050, including existing and future capacities (e.g., under construction, pre-FID). A demand range is overlaid.
Strategic Planning
Energy & Utilities
This slide forecasts LNG demand and required capacity growth up to 2050, indicating peak demand in 2046. It highlights the gap to be filled by new (pre-FID) projects and shows growth rates and investment needs.
LNG demand, capacity planning, energy forecast, gas supply, energy strategy, infrastructure, FID
false
Strategic Planning
Energy & Utilities
Single Chart
McKinsey
Add to my slides
Remove from favorites
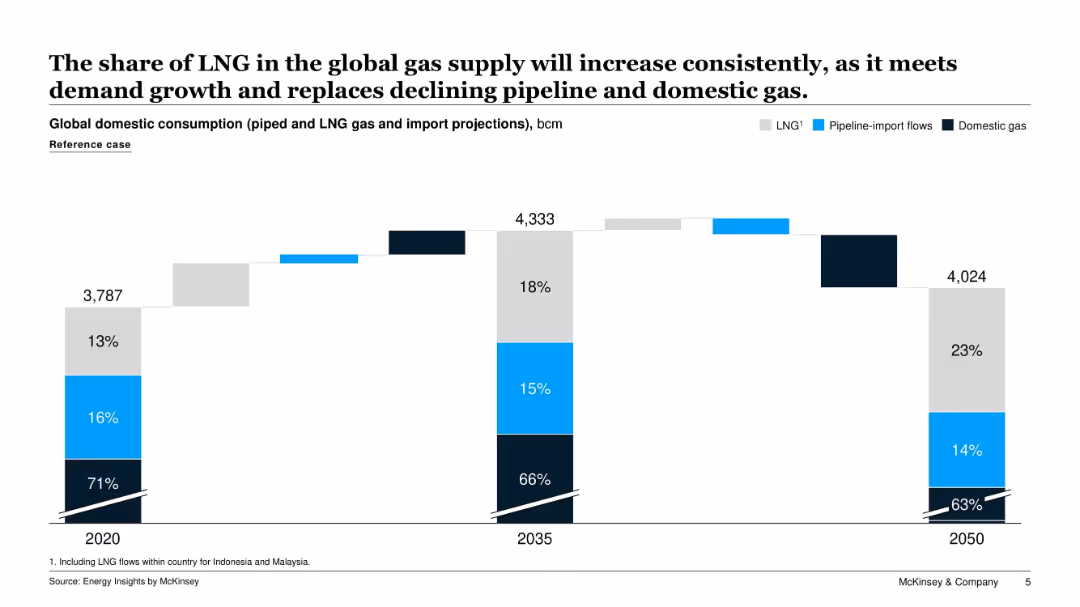
Stacked bar chart comparing global domestic gas consumption (LNG, pipeline-import flows, domestic gas) for 2020, 2035, and 2050. Percentages are labeled by source.
Market Analysis and Trends
Energy & Utilities
The slide illustrates the projected shift in the composition of global gas supply through 2050, with LNG increasing its share as domestic and pipeline gas sources decline. It shows changes in volume and percentage contribution across three key years.
LNG, domestic gas, pipeline, gas supply, energy transition, consumption trends, 2035, 2050
false
Market Analysis and Trends
Energy & Utilities
Single Chart
McKinsey
Add to my slides
Remove from favorites
Contains bullet points and iconography. It features a high-level summary of Western Australia's LNG industry, economic contributions, and impact metrics like $220 billion added and 57,000 workers.
Industry Overview
Energy & Utilities
Highlights Western Australia's significant role in the LNG industry, mentioning major projects, economic contributions, and employment impact over the last decade.
LNG, Economic Impact, Western Australia, Energy Industry, Employment, Major Projects, Investment, Tax Revenue
false
Industry Overview
Energy & Utilities
Header Horizontal
EY
Add to my slides
Remove from favorites
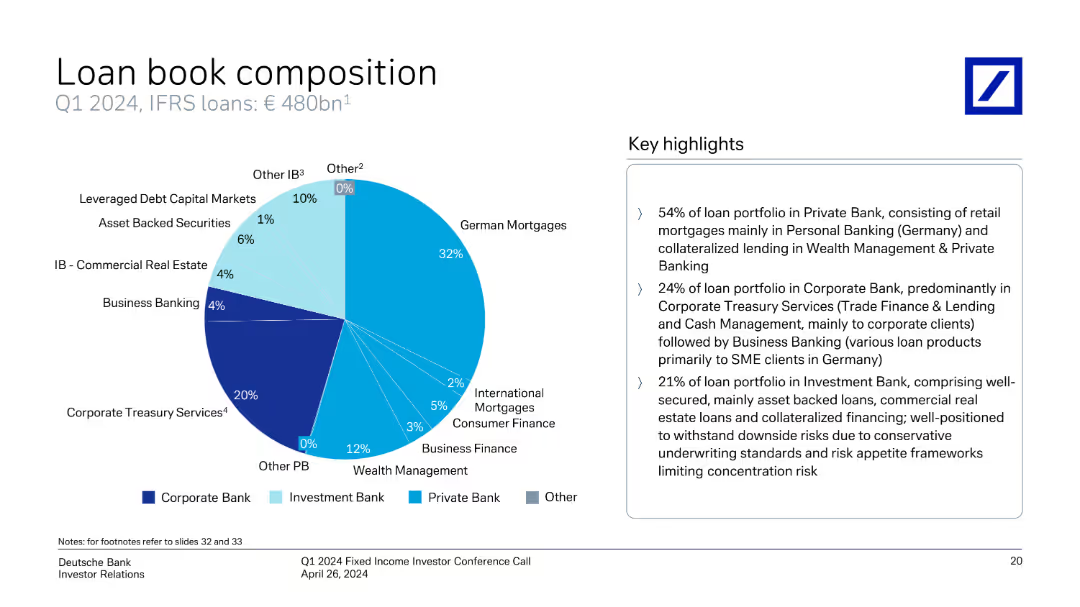
This slide features a large pie chart illustrating the composition of loan books in Q4 2023, segmented by various banking divisions and loan types, with percentages included for each segment. Detailed textual annotations provide insights into each category's specifics within the overall portfolio.
Investment Analysis
Financial Services
Provides a breakdown of the loan portfolio by type and banking division, highlighting exposure and focus areas such as German mortgages and corporate lending. Essential for assessing investment risks and opportunities within the bank's lending activities.
loan book, banking divisions, Q4 2023, investment risks, portfolio analysis, mortgages, corporate lending
false
Investment Analysis
Financial Services
Mixed Chart
Deutsche Bank
Add to my slides
Remove from favorites
The slide includes pie charts showing the distribution of gross loans and a bar chart comparing provision for credit losses ratios vs. peers.
Risk Assessment and Management
Financial Services
This slide discusses the high collateralization of Credit Suisse's loan book, with a significant portion in Switzerland, and credit loss provisions.
loan book, collateralization, credit losses, Switzerland, risk management
false
Risk Assessment and Management
Financial Services
Multiple Chart
Credit Suisse
Add to my slides
Remove from favorites
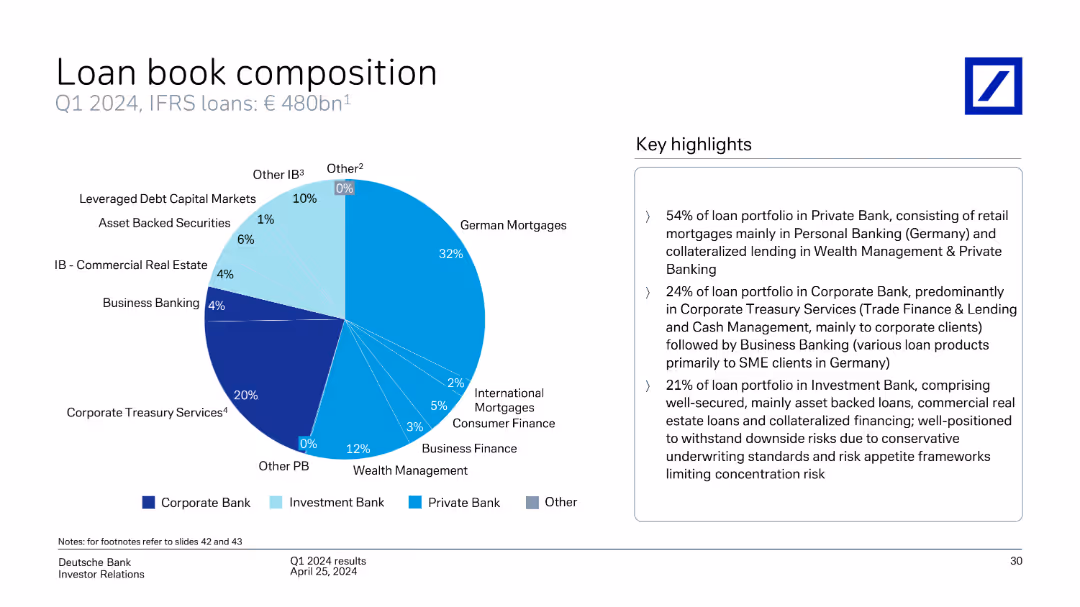
The slide includes a pie chart showing the composition of the loan book for Q1 2024, with key highlights and detailed segment information.
Financial Performance
Financial Services
It explains the composition of Deutsche Bank's loan book, with segments such as corporate treasury services, business banking, and more.
loan book, composition, Q1 2024, corporate treasury, business banking, segments, Deutsche Bank
false
Financial Performance
Financial Services
Mixed Chart
Deutsche Bank
Add to my slides
Remove from favorites
This slide includes a pie chart showing the composition of Deutsche Bank's loan book by type (German Mortgages, Corporate Treasury Services, etc.) as of Q1 2024.
Financial Performance
Financial Services
The slide details the composition of Deutsche Bank's loan book as of Q1 2024, breaking down the types of loans (German Mortgages, Corporate Treasury Services, etc.) and providing key highlights of the portfolio distribution.
loan book, composition, types, portfolio, German Mortgages, Corporate Treasury Services, Deutsche Bank, Q1 2024
false
Financial Performance
Financial Services
Mixed Chart
Deutsche Bank
Add to my slides
Remove from favorites
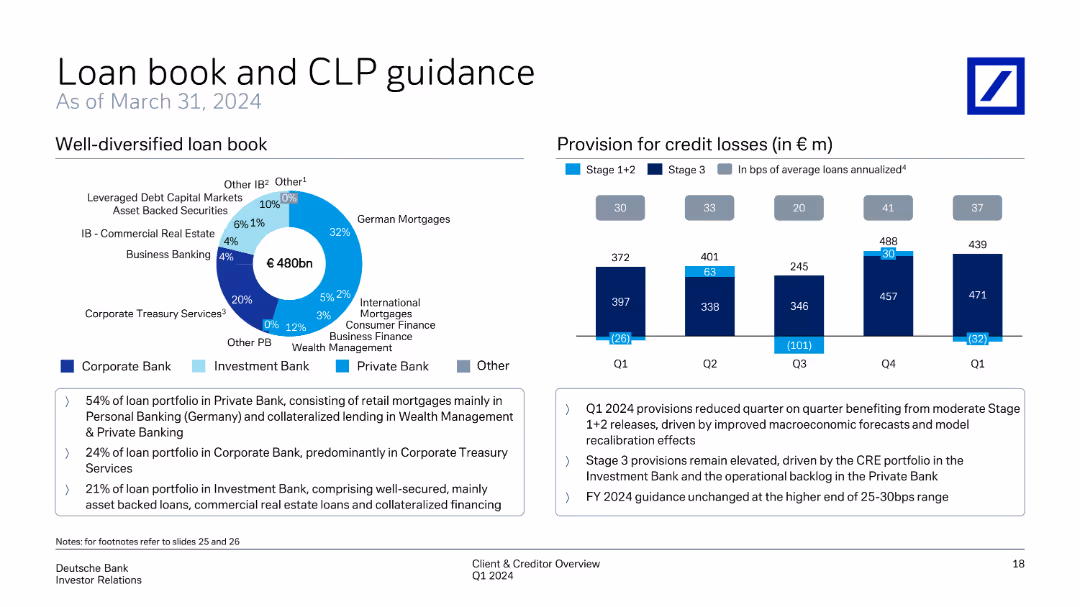
Displays a pie chart of a well-diversified loan book, showing loan distribution by type. Another column chart shows the provision for credit losses over different quarters, broken down by stages.
Risk Assessment and Management
Financial Services
Reviews the distribution of the loan book and provisions for credit losses, emphasizing the diversification in loan types and the changes in provisions across different quarters. The slide provides guidance on credit loss provisions and loan management strategies.
loan book, credit losses, provisions, diversification, guidance
false
Risk Assessment and Management
Financial Services
Multiple Chart
Deutsche Bank
Add to my slides
Remove from favorites
Slide includes pie charts and column chart to detail the composition of the loan book and provision for credit losses, respectively, with clear visual differentiation among categories.
Risk Assessment and Management
Financial Services
Offers detailed insights into the bank's loan book composition and credit loss provisions, suitable for risk management and loan portfolio analysis.
loan book, credit, risk, management, provisions, portfolio, analysis, composition, financial, insights
false
Risk Assessment and Management
Financial Services
Multiple Chart
Deutsche Bank
Add to my slides
Remove from favorites
This slide includes multiple pie charts displaying loan distribution by business and region, and a column chart showing the provision for credit losses over several quarters. The layout is structured and uses color coding to enhance readability.
Risk Assessment and Management
Financial Services
It analyzes the diversification of a loan book and tracks changes in provisions for credit losses, crucial for assessing risk management efficiency in financial institutions. This slide can be used to discuss risk exposure and mitigation strategies.
loan book, diversification, risk management, financial
false
Risk Assessment and Management
Financial Services
Multiple Chart
Deutsche Bank
Add to my slides
Remove from favorites
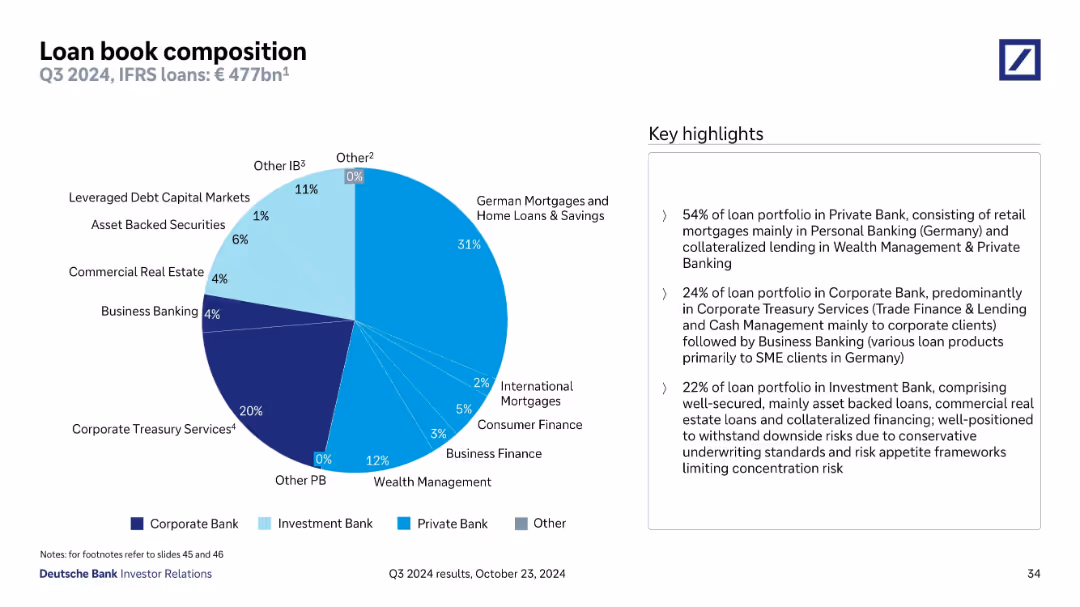
Large pie chart showing €477bn IFRS loan breakdown by segment; highlights categorized by business divisions.
Customer and Market Segmentation
Financial Services
Deutsche Bank details its Q3 2024 €477bn loan book, with 54% in Private Bank (mainly mortgages), 24% in Corporate Bank, and 22% in Investment Bank. The composition supports risk mitigation through secured lending, especially in Germany and SME-focused Corporate Banking.
loan book, mortgages, Corporate Bank, Private Bank, lending, Deutsche Bank
false
Customer and Market Segmentation
Financial Services
Mixed Chart
Deutsche Bank
Add to my slides
Remove from favorites
Pie chart showing breakdown of total loan book (€477bn) by type and segment (Private, Corporate, Investment Bank); right-side panel summarizes proportions and risk profiles.
Risk Assessment and Management
Financial Services
This slide analyzes the composition of Deutsche Bank’s loan book. 54% is in Private Bank (mainly German mortgages), 24% in Corporate (mainly treasury services), and 22% in Investment Bank. The slide also underscores risk distribution and lending standards.
loan book, mortgages, private bank, corporate, investment, risk
false
Risk Assessment and Management
Financial Services
Mixed Chart
Deutsche Bank
Add to my slides
Remove from favorites
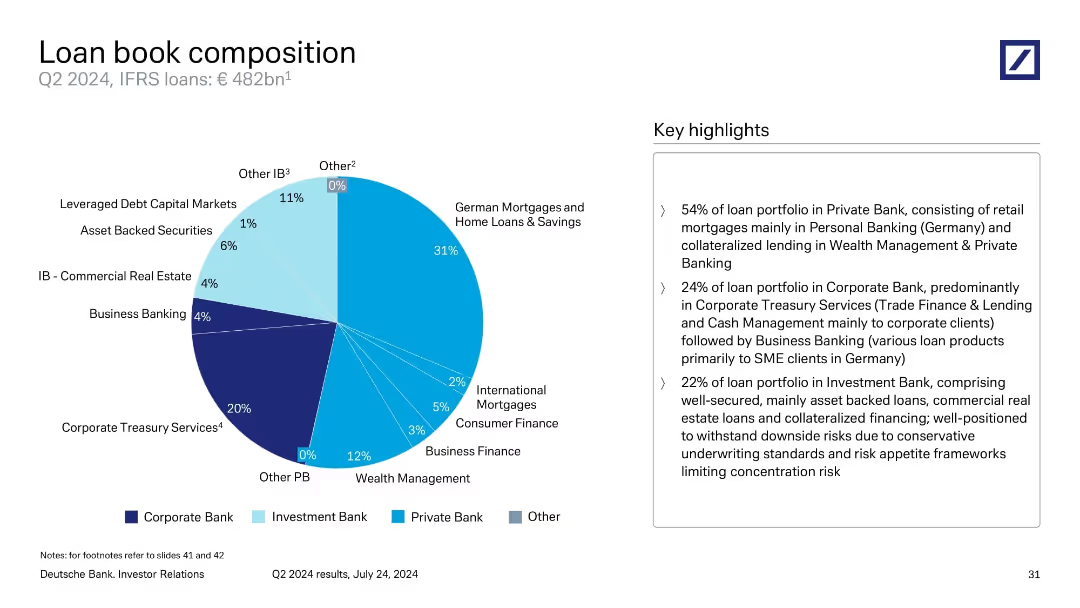
Pie chart showing Q2 2024 loan book by type and business segment. Includes legend for color-coded divisions. Text box highlights composition insights.
Risk Assessment and Management
Financial Services
Visual breakdown of Deutsche Bank’s €482bn loan book by product and division. Largest share held in German mortgages and home savings. Commentary on diversification and conservative underwriting practices to reduce risk concentration.
loan book, mortgages, treasury services, credit risk, diversification
false
Risk Assessment and Management
Financial Services
Mixed Chart
Deutsche Bank
Add to my slides
Remove from favorites
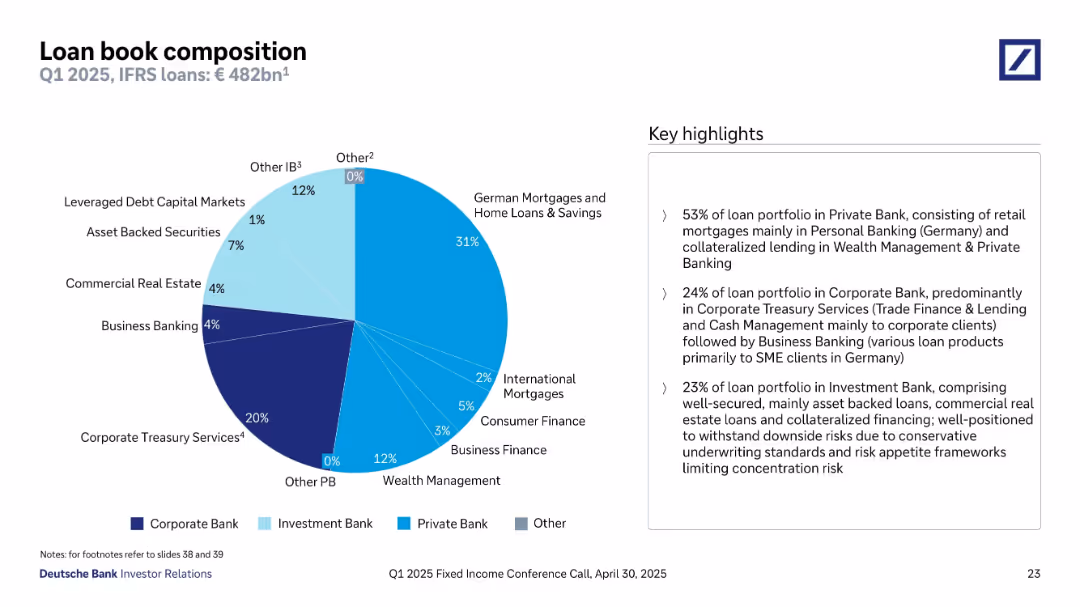
Pie chart illustrates loan distribution by type and banking segment. Complemented by a sidebar with textual highlights. Color-coded segments identify Corporate, Investment, and Private Bank categories.
Product and Service Analysis
Financial Services
The composition of Deutsche Bank’s €482bn loan book as of Q1 2025 is depicted, showing a high share of German mortgages (31%) and diverse allocation across business finance, CRE, and treasury services. It discusses segment-wise breakdown: 53% Private Bank, 24% Corporate Bank, and 23% Investment Bank, with emphasis on secured and diversified loan types.
loan book, Private Bank, CRE, treasury, diversification, portfolio mix
false
Product and Service Analysis
Financial Services
Mixed Chart
Deutsche Bank
Add to my slides
Remove from favorites
Pie chart on the left showing loan distribution by type and bank division; key highlights on right.
Financial Performance
Financial Services
The slide breaks down Deutsche Bank’s €482bn loan book as of Q1 2025. It categorizes loans across divisions: Private Bank (53%), Corporate Bank (24%), and Investment Bank (23%). Key components include German mortgages (31%), corporate treasury services (20%), and asset-backed securities (7%). Key insights describe loan types, risk positioning, and client segmentation.
loan book, private bank, investment bank, mortgage, corporate lending, asset-backed, Q1 2025, risk, client segmentation, Germany
false
Financial Performance
Financial Services
Mixed Chart
Deutsche Bank
Add to my slides
Remove from favorites
Pie chart showing loan book segmentation by business type. Different shades of blue represent divisions like Private Bank, Corporate Bank, and Investment Bank. Key highlights summarized on right.
Product and Service Analysis
Financial Services
This slide presents the composition of Deutsche Bank’s €485bn loan book as of Q4 2024. The largest portion (53%) is in the Private Bank, focusing on mortgages and wealth management. Corporate Bank accounts for 24%, led by Treasury Services. Investment Bank loans comprise 23%, with a focus on secure, well-collateralized instruments such as asset-backed loans and real estate.
loan book, Private Bank, mortgages, collateralized lending, Corporate Bank, CRE, Investment Bank, Deutsche Bank
false
Product and Service Analysis
Financial Services
Mixed Chart
Deutsche Bank
Add to my slides
Remove from favorites
Contains a large pie chart showing the composition of the bank's loan book across different sectors.
Investment Analysis
Financial Services
Details the distribution of loans across sectors as of Q1 2023, highlighting concentrations in German mortgages, business banking, and other areas. Provides insights into the diversification and focus areas of the bank's loan portfolio.
loan composition, banking sectors, Q1 2023
false
Investment Analysis
Financial Services
Mixed Chart
Deutsche Bank
Add to my slides
Remove from favorites
A pie chart segmented by loan type and business unit (color-coded), accompanied by textual highlights summarizing proportions and risk characteristics.
Product and Service Analysis
Financial Services
Shows the composition of Deutsche Bank's €480bn loan book as of Q1 2024, dominated by German mortgages (32%) and collateralized lending. Private Bank holds 54% of loans, followed by Corporate and Investment Bank. Key focus is on diversification, loan quality, and risk mitigation.
loan composition, German mortgages, corporate treasury, Q1 2024, lending portfolio, Deutsche Bank
false
Product and Service Analysis
Financial Services
Mixed Chart
Deutsche Bank
Add to my slides
Remove from favorites
Pie chart showing €482bn loan breakdown by business area; sidebar with bullet highlights.
Product and Service Analysis
Financial Services
This slide details Deutsche Bank’s Q1 2025 loan book composition, with 53% in Private Bank (mainly German mortgages), 24% in Corporate Bank, and 23% in Investment Bank. Emphasis is on well-secured, diversified exposure with minimal concentration risk.
loan composition, private bank, mortgages, business lending, diversification, corporate treasury, investment bank
false
Product and Service Analysis
Financial Services
Mixed Chart
Deutsche Bank
Add to my slides
Remove from favorites
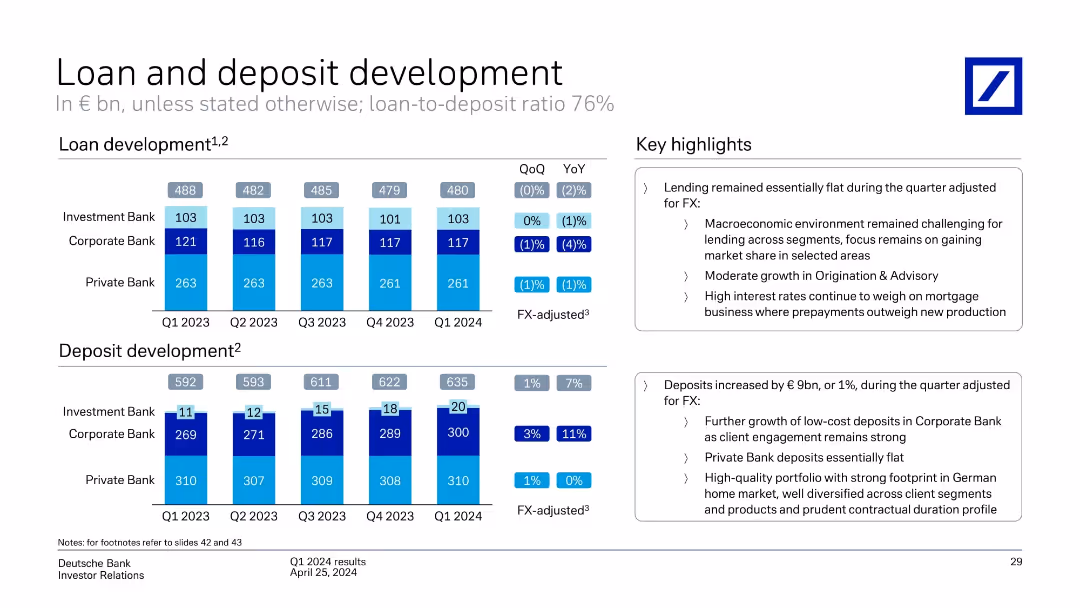
This slide features two sets of column charts showing loan and deposit development across different business divisions (Investment Bank, Corporate Bank, Private Bank) for Q1 2023 to Q1 2024.
Market Analysis and Trends
Financial Services
The slide presents Deutsche Bank's loan and deposit development from Q1 2023 to Q1 2024, highlighting changes in volumes across the Investment, Corporate, and Private Banks. It includes key highlights and FX-adjusted figures.
loan development, deposit development, business divisions, volumes, Deutsche Bank, Q1 2024
false
Market Analysis and Trends
Financial Services
Multiple Chart
Deutsche Bank
Add to my slides
Remove from favorites
The slide features two bar charts comparing loan and deposit figures across multiple quarters.
Financial Performance
Financial Services
Examines year-on-year and quarter-on-quarter changes in loan and deposit volumes within the bank's various divisions, providing insights into lending trends and deposit fluctuations.
loan development, deposit growth, banking, trends
false
Financial Performance
Financial Services
Multiple Chart
Deutsche Bank
Add to my slides
Remove from favorites
Two stacked bar charts show development in loans and deposits by segment and over time. Annotations provide QoQ and YoY growth rates. Key highlights summarized in text boxes.
Performance Metrics and KPIs
Financial Services
Tracks loan and deposit volumes across investment, corporate, and private banking. Loans remained flat, while deposits rose €15bn, driven by Corporate Bank. FX-adjusted insights and commentary on mortgage lending and deposit normalization are provided.
loan growth, deposit growth, FX-adjusted, stable lending, Corporate Bank, Private Bank, liquidity, Q3 2024
false
Performance Metrics and KPIs
Financial Services
Multiple Chart
Deutsche Bank
Add to my slides
Remove from favorites
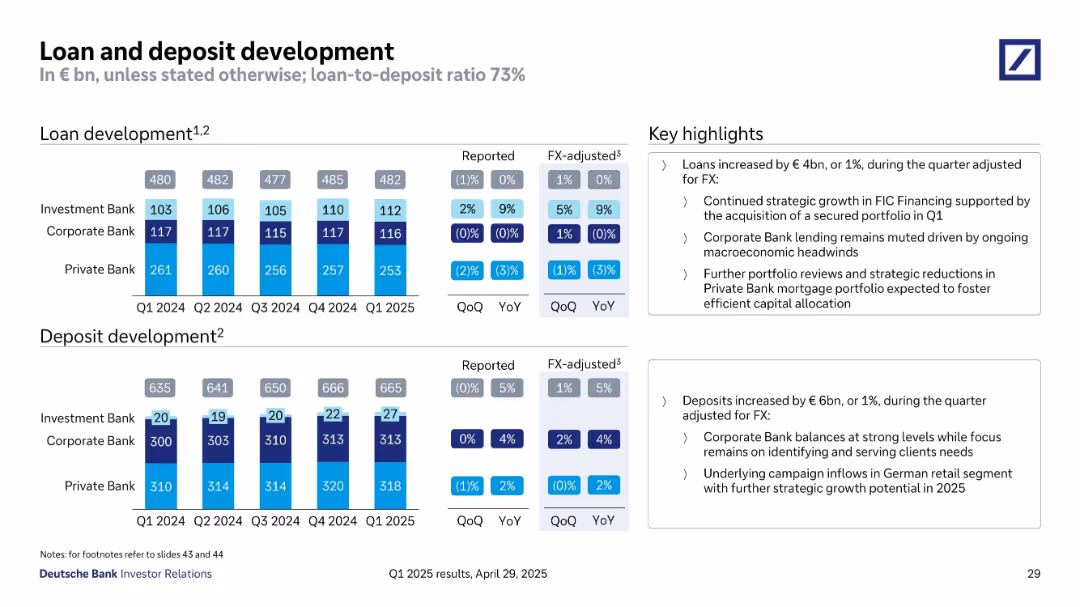
Bar charts show quarterly loan and deposit trends across business segments. Tables display QoQ and YoY changes, both reported and FX-adjusted. Key highlights are placed in right-side boxes.
Performance Metrics and KPIs
Financial Services
This slide presents quarterly loan and deposit development for Q1 2024 through Q1 2025, broken down by Investment, Corporate, and Private Banks. It highlights loan growth of €4bn and deposit increase of €6bn, with commentary on segment-specific drivers. FX-adjusted comparisons show stability and strategic focus across business lines.
loan growth, deposit trends, FX adjusted, YoY, QoQ, banking segments
false
Performance Metrics and KPIs
Financial Services
Multiple Chart
Deutsche Bank
Add to my slides
Remove from favorites
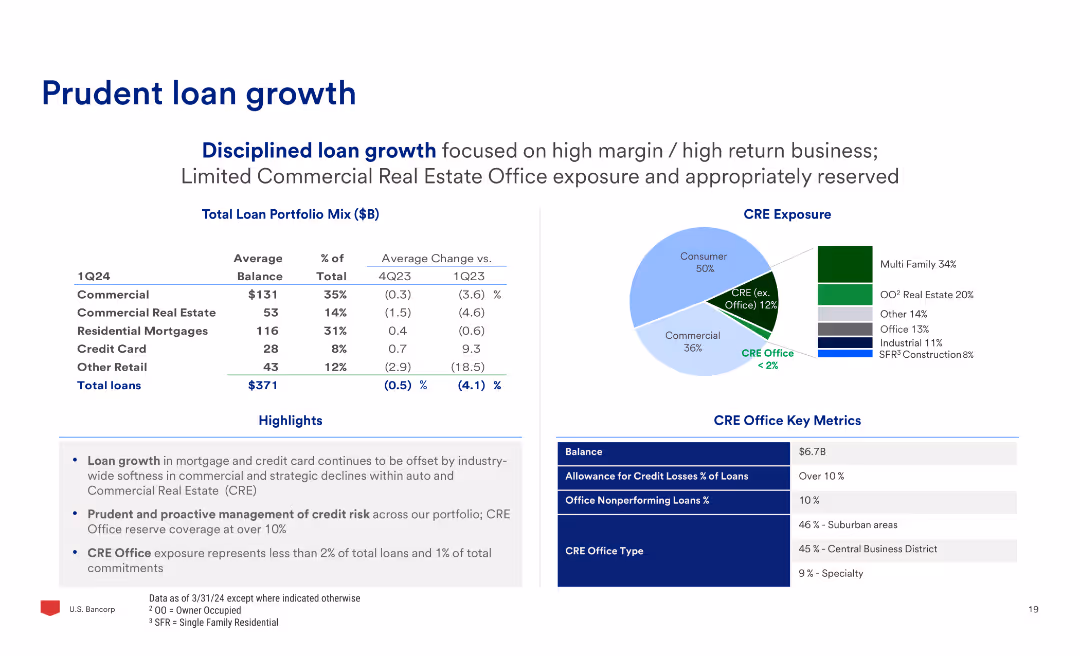
The slide features a table with loan portfolio mix and average changes, a pie chart of CRE exposure, and text highlights on loan growth and credit risk management.
Financial Performance
Financial Services
The slide discusses prudent loan growth, focusing on high-margin business, limited CRE office exposure, and proactive credit risk management, with detailed data on loan portfolio changes.
Loan, Growth, Portfolio, CRE, Risk, Management
false
Financial Performance
Financial Services
Multiple Chart
Barclays
Add to my slides
Remove from favorites
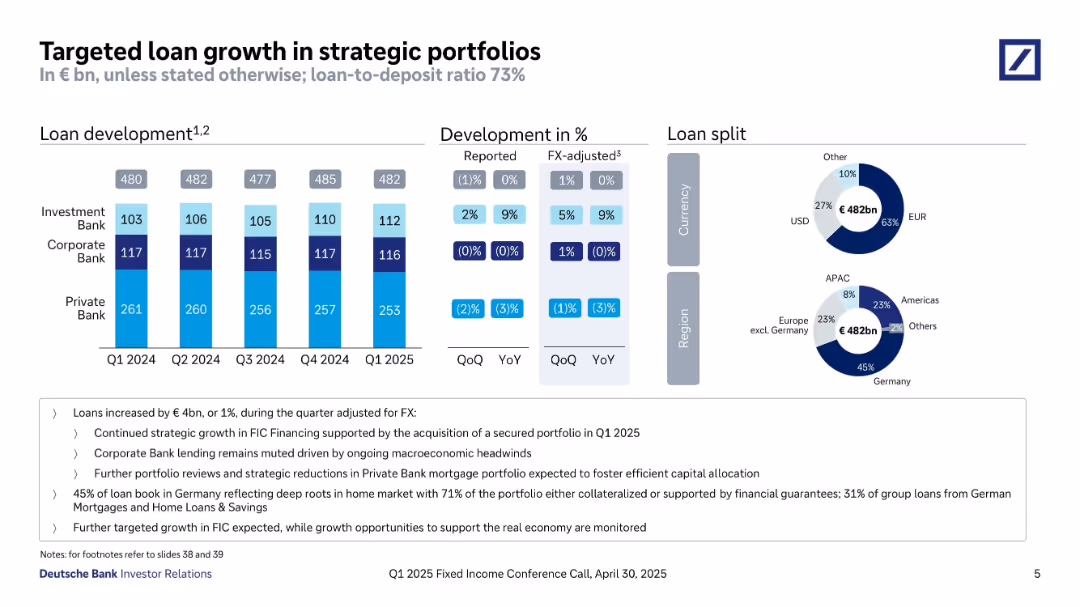
Stacked bar chart for loan development, side tables for % change, donut charts showing loan split by currency and region, and bullet point text.
Strategic Planning
Financial Services
Focuses on loan portfolio growth to €482bn in Q1 2025, with regional and currency split insights. Highlights growth in Investment Bank lending and regional concentration in Germany. Strategy emphasizes capital allocation and risk-adjusted growth.
Loan Growth, Strategic Portfolios, Currency Split, Regional Allocation, Investment Bank, FX-adjusted, Q1 2025
false
Strategic Planning
Financial Services
Multiple Chart
Deutsche Bank
Add to my slides
Remove from favorites
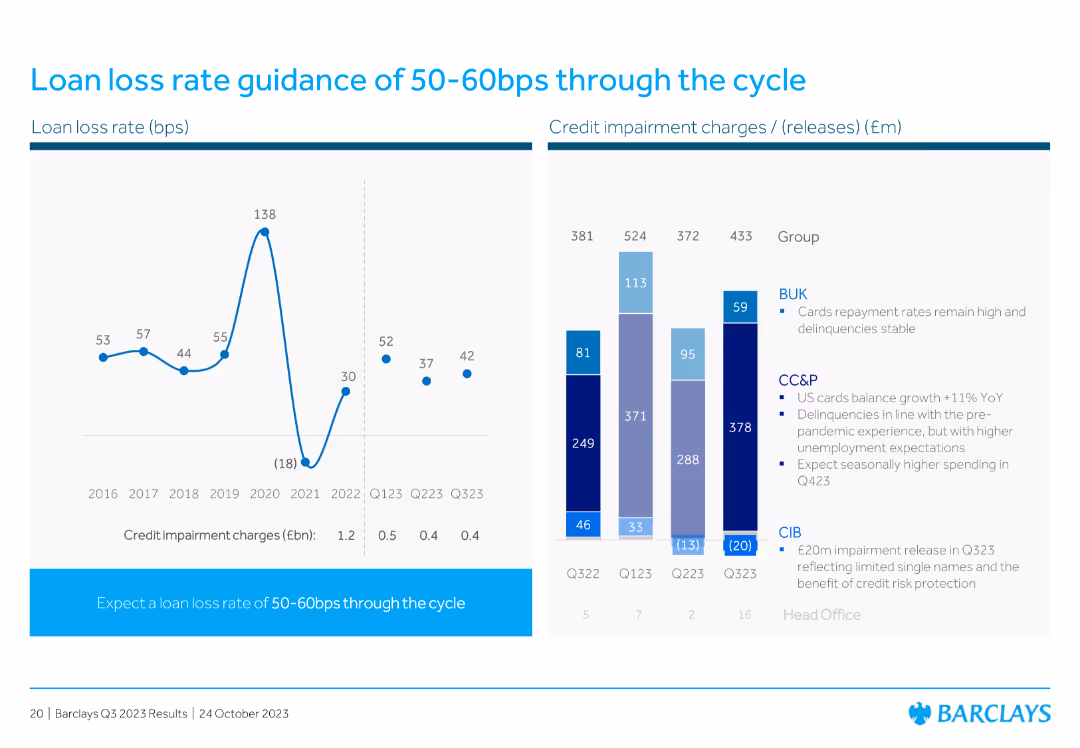
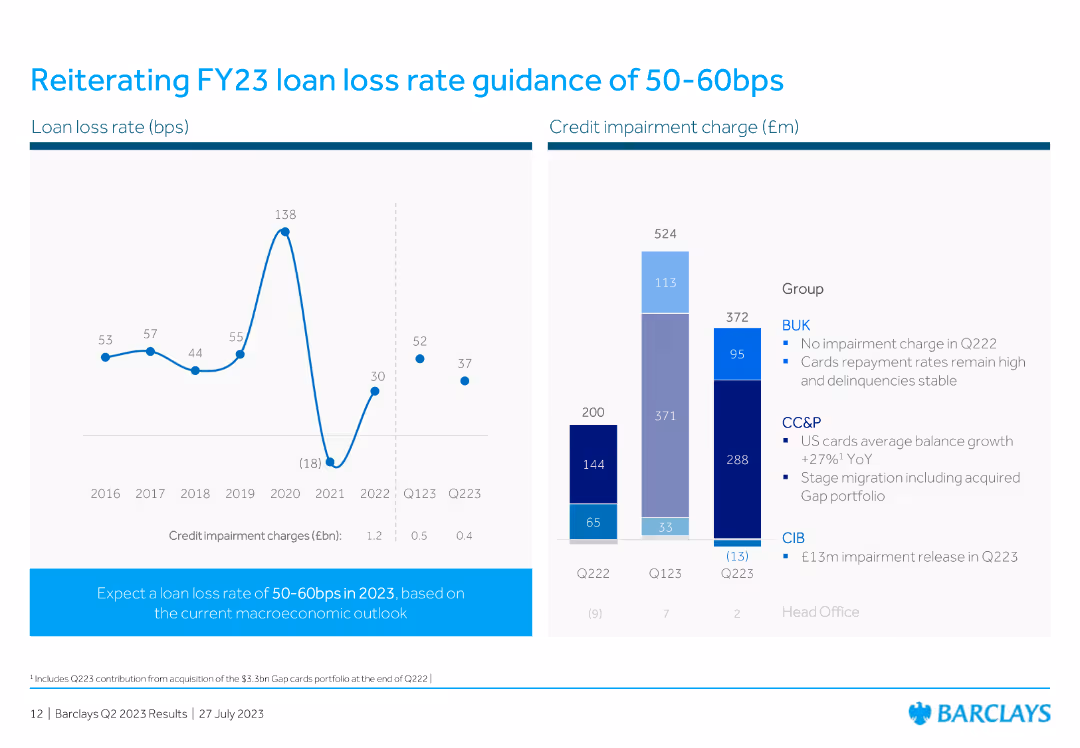
Contains a line chart showing loan loss rates over time and a column chart detailing credit impairment charges across different quarters. The slide is visually balanced and data-focused.
Risk Assessment and Management
Financial Services
The slide gives guidance on the expected loan loss rate and shows historical data on loan loss rates and credit impairment charges. The content emphasizes stability and projections.
loan loss, guidance, credit impairment, rates, historical data, projections, financial services
false
Risk Assessment and Management
Financial Services
Multiple Chart
Barclays
Add to my slides
Remove from favorites
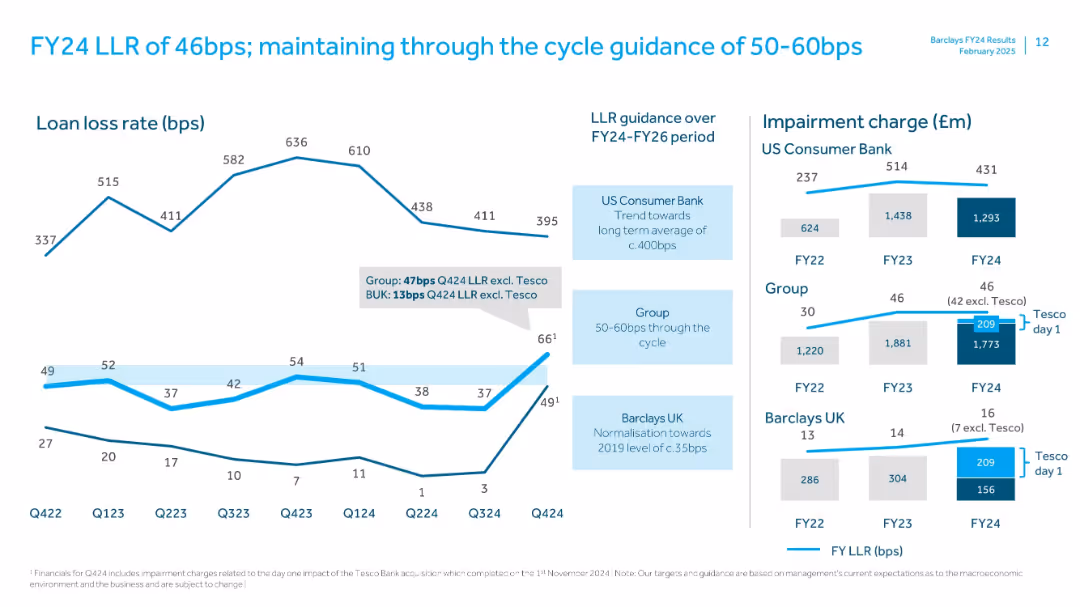
Line chart with loan loss rate trends; right panel shows impairment charges.
Risk Assessment and Management
Financial Services
Barclays discusses loan loss rate trends and their alignment with long-term cycle guidance. The chart includes business segment breakdowns and the effect of Tesco Bank acquisition and model adjustments on impairment charges.
loan loss rate, Barclays, impairment charges, US Consumer Bank, Q125, risk metrics, Tesco Bank, cycle guidance, credit loss
false
Risk Assessment and Management
Financial Services
Multiple Chart
Barclays
Add to my slides
Remove from favorites
The slide features a line chart and a column chart illustrating loan loss rates and credit impairment charges over time.
Risk Assessment and Management
Financial Services
This slide reiterates the loan loss rate guidance for FY23, supported by historical data and current credit impairment charges, to emphasize risk management.
loan loss, rate, guidance, FY23, credit, impairment, charges, financial, line chart, column chart
false
Risk Assessment and Management
Financial Services
Multiple Chart
Barclays
Add to my slides
Remove from favorites
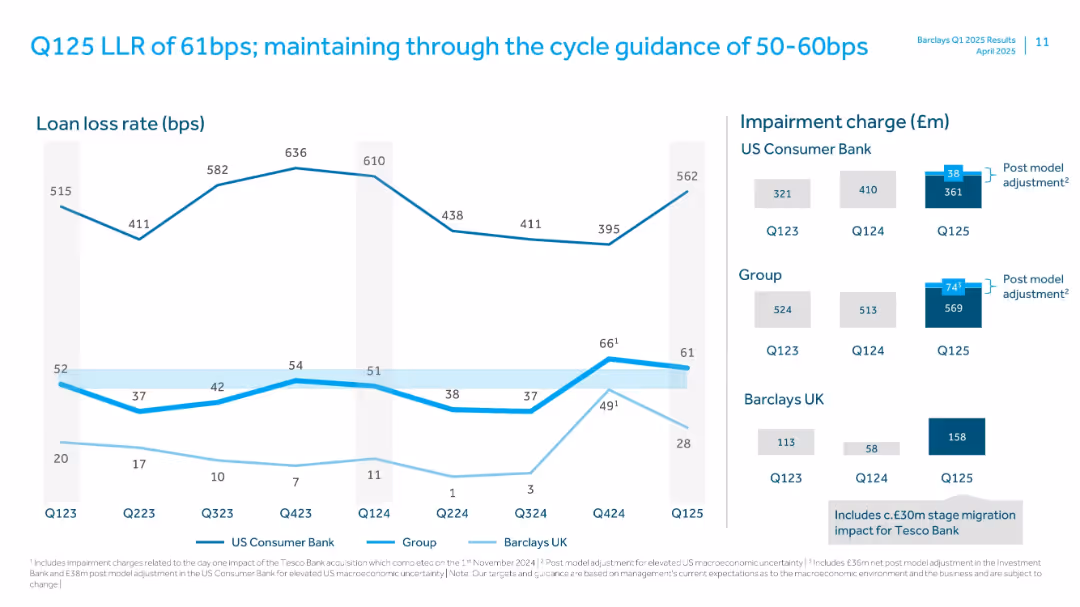
Dual-panel layout with line graphs and bar charts; impairment charge data on right; callouts and LLR commentary per business unit
Risk Assessment and Management
Financial Services
Examines Barclays' loan loss rate (LLR) trends across FY24, breaking out specific charges including Tesco acquisition effects. Guidance for 50–60bps cycle average and analysis of UK Consumer Bank and Group-level trends is presented.
loan loss rate, LLR, impairment charge, Tesco, Barclays, FY24, guidance, risk management
false
Risk Assessment and Management
Financial Services
Multiple Chart
Barclays
Add to my slides
Remove from favorites
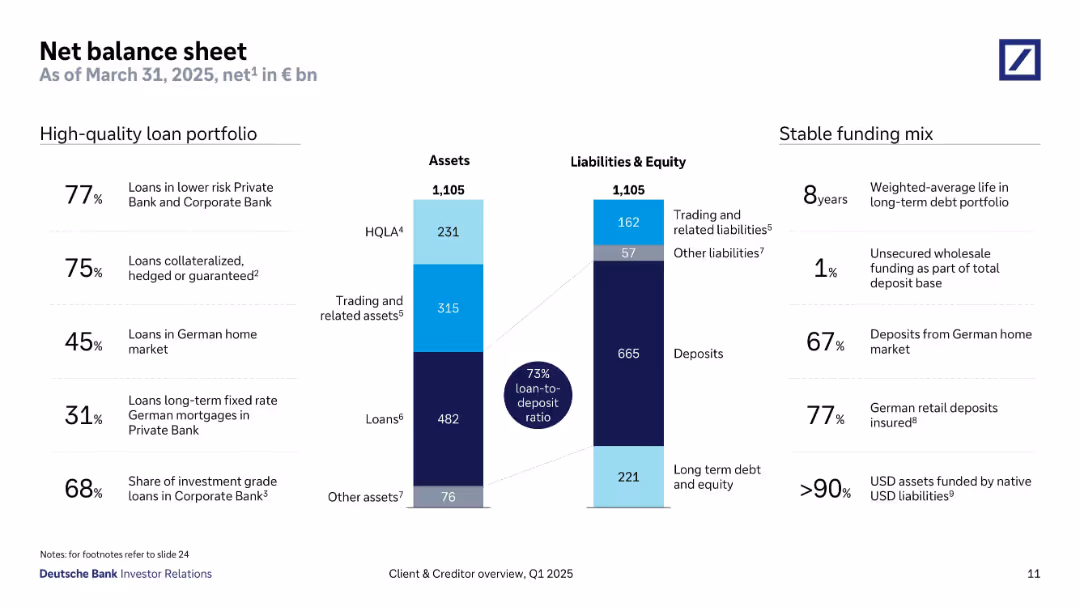
Dual column layout: asset vs liability distribution, supported by sidebar statistics on loan quality and funding.
Financial Performance
Financial Services
This balance sheet slide shows €1,105bn in total assets/liabilities, highlighting a 73% loan-to-deposit ratio. It emphasizes loan quality (77% in low-risk segments) and funding stability, with most deposits from the German market and minimal reliance on unsecured wholesale funding.
loan portfolio, balance sheet, funding mix, deposits, HQLA, asset quality, loan-to-deposit, liabilities
false
Financial Performance
Financial Services
Mixed Chart
Deutsche Bank
Add to my slides
Remove from favorites
Uses a pie chart to display the composition of a loan book across different banking divisions and sectors.
Investment Analysis
Financial Services
Presenting a comprehensive view of the loan book composition, this slide is instrumental for investors and financial analysts. It breaks down the portfolio by sectors such as residential mortgages and corporate banking, providing insights into risk diversification, loan exposure, and strategic investment opportunities within the banking industry.
Loan Portfolio, Banking, Investment Analysis, Risk Diversification, Sector Breakdown
false
Investment Analysis
Financial Services
Mixed Chart
Deutsche Bank
Add to my slides
Remove from favorites
The slide is divided into two main sections: a table with loan portfolio breakdown and a pie chart for loan distribution, accompanied by key credit metrics, set against a blue and white background.
Financial Performance
Financial Services
Showcasing a financial institution's loan portfolio and credit overview, this slide provides detailed breakdowns of loan types and performance metrics. It serves to convey financial health and risk distribution, highlighting secured loans and credit ratings.
loan portfolio, credit overview, metrics, financial health
false
Financial Performance
Financial Services
Multiple Chart
Goldman Sachs
Add to my slides
Remove from favorites
This slide presents two column charts, one for average commercial and industrial loans and the other for average commercial real estate loans, with supporting text below. The design is straightforward and data-centric.
Financial Performance
Financial Services
Highlighting the quality and growth of loan portfolios, the slide presents data on commercial and industrial loans and commercial real estate loans, indicating a conservative approach to credit and a leadership position in the middle market lending space.
Loan portfolio, credit quality, market lending, commercial real estate
false
Financial Performance
Financial Services
Multiple Chart
JP Morgan
Add to my slides
Remove from favorites
Contains a stacked column chart displaying the average loans by client segment over five years, with text annotations on 2020 growth factors and 1Q22 loan performance.
Financial Performance
Financial Services
Reviews JPMC's loan portfolio diversification, noting a balanced growth in commercial and real estate lending, alongside competitive market challenges and strong performance indicators.
loan portfolio, diversification, JPMC, commercial lending, real estate, market competition, performance indicators
false
Financial Performance
Financial Services
Mixed Chart
JP Morgan
Add to my slides
Remove from favorites
This slide contains four pie charts displaying loan portfolio characteristics and a section titled 'High Quality Private Education Loan Portfolio' with a descriptive text box.
Financial Performance
Financial Services
The slide presents characteristics of a private education loan portfolio, highlighting credit quality and payment types. It's useful for investors and analysts assessing loan portfolio health and risk profile.
Loan Portfolio, Education, Financial Quality, FICO Scores, Interest Rates, Payment Types, Credit
false
Financial Performance
Financial Services
Multiple Chart
Morgan Stanley
Add to my slides
Remove from favorites
The slide presents a column chart comparing average loan balances classified as 'Core' and 'Non-core' for three different years. It also includes a percentage breakdown of originations retained, showing an increase in core retention. The slide is visually balanced, with the charts taking center stage and key figures highlighted in larger font sizes for emphasis.
Financial Performance
Financial Services
This slide examines the restructuring of the bank's loan portfolio, showing a strategic shift towards 'Core' loan balances. It can be used to discuss financial performance and strategic decisions regarding asset management within the bank.
loan portfolio, financial restructuring, core balances, strategic shift
false
Financial Performance
Financial Services
Mixed Chart
JP Morgan
Add to my slides
Remove from favorites
The slide is divided into a detailed text description on the left and a column chart on the right, showing portfolio transaction volumes by asset class over three years.
Market Analysis and Trends
Financial Services
It provides an overview of the loan portfolio sales market in the UK, highlighting transaction volumes and market impacts of the COVID-19 pandemic.
loan portfolio, market overview, UK, transactions, COVID-19
false
Market Analysis and Trends
Financial Services
Mixed Chart
EY
Add to my slides
Remove from favorites
Contains textual content and data metrics related to loan portfolios. Utilizes a clean and professional layout with selective emphasis.
Financial Performance
Financial Services
Presents the operating model and loan portfolio of First Republic, showing their contribution to Chase and key risk metrics.
loan portfolio, operating model, risk metrics, acquisition strategy, client lending, financial health
false
Financial Performance
Financial Services
Diagram
JP Morgan
Add to my slides
Remove from favorites
Pie chart of Q4 2024 loan book composition by business unit; key highlights in box on right
Product and Service Analysis
Financial Services
Illustrates the distribution of the €485bn loan portfolio across business units. The Private Bank holds the majority with 53%, mostly retail mortgages. Corporate Treasury Services and Investment Bank also contribute, highlighting a diversified and risk-managed portfolio across sectors and geographies.
loan portfolio, Private Bank, Investment Bank, diversification, Q4 2024
false
Product and Service Analysis
Financial Services
Mixed Chart
Deutsche Bank
Add to my slides
Remove from favorites
The slide includes a pie chart showing the distribution of loans and multiple annotations describing different loan types.
Financial Performance
Financial Services
The slide details the loan portfolio composition, highlighting key segments and growth or decline trends since 2014.
loan, portfolio, real estate, secured, credit, risk, financial, performance
false
Financial Performance
Financial Services
Mixed Chart
UBS
Add to my slides
Remove from favorites
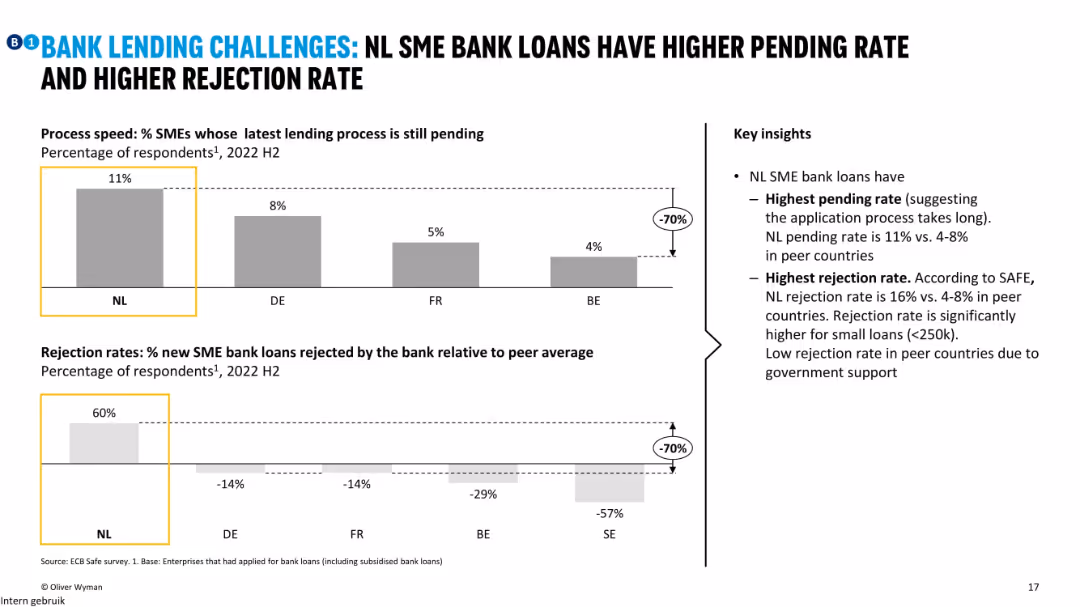
Two bar graphs comparing process speed and rejection rates across countries, with callouts showing NL has the highest rates in both categories.
Risk Assessment and Management
Financial Services
The slide highlights that SMEs in the Netherlands face the longest bank loan processing times and highest rejection rates, especially for smaller loans. Peer countries benefit from faster processing and more supportive lending environments.
loan rejection, processing speed, NL, bank lending, SME
false
Risk Assessment and Management
Financial Services
Multiple Chart
Oliver Wyman
Add to my slides
Remove from favorites
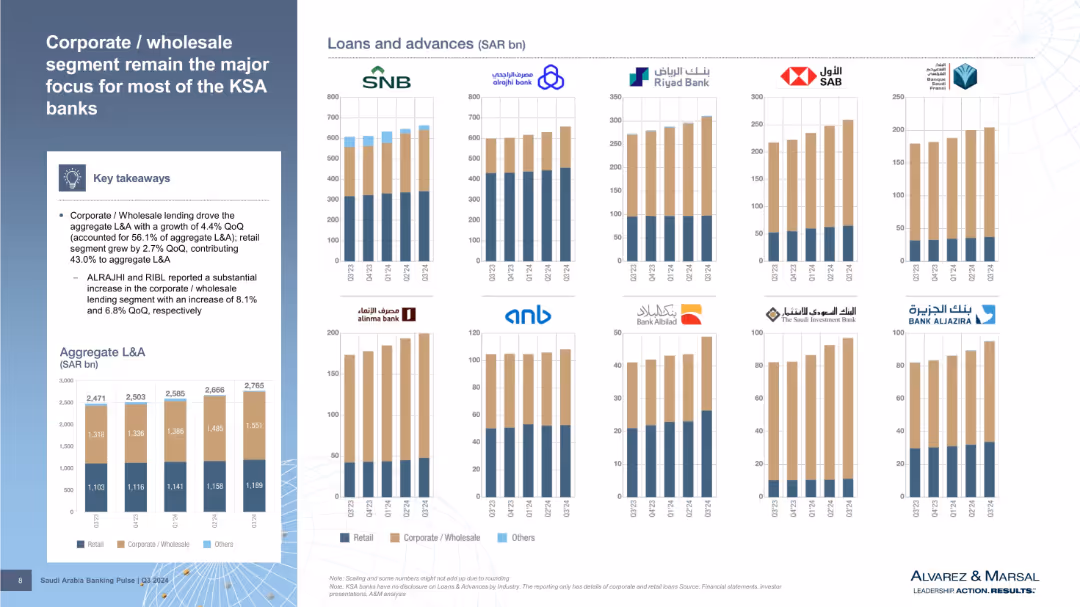
Left side contains text box; right side presents stacked bar charts of L&A by bank and segment (retail, wholesale, others) over time.
Customer and Market Segmentation
Financial Services
Focuses on the dominance of corporate/wholesale lending in total L&A composition. Charts depict loan segmentation trends across banks, revealing key contributors to loan growth.
loans & advances, corporate lending, retail loans, KSA banks, segment analysis, Q3’24, bar charts, financial trends
false
Customer and Market Segmentation
Financial Services
Multiple Chart
Alvarez & Marsal
Add to my slides
Remove from favorites
The slide contains a combination of column charts and text blocks. It shows the distribution of loans and advances to customers, both on and off-balance sheet.
Financial Performance
Financial Services
This slide provides a detailed breakdown of loans and advances to customers, including mortgages, Lombard loans, and corporate loans, essential for analyzing loan portfolio quality.
Loans, Advances, Customers, Mortgages, Lombard
false
Financial Performance
Financial Services
Multiple Chart
UBS
Add to my slides
Remove from favorites
A combination of a scatter plot and a table, highlighting major US real estate loan sales. The scatter plot uses differently sized circles to represent sale amounts, while the table lists details like the seller, buyer, and year. The slide has a clean design with blue color highlights.
Client Case Studies
Financial Services
The slide presents a case study of a historic loan sale, showcasing the company's capability in handling large transactions. Aimed at potential clients or partners interested in the company's track record in the financial market.
loan sales, real estate, market capability, transaction handling
false
Client Case Studies
Financial Services
Mixed Chart
Goldman Sachs
Add to my slides
Remove from favorites
This slide features a large pie chart detailing loan composition with categories such as German Mortgages, Leveraged Debt Capital Markets, and others, accompanied by a legend differentiating sectors like Corporate Bank and Private Bank.
Market Analysis and Trends
Financial Services
Displays a breakdown of a bank's loan portfolio by type and bank division, emphasizing the prominence of mortgages in their portfolio and providing strategic insights into the bank’s lending focus.
loans, banking, portfolio, mortgages, finance
false
Market Analysis and Trends
Financial Services
Mixed Chart
Deutsche Bank
Add to my slides
Remove from favorites
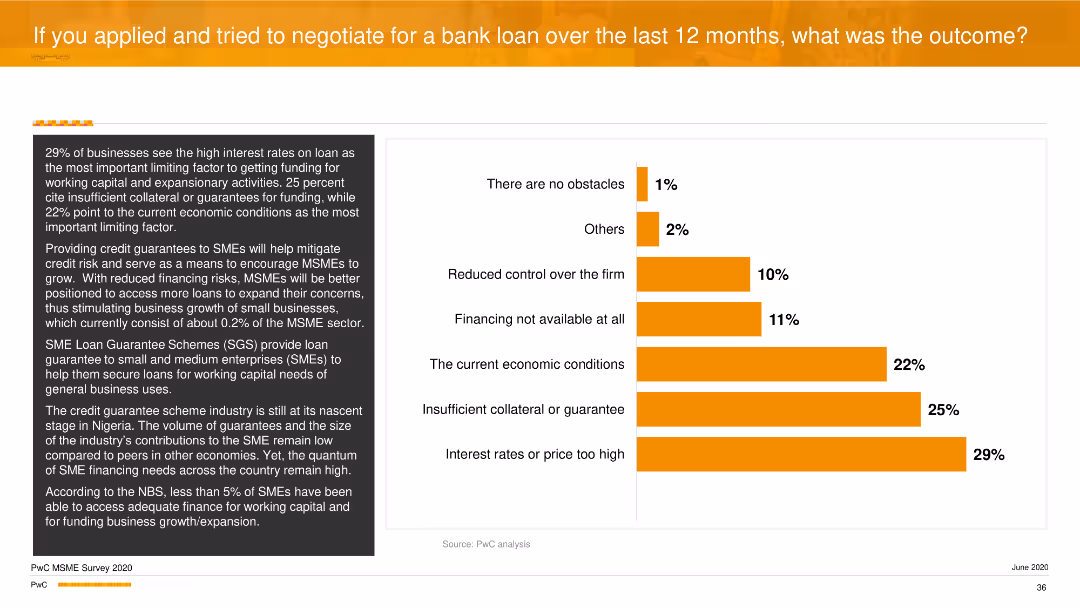
A vertical column chart detailing limiting factors in obtaining loans, such as high interest rates and insufficient collateral. Text on the left elaborates these factors.
Risk Assessment and Management
Financial Services
The slide focuses on the barriers to securing bank loans, emphasizing high interest rates and insufficient collateral as major obstacles. It discusses the potential impact of credit guarantee schemes on improving access to finance for SMEs.
Loans, Barriers, Financing, SMEs, PwC
false
Risk Assessment and Management
Financial Services
Mixed Chart
PwC/Strategy&
Add to my slides
Remove from favorites
Vertical column chart showing loan exposure by sector, alongside a descriptive table.
Risk Assessment and Management
Financial Services
Summarizes corporate loan exposure and impairment risks by sector, highlighting synthetic protection levels.
loans, corporate, risk assessment, sectors, protection
false
Risk Assessment and Management
Financial Services
Mixed Chart
Barclays
Add to my slides
Remove from favorites
Includes pie charts and column chart. Visuals are dense with quantitative data and projections, presented in a segmented format.
Risk Assessment and Management
Financial Services
Provides insights into loan distribution and provisions for credit losses, critical for risk assessment and financial planning.
loans, credit losses, financial planning, risk assessment, provisions
false
Risk Assessment and Management
Financial Services
Multiple Chart
Deutsche Bank
Add to my slides
Remove from favorites
Slide contains column charts comparing loan and deposit figures across quarters for different banking segments. Highlights include changes in loan and deposit levels, and loan-to-deposit ratios, with percentage changes noted. Text sections provide key insights into performance and market trends.
Financial Performance
Financial Services
Analyzes quarterly loan and deposit trends within the bank's different segments, providing insights into financial health and market activities. Useful for internal reviews and investor relations to demonstrate stability and growth in core banking activities.
loans, deposits, banking segments, quarterly trends, financial health, market activities, loan-to-deposit ratio
false
Financial Performance
Financial Services
Multiple Chart
Deutsche Bank
Add to my slides
Remove from favorites
Contains column charts and tables showing trends in loan and deposit figures over several quarters.
Financial Performance
Financial Services
This slide tracks the development of loans and deposits across various banking divisions, highlighting trends and changes. It is crucial for financial strategists and banking executives to assess liquidity management, lending practices, and deposit accumulation, enabling data-driven decision-making for operational and strategic initiatives in the banking sector.
Loans, Deposits, Banking Trends, Financial Analysis, Liquidity Management
false
Financial Performance
Financial Services
Multiple Chart
Deutsche Bank
Add to my slides
Remove from favorites
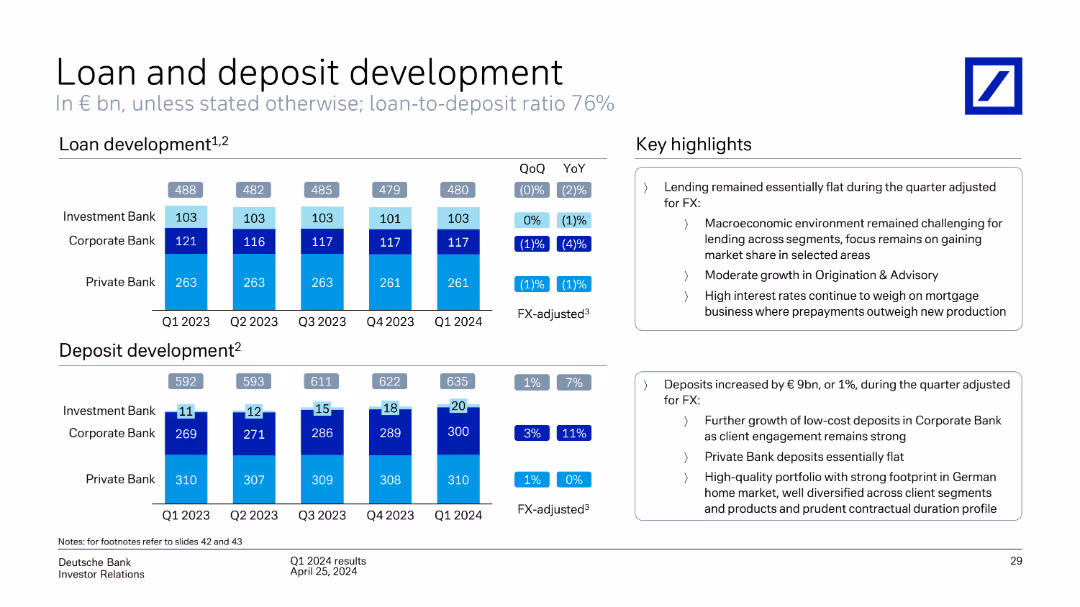
Two grouped bar charts show loan and deposit volumes by bank unit across five quarters; highlights are provided in a text box on the right.
Performance Metrics and KPIs
Financial Services
This slide details loan and deposit trends across business units (Investment, Corporate, Private Bank) from Q1 2023 to Q1 2024. Lending remained flat while deposits rose, mainly driven by the Corporate Bank. Key macroeconomic conditions and interest rate challenges are noted alongside business unit performance.
loans, deposits, Deutsche Bank, Q1 2024, corporate banking, private bank, investment bank, macroeconomic environment
false
Performance Metrics and KPIs
Financial Services
Multiple Chart
Deutsche Bank
Add to my slides
Remove from favorites
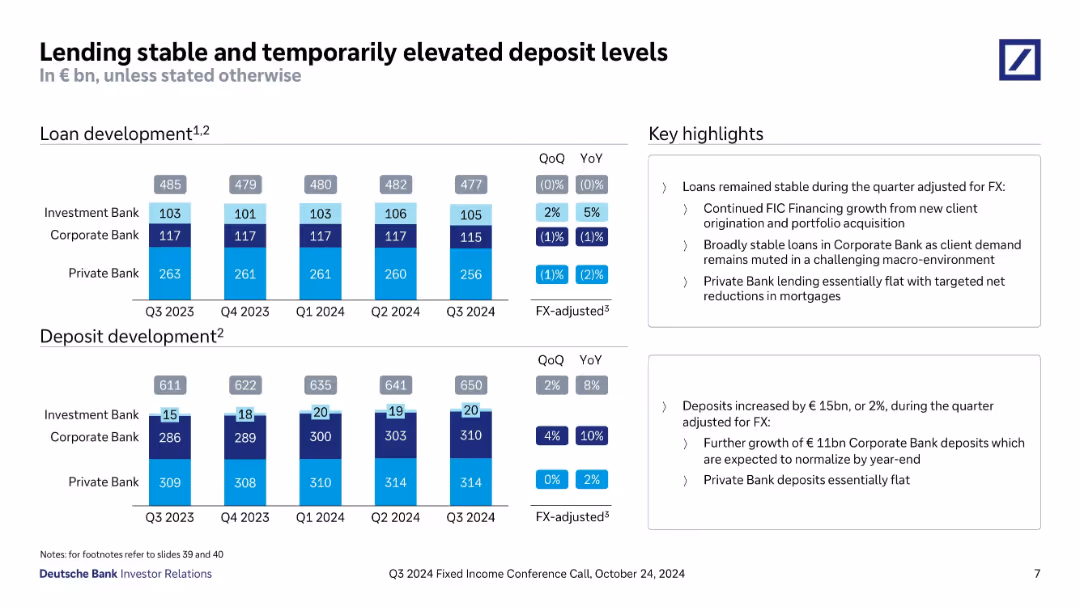
Two grouped bar charts comparing loan and deposit levels across quarters and segments (Investment, Corporate, Private Bank); key highlights address FX adjustments and segment behaviors.
Financial Performance
Financial Services
The slide details loan and deposit volumes across Deutsche Bank’s banking segments. Loans remained stable QoQ, while deposits increased by €15bn, driven by Corporate Bank. Commentary discusses stable conditions in Private Bank and continued client financing growth.
loans, deposits, development, corporate bank, private bank, FX, Q3 2024
false
Financial Performance
Financial Services
Multiple Chart
Deutsche Bank
Add to my slides
Remove from favorites
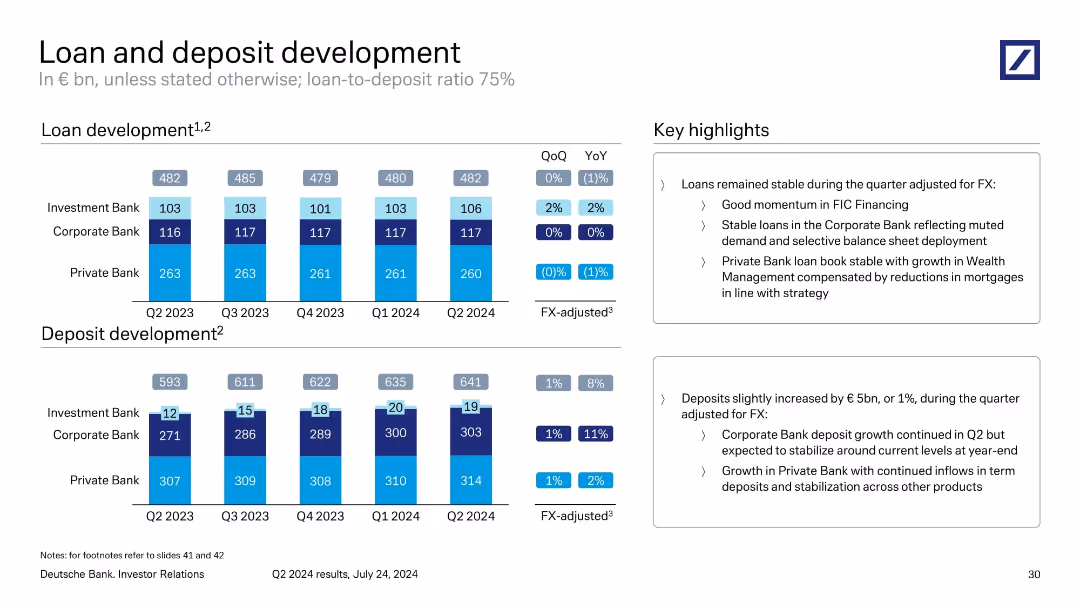
Split bar chart format for loan and deposit trends across five quarters by division. Key highlights shown in text boxes.
Performance Metrics and KPIs
Financial Services
Details Deutsche Bank’s loan and deposit volumes by segment. Loans remained flat YoY; deposits rose 1% QoQ. Highlights Private Bank loan stability and Corporate Bank deposit growth. FX adjustments considered in trends.
loans, deposits, development, FX-adjusted, Q2 2024, balance sheet
false
Performance Metrics and KPIs
Financial Services
Multiple Chart
Deutsche Bank
Add to my slides
Remove from favorites
Large column charts comparing the trends in average loans and retail deposits over several quarters.
Financial Performance
Financial Services
Analyzes the growth trends in loans and deposits, emphasizing their impact on financial stability and funding strategies.
Loans, Deposits, Growth, Finance
false
Financial Performance
Financial Services
Multiple Chart
Barclays
Add to my slides
Remove from favorites
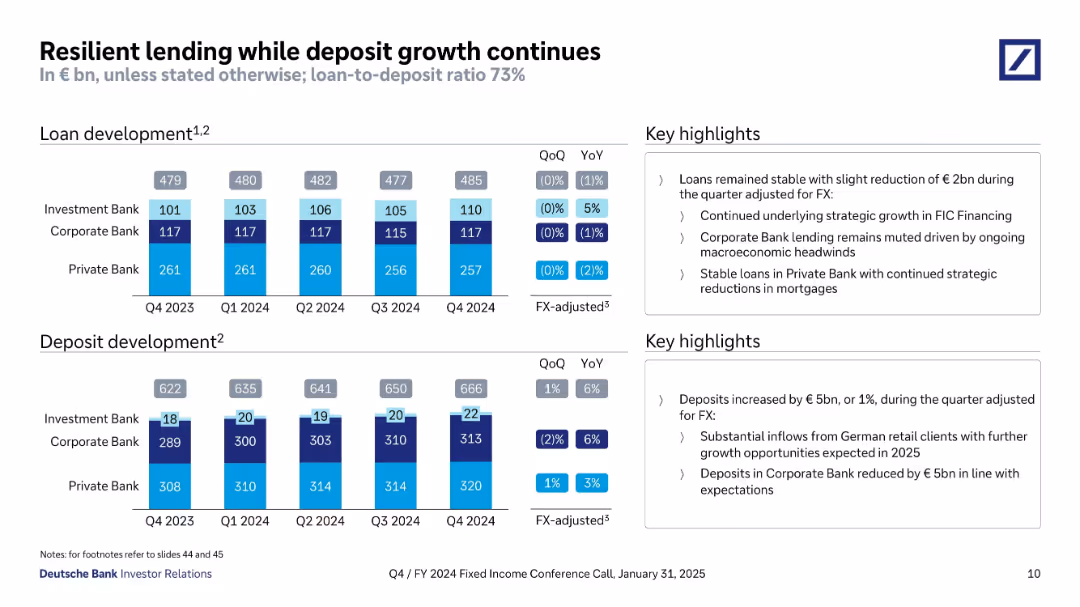
Upper section with loan development bar charts by division; lower section with similar charts for deposit development. Two columns of key highlights.
Performance Metrics and KPIs
Financial Services
The slide presents quarter-over-quarter and year-over-year trends in loans and deposits, noting stable loan volumes and strong deposit inflows, particularly from German retail clients. The loan-to-deposit ratio of 73% is emphasized.
loans, deposits, lending, Deutsche Bank, loan-to-deposit ratio, Q4 2024
false
Performance Metrics and KPIs
Financial Services
Multiple Chart
Deutsche Bank
Add to my slides
Remove from favorites
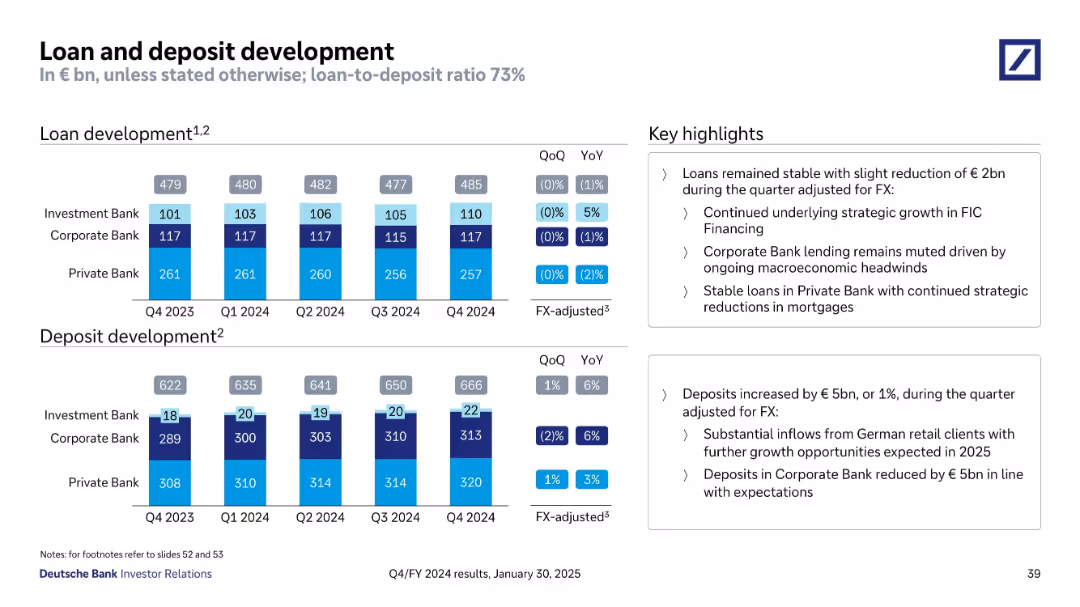
Two bar charts showing loan and deposit development across quarters; right side includes key highlights in boxed text format
Financial Performance
Financial Services
This slide shows quarterly loan and deposit figures broken down by banking divisions. Loans remained stable while deposits rose slightly. Strategic growth occurred in investment banking, while private bank loans were strategically reduced. Key factors include macroeconomic headwinds and FX adjustments.
loans, deposits, quarterly trend, FX-adjusted, banking divisions, stable
false
Financial Performance
Financial Services
Multiple Chart
Deutsche Bank
Add to my slides
Remove from favorites
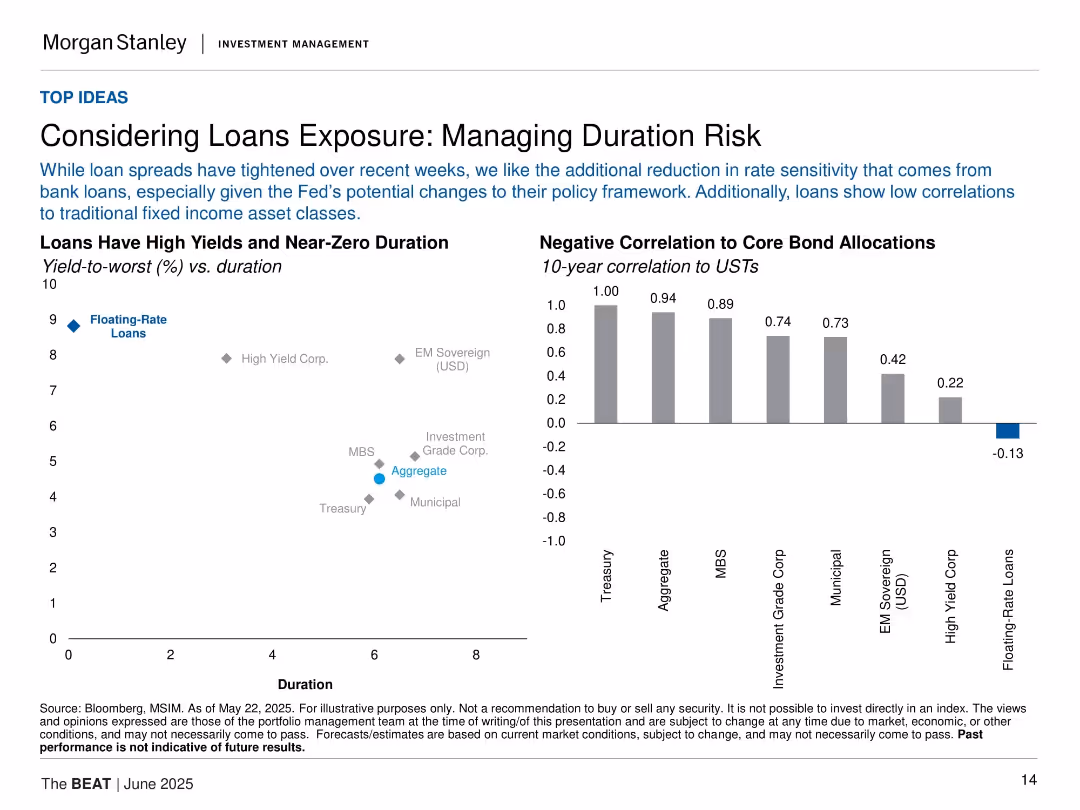
Two visualizations: scatter plot (yield vs. duration) and bar chart (correlation to USTs); grid layout.
Risk Assessment and Management
Financial Services
The slide highlights floating-rate loans as an attractive option for managing duration risk, especially given low correlations with core bond allocations. It shows yield/duration positioning and negative correlations to USTs.
loans, duration risk, floating-rate, correlation, fixed income, USTs, yield, bank loans, interest sensitivity
false
Risk Assessment and Management
Financial Services
Multiple Chart
Morgan Stanley
Add to my slides
Remove from favorites
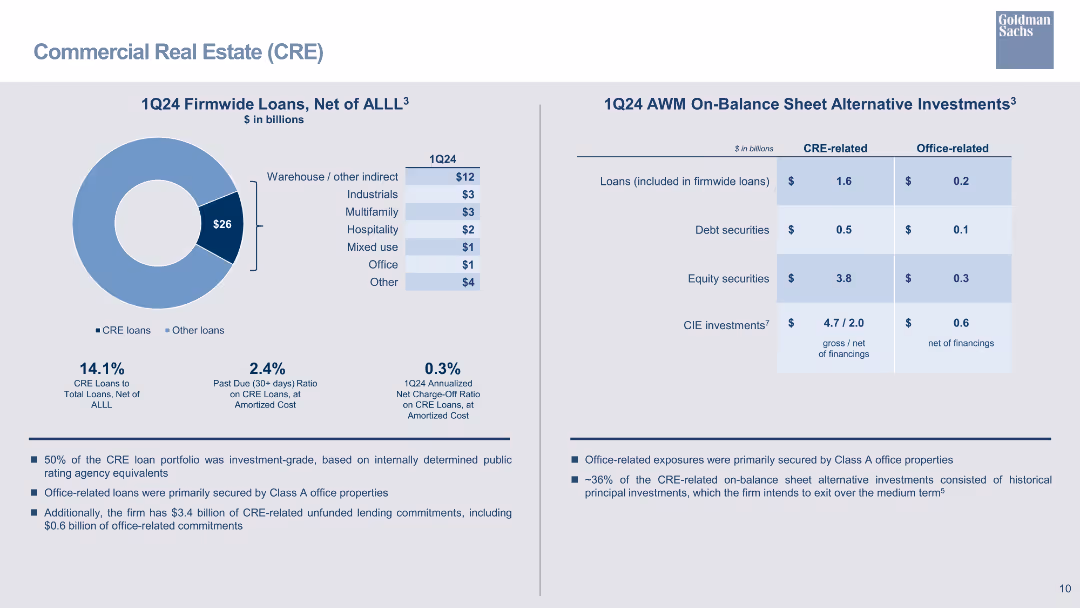
The slide contains a pie chart showing firmwide loans distribution and a table comparing on-balance sheet investments. The design is minimal with blue and grey tones.
Financial Performance
Financial Services
The slide presents an overview of 1Q24 firmwide loans, net of ALLL, highlighting commercial real estate loans and office-related alternative investments.
loans, investments, CRE, financial performance, firmwide loans
false
Financial Performance
Financial Services
Mixed Chart
Goldman Sachs
Add to my slides
Remove from favorites
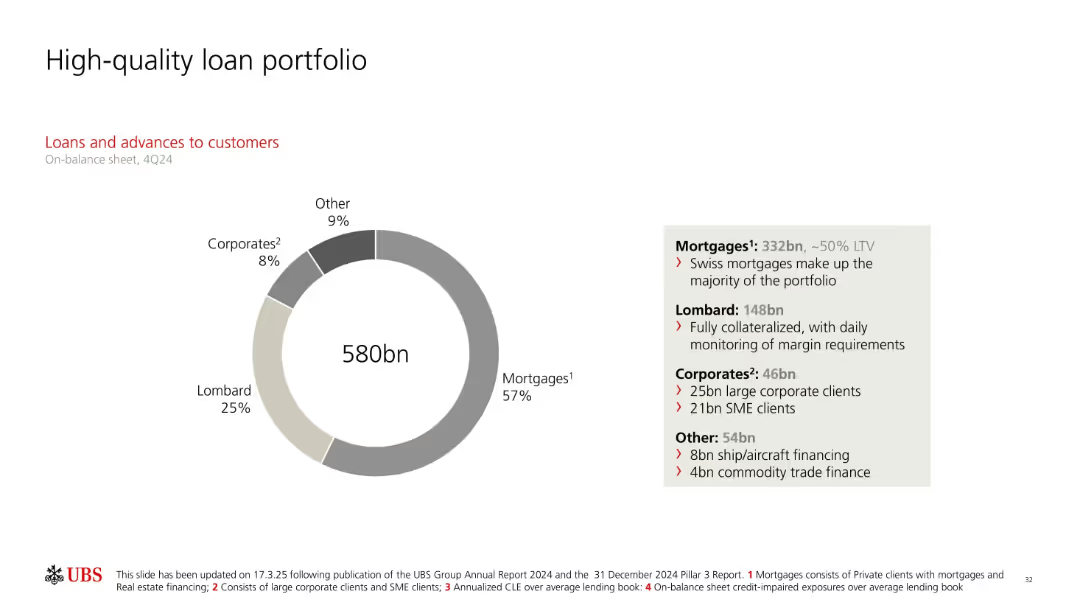
Donut chart showing loans and advances to customers (580bn) segmented by mortgage, Lombard, corporates, and others. Text box explains loan quality, collateralization, and exposure types.
Product and Service Analysis
Financial Services
Shows UBS’s 4Q24 customer loan portfolio composition, emphasizing the dominance of mortgages and Lombard loans. Details on collateral coverage, corporate loan segmentation, and other smaller loan types like aircraft and trade finance are included to support asset quality narrative.
loans, mortgages, Lombard, corporates, UBS, LTV, secured lending
false
Product and Service Analysis
Financial Services
Mixed Chart
UBS
Add to my slides
Remove from favorites
Slide contains two column charts, two detailed tables, and accompanying explanatory text.
Financial Performance
Financial Services
Details loans and net interest income across business segments, used for financial analysis or to inform investment decisions.
Loans, Net Interest, Income Analysis, Banking
false
Financial Performance
Financial Services
Multiple Chart
Goldman Sachs
Add to my slides
Remove from favorites
This slide is a visual composite of column charts and textual analysis. It contrasts loans and net interest income by segment, utilizing different shades to represent diverse financial products and services.
Financial Performance
Financial Services
Designed for financial analysts, the slide compares loans and net interest income across various segments, providing insights into lending performance and interest revenue streams, crucial for evaluating a company's profitability and risk management.
loans, net interest income, financial segments, lending performance, interest revenue
false
Financial Performance
Financial Services
Multiple Chart
Goldman Sachs
Add to my slides
Remove from favorites
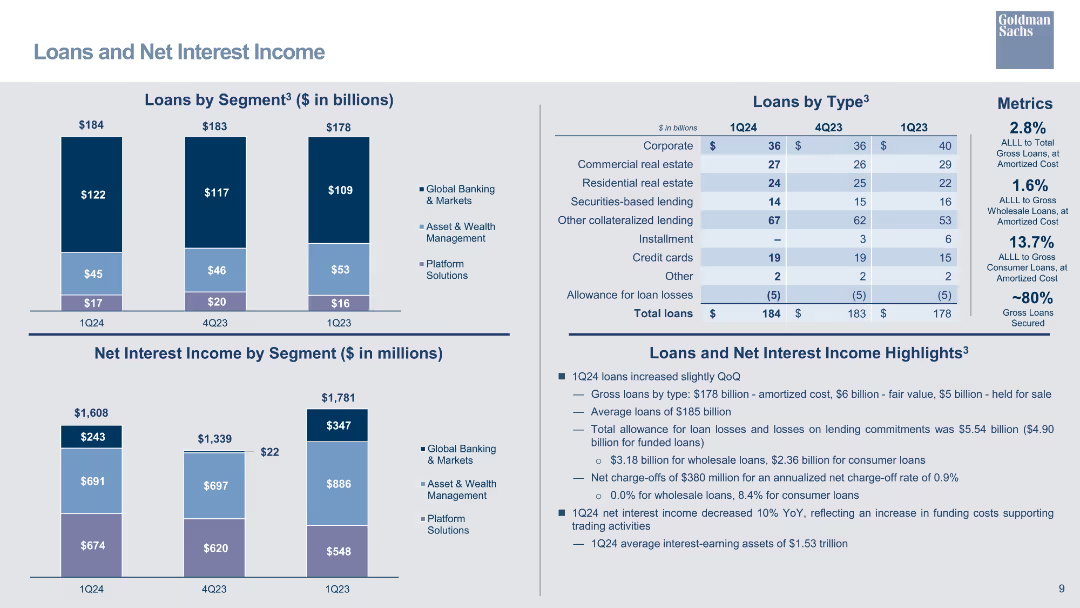
This slide presents multiple column charts and tables detailing loans by segment and type, with a key highlights section on the right. The design is moderate, with clear visual divisions between sections.
Financial Performance
Financial Services
Provides a breakdown of loans and net interest income across business segments. Typically used in risk assessments, financial analysis, and investor briefings to illustrate credit distribution and interest income dynamics.
Loans, Net Interest Income, Global Banking, Asset Management
false
Financial Performance
Financial Services
Multiple Chart
Goldman Sachs
Add to my slides
Remove from favorites
The slide includes a bar chart for loans by segment and a table for net interest income by segment, with detailed metrics on loan types.
Financial Performance
Financial Services
Details loans by segment and net interest income, highlighting changes over time and providing metrics on various loan types.
loans, net interest income, segment analysis, bar chart, loan metrics, financial performance
false
Financial Performance
Financial Services
Multiple Chart
Goldman Sachs
Add to my slides
Remove from favorites
Slide displays column charts for 'Loans by Segment' and 'Net Interest Income by Segment', as well as a table detailing loan types with corresponding metrics.
Financial Performance
Financial Services
This slide examines the distribution and performance of loans across different segments, including the net interest income, to provide insights on the financial health and lending effectiveness of the organization.
Loans, Net Interest Income, Segment Distribution, Corporate Lending, Securities-based Lending, Loan Performance, Interest Metrics
false
Financial Performance
Financial Services
Multiple Chart
Goldman Sachs
Add to my slides
Remove from favorites
The slide displays a line chart illustrating hypothetical performance, comparing lump distribution vs. borrowing outcomes over time. It includes historical data with marked points of outperformance.
Financial Performance
Financial Services
It examines the hypothetical performance of a 60/40 portfolio, analyzing the outcomes of lump-sum distributions versus borrowing over a specific period.
loan, spending, performance, borrowing, distribution
false
Financial Performance
Financial Services
Single Chart
UBS
Add to my slides
Remove from favorites
This slide features a doughnut chart illustrating the distribution of the loan portfolio, accompanied by a text box detailing loan types and figures.
Financial Performance
Financial Services
The slide breaks down the loan portfolio by type, highlighting the high collateralization rate and specific figures for various loan categories.
loans, portfolio, collateralized, mortgages, lombard, corporates, UBS, 2Q23, financial, high-quality
false
Financial Performance
Financial Services
Mixed Chart
UBS
Add to my slides
Remove from favorites
Features a large pie chart detailing the composition of IFRS loans, accompanied by text sections summarizing key financial highlights.
Financial Performance
Financial Services
Discusses the diversification and risks within the loan portfolio, detailing the percentage share of each loan type and highlighting year-to-date impacts on the financial structure.
loans, portfolio, financial, diversification, risk, IFRS, composition, banking
false
Financial Performance
Financial Services
Mixed Chart
Deutsche Bank
Add to my slides
Remove from favorites
Donut chart showing the breakdown of loans and advances by type, with details on mortgages, lombard, corporates, and other categories.
Financial Performance
Financial Services
Overview of UBS's loan portfolio quality, detailing various loan categories and highlighting the composition and collateral.
Loans, portfolio, mortgages, lombard, corporates
false
Financial Performance
Financial Services
Mixed Chart
UBS
Add to my slides
Remove from favorites
Pie chart detailing loan distribution by sector and column chart depicting provisions for credit losses.
Risk Assessment and Management
Financial Services
Provides an overview of the loan book's composition and associated risk management practices, emphasizing diversified loans.
loans, risk management, credit losses, banking, pie chart, bar graph, distribution, provisions, diversified, sectors
false
Risk Assessment and Management
Financial Services
Multiple Chart
Deutsche Bank
Add to my slides
Remove from favorites
Comprises a large pie chart detailing loan compositions across various sectors, color-coded for clarity. Key highlights provide insights into risk management and sector allocation.
Risk Assessment and Management
Financial Services
Provides an overview of the loan distribution by sector, highlighting the diversity and risk associated with different segments. It offers insights into risk management practices and strategic loan portfolio diversification within a financial institution.
loans, risk management, financial, diversification, sectors
false
Risk Assessment and Management
Financial Services
Mixed Chart
Deutsche Bank
Add to my slides
Remove from favorites
The slide includes two bar graphs comparing reasons for working at local vs. multinational companies, with categorical labels and percentages.
Strategic Planning
Professional Services
Examines the motivations of highly skilled workers when choosing between local and multinational companies, highlighting compensation, flexibility, and culture.
local appeal, multinational companies, worker motivation, compensation, corporate culture, strategic planning, talent management
false
Strategic Planning
Professional Services
Multiple Chart
Accenture
Add to my slides
Remove from favorites
This slide presents a bar chart comparing local authorities by the number of high-growth companies, paired with a table showing total investment received.
Market Analysis and Trends
Government & Public Sector
Focuses on the distribution of high-growth companies and investment across UK local authorities, highlighting areas with significant economic activity like Edinburgh and Manchester.
local authorities, high-growth companies, economic development, investment received, regional comparison, economic hubs, UK cities, business clustering
false
Market Analysis and Trends
Government & Public Sector
Multiple Chart
Barclays
Add to my slides
Remove from favorites
The slide contains two bar charts showing the number of high-growth companies per 1,000 people and fundraising per capita, with statistical data and a key.
Market Analysis and Trends
Government & Public Sector
Analyzes high-growth company density and fundraising efficiency per capita across various UK local authorities, providing a comparative economic scale.
local authorities, per capita analysis, high-growth companies, fundraising, economic scale, regional analysis, investment efficiency, population-adjusted metrics
false
Market Analysis and Trends
Government & Public Sector
Multiple Chart
Barclays
Add to my slides
Remove from favorites
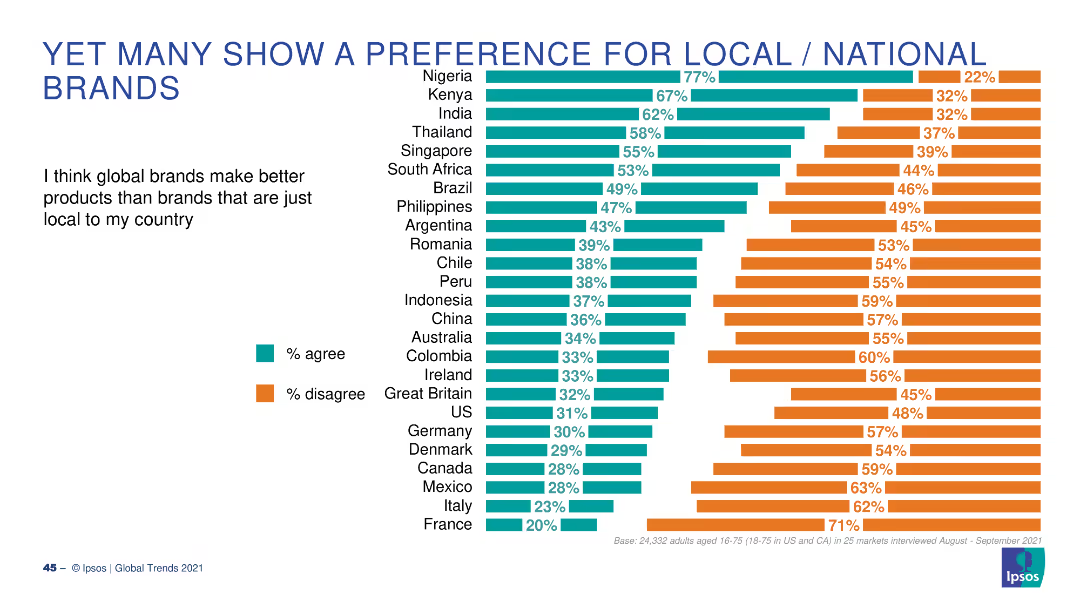
A bar chart with horizontal bars showing the percentage of people who agree or disagree that global brands make better products than local brands, across various countries.
Market Analysis and Trends
Consumer Goods
This slide presents survey results on consumer preferences for global vs. local brands, with data from multiple countries highlighting varying opinions.
local brands, global brands, preferences, consumer, survey
false
Market Analysis and Trends
Consumer Goods
Multiple Chart
IPSOS
Add to my slides
Remove from favorites
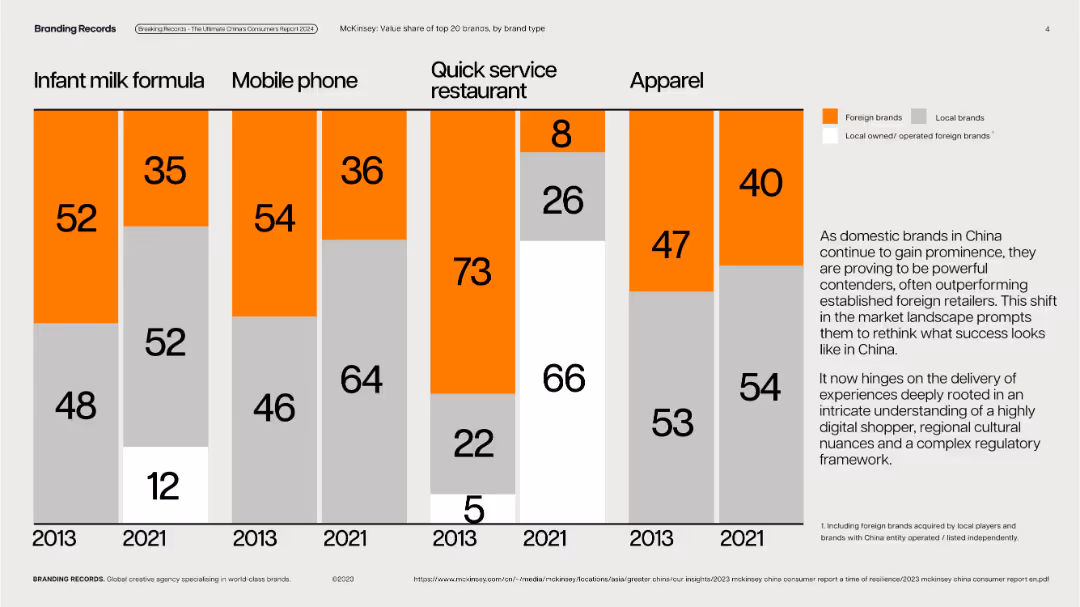
Vertical stacked bar charts with year-over-year brand type breakdowns by category; clean, grid layout.
Competitive Landscape
Consumer Goods
Displays value share of top 20 brands (foreign vs. local) in five product categories across 2013 and 2021, illustrating the growing prominence of local Chinese brands across sectors like mobile, apparel, and quick service restaurants.
local brands, market share, consumer goods, competition, China, brand shift
false
Competitive Landscape
Consumer Goods
Mixed Chart
McKinsey
Add to my slides
Remove from favorites
A column chart comparing revenue growth of local versus multinational companies from 2012 to 2021.
Competitive Landscape
Professional Services
Discusses the rising market share of local companies in various industries and their competitive strategies against multinationals.
Local competition, market share, industry growth, competitive strategies
false
Competitive Landscape
Professional Services
Mixed Chart
Accenture
Add to my slides
Remove from favorites
Includes a scatter plot chart correlating the number of high-growth companies with GVA by local authorities, supplemented with descriptive text and a key.
Regulatory and Compliance
Government & Public Sector
Explores the relationship between the density of high-growth companies and local economic performance measured by GVA, offering insights into regional economic policies.
local economies, high-growth companies, GVA, economic impact, local authorities, regional development, policy implications, economic analysis, public sector
false
Regulatory and Compliance
Government & Public Sector
Mixed Chart
Barclays
Add to my slides
Remove from favorites
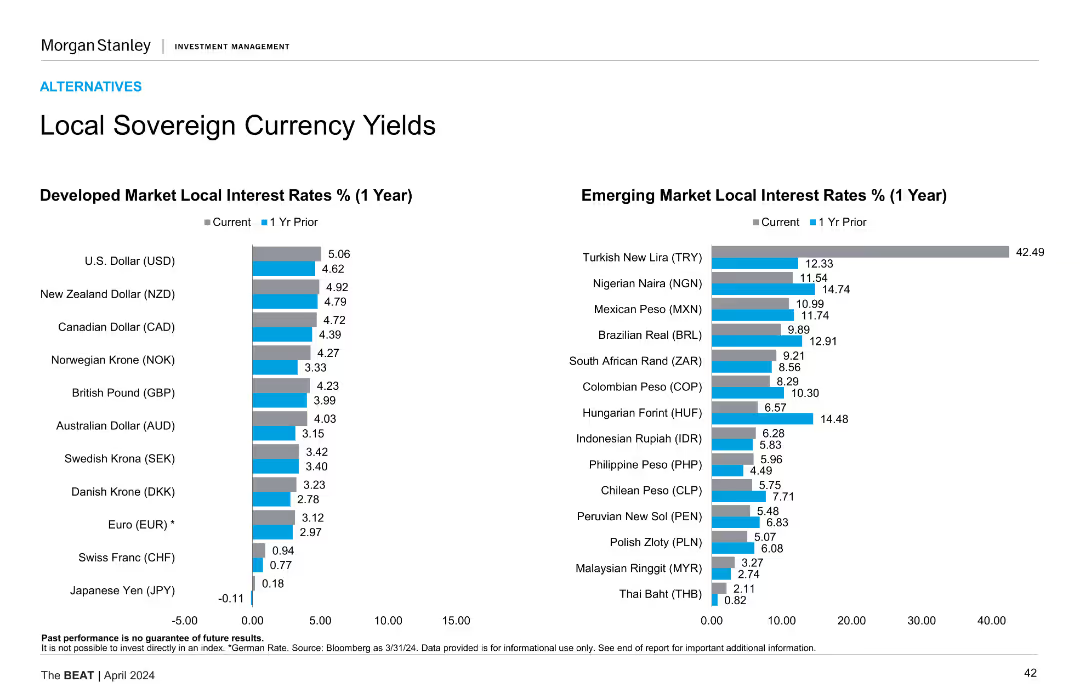
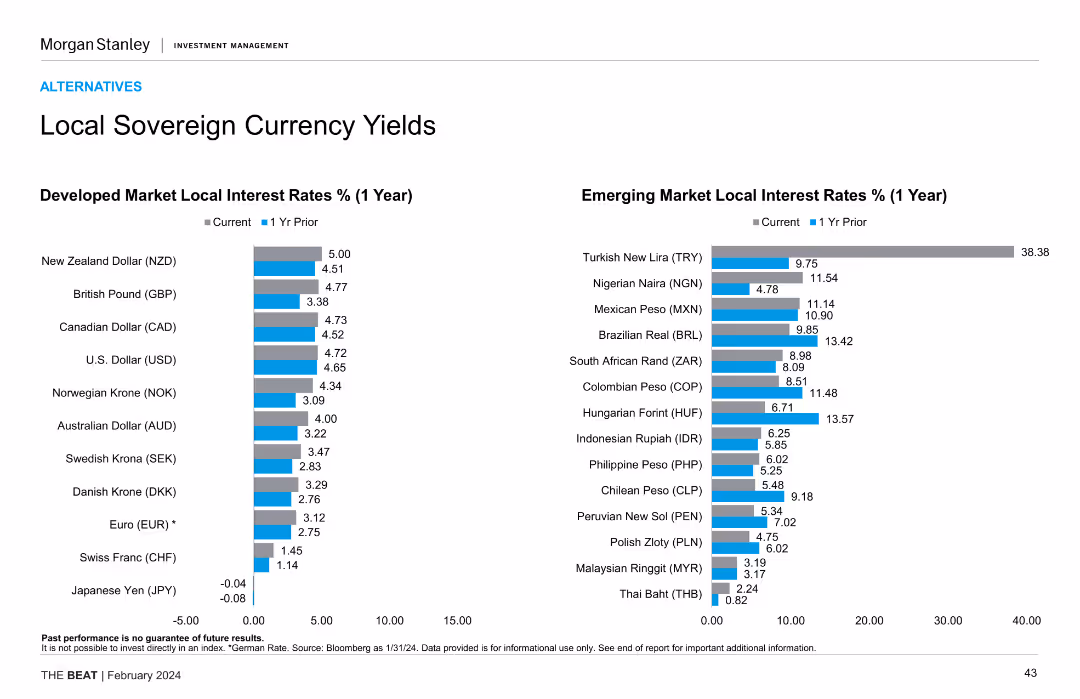
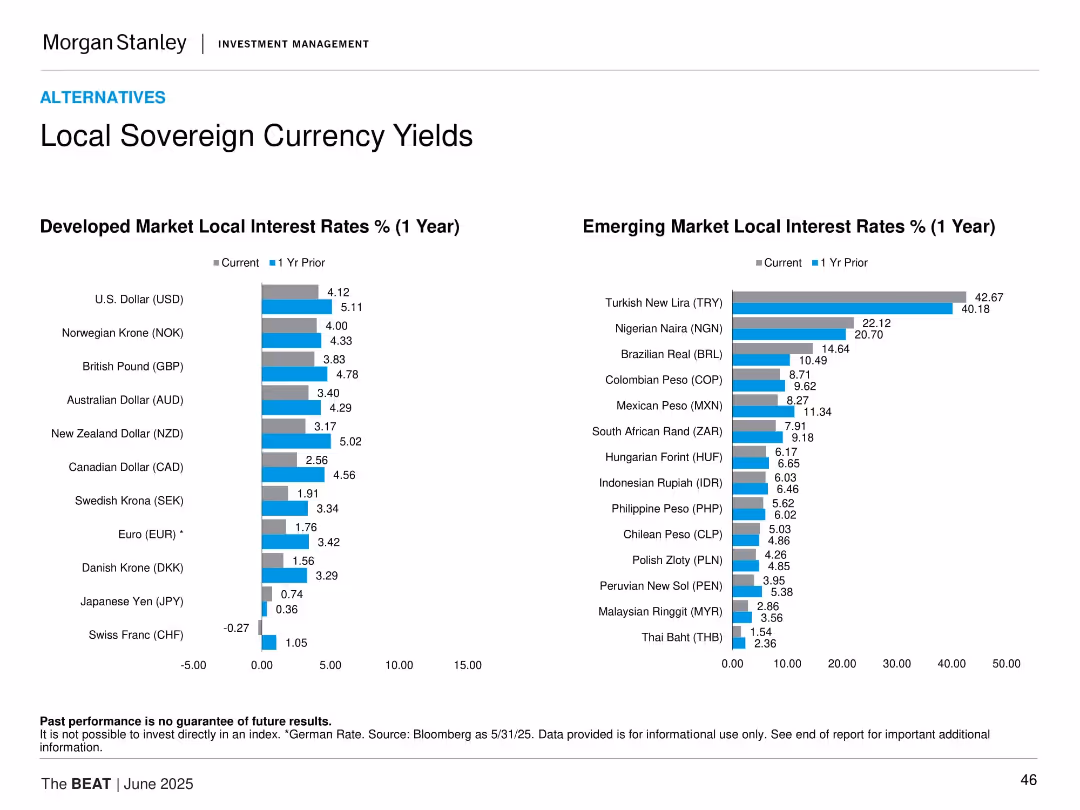
Contains two bar charts comparing current and prior year local interest rates for developed and emerging market currencies.
Market Analysis and Trends
Financial Services
The slide provides a comparison of local sovereign currency yields between the current year and one year prior for both developed and emerging markets.
local interest rates, currency yields, developed markets, emerging markets
false
Market Analysis and Trends
Financial Services
Multiple Chart
Morgan Stanley
Add to my slides
Remove from favorites
The slide includes two column charts: one for developed market local interest rates and one for emerging market local interest rates, comparing current rates with rates from the prior year.
Market Analysis and Trends
Financial Services
This slide examines the local interest rates for sovereign currencies in developed and emerging markets, providing a comparative analysis of current and previous year rates.
local interest rates, sovereign currencies, developed markets, emerging markets, analysis
false
Market Analysis and Trends
Financial Services
Multiple Chart
Morgan Stanley
Add to my slides
Remove from favorites
Two vertical column charts comparing developed market local interest rates vs. emerging market local interest rates over a 1-year period, with the current and prior year's rates shown side by side for each currency.
Financial Performance
Financial Services
Compares the local sovereign currency yields for developed and emerging markets, highlighting changes over a one-year period. Useful for understanding interest rate trends and investment opportunities in different markets.
local interest rates, sovereign yields, developed markets, emerging markets, currency comparison
false
Financial Performance
Financial Services
Multiple Chart
Morgan Stanley
Add to my slides
Remove from favorites
The slide features two charts: a bar chart on investment universe and Latin American investor allocation, and a bar chart on sector exposure.
Market Analysis and Trends
Financial Services
The slide assesses local and global investment opportunities, with a focus on Latin American investors and sector-specific exposures within global markets.
local investing, global opportunities, Latin America, investor allocation, sector exposure, market analysis, investment strategies
false
Market Analysis and Trends
Financial Services
Multiple Chart
JP Morgan
Add to my slides
Remove from favorites
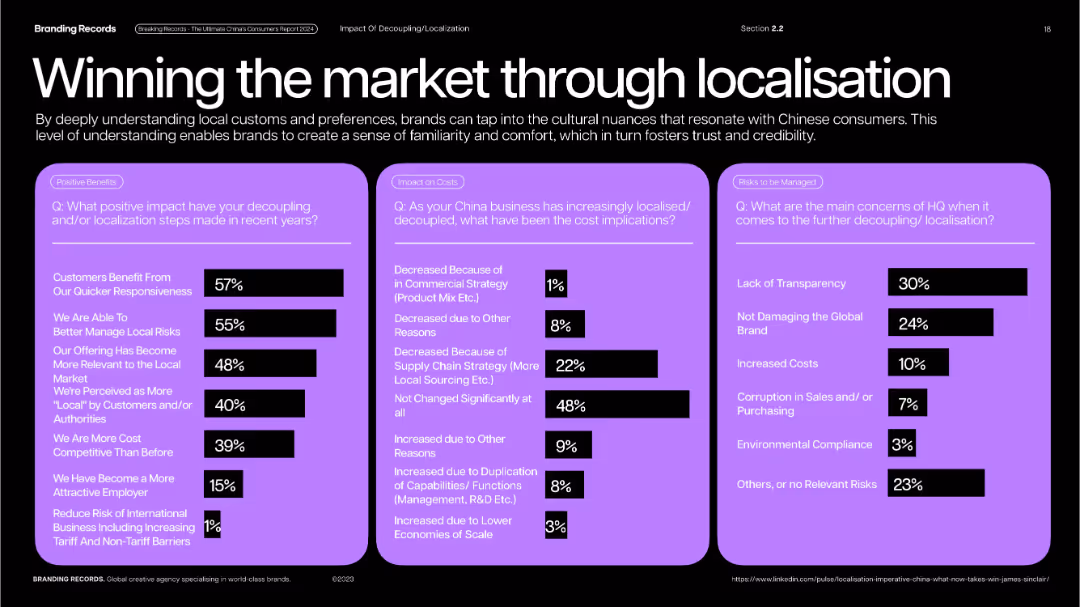
Three-column purple info-box layout; all content in black and white fonts with bar chart percentages.
Strategic Planning
Professional Services
Breaks down benefits, cost impacts, and HQ concerns related to localization in China. Key benefits include responsiveness, risk management, and competitiveness; concerns include transparency and brand integrity.
localisation, decoupling, transparency, cost strategy, risk management, brand relevance
false
Strategic Planning
Professional Services
Single Chart
McKinsey
Add to my slides
Remove from favorites
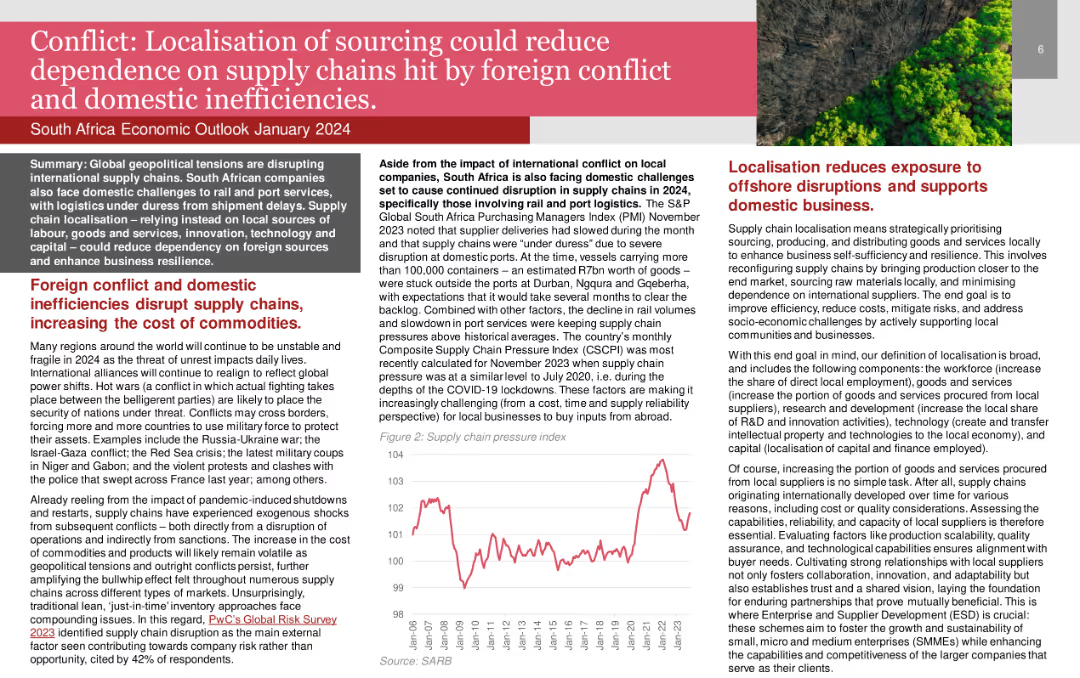
Line chart showing the Supply Chain Pressure Index over time.
Risk Assessment and Management
Transportation & Logistics
Highlights the benefits of localizing sourcing in South Africa to reduce reliance on disrupted international supply chains.
Localisation, Supply Chains, Conflict, Domestic Inefficiencies, South Africa
false
Risk Assessment and Management
Transportation & Logistics
Mixed Chart
PwC/Strategy&
Add to my slides
Remove from favorites
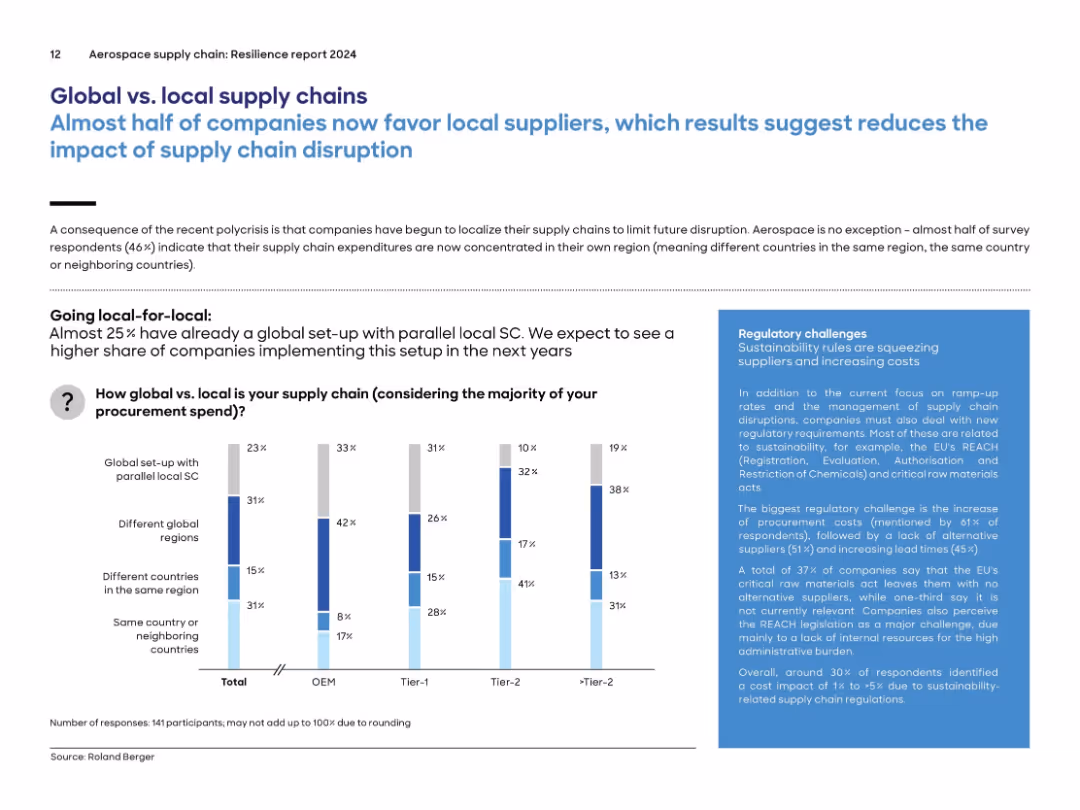
Full-width bar chart segmented by company type (OEM to >Tier-2); text discusses localization trends; sidebar on regulatory challenges.
Strategic Planning
Environmental Services & Sustainability
The slide shows a growing trend toward localized supply chains, with 46% of companies now sourcing within their own region. A split bar chart displays distribution of global vs. local supply chains by supplier tier. The right-hand sidebar explains regulatory pressures like EU REACH that drive this trend. Localization is viewed as a mitigation strategy for future disruptions.
local sourcing, global supply, supply chain, regional, localization, aerospace, regulatory, REACH
false
Strategic Planning
Environmental Services & Sustainability
Mixed Chart
Roland Berger
Add to my slides
Remove from favorites
The slide includes bar graphs and pie charts illustrating the challenges companies face with local supplier arrangements, such as inconsistent supply and uncompetitive prices.
Risk Assessment and Management
Industrial & Manufacturing
The slide examines the challenges companies encounter with local suppliers, focusing on inconsistent supply, uncompetitive prices, and poor product quality.
local suppliers, inconsistent supply, uncompetitive prices, supply challenges, local alternatives
false
Risk Assessment and Management
Industrial & Manufacturing
Mixed Chart
EY
Add to my slides
Remove from favorites
Side-by-side bar charts showing 1-year interest rates now vs. 1 year prior for developed and emerging markets.
Risk Assessment and Management
Financial Services
This slide compares current and past 1-year local interest rates for various developed and emerging market currencies. It provides insight into interest rate trends and inflation responses, highlighting shifts in monetary policy globally.
local yields, sovereign debt, interest rates, developed markets, emerging markets, monetary policy
false
Risk Assessment and Management
Financial Services
Multiple Chart
Morgan Stanley
Add to my slides
Remove from favorites
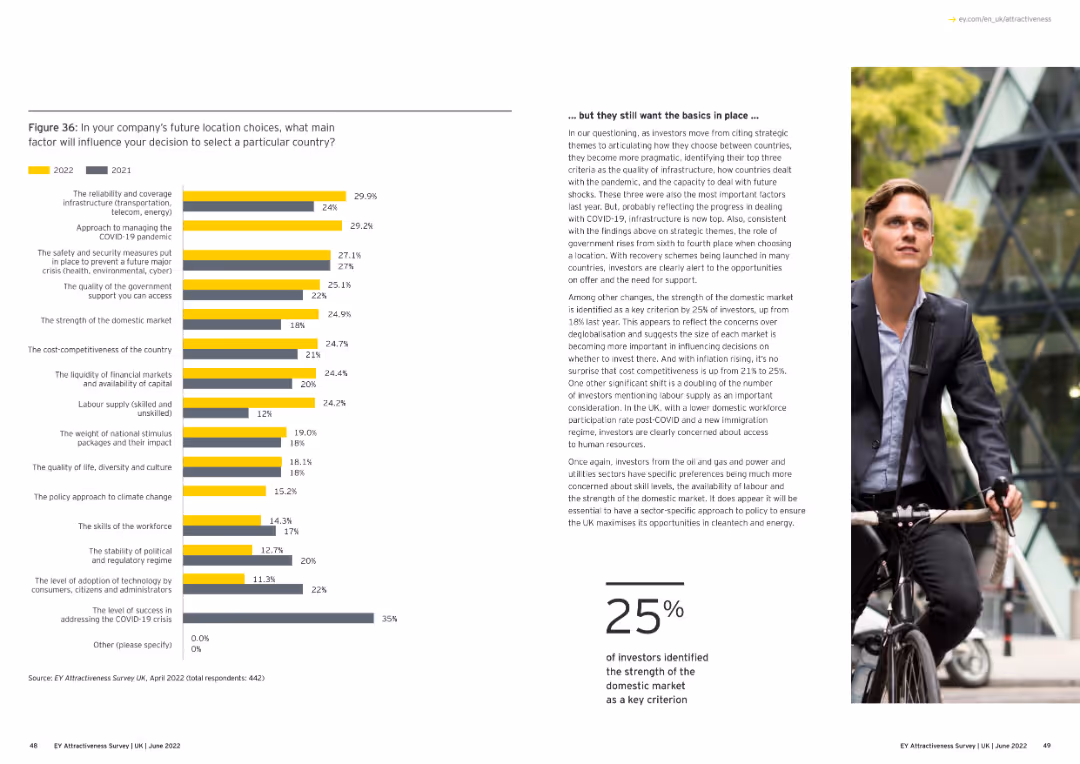
Text with a bar chart. The chart compares factors influencing future location choices for companies in 2021 and 2022.
Market Analysis and Trends
Financial Services
The slide details key factors influencing company location choices post-COVID, focusing on infrastructure, safety, and government support.
location choices, post-COVID, company decisions, column chart, infrastructure
false
Market Analysis and Trends
Financial Services
Mixed Chart
EY
Add to my slides
Remove from favorites
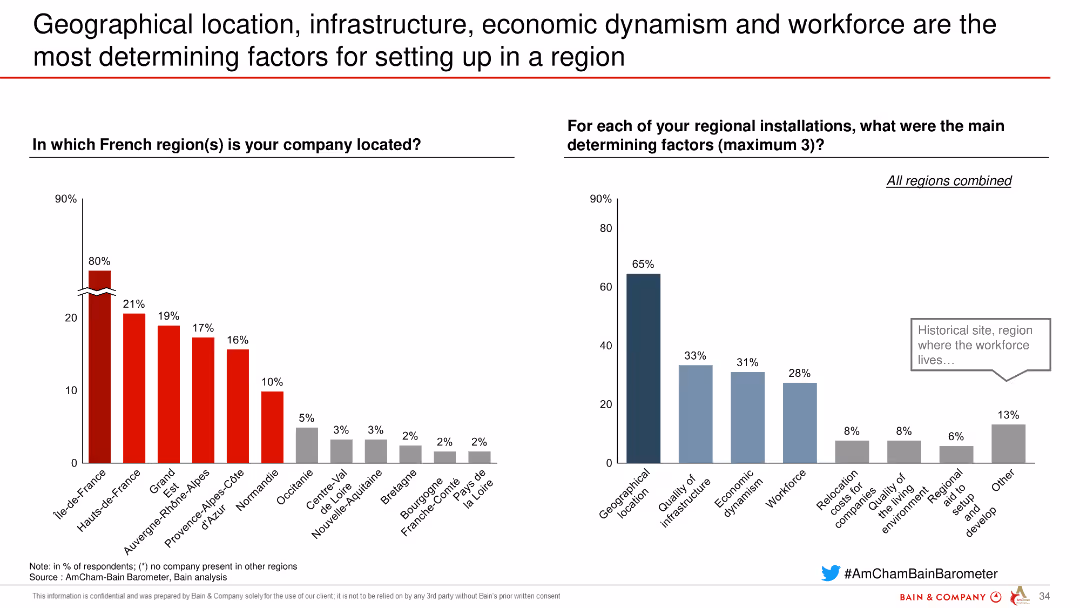
Two column charts showing factors for choosing a location in French regions, highlighting the importance of geographical location and infrastructure.
Strategic Planning
Industrial & Manufacturing
Highlights the key factors influencing company location decisions in French regions, emphasizing geographical and infrastructural considerations based on respondent data.
location, infrastructure, economic, workforce, factors
false
Strategic Planning
Industrial & Manufacturing
Multiple Chart
Bain
Add to my slides
Remove from favorites
Comparative scatter plots examining the relationship between lockdown speed, strictness, and the length of the COVID-19 outbreak.
Risk Assessment and Management
Government & Public Sector
Evaluates the effectiveness of early and strict lockdown measures in controlling the COVID-19 outbreak.
Lockdown Effectiveness, COVID-19, Outbreak Control, Government Policy
true
Risk Assessment and Management
Government & Public Sector
Multiple Chart
BCG
Add to my slides
Remove from favorites
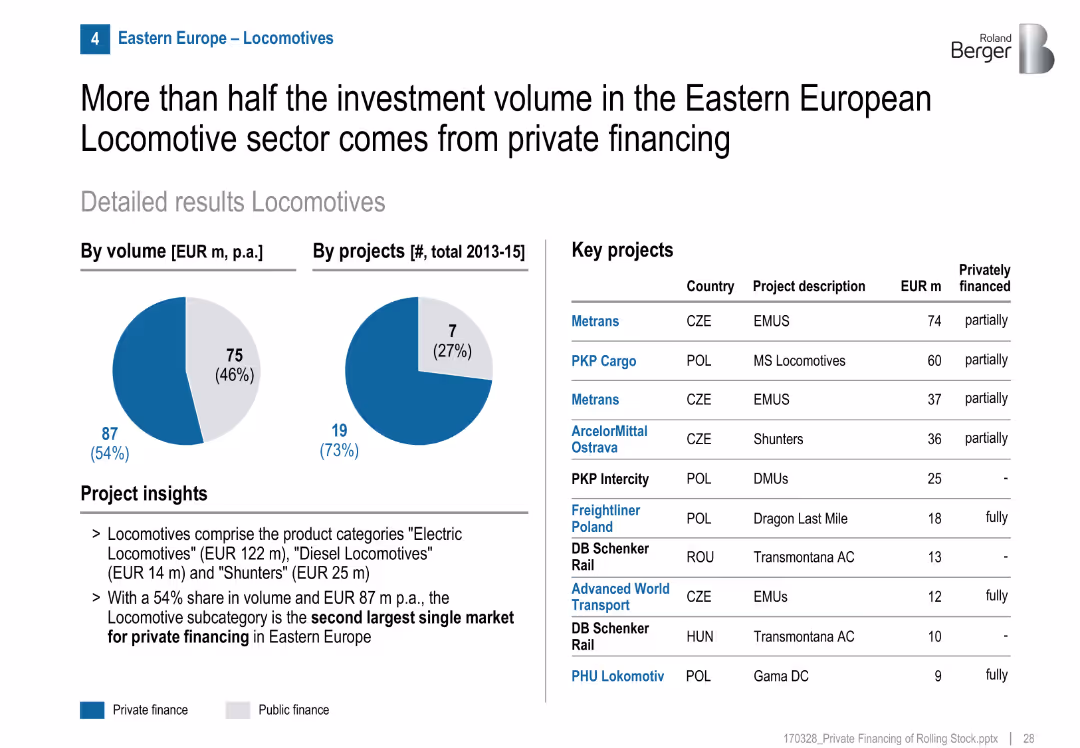
Pie charts show a 54% private finance share by volume, 27% by project count. Table with key projects and financing breakdown. Bullet-point insights on market subtypes.
Investment Analysis
Transportation & Logistics
Locomotives are the second-largest subcategory for private investment in Eastern Europe. Despite fewer private projects, they make up over half the investment volume.
locomotives, private finance, Eastern Europe, freight, investment, public-private mix, EMUs, shunters, MS locomotives
false
Investment Analysis
Transportation & Logistics
Mixed Chart
Roland Berger
Add to my slides
Remove from favorites
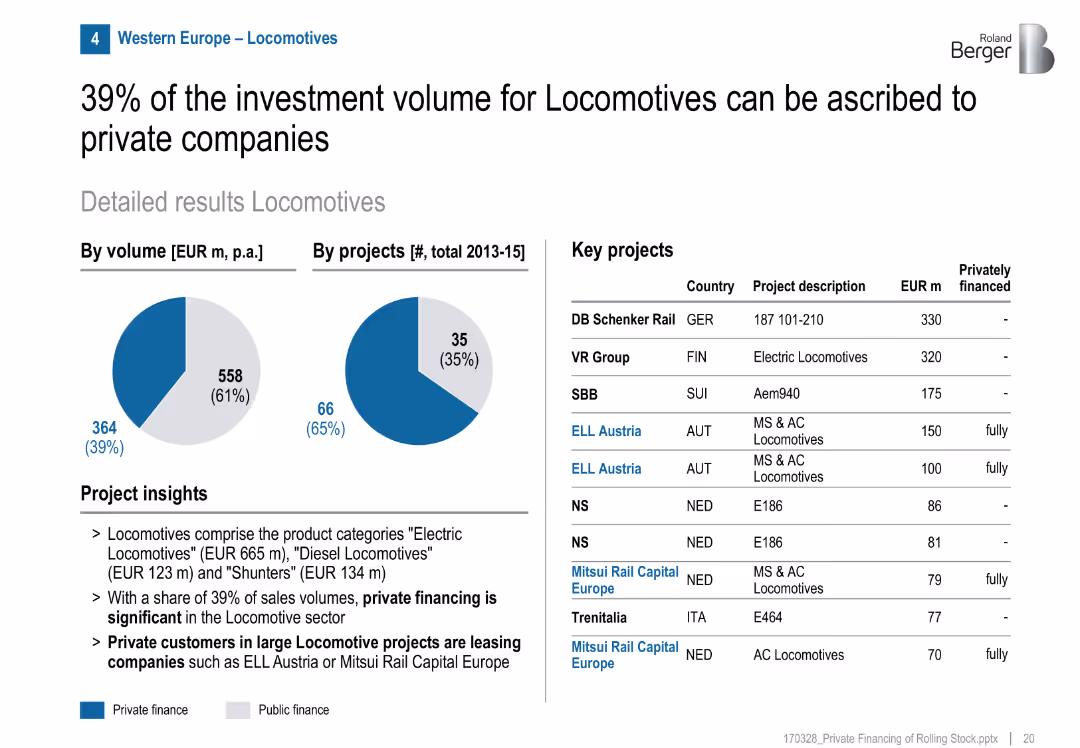
Pie charts (volume/projects), project list, highlights private leasing model
Product and Service Analysis
Transportation & Logistics
Locomotives have a high private financing share (39%), especially through leasing models with firms like ELL Austria and Mitsui Rail Capital Europe. Many projects fully privately financed.
locomotives, private leasing, rolling stock, ELL Austria, Mitsui, Europe, rail, investment
false
Product and Service Analysis
Transportation & Logistics
Mixed Chart
Roland Berger
Add to my slides
Remove from favorites
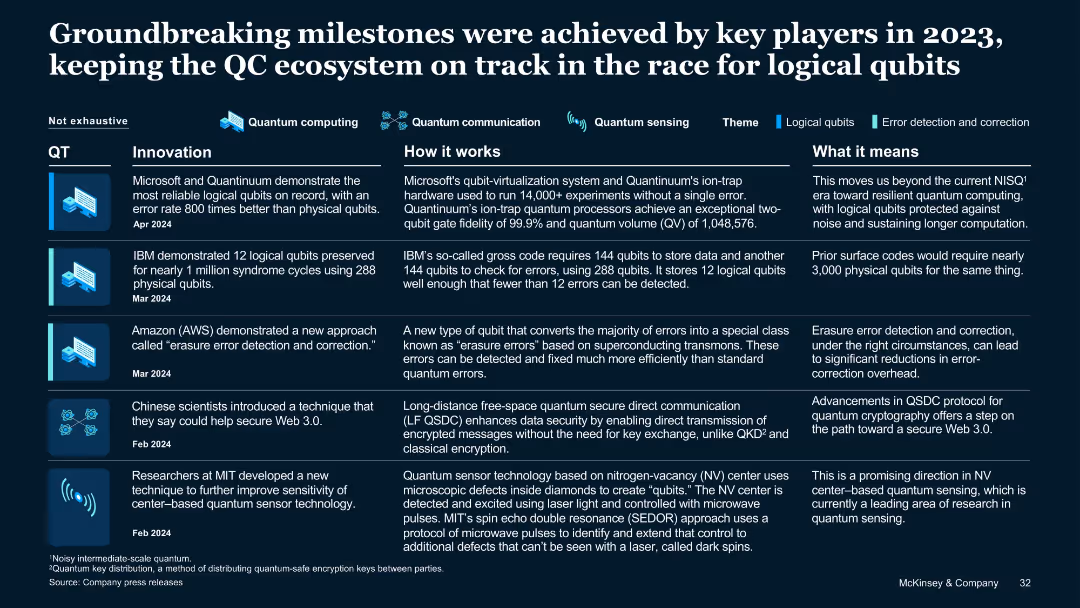
Three-column layout with icons, timelines, and technical summaries on innovations, workings, and implications in QC.
Technology and Digital Transformation
Technology & Software
Highlights 5 major milestones in quantum computing (QC) achieved in 2023–2024 by firms like Microsoft, IBM, AWS, MIT, and Chinese scientists. Focuses on innovations in logical qubits, error correction, Web 3.0 security, and sensing technologies.
logical qubits, quantum computing, error correction, innovation, Web 3.0, sensors, IBM
false
Technology and Digital Transformation
Technology & Software
Table
McKinsey
Add to my slides
Remove from favorites
Features bubble charts and a linear scale to showcase the digital transformation's potential in logistics, including positive and negative value impacts.
Operational Efficiency
Transportation & Logistics
Analyzes how digital transformation could unlock $4 trillion in value for the logistics industry, emphasizing innovations like drones and shared transport capacity.
Logistics, Digital Transformation, Societal Impact, Industry Value, Innovation
false
Operational Efficiency
Transportation & Logistics
Mixed Chart
Accenture
Add to my slides
Remove from favorites
Side-by-side U.S. maps with product and feedstock advantage overlays; icons for transport/logistics.
Strategic Planning
Energy & Utilities
Shows Montana Renewables’ locational advantage in product distribution and feedstock sourcing. Highlights shorter routes, cost advantages, and favorable policy zones for the company versus competitors.
logistics, feedstock, Montana, PNW access, Calumet, LCFS, renewable fuel, location advantage, transport cost
false
Strategic Planning
Energy & Utilities
Multiple Chart
Goldman Sachs
Add to my slides
Remove from favorites
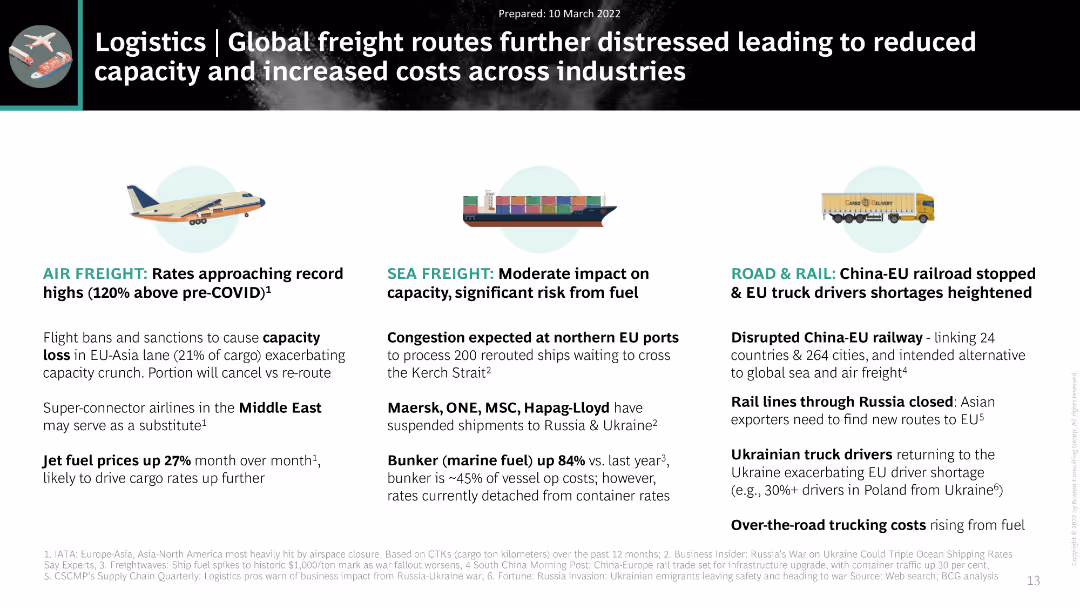
The slide uses a combination of text and icons to present the impact of global freight route disruptions on different modes of transportation: air freight, sea freight, and road & rail.
Market Analysis and Trends
Transportation & Logistics
The slide discusses the impact of global freight route disruptions caused by geopolitical events. It details specific issues affecting air freight, sea freight, and road & rail transportation, highlighting increased costs and capacity constraints across industries.
logistics, freight, transportation, disruptions, impact analysis, costs
false
Market Analysis and Trends
Transportation & Logistics
Pillar
BCG
Add to my slides
Remove from favorites
The slide is structured with a column chart and a line graph, where the column chart represents the portfolio occupancy percentages and the line graph tracks rent reversion percentage. The color scheme used is uniform for the columns, with a clear legend and time period indicators. It also includes an explanatory footnote about the data comparison.
Market Analysis and Trends
Real Estate & Construction
Analyzes the high occupancy levels and tenant retention rates within the light industrial/logistics portfolio, indicating effective management and market demand.
Logistics Portfolio, Occupancy Rates, Tenant Retention, Rent Reversion, Asset Management, Market Demand
false
Market Analysis and Trends
Real Estate & Construction
Single Chart
Morgan Stanley
Add to my slides
Remove from favorites
Column and pie charts with a timeline of portfolio value, clearly demarcated sections for acquisitions, divestments, and asset class distribution.
Strategic Planning
Real Estate & Construction
Used for strategic planning, showing the transition to logistics-focused assets with financial details and portfolio composition. It’s a strategic tool for presentations on investment shifts, asset management, and portfolio optimization within the logistics and real estate sectors.
Logistics, Strategy, Real Estate, Investments, Assets
false
Strategic Planning
Real Estate & Construction
Multiple Chart
Morgan Stanley
Add to my slides
Remove from favorites
The slide includes bar charts showing different levers in logistics with corresponding activity levels and trends over time.
Operational Efficiency
Transportation & Logistics
Discusses the declining relevance of logistics topics, focusing on supply chain management and transportation cost optimization.
Logistics, Supply Chain, Transportation, Trends
false
Operational Efficiency
Transportation & Logistics
Single Chart
Roland Berger
Add to my slides
Remove from favorites
Previous
Next
You don't have any favorites yet.
Please wait loading your favorites slides...
Create a FREE account to continue browsing
Receive Instant Access to 1,000+ slides from companies like McKinsey, Google, and Goldman Sachs
First Name
Last Name
Email
Password
I agree to all
Terms & Privacy Policy
Thank you! Your submission has been received!
Oops! Something went wrong while submitting the form.
Have an account?
Sign in
Upgrade to PRO to Save slides
Advanced Search and Filters
Access to 15,000+ slides
Access to Category Pages
Save/Bookmark Slides
PowerPoint Template Library
Pick a Plan
MONTHLY
$12/month
Billed every month, Cancel anytime.
YEARLY
$9/year
Billed $108 annually, Cancel anytime.
Checkout for $12/month
Checkout for $108/yr
Secured by Stripe | AES-256 bit encryption