My Account
My Slides
Search by Category
Pricing
Templates
View All Templates
Download Template Slides
✦ AI Search
Feedback
Login
Logout
Get Started
Browse all Slides
Browse all Slides
Create a FREE Account
Instant access to 1,000+ real slides from top companies like McKinsey, BCG, Goldman Sachs, Google and many more!
First Name
Last Name
Email
Password
I agree to all
Terms & Privacy Policy
Thank you! Your submission has been received!
Oops! Something went wrong while submitting the form.
Have an account?
Sign in
Saved Slides
Total No. of slides saved
0
↻ Refresh
✖ Clear all
The slide displays a column chart comparing the personal luxury goods market by geography and consumer nationality between 2016 and 2017. It uses color distinctions in red and gray to represent different areas and consumer groups, highlighting shifts in market compositions and growth rates.
Market Analysis and Trends
Consumer Goods
Examines growth in the personal luxury goods market, detailing shifts by geographical and consumer nationality perspectives from 2016 to 2017. Emphasizes the accelerating purchases in regions and among different consumer bases, particularly noting the substantial growth among Chinese consumers.
luxury goods, market growth, geographical analysis, consumer trends
false
Market Analysis and Trends
Consumer Goods
Multiple Chart
Bain
Add to my slides
Remove from favorites
Contains a column chart showing the growth trajectory of the personal luxury goods market from 1996 to 2018 with significant historical events noted.
Market Analysis and Trends
Consumer Goods
Discusses the growth trends and economic impacts on the personal luxury goods market, providing a historical perspective. Useful for understanding market evolution and planning.
luxury goods, market growth, historical perspective, economic impact, market evolution
false
Market Analysis and Trends
Consumer Goods
Single Chart
Bain
Add to my slides
Remove from favorites
The slide includes a timeline from 1994 to 2017 with labeled phases such as "Sortie du Temple," "Crisis," "Chinese Bulimia," and "New Normal." It features a column chart and icons representing market growth, price effects, and volume effects, using red and gray to differentiate the periods and impacts.
Market Analysis and Trends
Consumer Goods
Focuses on the luxury leather goods market, detailing volume and price effects over different periods. Highlights how market dynamics like consumer base expansion and pricing policies have driven changes in the market structure, especially post-crisis and during the "Chinese Bulimia" period.
luxury goods, market trends, crisis, volume growth, price effects
false
Market Analysis and Trends
Consumer Goods
Single Chart
Bain
Add to my slides
Remove from favorites
Time-series graph showing the growth trajectory of the personal luxury goods market from 1996 to 2020 with annotations for significant events.
Market Analysis and Trends
Consumer Goods
Tracks the growth trends in the luxury goods market, highlighting disruptions and recoveries over 24 years.
luxury goods, market trends, economic impact, Covid-19, market recovery
false
Market Analysis and Trends
Consumer Goods
Single Chart
Bain
Add to my slides
Remove from favorites
The slide features a column chart tracking luxury goods market from 1996 to 2018.
Market Analysis and Trends
Consumer Goods
It shows the growth trends in the personal luxury goods market, identifying periods of increase and stabilization, termed "new normal."
luxury goods, market trends, growth, 1996-2018
false
Market Analysis and Trends
Consumer Goods
Single Chart
Bain
Add to my slides
Remove from favorites
Features a pie chart and a graph illustrating the growth rates of different luxury market categories, emphasizing personal luxury goods.
Market Analysis and Trends
Consumer Goods
Highlights the superior performance of personal luxury goods compared to other segments in 2018. Useful for market trend analysis and strategic planning in the luxury sector.
luxury goods, market trends, growth rates, strategic planning, superior performance
false
Market Analysis and Trends
Consumer Goods
Mixed Chart
Bain
Add to my slides
Remove from favorites
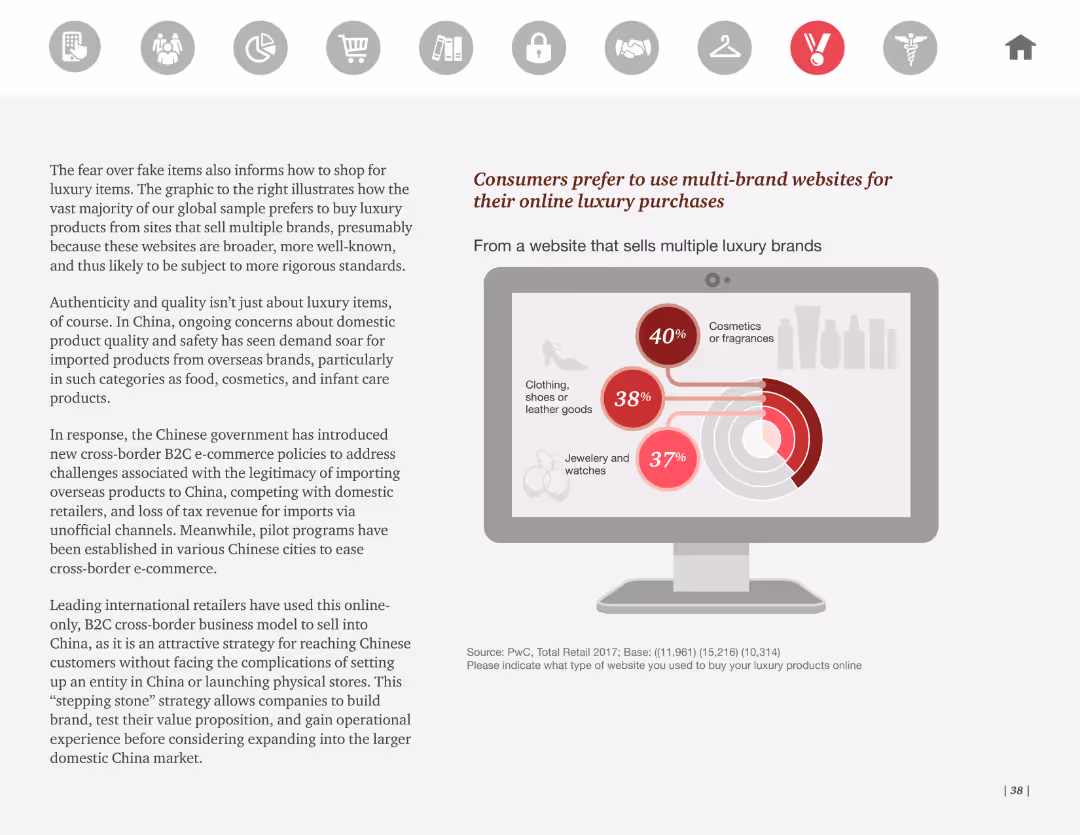
This slide includes a pie chart illustrating consumer preferences for buying luxury items from multi-brand websites. It features a prominent graphic of a laptop screen showing the product categories.
Market Analysis and Trends
Retail & E-commerce
The slide reveals that consumers prefer multi-brand websites for luxury purchases due to broader product ranges and perceived reliability. It discusses the Chinese market's growing demand for imported luxury goods and related B2C e-commerce policies.
Luxury goods, multi-brand websites, online shopping, consumer preferences, e-commerce
false
Market Analysis and Trends
Retail & E-commerce
Mixed Chart
PwC/Strategy&
Add to my slides
Remove from favorites
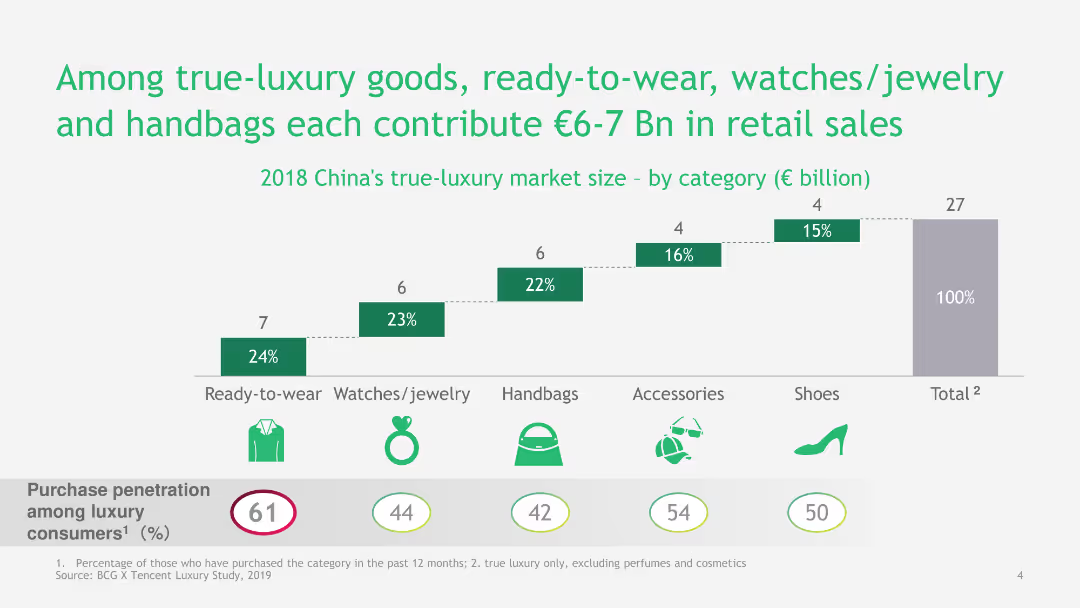
This slide includes a bar chart and infographics to detail the contribution of different luxury goods to retail sales in China. It uses icons and a clear, structured layout.
Market Analysis and Trends
Consumer Goods
The slide breaks down the contribution of various luxury goods categories to China's retail market, highlighting the market size and penetration rates for each category.
Luxury Goods, Ready-to-Wear, Watches, Jewelry, Handbags, Retail Sales, China, Market Size, Penetration Rates
false
Market Analysis and Trends
Consumer Goods
Single Chart
BCG
Add to my slides
Remove from favorites
The slide includes a radar chart and textual insights from C-Level executives, detailing strategies for overcoming the COVID-19 crisis in the luxury goods market.
Strategic Planning
Retail & E-commerce
Outlines the major drivers and strategies for recovery in the personal luxury goods market, emphasizing supply chain control, AI, and digital marketing post-COVID.
luxury goods, recovery, strategies, COVID-19, supply chain, AI, digital marketing, planning, executives
false
Strategic Planning
Retail & E-commerce
Graphic
Deloitte
Add to my slides
Remove from favorites
The slide provides a geographical breakdown of growth rates in personal luxury goods for 2017, with specific details for regions such as China, Asia, Europe, and the Americas. It uses a mix of bar and column charts, color-coded in red and gray, to differentiate between the regions and their respective growth figures.
Market Analysis and Trends
Consumer Goods
Analyzes 2017 growth rates in the personal luxury goods market across different regions, highlighting China as the top performer with significant details on local consumer behavior and market changes. Also compares other regions to provide a comprehensive view of global trends.
luxury goods, regional analysis, growth rate, China, market analysis
false
Market Analysis and Trends
Consumer Goods
Single Chart
Bain
Add to my slides
Remove from favorites
The slide features a column chart comparing wholesale, retail, and perimeter channels over 2017 and 2018, with associated percentage growth.
Market Analysis and Trends
Retail & E-commerce
Discusses the growth rates of personal luxury goods through various sales channels, highlighting the impact of different retail strategies.
luxury goods, retail growth, wholesale, perimeter sales, channel analysis
false
Market Analysis and Trends
Retail & E-commerce
Multiple Chart
Bain
Add to my slides
Remove from favorites
This slide contrasts the personal luxury goods market distribution by channel between 2017 and 2025 projections. It uses a stacked column chart to illustrate changes in market channels such as online, department stores, and monobrand stores, with red and gray colors to denote changes over time.
Market Analysis and Trends
Consumer Goods
Evaluates the shifting dynamics in the retail channels for luxury goods, forecasting significant growth in online sales and a reevaluation of physical store strategies. Provides insight into the changing role of different retail formats in the luxury market towards 2025.
luxury goods, retail trends, channel analysis, market strategy, future projections
false
Market Analysis and Trends
Consumer Goods
Multiple Chart
Bain
Add to my slides
Remove from favorites
Text with map highlighting key luxury growth markets like Middle East, China, India, and Southeast Asia.
Market Analysis and Trends
Consumer Goods
Discusses the critical role of growth markets in the development of the luxury sector, highlighting key regions.
Luxury, Growth, Markets, Regions, Development
false
Market Analysis and Trends
Consumer Goods
Graphic
Kearney
Add to my slides
Remove from favorites
Horizontal bar chart with icons for luxury categories and a color-coded sidebar showing YoY and historical comparisons. Strong visual hierarchy with red highlights and segmented market breakdown.
Market Analysis and Trends
Consumer Goods
This slide summarizes the projected €1.48T global luxury market in 2024, highlighting slower growth (-3% to -1%) and year-over-year changes across segments such as luxury cars, hospitality, fine dining, and private jets. It also contrasts performance from 2019 to 2024 and emphasizes bright spots in experiential luxury categories.
luxury market, 2024 forecast, segment analysis, YoY growth, experiential goods, slowdown
false
Market Analysis and Trends
Consumer Goods
Single Chart
Bain
Add to my slides
Remove from favorites
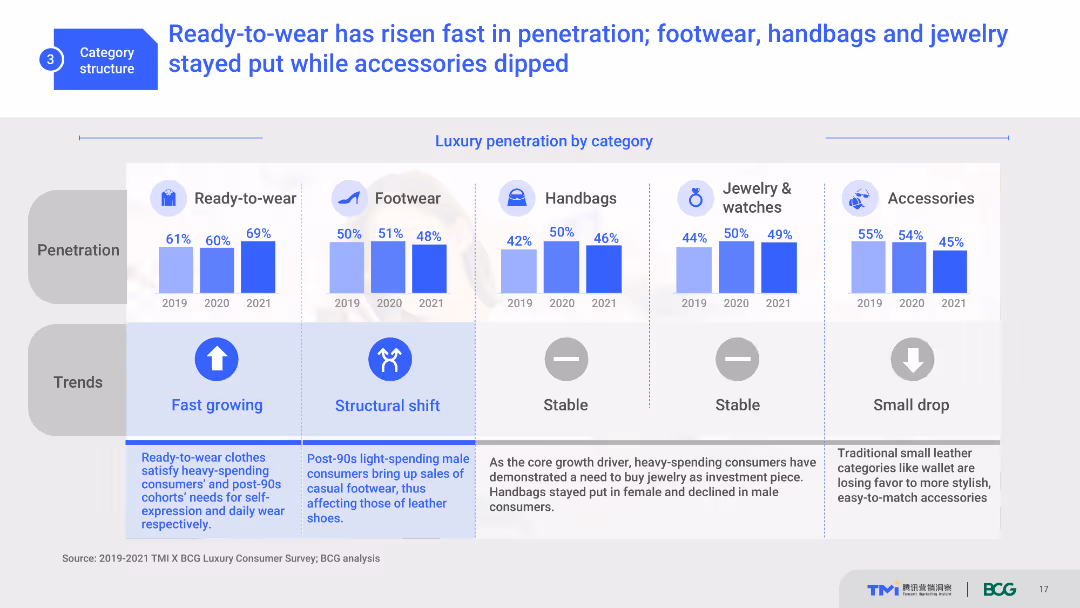
The slide features multiple column charts showing luxury penetration by category from 2019 to 2021. It includes icons for each category and trend indicators. The visual complexity is moderate, with well-organized data and clear labels.
Market Analysis and Trends
Consumer Goods
This slide presents the growth trends of various luxury categories such as ready-to-wear, footwear, handbags, and accessories. It shows the percentage penetration over three years, indicating market shifts and consumer preferences.
luxury market, category penetration, trends, consumer preferences, growth
false
Market Analysis and Trends
Consumer Goods
Multiple Chart
BCG
Add to my slides
Remove from favorites
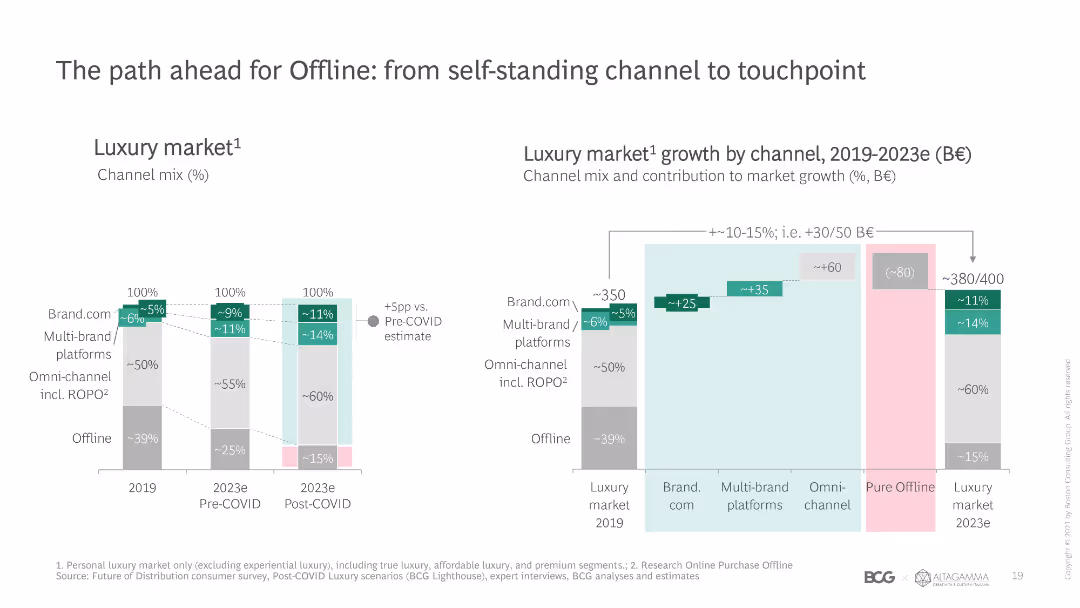
Stacked column charts showing the channel mix and growth in the luxury market from 2019 to post-COVID 2023, with a focus on offline and omnichannel strategies.
Strategic Planning
Retail & E-commerce
Discusses the shift in the luxury market from offline to omnichannel strategies, showing pre and post-COVID projections for channel growth and contributions.
luxury market, channel mix, growth, offline, omnichannel
false
Strategic Planning
Retail & E-commerce
Multiple Chart
BCG
Add to my slides
Remove from favorites
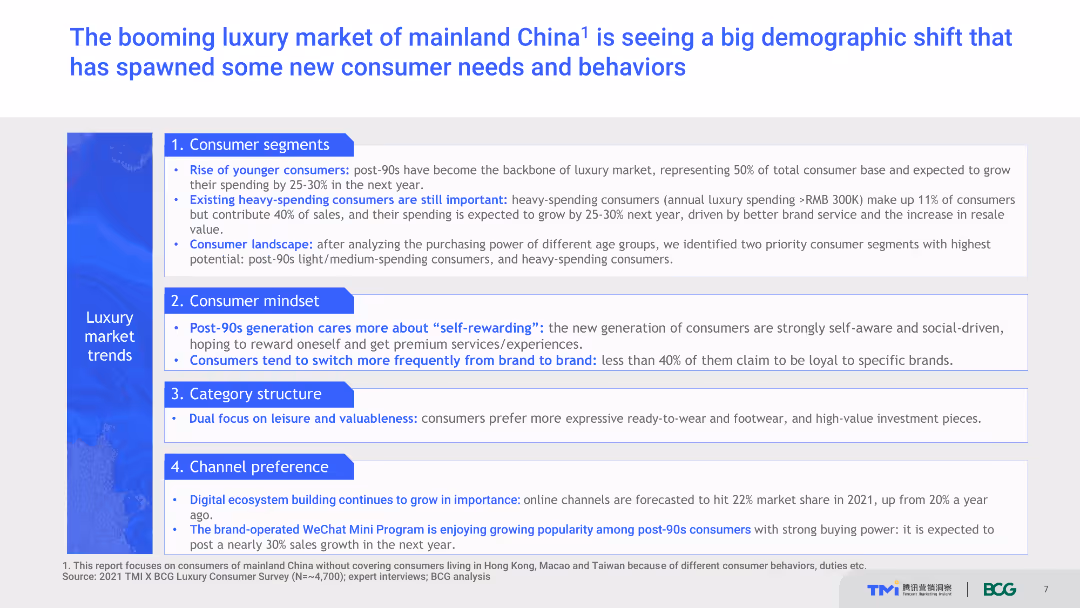
The slide lists consumer segments, mindset, category structure, and channel preference trends in the luxury market of mainland China.
Market Analysis and Trends
Retail & E-commerce
This slide discusses the demographic shifts and emerging trends in the luxury market of mainland China, highlighting new consumer needs and behaviors, particularly among post-90s generation and heavy-spending consumers.
Luxury market, China, consumer trends, demographic shift, spending behavior
false
Market Analysis and Trends
Retail & E-commerce
Header Vertical
BCG
Add to my slides
Remove from favorites
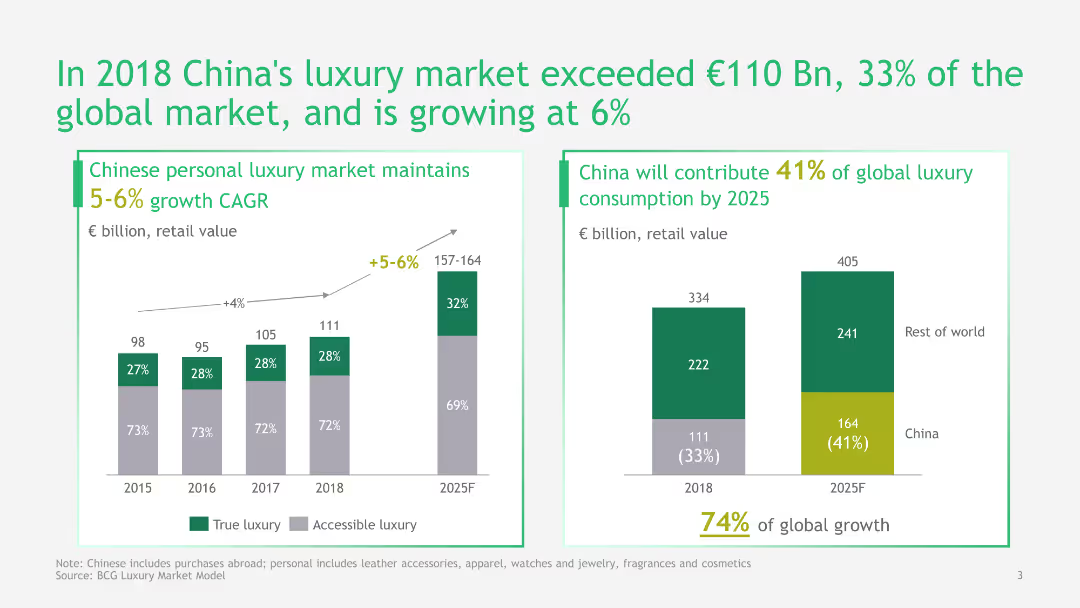
This slide features a column chart and a pie chart to illustrate China's growth in the luxury market. It uses green and gray colors and includes detailed data points and projections.
Market Analysis and Trends
Consumer Goods
The slide provides an analysis of China's luxury market growth, its contribution to the global market, and future projections, highlighting significant market trends and growth rates.
Luxury Market, China, Growth, Global Market, Projections, Data, Analysis, Trends, Retail
false
Market Analysis and Trends
Consumer Goods
Multiple Chart
BCG
Add to my slides
Remove from favorites
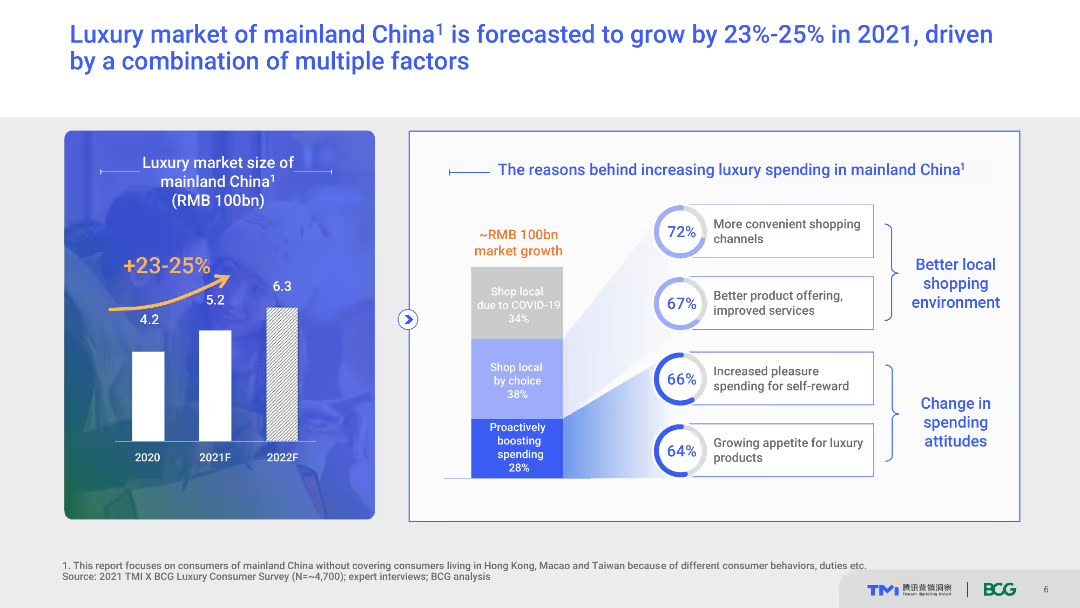
The slide features a column chart showing the luxury market size of mainland China from 2020 to 2022. It also includes a text box with reasons for increased luxury spending.
Market Analysis and Trends
Retail & E-commerce
The slide forecasts a 23%-25% growth in the luxury market of mainland China for 2021, driven by various factors such as more convenient shopping channels, better product offering, and changing spending attitudes.
Luxury market, China, market growth, spending factors, 2021 forecast
false
Market Analysis and Trends
Retail & E-commerce
Multiple Chart
BCG
Add to my slides
Remove from favorites
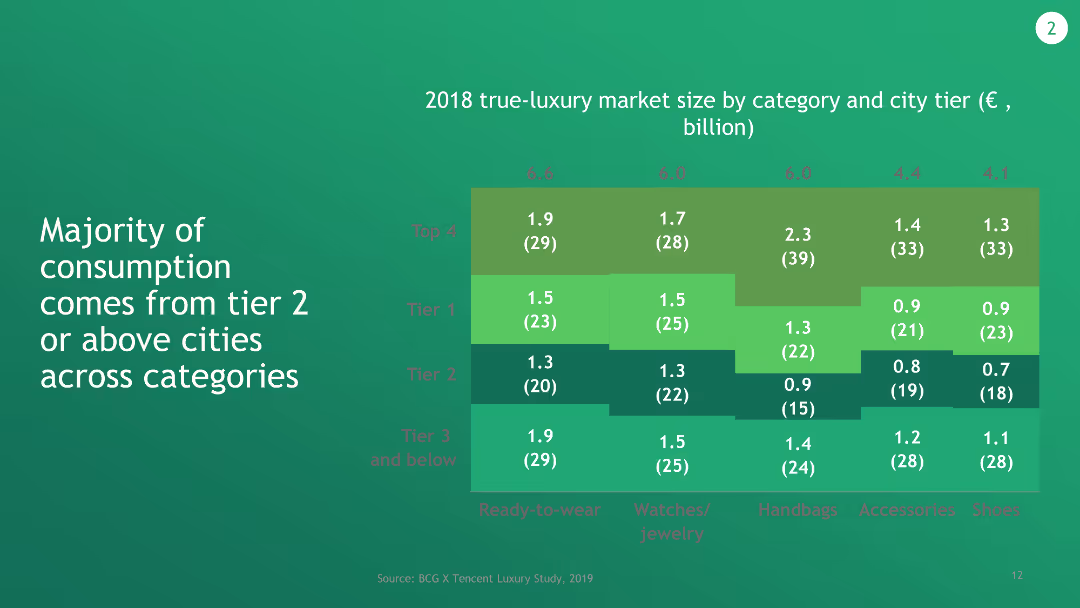
The slide includes a column chart that shows the 2018 true-luxury market size by category and city tier in billion euros. The chart uses various shades of green to represent data points.
Market Analysis and Trends
Consumer Goods
This slide details the market size of true-luxury categories across different city tiers in 2018. It highlights the predominance of tier 2 or above cities in luxury consumption.
luxury market, city tier, market size, consumption, true-luxury
false
Market Analysis and Trends
Consumer Goods
Mixed Chart
BCG
Add to my slides
Remove from favorites
Features stacked column charts showing the luxury goods market by consumer nationality from 2019 to 2025F.
Market Analysis and Trends
Retail & E-commerce
This slide illustrates changes in the global luxury goods market by consumer nationality, emphasizing a significant shift towards Chinese consumers by 2025.
luxury, market, consumer, nationality, 2025
false
Market Analysis and Trends
Retail & E-commerce
Multiple Chart
Bain
Add to my slides
Remove from favorites
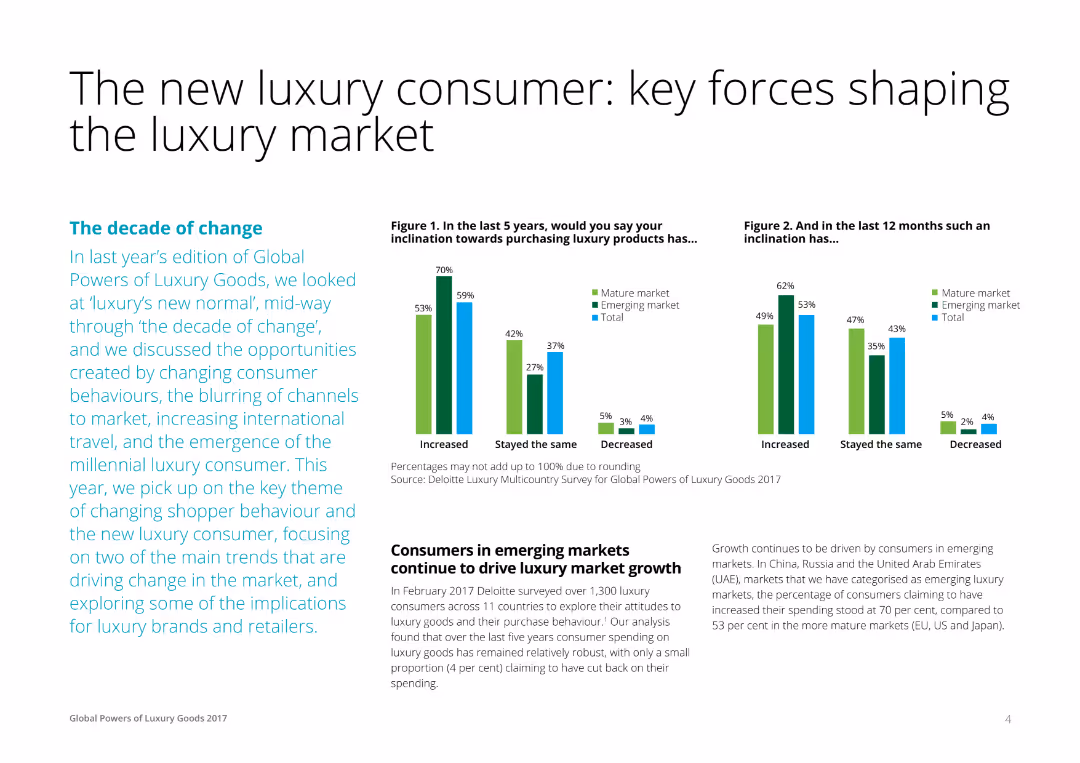
A detailed slide with text on the left and a column chart on the right showing consumer inclination towards luxury products over the past 5 and 12 months. Color-coded bars represent data for mature and emerging markets, and total figures.
Market Analysis and Trends
Consumer Goods
This slide analyzes the key forces shaping the luxury market, focusing on changes in consumer behavior, the rise of the millennial luxury consumer, and market trends over the last year. It includes survey data on consumer inclinations towards luxury goods.
Luxury, Market, Consumer, Trends, Analysis
false
Market Analysis and Trends
Consumer Goods
Multiple Chart
Deloitte
Add to my slides
Remove from favorites
Provides detailed statistics and icons for specific luxury market trends, highlighting the impact of collaborations and environmental considerations among consumers.
Market Analysis and Trends
Retail & E-commerce
Delivers an in-depth analysis of prevailing trends in the luxury market, with a focus on the growing importance of sustainability and collaborative business models.
luxury market, detailed trends, collaborations, sustainability, consumer behavior, statistical analysis
false
Market Analysis and Trends
Retail & E-commerce
Table
BCG
Add to my slides
Remove from favorites
Slide includes text and icons to represent different market segments.
Market Analysis and Trends
Consumer Goods
Identifies new phases in luxury market growth, such as digital influences and changes in consumer behavior towards ownership and sustainability.
luxury market, digital, consumer trends, sustainability
false
Market Analysis and Trends
Consumer Goods
Pillar
Bain
Add to my slides
Remove from favorites
This slide is organized with two major sections: one highlighting a line graph on global luxury market trends, and another detailing new purchasing channels and consumer behavior. The visual elements are balanced between text, icons, and the graph to maintain viewer engagement.
Market Analysis and Trends
Consumer Goods
Covers the adaptation of the luxury market to changing consumer preferences during COVID-19, such as the increase in online sales and new digital engagement methods. It also highlights the expected recovery in the market with strategic insights into new revenue models and purchase behaviors post-pandemic.
luxury market, digital transformation, COVID-19, consumer behavior, online sales, market recovery, innovative strategies
false
Market Analysis and Trends
Consumer Goods
Mixed Chart
BCG
Add to my slides
Remove from favorites
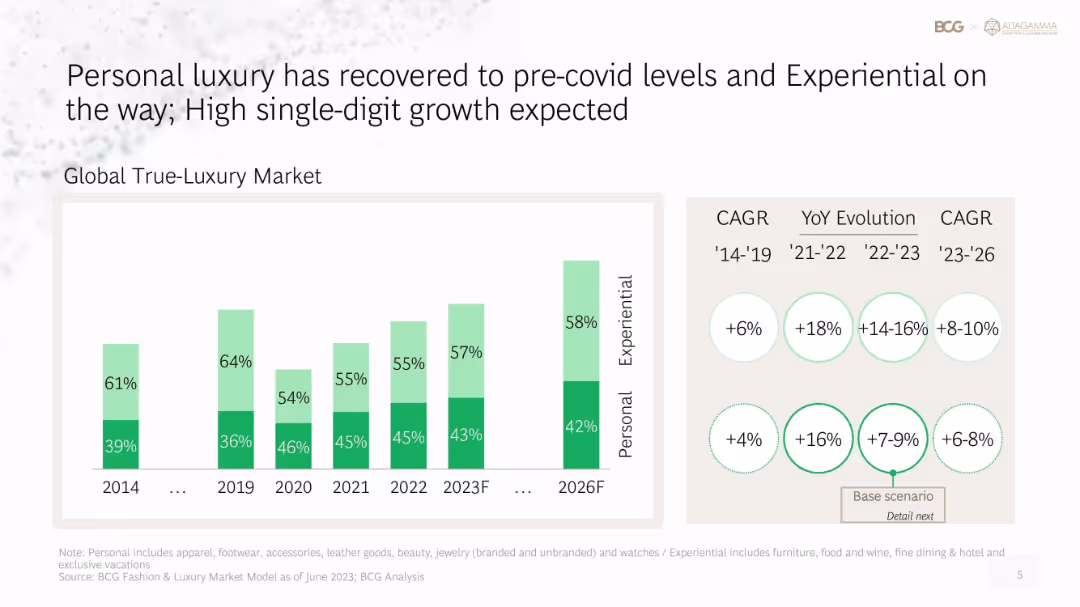
Bar graph of global true-luxury market split (personal vs. experiential), CAGR evolution shown in bubbles
Market Analysis and Trends
Consumer Goods
This slide showcases the rebound of the personal luxury market and the rise of experiential luxury. Growth metrics from 2014 to 2026 are visualized through a bar graph and CAGR bubbles, highlighting recovery from Covid and expected strong performance ahead.
luxury market, experiential, personal goods, CAGR, recovery, growth forecast, BCG, consumer behavior
false
Market Analysis and Trends
Consumer Goods
Single Chart
BCG
Add to my slides
Remove from favorites
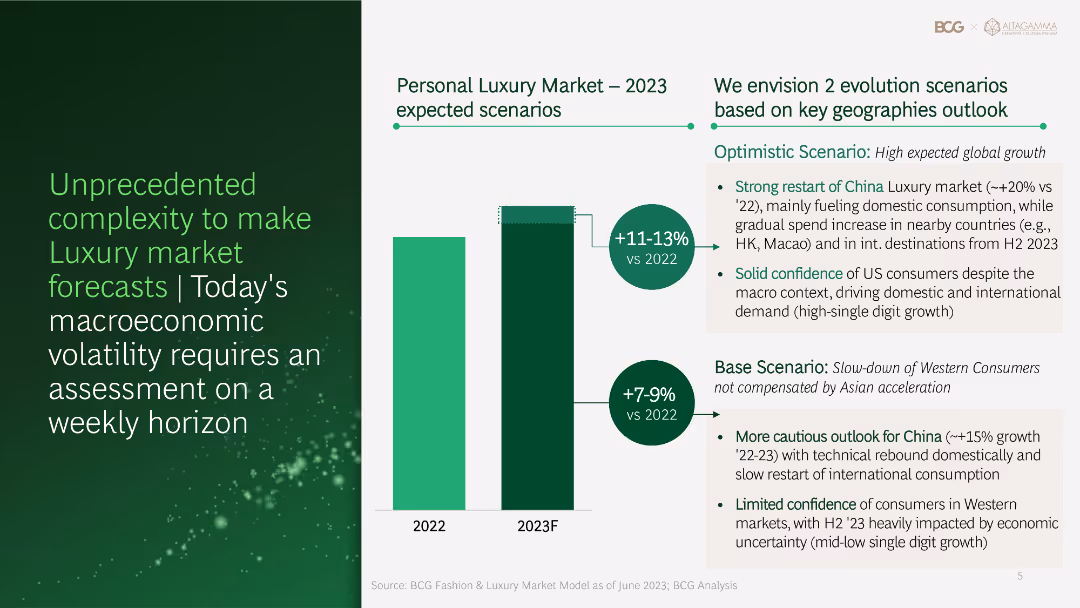
Dual-column layout with bar chart and bullet-point comparison of two growth scenarios
Strategic Planning
Consumer Goods
The slide presents two 2023 outlook scenarios for the personal luxury market: optimistic and base case. Each is supported by forecasts and macroeconomic drivers such as China's consumption rebound and Western consumer sentiment. A bar graph compares expected growth.
luxury market, forecast, China, consumer behavior, economic outlook, growth scenario, macroeconomic trends
false
Strategic Planning
Consumer Goods
Mixed Chart
BCG
Add to my slides
Remove from favorites
The slide presents a line chart with projections from 2019 to 2023F, marked with data points and growth percentages.
Market Analysis and Trends
Retail & E-commerce
This slide provides a forecast for the personal luxury goods market, showing projected recovery trends from 2019 through 2023 with an emphasis on COVID-19 impacts.
luxury, market, forecast, COVID-19, growth
false
Market Analysis and Trends
Retail & E-commerce
Mixed Chart
Bain
Add to my slides
Remove from favorites
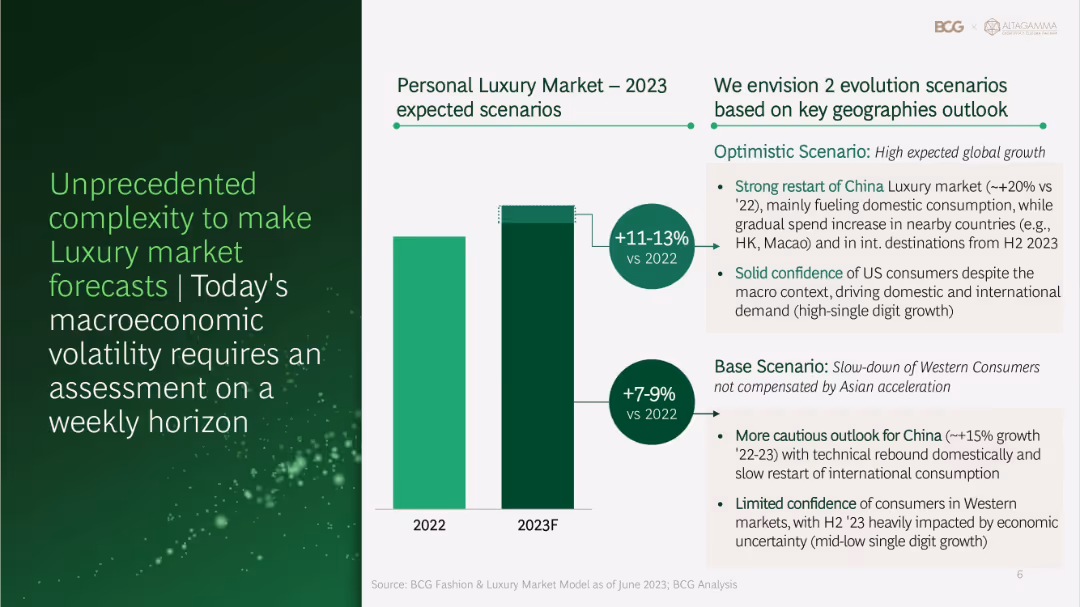
Column chart and text showing different growth scenarios for the personal luxury market in 2023, highlighting optimistic and base scenarios based on geographical outlooks.
Risk Assessment and Management
Financial Services
Discusses the complexities in forecasting the luxury market, presenting optimistic and base scenarios for 2023 growth based on geographical trends and macroeconomic factors.
luxury market, forecast, growth scenarios, geographical outlooks, macroeconomic
false
Risk Assessment and Management
Financial Services
Mixed Chart
BCG
Add to my slides
Remove from favorites
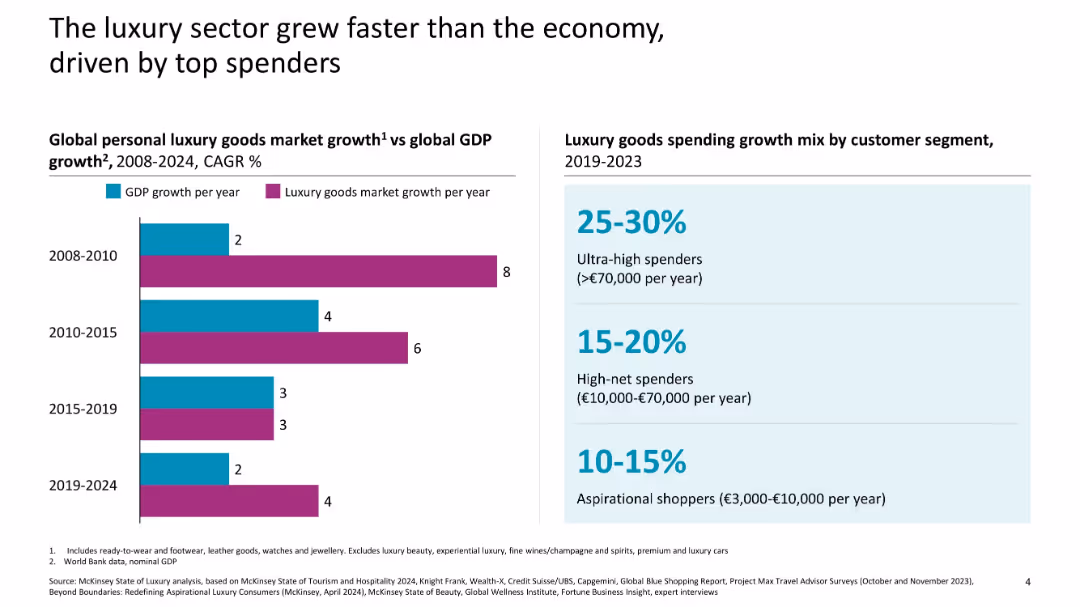
Split layout: left side bar chart compares GDP and luxury goods market growth; right side highlights luxury spending growth by consumer segment
Market Analysis and Trends
Consumer Goods
This slide illustrates how the luxury goods sector has consistently outpaced global GDP growth across various periods and highlights the key drivers of growth—primarily ultra-high and high-net-worth individuals.
luxury market, GDP, consumer segments, growth rate, spending, high-net-worth, CAGR, economy comparison
false
Market Analysis and Trends
Consumer Goods
Mixed Chart
McKinsey
Add to my slides
Remove from favorites
Text-heavy slide with two data visualizations: a bar chart comparing luxury goods vs GDP growth by period and a table-style breakdown of spending by customer segment (top spenders to aspirational shoppers).
Market Analysis and Trends
Consumer Goods
The slide shows that from 2019 to 2023, luxury sector growth outpaced GDP growth, driven largely by top spenders. Ultra-high and high spenders accounted for a disproportionate share of growth, despite forming a small segment of the total consumer base.
luxury market, GDP growth, top spenders, ultra-high income, McKinsey, aspirational shoppers
false
Market Analysis and Trends
Consumer Goods
Mixed Chart
McKinsey
Add to my slides
Remove from favorites
Includes multiple column charts depicting the distribution of the personal luxury goods market by geography and consumer nationality, highlighting growth trends.
Market Analysis and Trends
Consumer Goods
Analyzes geographical and demographic shifts in the personal luxury goods market, emphasizing the growing influence of Chinese consumers. Crucial for global market strategy development.
luxury market, geographical trends, Chinese consumers, market strategy, demographic shifts
false
Market Analysis and Trends
Consumer Goods
Multiple Chart
Bain
Add to my slides
Remove from favorites
Contains a column chart showing historical data and future projections from 2019 to 2025F for the personal luxury goods market.
Market Analysis and Trends
Retail & E-commerce
Analysis of the personal luxury goods market from 2019 to 2025, focusing on the market's recovery and growth potential post-pandemic.
luxury, market, growth, 2025, projections
false
Market Analysis and Trends
Retail & E-commerce
Multiple Chart
Bain
Add to my slides
Remove from favorites
Slide contains multiple column charts showing the market sizes of various luxury sectors with growth percentages.
Market Analysis and Trends
Consumer Goods
Provides a comprehensive overview of the global luxury market in 2018, detailing sector-specific growth and trends. Ideal for market trend analysis and investment planning.
luxury market, growth, market trends, sector analysis, investment planning
false
Market Analysis and Trends
Consumer Goods
Single Chart
Bain
Add to my slides
Remove from favorites
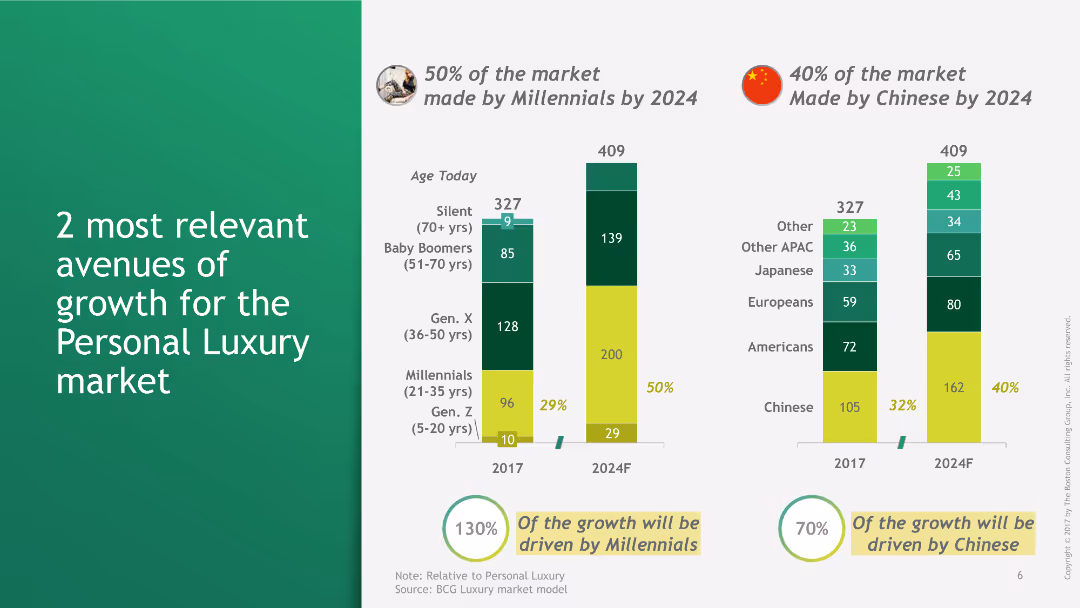
Bar charts illustrating growth projections for the personal luxury market driven by millennials and Chinese consumers by 2024.
Market Analysis and Trends
Consumer Goods
This slide highlights the two main drivers of growth in the personal luxury market: millennials and Chinese consumers, with growth projections for 2024.
luxury, market growth, millennials, Chinese consumers, projections, 2024, bar charts, personal luxury, market analysis, consumer trends
false
Market Analysis and Trends
Consumer Goods
Multiple Chart
BCG
Add to my slides
Remove from favorites
A combination of column and pie charts showing the growth in the true luxury market split between personal and experiential luxury, including projected future growth.
Market Analysis and Trends
Consumer Goods
Provides insights into the growth trends within the luxury market, distinguishing between personal and experiential segments. Useful for market trend analysis and forecasting in the luxury sector.
luxury, market, growth, trends, forecasting
false
Market Analysis and Trends
Consumer Goods
Single Chart
BCG
Add to my slides
Remove from favorites
Slide includes images detailing luxury market growth, generational spending, and geographic distribution, focusing on key areas like China and millennials.
Market Analysis and Trends
Retail & E-commerce
Analyzes growth trends in the luxury market, highlighting significant consumer behaviors and market segmentation by nationality and generation.
luxury market, growth trends, generational spending, market segmentation, pie charts, China, millennials
false
Market Analysis and Trends
Retail & E-commerce
Pillar
BCG
Add to my slides
Remove from favorites
A stacked column chart compare the market share of different generations in the true luxury goods market from 2019 to projections for 2026.
Market Analysis and Trends
Consumer Goods
Analyzes the impact of Millennials and Gen Z on the luxury goods market, highlighting their growing market share and influence. Useful for understanding demographic shifts in consumer behavior within the luxury sector.
luxury, market, Millennials, Gen Z, trends
false
Market Analysis and Trends
Consumer Goods
Multiple Chart
BCG
Add to my slides
Remove from favorites
Column chart illustrating the growth phases of the luxury market from 2001 to 2018, with marked key phases and CAGR.
Market Analysis and Trends
Retail & E-commerce
Shows the development phases of the luxury market, highlighting key periods such as crisis, Chinese growth, and the digital era.
Luxury market, phases, growth, timeline, CAGR
false
Market Analysis and Trends
Retail & E-commerce
Single Chart
Deutsche Bank
Add to my slides
Remove from favorites
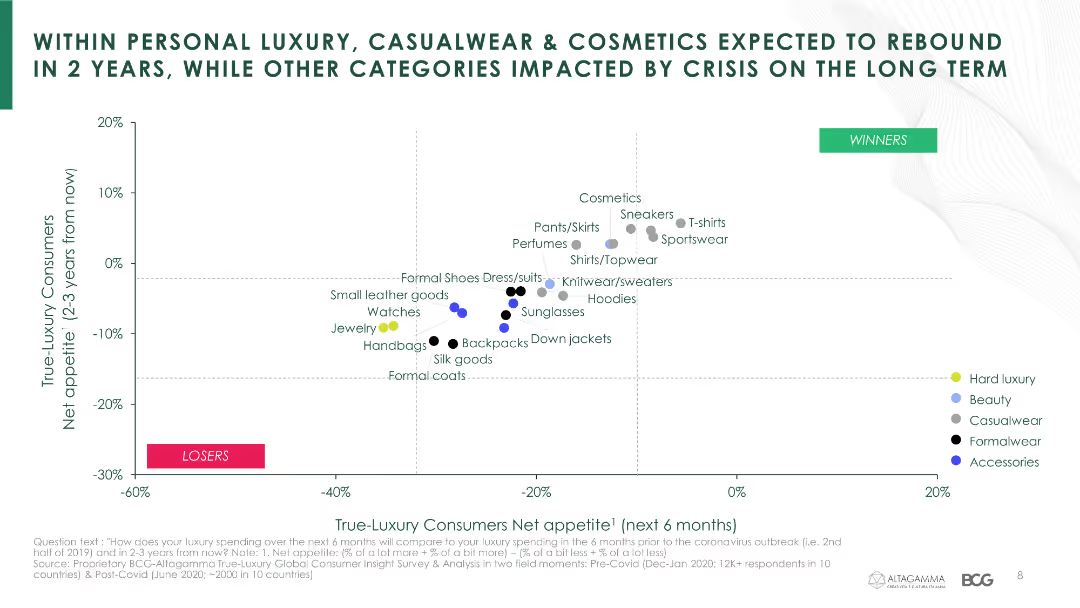
This slide shows a scatter plot analyzing net appetite of true-luxury consumers for various product categories over the next 6 months and 2-3 years.
Market Analysis and Trends
Consumer Goods
It provides a detailed analysis of luxury consumer preferences for different product categories, indicating which are expected to rebound faster.
luxury market, product categories, net appetite, consumer preferences, COVID-19, rebound
false
Market Analysis and Trends
Consumer Goods
Single Chart
BCG
Add to my slides
Remove from favorites
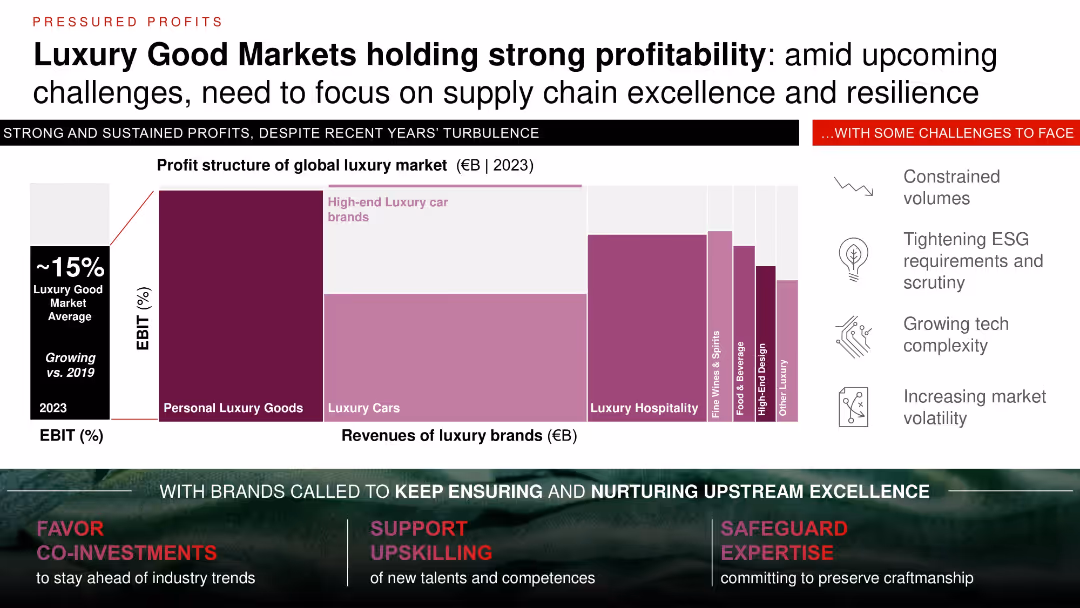
Waterfall bar chart and stacked segment comparison with icons outlining challenges; white background with dark red/maroon accent colors.
Industry Overview
Consumer Goods
Despite economic turbulence, luxury goods maintain ~15% EBIT, driven by high-end segments like cars and personal goods. Challenges include ESG regulations, tech complexity, and volatility. Emphasizes continued investment in supply chain resilience and upstream excellence to sustain performance.
luxury market, profitability, supply chain, ESG, resilience, EBIT, upstream, challenges
false
Industry Overview
Consumer Goods
Mixed Chart
Bain
Add to my slides
Remove from favorites
Column chart projecting the global luxury goods market from 2018 to 2028 with different luxury goods categories.
Market Analysis and Trends
Consumer Goods
Provides an outlook for the luxury goods market, showing projected growth rates and market trends.
Luxury, Market, Projection, Growth, Categories
false
Market Analysis and Trends
Consumer Goods
Single Chart
Kearney
Add to my slides
Remove from favorites
This slide showcases a series of column charts depicting the 2020 performance of global luxury markets such as personal luxury goods, cars, and hospitality. The layout includes a detailed year-over-year growth comparison.
Market Analysis and Trends
Consumer Goods
An in-depth review of the global luxury markets in 2020, highlighting significant contractions across various sectors such as personal goods, hospitality, and automotive due to the pandemic. It quantifies the impact in each category, offering a stark visualization of the downturn compared to 2019.
luxury markets, 2020 review, market contraction, pandemic impact, sector analysis
false
Market Analysis and Trends
Consumer Goods
Single Chart
Bain
Add to my slides
Remove from favorites
Graphs and charts showing shift from offline to online luxury purchasing over years
Market Analysis and Trends
Retail & E-commerce
Illustrates how luxury purchases have transitioned from physical stores to online platforms
Luxury, Market Shift, Online Purchase, Timeline
false
Market Analysis and Trends
Retail & E-commerce
Mixed Chart
BCG
Add to my slides
Remove from favorites
Text and bar chart showing market share of top luxury goods markets in 2023.
Market Analysis and Trends
Consumer Goods
Analyzes the market share and growth projections of top markets for luxury goods, focusing on USA and China.
Luxury, Markets, Share, Projections, Growth
false
Market Analysis and Trends
Consumer Goods
Mixed Chart
Kearney
Add to my slides
Remove from favorites
The slide features a large red column chart showing growth rates of maximalist and minimalist brands in the luxury market from 1996-2019, juxtaposed against key historical periods and trends.
Market Analysis and Trends
Consumer Goods
This slide examines trends in the luxury market, focusing on the growth of maximalist versus minimalist brands, suggesting a shift towards more self-expressive consumption patterns.
luxury, market trends, brand growth, consumer behavior, maximalism, minimalism, self-expression
false
Market Analysis and Trends
Consumer Goods
Mixed Chart
Bain
Add to my slides
Remove from favorites
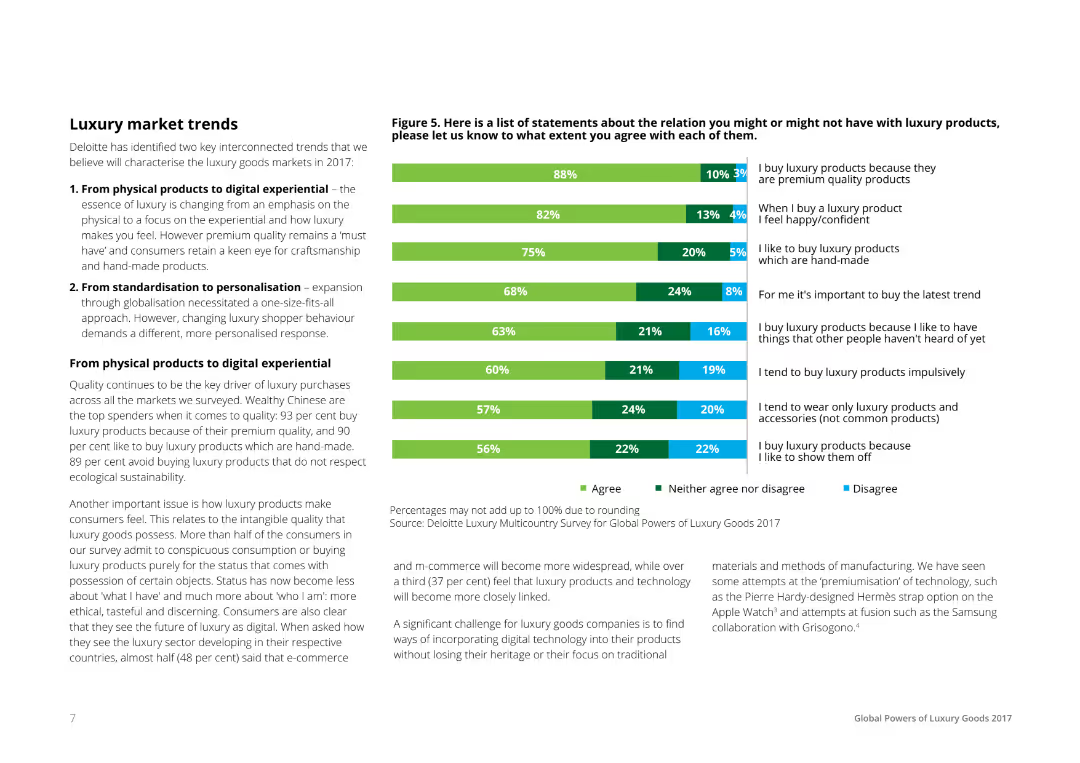
A mix of text and a horizontal bar chart, listing statements about luxury products and consumer agreements. Bars are segmented to show percentages of agreement, neutrality, and disagreement, color-coded in green, gray, and blue respectively.
Market Analysis and Trends
Consumer Goods
The slide discusses luxury market trends identified by Deloitte, focusing on the shift from physical products to digital experiences and from standardization to personalization. It includes consumer survey data on various luxury product statements.
Luxury, Market, Trends, Consumer, Survey
false
Market Analysis and Trends
Consumer Goods
Mixed Chart
Deloitte
Add to my slides
Remove from favorites
Image of a woman using a smartphone, icons and bullet points listing key trends
Market Analysis and Trends
Retail & E-commerce
Discusses six emerging trends in the luxury market influenced by digital technology
Luxury, Market Trends, Digital Influence, Consumer Behavior
false
Market Analysis and Trends
Retail & E-commerce
Vertical Flow
BCG
Add to my slides
Remove from favorites
This slide includes multiple line graphs comparing the growth of luxury market segments from 2010 to 2017. The graphs are color-coded to differentiate between experiences, experiencing goods, and personal goods, enhancing clarity and readability. The layout prioritizes visual data presentation, supported by minimal text summarizing key trends and growth rates.
Market Analysis and Trends
Consumer Goods
Compares the growth trajectories of different luxury market segments post-crisis, highlighting the increasing preference for experiences over goods. Useful for insights into consumer behavior changes and market shifts in the luxury sector.
luxury market trends, post-crisis growth, consumer preferences, experiences vs goods, strategic insights
false
Market Analysis and Trends
Consumer Goods
Single Chart
Bain
Add to my slides
Remove from favorites
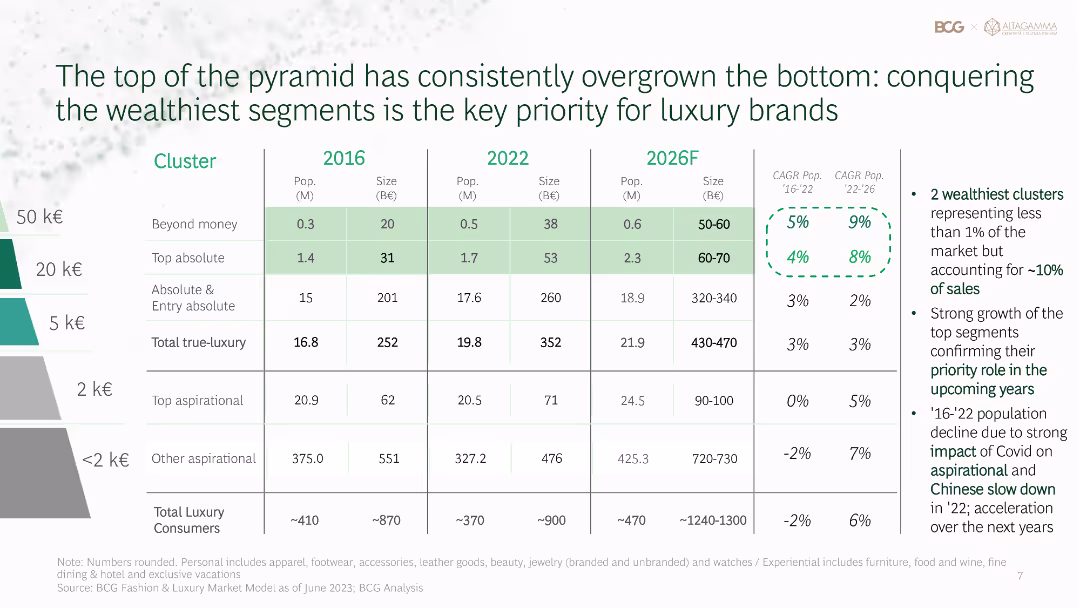
Table showing the segmentation of the luxury market by wealth clusters, with data on population, market size, and growth rates for different years and projections.
Market Analysis and Trends
Financial Services
Analyzes the segmentation of the luxury market, showing the growth of the wealthiest segments and the projected market size and population for 2026.
luxury market, wealth segments, market size, population, growth rates
false
Market Analysis and Trends
Financial Services
Table
BCG
Add to my slides
Remove from favorites
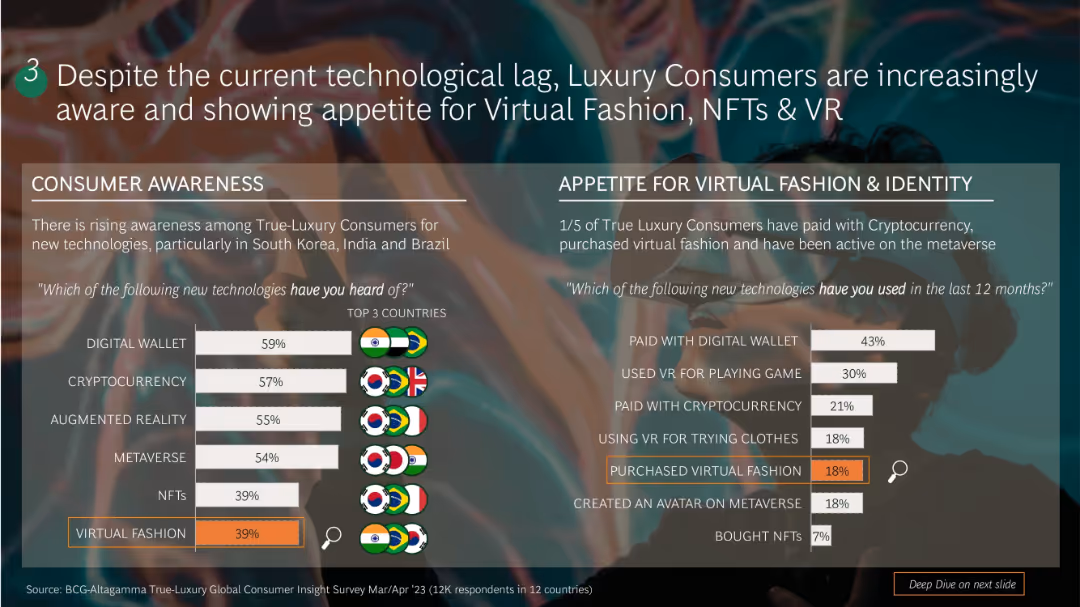
Dual-section layout: left side shows awareness stats with bar charts; right side displays usage stats for virtual fashion and identity with similar bar charts. Background includes a blurred virtual fashion image.
Customer and Market Segmentation
Consumer Goods
Shows growing awareness and usage of digital wallets, crypto, NFTs, AR/VR among luxury consumers, especially in South Korea, India, and Brazil. 1/5 have purchased virtual fashion or used crypto. Usage breakdown includes virtual payments, avatar creation, and VR try-ons.
luxury, NFTs, virtual fashion, consumer tech, awareness, usage trends, VR, crypto
false
Customer and Market Segmentation
Consumer Goods
Single Chart
BCG
Add to my slides
Remove from favorites
Line chart showing quarterly performance of top luxury players in 2023 vs. 2022.
Competitive Landscape
Consumer Goods
Highlights the performance trends of leading luxury brands and the observed industry-wide slowdown.
Luxury, Performance, Trends, Brands, Industry
false
Competitive Landscape
Consumer Goods
Mixed Chart
Kearney
Add to my slides
Remove from favorites
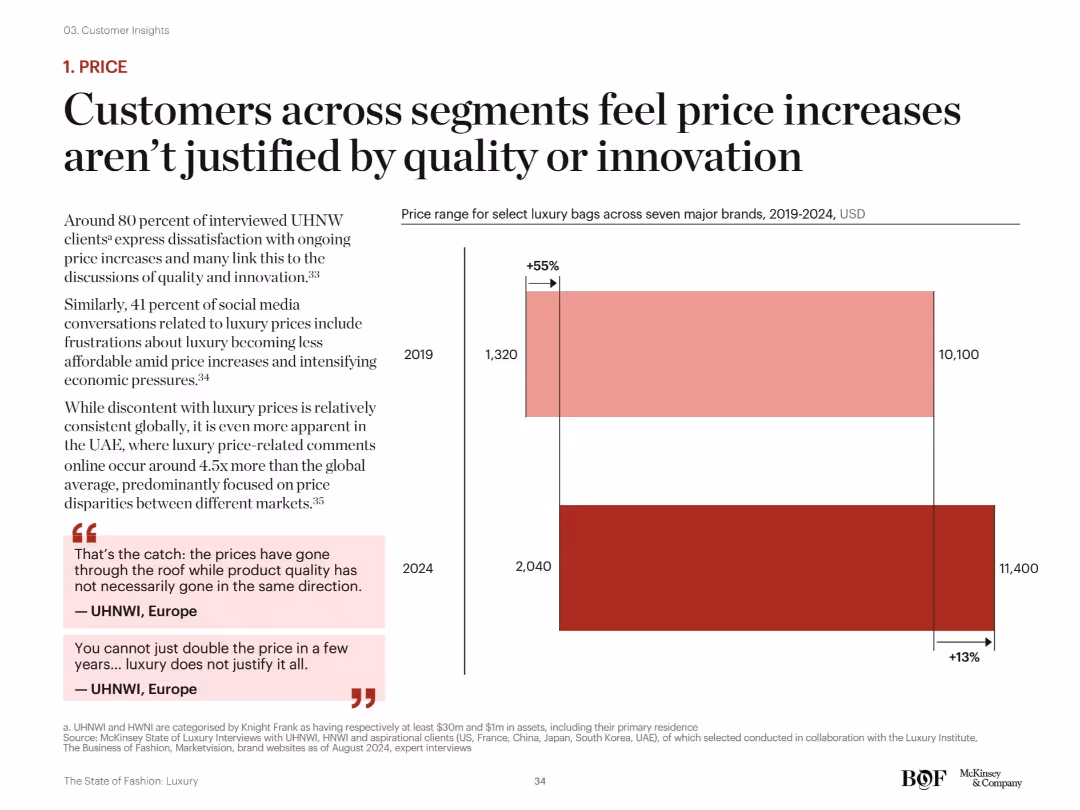
Left: explanatory text and quotes; Right: bar chart comparing luxury bag prices from 2019 to 2024. Dark red visual palette used to illustrate price increase. Structured in a two-part layout (text and graph).
Customer and Market Segmentation
Consumer Goods
The slide illustrates a 13% price increase for luxury bags from 2019 to 2024 and shows widespread consumer dissatisfaction, especially from UHNW individuals, due to a perceived disconnect between price hikes and actual improvements in quality or innovation.
luxury pricing, price increase, UHNW clients, value justification, consumer sentiment, affordability, product quality
false
Customer and Market Segmentation
Consumer Goods
Mixed Chart
McKinsey
Add to my slides
Remove from favorites
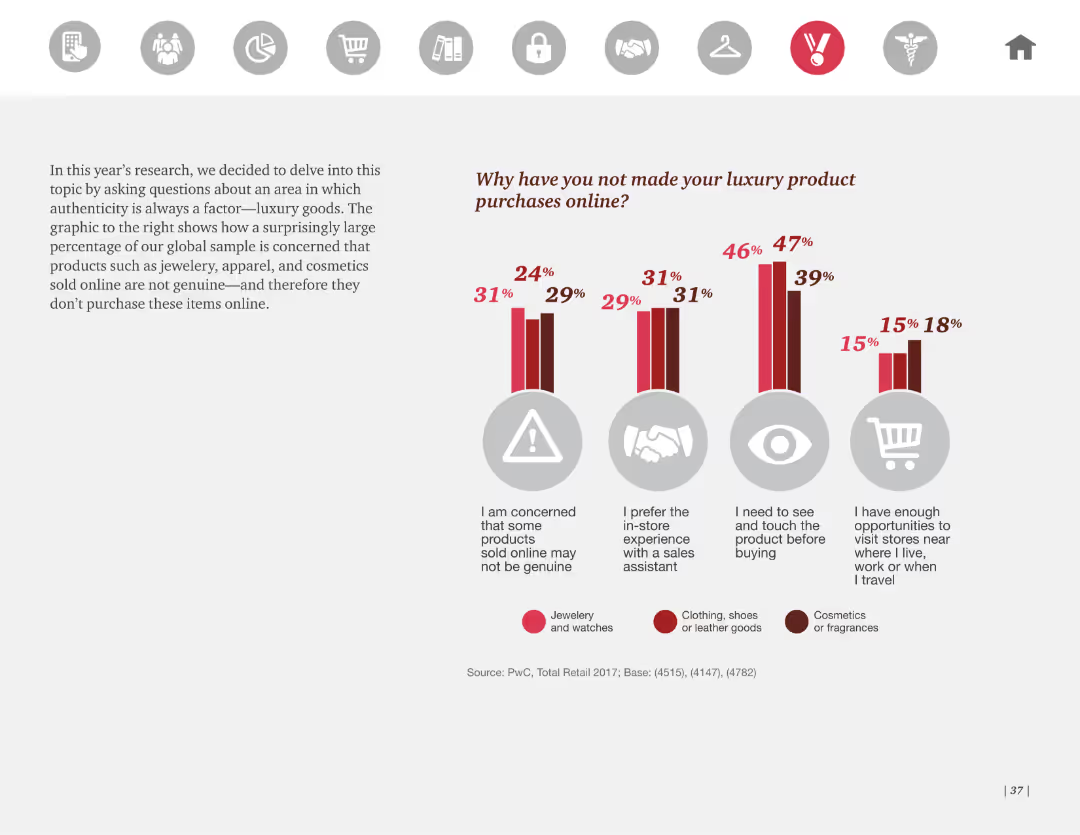
The slide presents a column chart depicting reasons for not purchasing luxury products online, segmented by product type. The design is clear with concise text explaining each reason and related statistics.
Market Analysis and Trends
Retail & E-commerce
It highlights survey findings that a significant number of consumers are hesitant to buy luxury products online due to concerns over authenticity, preference for in-store experiences, and the need to physically inspect items before purchase.
Luxury products, online shopping, consumer concerns, survey, authenticity
false
Market Analysis and Trends
Retail & E-commerce
Mixed Chart
PwC/Strategy&
Add to my slides
Remove from favorites
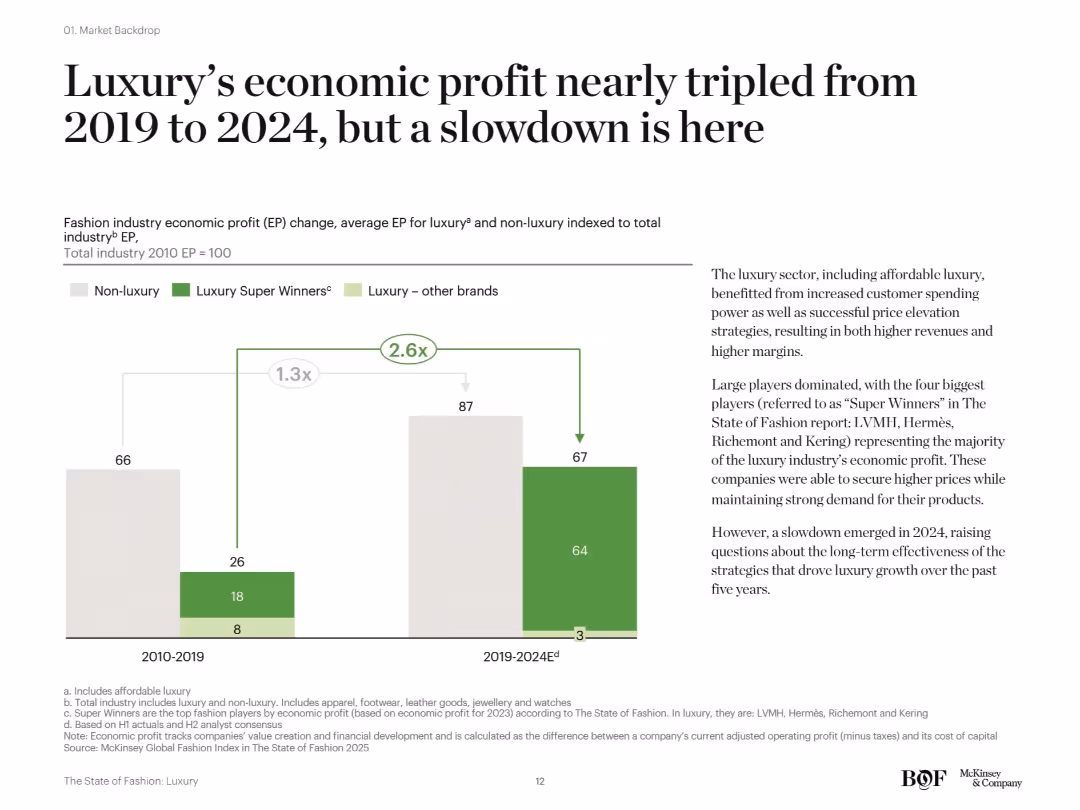
Vertical stacked bar chart comparing luxury and non-luxury EP across two periods. Right side has descriptive text with large headline and explanation of industry concentration and future risks.
Financial Performance
Consumer Goods
The fashion industry’s economic profit, especially from top luxury brands ("Super Winners"), significantly increased between 2019 and 2024, nearly tripling compared to 2010–2019. The growth was driven by pricing power and brand dominance, but signs of a 2024 slowdown have emerged.
luxury profit, economic profit, super winners, LVMH, fashion industry, slowdown, McKinsey
false
Financial Performance
Consumer Goods
Mixed Chart
McKinsey
Add to my slides
Remove from favorites
Complex visual with icons and pathways indicating steps in the luxury purchase process
Market Analysis and Trends
Retail & E-commerce
Details the fragmented journey of luxury purchasing across various channels
Luxury, Purchase Pathways, Consumer Journey, Fragmentation
false
Market Analysis and Trends
Retail & E-commerce
Pillar
BCG
Add to my slides
Remove from favorites
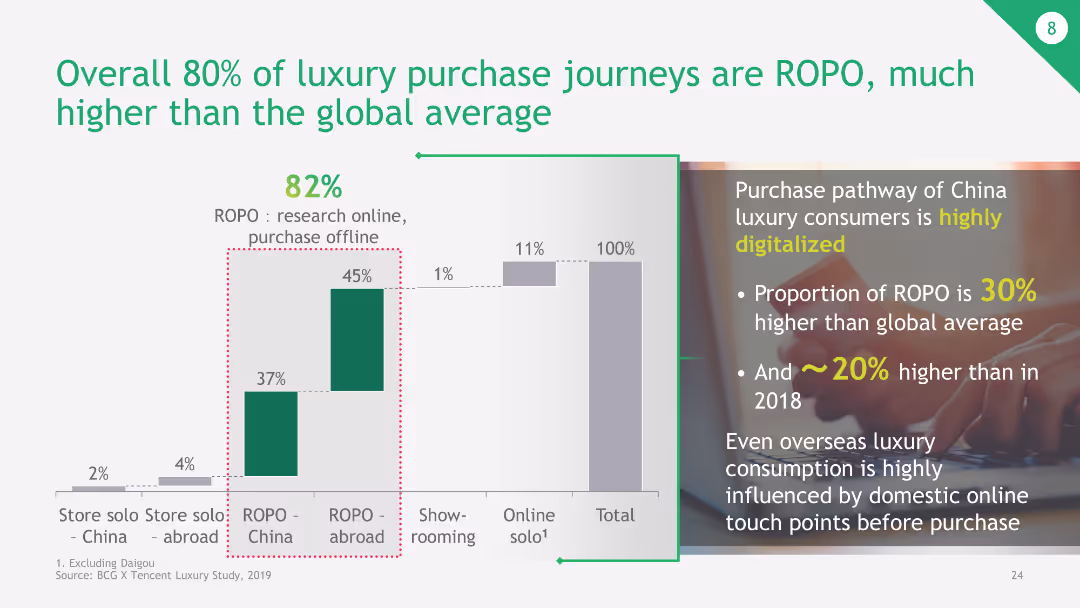
The slide has a column chart comparing different luxury purchase journeys, focusing on ROPO (Research Online, Purchase Offline) versus other purchasing behaviors.
Market Analysis and Trends
Retail & E-commerce
The slide highlights that 80% of luxury purchase journeys in China are ROPO, significantly higher than the global average. It emphasizes the impact of digital touchpoints in luxury purchase decisions.
luxury purchase, ROPO, digital touchpoints, China, global average
false
Market Analysis and Trends
Retail & E-commerce
Mixed Chart
BCG
Add to my slides
Remove from favorites
This slide features a detailed diagram and images emphasizing the importance of social impact in luxury purchasing decisions among younger generations. It combines text and visual elements like charts to convey complex social dynamics.
Market Analysis and Trends
Consumer Goods
Highlighting the growing importance of social impact in luxury purchasing, this slide discusses how younger generations, particularly Millennials and Gen Z, prioritize values like diversity and environmental sustainability in their buying decisions. It suggests a shift in luxury market strategies to accommodate these evolving consumer values.
luxury purchasing, social impact, Millennial and Gen Z, diversity, sustainability
false
Market Analysis and Trends
Consumer Goods
Diagram
Bain
Add to my slides
Remove from favorites
Contains column charts, pie charts, bar graph overlay.
Market Analysis and Trends
Retail & E-commerce
Discusses growth in luxury goods retail, market trends.
luxury, retail, growth, 2019, Asia
false
Market Analysis and Trends
Retail & E-commerce
Multiple Chart
Bain
Add to my slides
Remove from favorites
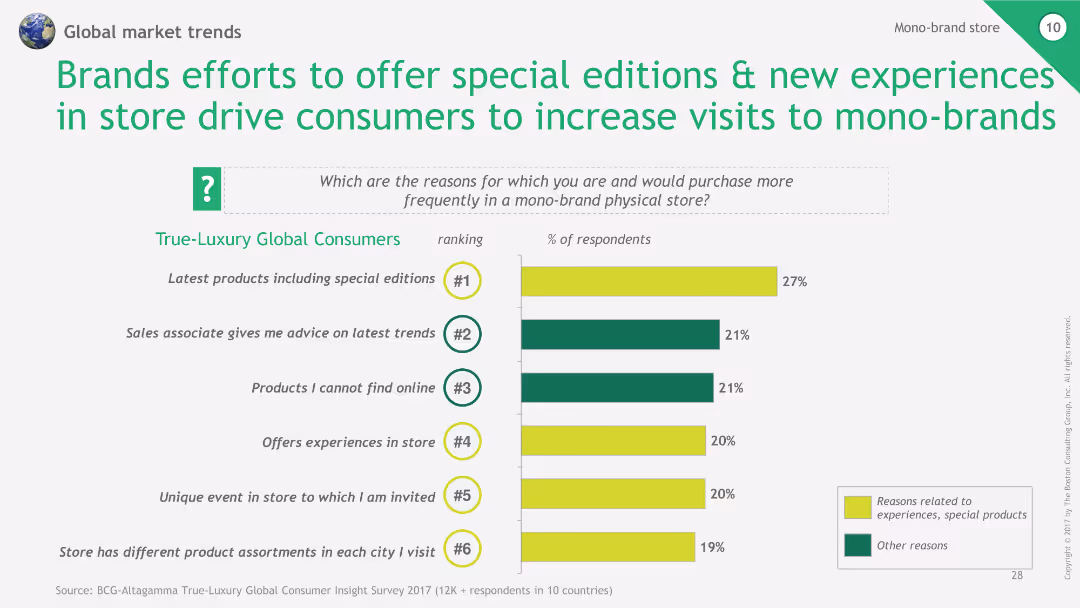
Column chart listing reasons for increased visits to mono-brand stores, ranked by percentage of respondents.
Market Analysis and Trends
Retail & E-commerce
The slide explains the reasons why consumers visit mono-brand stores more frequently, including special editions and in-store experiences.
luxury, retail, mono-brand, consumer visits, special editions
false
Market Analysis and Trends
Retail & E-commerce
Single Chart
BCG
Add to my slides
Remove from favorites
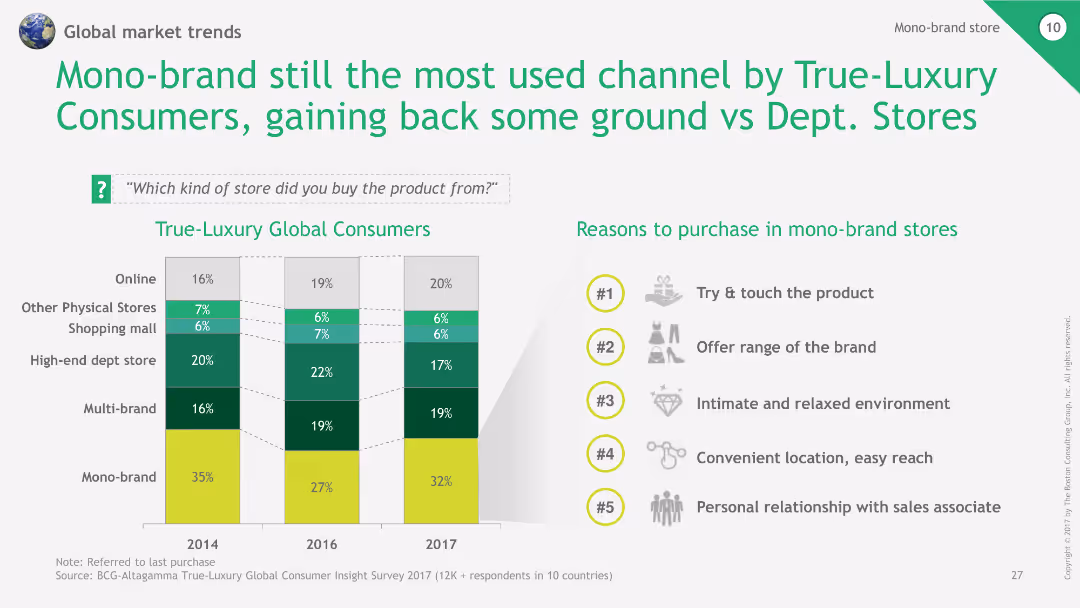
Column chart comparing shopping channel preferences of True-Luxury Global Consumers from 2014 to 2017. Highlights reasons for purchasing in mono-brand stores.
Market Analysis and Trends
Retail & E-commerce
This slide presents the most popular shopping channels among luxury consumers over several years, with mono-brand stores regaining popularity.
luxury, retail, mono-brand, shopping trends, consumer behavior
false
Market Analysis and Trends
Retail & E-commerce
Mixed Chart
BCG
Add to my slides
Remove from favorites
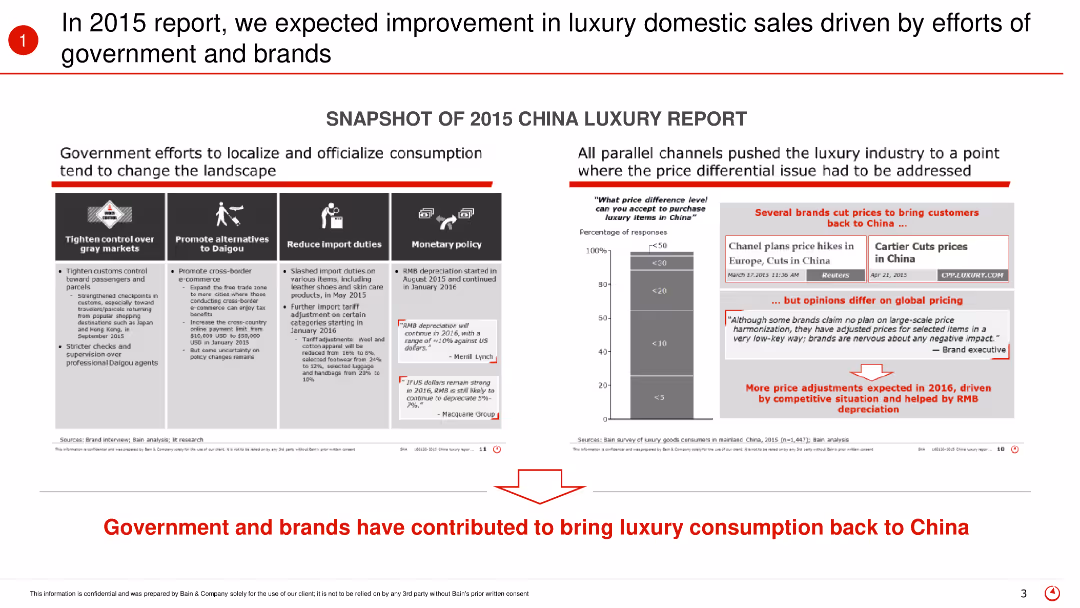
This slide includes text blocks and icons to describe government and brand efforts in improving luxury domestic sales in China. It also features a column chart and text highlighting the impact of these efforts on luxury consumption.
Regulatory and Compliance
Retail & E-commerce
The slide reviews the 2015 expectations for improvement in China's luxury domestic sales due to government policies and brand strategies. It discusses various measures taken to localize consumption and reduce price differences, ultimately contributing to an increase in luxury purchases.
Luxury sales, government efforts, brand strategies, China, 2015 report, luxury market, regulatory impact, consumption trends
false
Regulatory and Compliance
Retail & E-commerce
Mixed Chart
Bain
Add to my slides
Remove from favorites
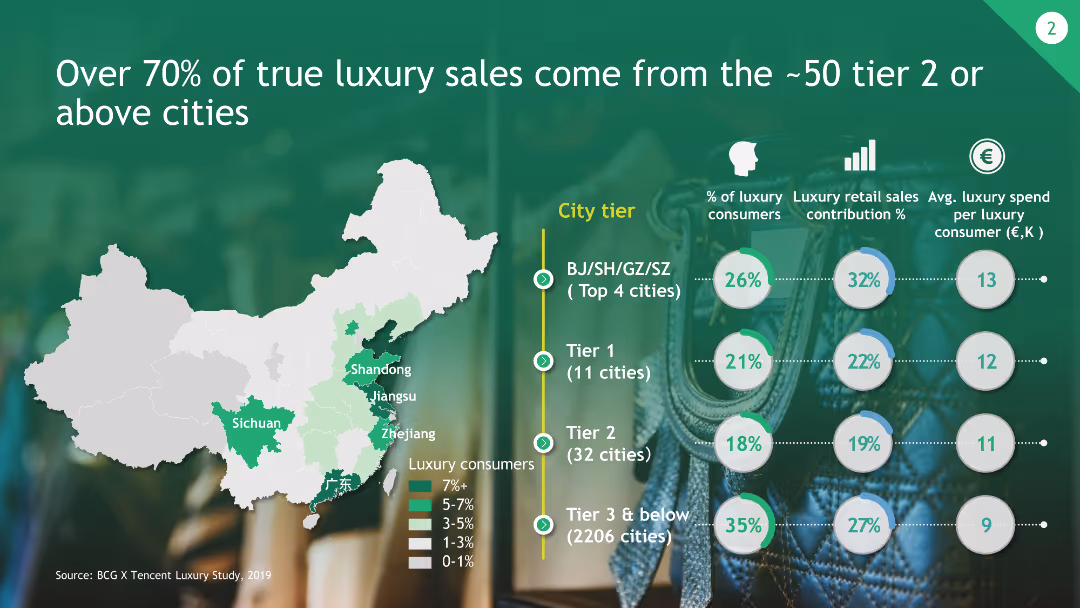
The slide includes a map of China highlighting tiered cities and their contribution to luxury sales, along with circular graphs representing consumer percentages and average spend.
Market Analysis and Trends
Consumer Goods
This slide shows that the majority of luxury sales come from approximately 50 tier 2 or above cities in China, with detailed data on consumer contributions and spending.
Luxury Sales, Tier Cities, Market Contribution, China, Consumer Data
false
Market Analysis and Trends
Consumer Goods
Multiple Chart
BCG
Add to my slides
Remove from favorites
This slide displays a series of labeled icons comparing growth and trends across different luxury segments like luxury toys, fine art, and gourmet food.
Market Analysis and Trends
Consumer Goods
Analyzes sector-specific growth and trends within the luxury market, providing insights into consumer preferences and market dynamics. Useful for targeted marketing strategies.
luxury sectors, growth trends, consumer preferences, market dynamics, marketing strategies
false
Market Analysis and Trends
Consumer Goods
Pillar
Bain
Add to my slides
Remove from favorites
Contains icons and descriptive text segments analyzing luxury market performance in sectors like Cars, Yachts, and Fine Dining. Each segment is clearly defined with associated performance indicators.
Market Analysis and Trends
Consumer Goods
This slide delves into various luxury market segments in 2020, detailing the impact of COVID-19 on sectors like automotive, yachts, fine dining, and hospitality. It examines the nuances of market resilience or decline across these categories, highlighting specific challenges and consumer behavior trends.
luxury sectors, market analysis, COVID-19 impact, consumer behavior, sector performance
false
Market Analysis and Trends
Consumer Goods
Pillar
Bain
Add to my slides
Remove from favorites
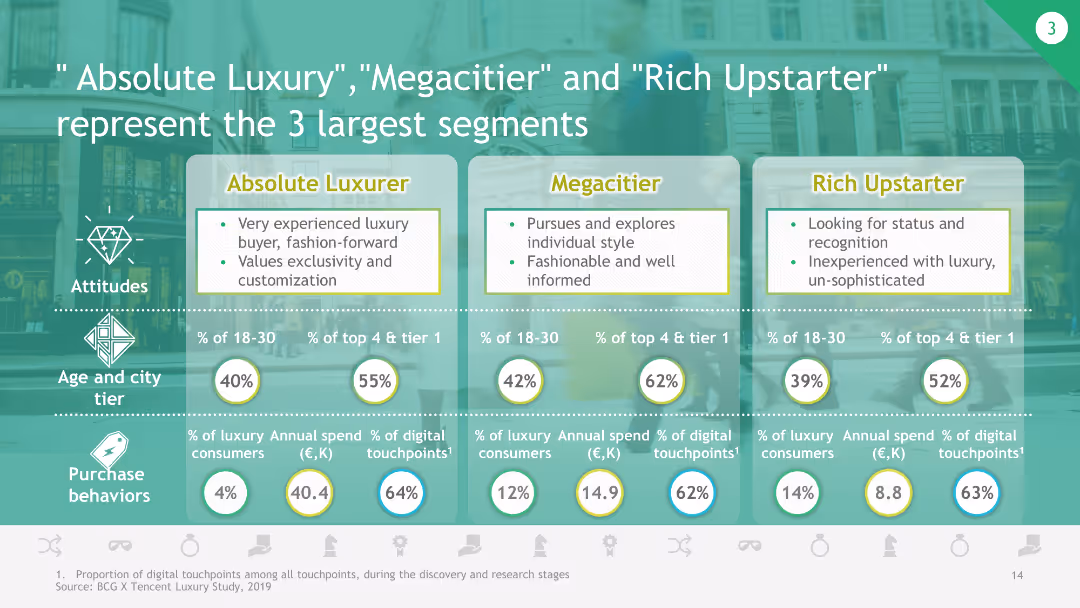
The slide uses a comparative layout to describe the attitudes, age and city tier distribution, and purchase behaviors of the three largest luxury consumer segments.
Customer and Market Segmentation
Consumer Goods
This slide highlights the three largest luxury consumer segments in China, detailing their characteristics, age distribution, city tier, and purchase behaviors.
luxury segments, consumer behavior, China market, age distribution, purchase behavior
false
Customer and Market Segmentation
Consumer Goods
Table
BCG
Add to my slides
Remove from favorites
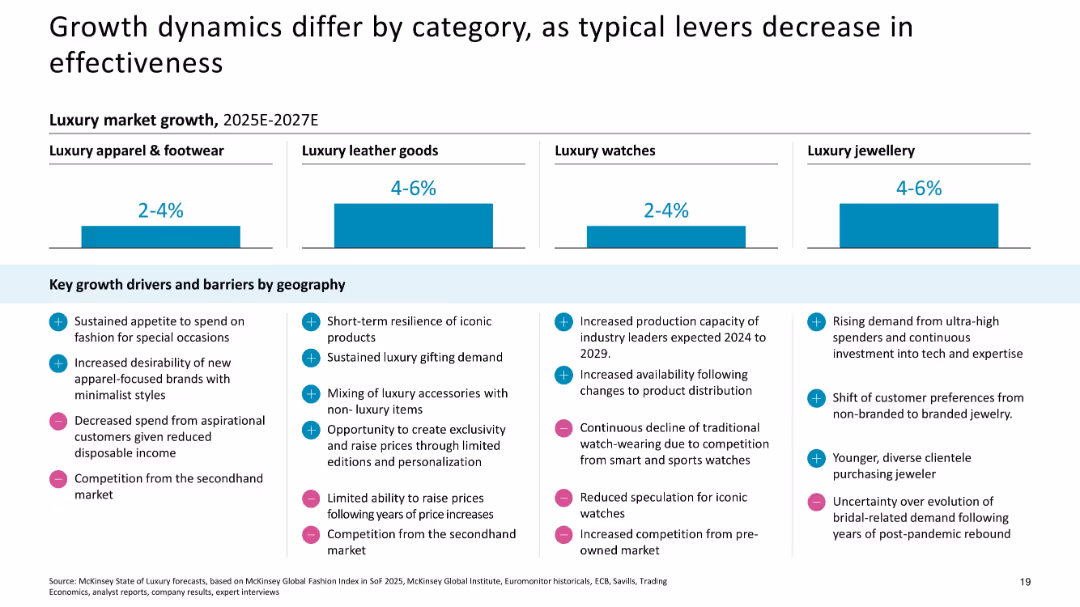
Grid format with segmented bar forecasts and bullet points; categorized by product type
Strategic Planning
Consumer Goods
Forecasts luxury market growth by product category (2025E–2027E) and identifies key growth drivers and barriers by geography and segment (e.g., leather goods, apparel, jewelry, watches).
luxury segments, market growth, product categories, drivers, barriers, 2027 forecast, apparel, leather goods, jewelry, watches
false
Strategic Planning
Consumer Goods
Mixed Chart
McKinsey
Add to my slides
Remove from favorites
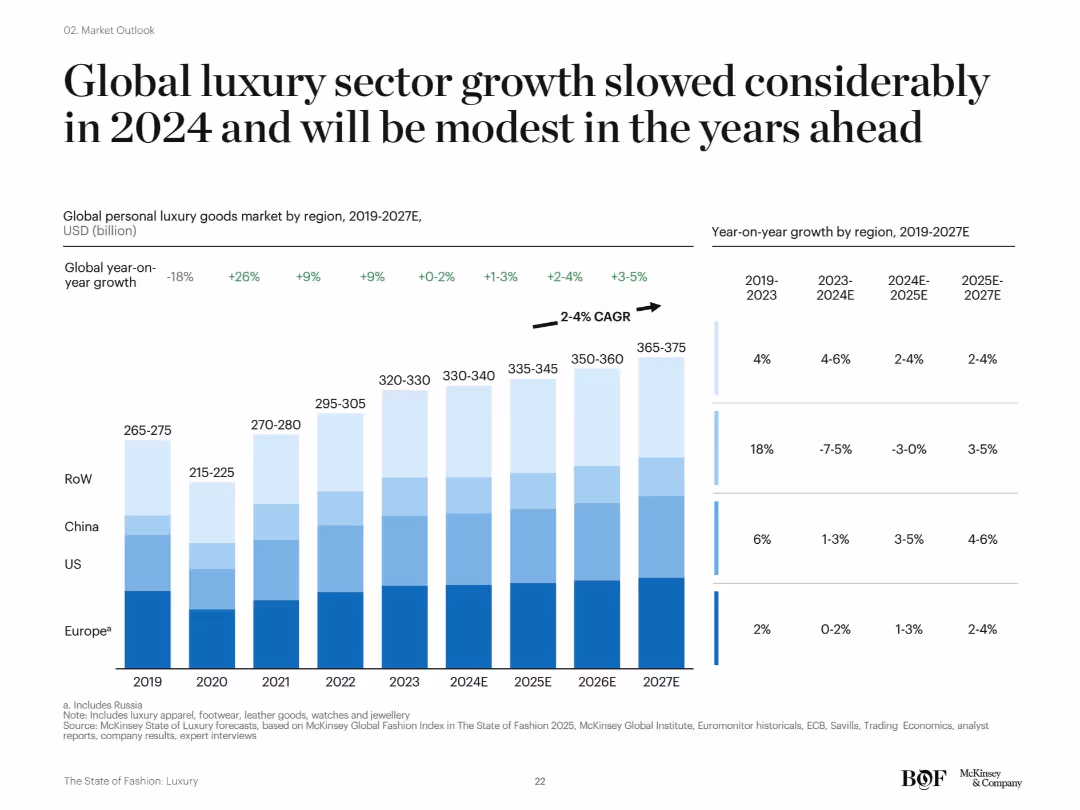
Bar graph showing personal luxury market size by region from 2019 to 2027E. Also includes YoY growth percentages and CAGR.
Market Analysis and Trends
Consumer Goods
This slide depicts a sharp slowdown in luxury market growth starting in 2024, after strong gains in previous years. It shows projected modest growth (2–4% CAGR) with regional breakdowns indicating especially weak recovery in China and stable growth in the US and Europe.
luxury slowdown, growth forecast, 2024 dip, CAGR, regional analysis, China, US, McKinsey
false
Market Analysis and Trends
Consumer Goods
Mixed Chart
McKinsey
Add to my slides
Remove from favorites
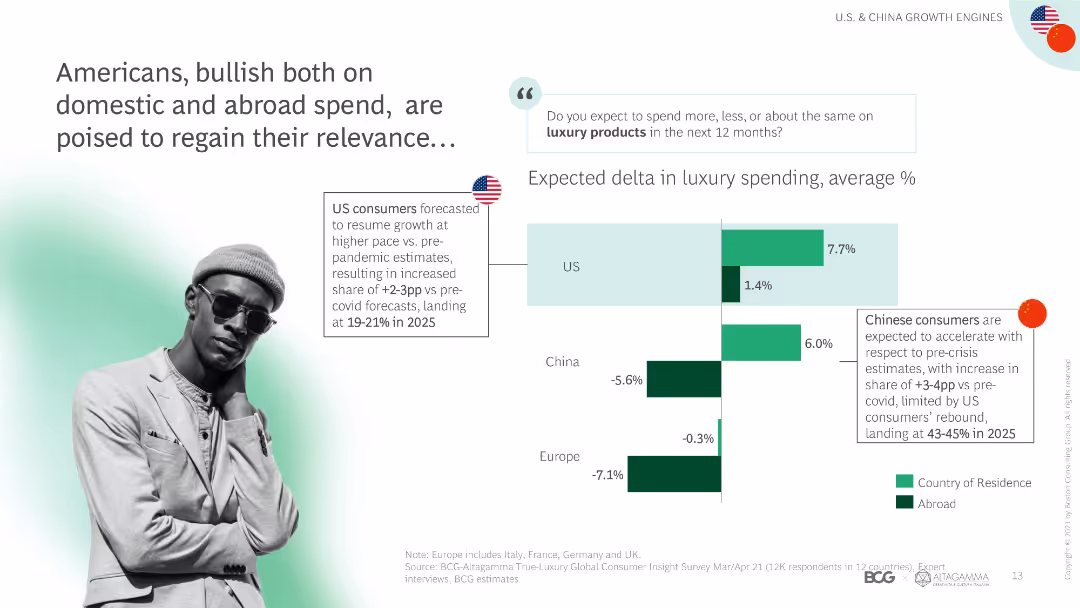
The slide features column charts showing expected changes in luxury spending by Americans domestically and abroad, with text boxes explaining the data.
Market Analysis and Trends
Retail & E-commerce
The slide discusses the optimism among American consumers regarding luxury spending both domestically and abroad, with projected growth rates and market shares.
Luxury spending, American consumers, domestic spend, abroad spend, market growth, projections, consumer optimism, spending trends, market shares
false
Market Analysis and Trends
Retail & E-commerce
Mixed Chart
BCG
Add to my slides
Remove from favorites
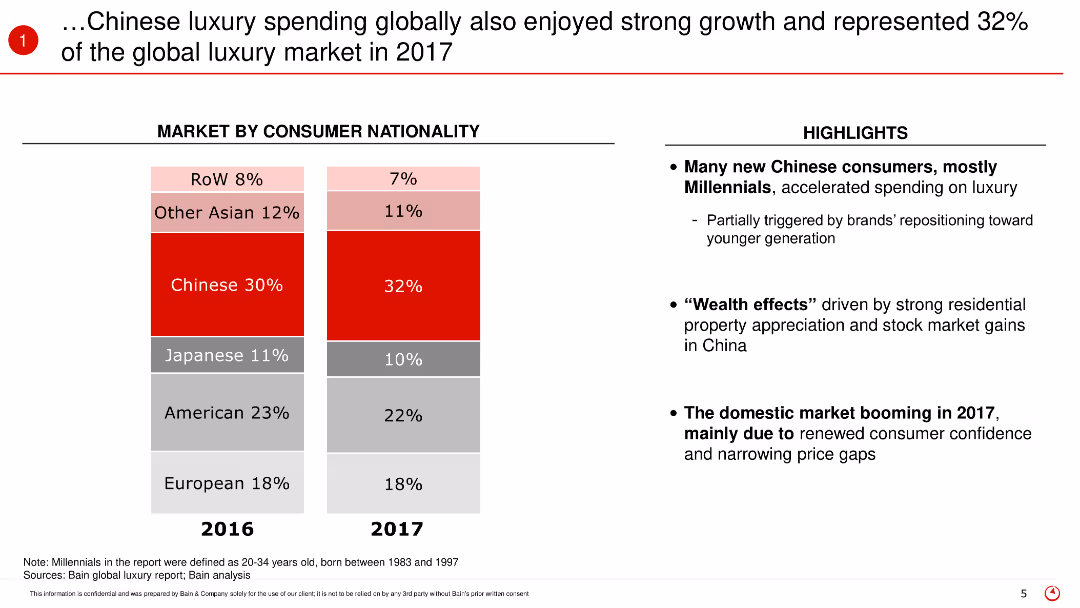
This slide features a stacked bar chart comparing the market share of luxury spending by consumer nationality between 2016 and 2017. The chart is accompanied by text highlighting the key insights and the factors contributing to the growth in Chinese luxury spending.
Market Analysis and Trends
Retail & E-commerce
The slide discusses the global luxury market in 2017, focusing on the significant contribution of Chinese consumers who represented 32% of the market. It highlights the increase in spending among Chinese Millennials and the factors driving this trend, such as the wealth effect and increased consumer confidence.
Luxury spending, Chinese consumers, global market, 2017, Millennials, market share, spending trends, consumer confidence, wealth effect
false
Market Analysis and Trends
Retail & E-commerce
Mixed Chart
Bain
Add to my slides
Remove from favorites
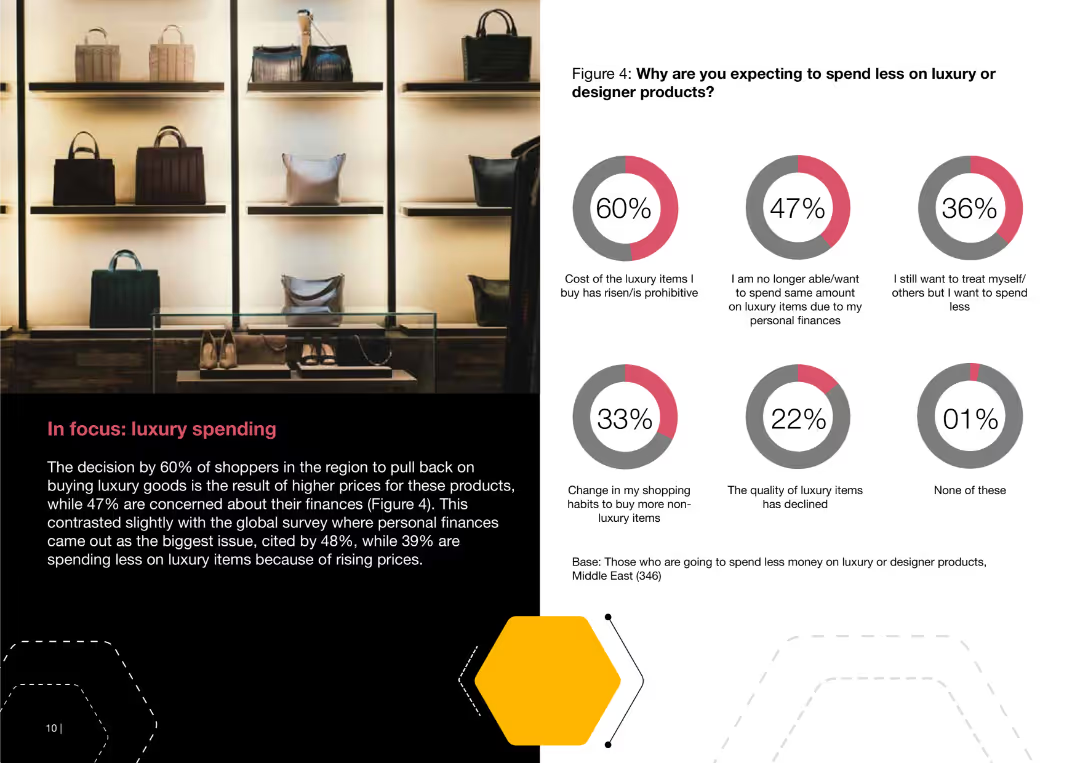
This slide includes a pie chart depicting reasons why consumers expect to spend less on luxury items, along with a text description of factors influencing luxury spending, such as rising prices and personal finances.
Customer and Market Segmentation
Consumer Goods
The slide focuses on luxury spending in the Middle East, exploring reasons why consumers plan to reduce luxury purchases, including rising costs and financial concerns.
luxury, spending, consumer, Middle East, prices, finances, reasons
false
Customer and Market Segmentation
Consumer Goods
Multiple Chart
PwC/Strategy&
Add to my slides
Remove from favorites
Depicts column charts contrasting the spending patterns of locals versus tourists from 2015 to 2025F in the luxury goods market.
Market Analysis and Trends
Retail & E-commerce
Shows the evolving dynamics of local versus tourist spending in the luxury market, highlighting the increasing dominance of local consumers.
luxury, spending, local, tourist, 2025
false
Market Analysis and Trends
Retail & E-commerce
Mixed Chart
Bain
Add to my slides
Remove from favorites
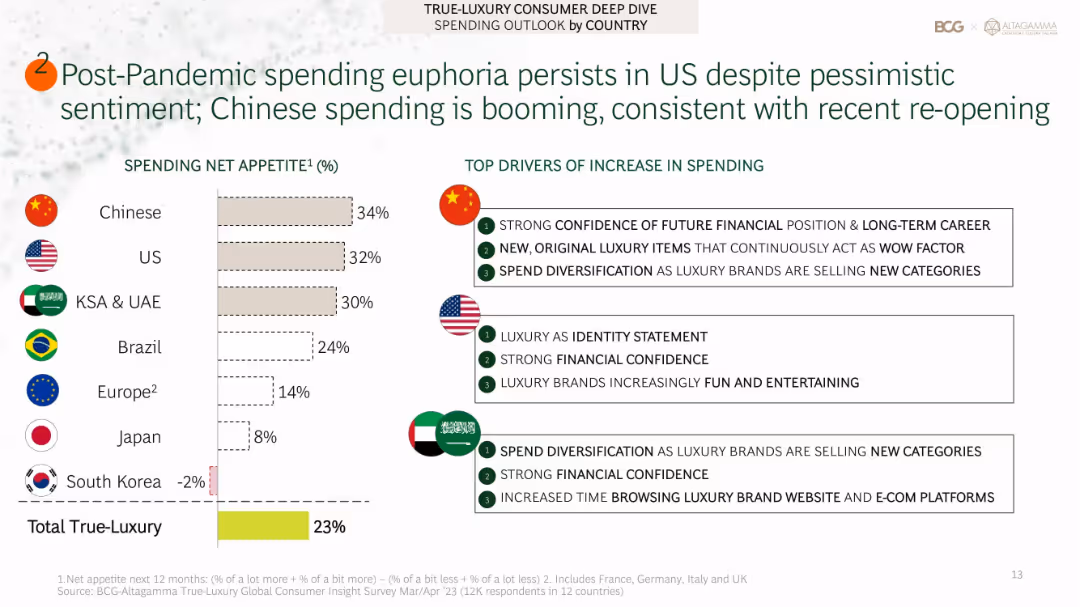
Two-column layout: left side features a horizontal bar chart comparing spending net appetite across countries; right side includes boxed lists of top spending drivers by country with flag icons
Market Analysis and Trends
Consumer Goods
The slide presents a comparative analysis of post-pandemic luxury spending appetite by country. China leads at 34%, followed by the US (32%) and KSA/UAE (30%). Key drivers for increased spending vary by region but generally include financial confidence, diversification of luxury offerings, and luxury as identity or entertainment.
luxury spending, post-pandemic, consumer sentiment, China, USA, KSA, financial confidence, identity, entertainment, diversification
false
Market Analysis and Trends
Consumer Goods
Mixed Chart
BCG
Add to my slides
Remove from favorites
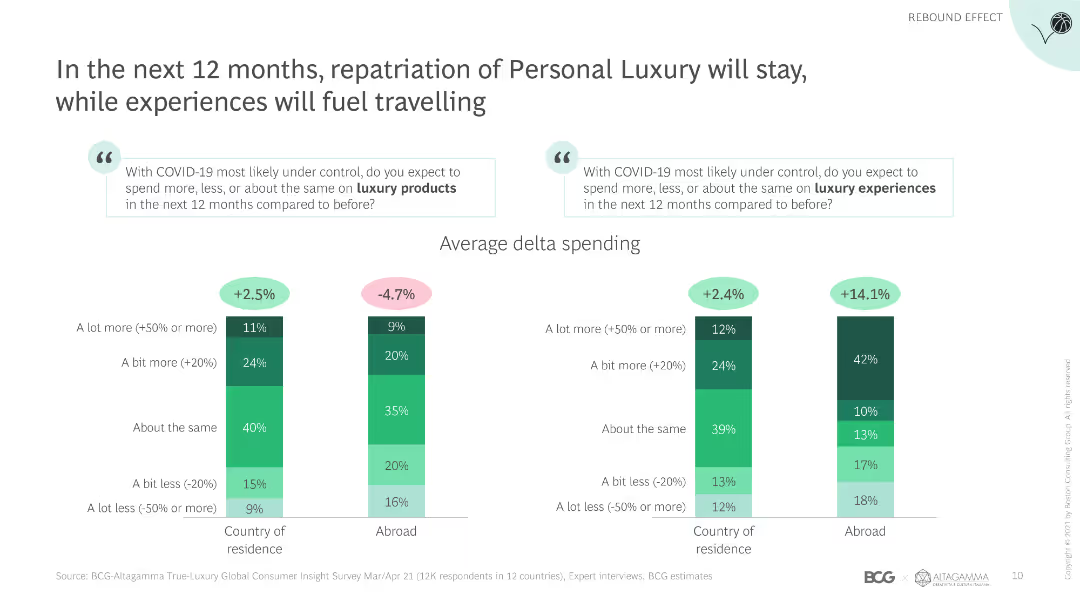
This slide includes column charts comparing spending on luxury products and experiences across different countries, with accompanying text explaining the findings.
Market Analysis and Trends
Retail & E-commerce
The slide analyzes consumer spending trends on luxury products and experiences in the next 12 months, with a focus on repatriation and travel-related luxury spending.
Luxury spending, repatriation, travel, consumer trends, luxury products, experiences, spending patterns, market analysis, next 12 months
false
Market Analysis and Trends
Retail & E-commerce
Multiple Chart
BCG
Add to my slides
Remove from favorites
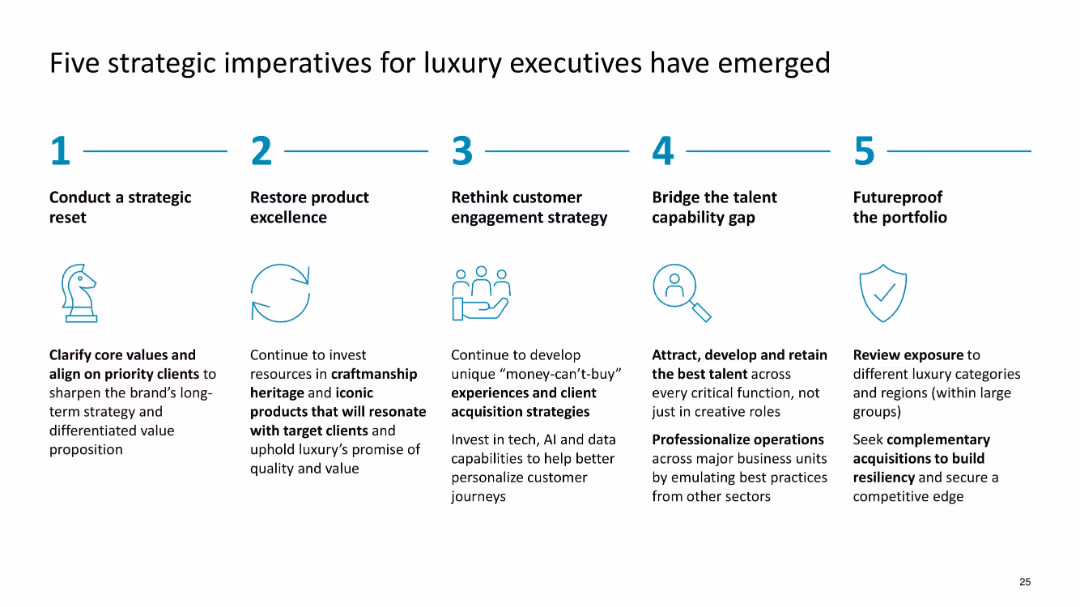
Horizontal list with icons and headers; structured in five equal columns
Strategic Planning
Consumer Goods
Recommends five strategic priorities for luxury execs, including strategic reset, product excellence, customer engagement, talent management, and portfolio resilience to drive growth and competitiveness.
luxury strategy, executives, imperatives, talent, portfolio, reset, customer engagement
false
Strategic Planning
Consumer Goods
Linear Flow
McKinsey
Add to my slides
Remove from favorites
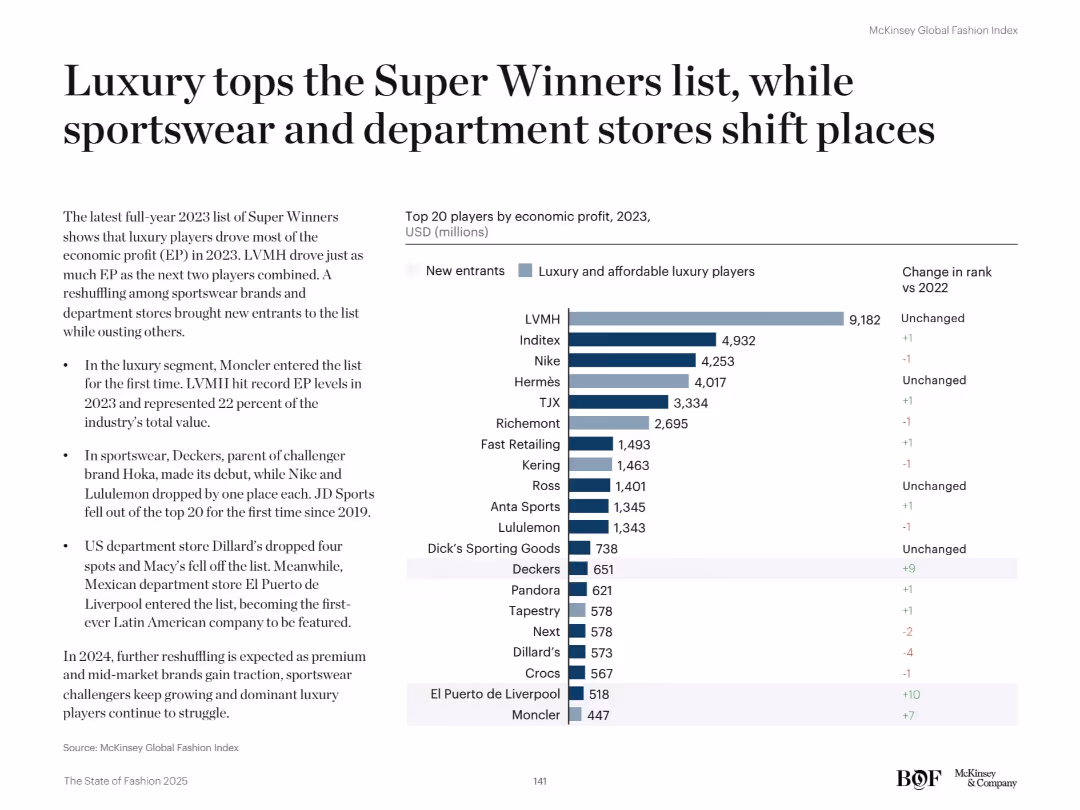
Two-column layout with a ranked bar chart of top 20 companies on the right and explanatory bullet points on the left. Blue and gray color-coding differentiates luxury players and new entrants.
Competitive Landscape
Retail & E-commerce
Luxury companies, led by LVMH, dominated economic profit in 2023. Moncler entered the Super Winners list for the first time. Sportswear reshuffling included new entrants like Deckers, while legacy names like JD Sports and Dillard’s dropped in rank. El Puerto de Liverpool became the first Latin American firm to be featured.
luxury, Super Winners, LVMH, Moncler, department stores, sportswear, EP ranking, new entrants
false
Competitive Landscape
Retail & E-commerce
Mixed Chart
McKinsey
Add to my slides
Remove from favorites
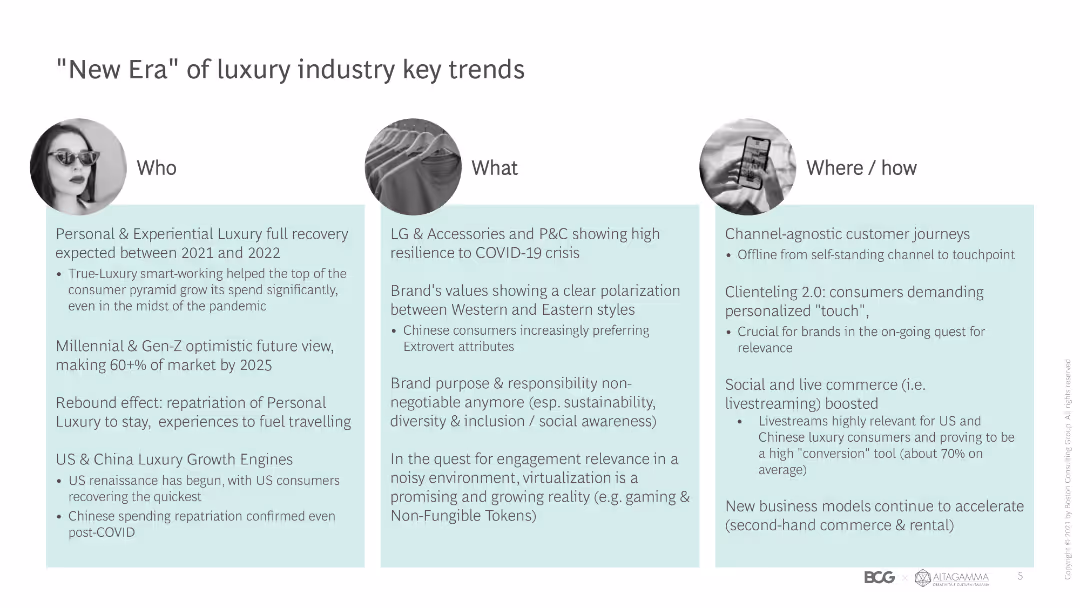
The slide has a three-column layout labeled 'Who', 'What', and 'Where/how', each with text descriptions and small icons representing each section.
Market Analysis and Trends
Retail & E-commerce
The slide outlines key trends in the luxury industry, including personal and experiential luxury recovery, consumer demographics, brand values, and channel-agnostic journeys.
Luxury trends, consumer demographics, brand values, channel-agnostic, experiential luxury, recovery, market trends, luxury goods, Gen Z
false
Market Analysis and Trends
Retail & E-commerce
Pillar
BCG
Add to my slides
Remove from favorites
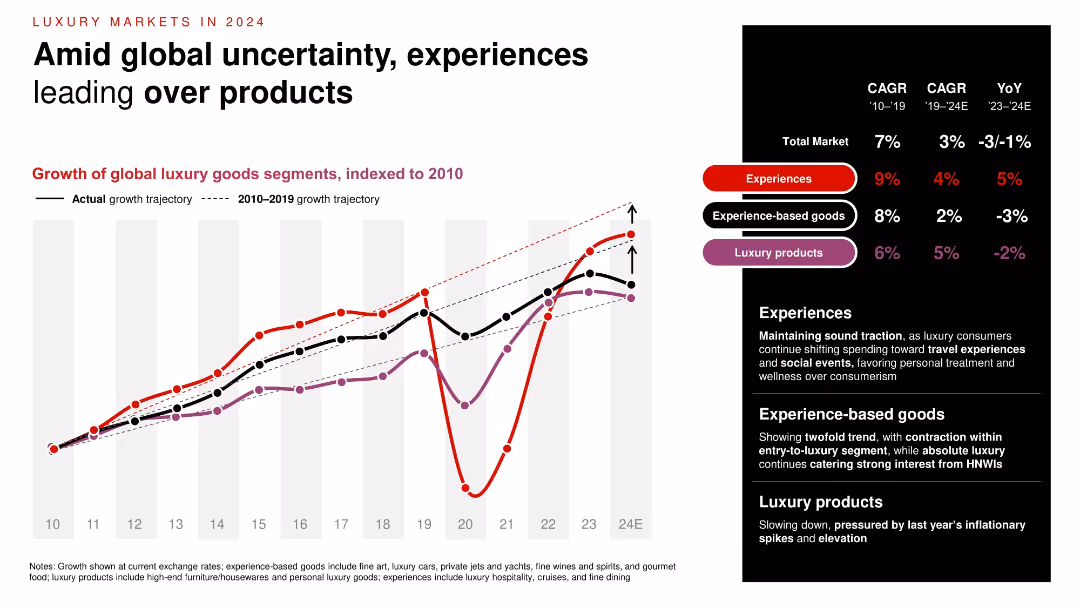
Line chart showing indexed growth trajectories (2010–2024E) of experiences, experience-based goods, and luxury products, color-coded and annotated. Growth rates and CAGR listed in a sidebar.
Market Analysis and Trends
Consumer Goods
The chart reveals diverging growth trends in luxury: experiences continue to outperform goods, especially post-COVID. Experiences see a 5% YoY growth, while luxury products decline. Commentary elaborates on consumer behavior shift from material goods to social and experiential spending.
luxury trends, experience economy, CAGR, consumer behavior, 2024, indexed growth, experiences
false
Market Analysis and Trends
Consumer Goods
Mixed Chart
Bain
Add to my slides
Remove from favorites
Lists emerging, growing, and stabilizing trends in the luxury market with corresponding icons and brief descriptions, like collaborations, second-hand markets, and sustainability efforts.
Market Analysis and Trends
Retail & E-commerce
Summarizes the 2019 luxury market trends, focusing on the influence of casualwear, influencers, and digital media on consumer preferences and market dynamics.
luxury trends, market analysis, 2019, casualwear, influencers, digital media, sustainability, collaborations
false
Market Analysis and Trends
Retail & E-commerce
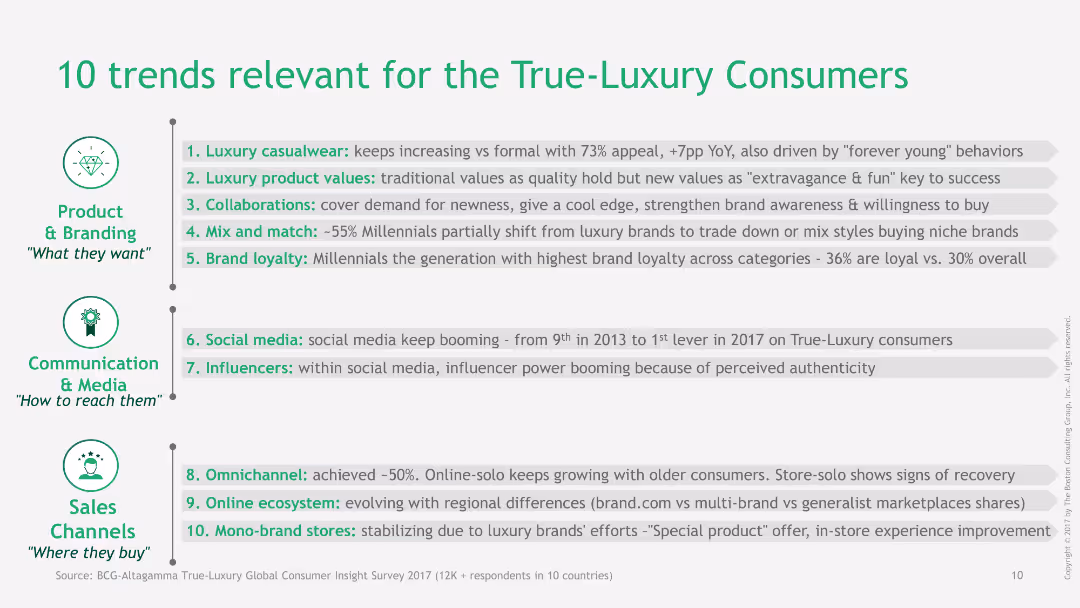
Table
BCG
Add to my slides
Remove from favorites
This slide lists 10 trends related to true-luxury consumers. It uses a combination of text and icons, organized into three categories: Product & Branding, Communication & Media, Sales Channels.
Market Analysis and Trends
Consumer Goods
The slide highlights key trends in the luxury market, covering aspects such as product values, social media influence, omnichannel growth, and brand loyalty among millennials.
luxury trends, true-luxury consumers, product branding, social media, omnichannel
false
Market Analysis and Trends
Consumer Goods
Header Vertical
BCG
Add to my slides
Remove from favorites
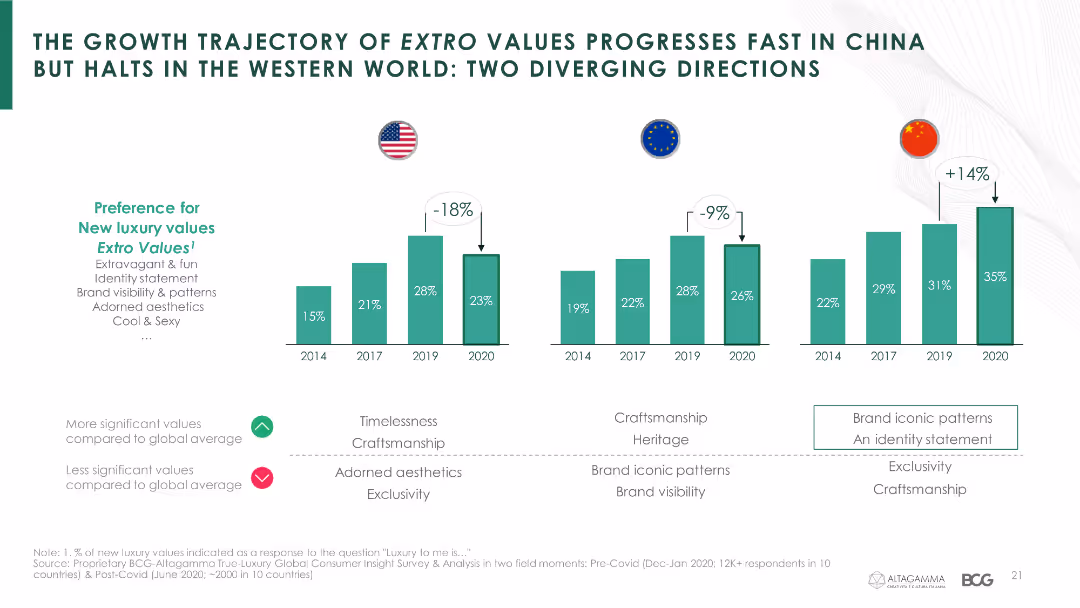
The slide features a column chart showing the growth trajectory of "extro values" in luxury markets, comparing China with Western countries from 2014 to 2020.
Market Analysis and Trends
Consumer Goods
It highlights the differences in luxury value trends between China and Western countries, showing a faster progression in China.
luxury values, extro values, growth trajectory, China, Western world, market trends, COVID-19
false
Market Analysis and Trends
Consumer Goods
Multiple Chart
BCG
Add to my slides
Remove from favorites
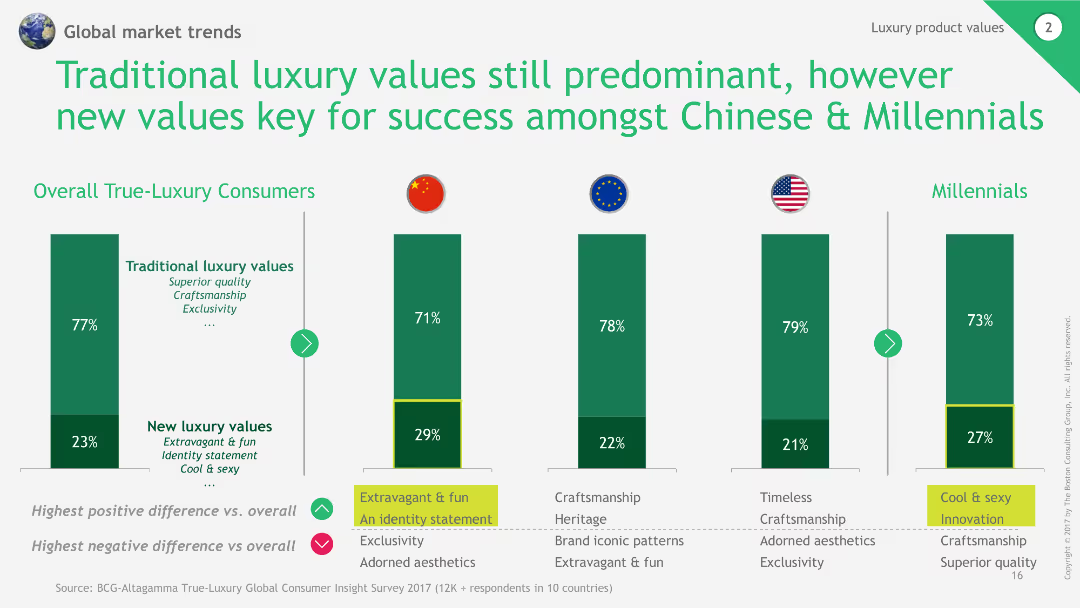
This slide includes a column chart comparing traditional and new luxury values among different demographics, with highlighted differences and supporting text.
Market Analysis and Trends
Consumer Goods
The slide analyzes the importance of traditional versus new luxury values, highlighting the significant differences in preferences among Chinese consumers and Millennials.
luxury values, traditional vs new, demographic comparison, column chart, market trends
false
Market Analysis and Trends
Consumer Goods
Multiple Chart
BCG
Add to my slides
Remove from favorites
A three-part comparative layout discussing major M&A highlights across industries, including energy, financial services, and consumer sectors.
Market Analysis and Trends
Financial Services
Highlights key M&A activities in 2020, focusing on industries like energy and financial services, including major deals and industry impacts.
M&A, 2020, Philippines, energy, financial services, consumer, industry focus
false
Market Analysis and Trends
Financial Services
Pillar
Deloitte
Add to my slides
Remove from favorites
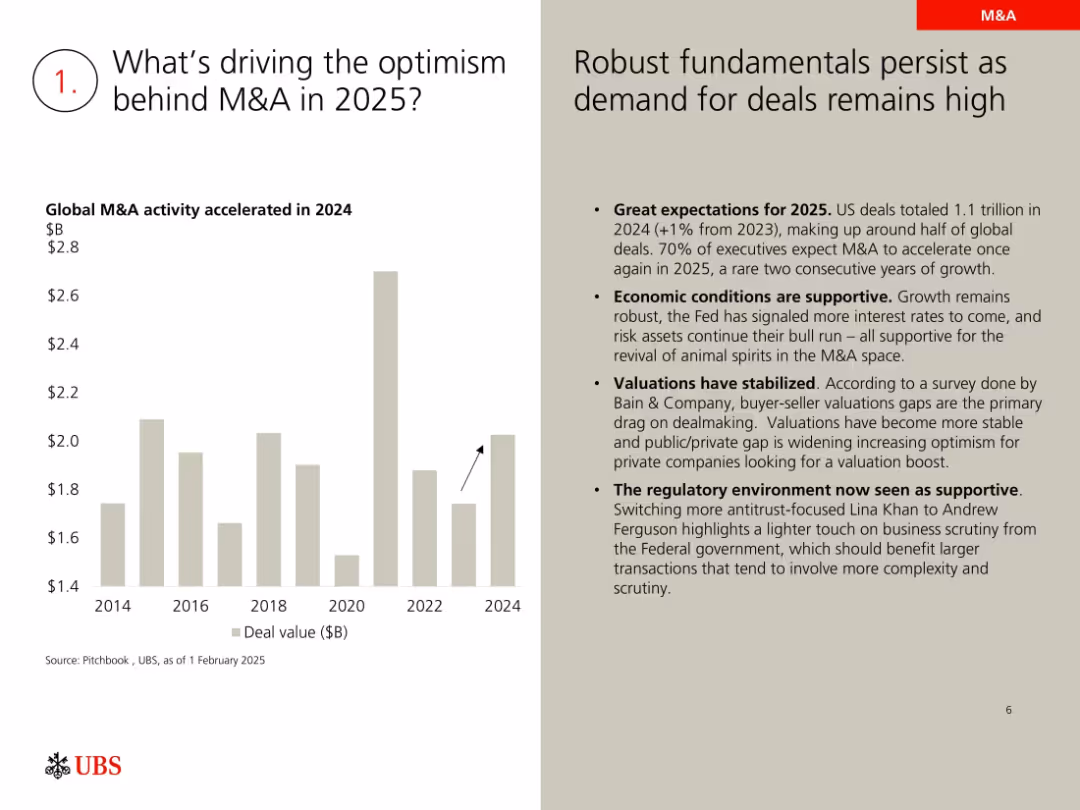
Split-screen with left-side bar chart and right-side bulleted commentary
Mergers and Acquisitions
Financial Services
Highlights reasons for optimism in 2025 M&A activity including strong 2024 deal volume, improved economic conditions, stabilized valuations, and a more supportive regulatory environment. Provides statistical support and executive sentiment forecasts.
M&A, 2025 forecast, deal volume, regulatory environment, valuations, executive outlook
false
Mergers and Acquisitions
Financial Services
Mixed Chart
UBS
Add to my slides
Remove from favorites
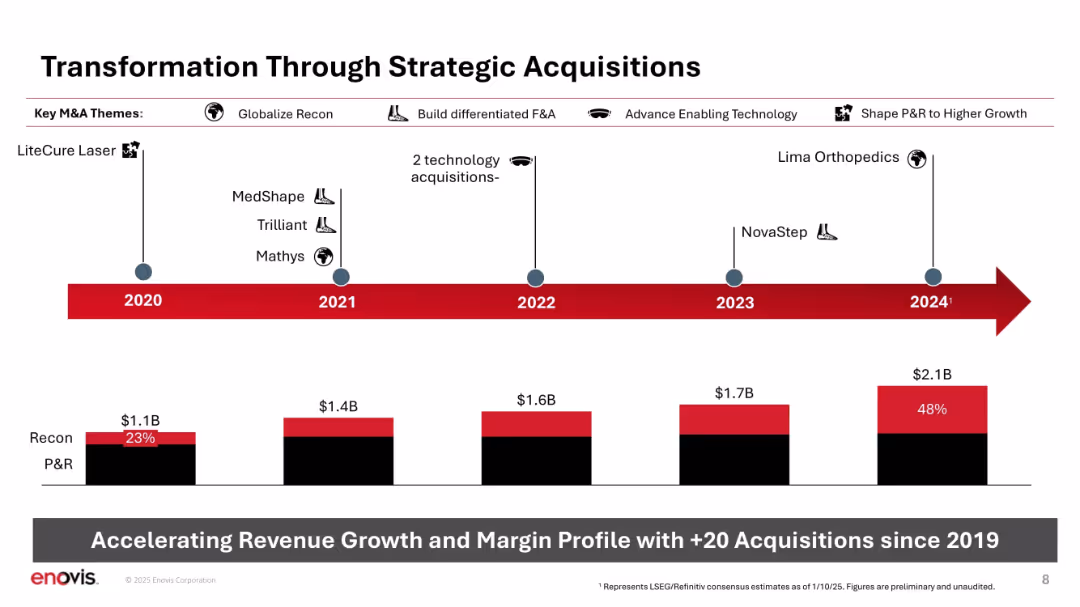
Horizontal timeline with icons and acquisition names; bar chart at bottom showing Recon vs. P&R growth.
Strategic Planning
Healthcare & Pharmaceuticals
Depicts Enovis’s strategic acquisitions since 2020, categorized by theme (e.g., globalize Recon, enabling tech). Shows revenue growth over time and increase in Recon's share of sales. Emphasizes +20 acquisitions as a key driver of transformation.
M&A, acquisitions, Recon, P&R, strategy, timeline, revenue growth, expansion
false
Strategic Planning
Healthcare & Pharmaceuticals
Mixed Chart
JP Morgan
Add to my slides
Remove from favorites
The slide consists of a column chart showing campaigns with M&A objectives and a table with recent M&A-related activist campaigns. It provides a clear visual representation of data related to M&A activism.
Mergers and Acquisitions
Financial Services
Examines the role of M&A-related activism, presenting recent campaigns and highlighting objectives such as company sales, spin-offs, and strategic reviews.
M&A activism, campaigns, objectives, strategic reviews, recent campaigns
false
Mergers and Acquisitions
Financial Services
Mixed Chart
Barclays
Add to my slides
Remove from favorites
This slide features multiple column charts illustrating M&A trends in discrete automation, including the total number of transactions and valuations for different categories like automation software, process level control, system integrators, machine builders, and component manufacturers.
Mergers and Acquisitions
Industrial & Manufacturing
The slide discusses the expected increase in M&A activity in discrete automation, highlighting trends, investor interests, and the valuation levels across various sub-sectors such as automation software and system integrators.
M&A Activity, Discrete Automation, Investor Trends, Transaction Data, Automation Software, System Integrators, Machine Builders, Component Manufacturers
false
Mergers and Acquisitions
Industrial & Manufacturing
Multiple Chart
LEK
Add to my slides
Remove from favorites
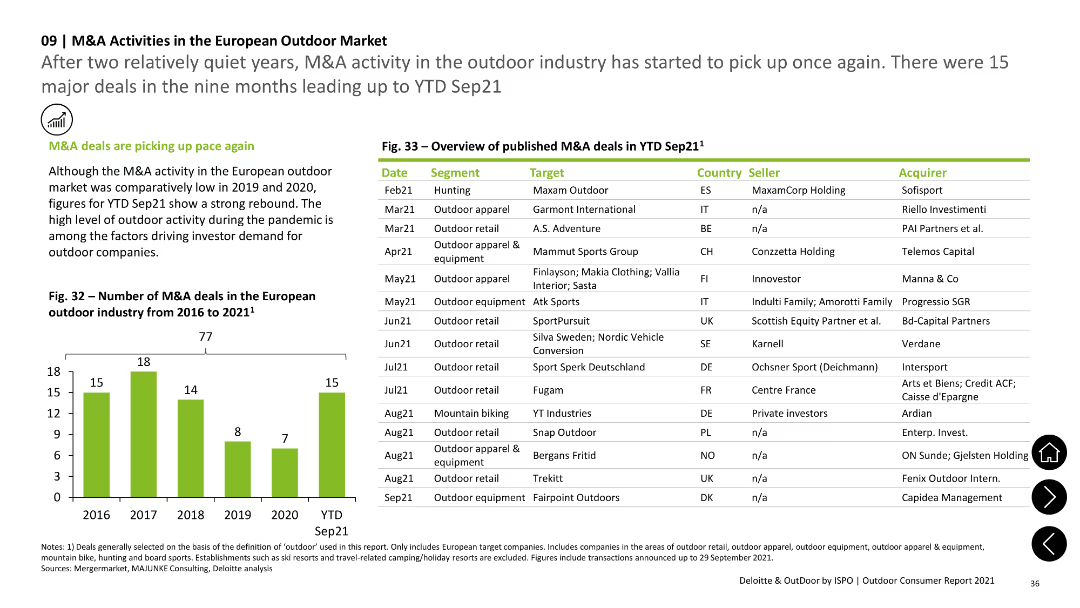
The slide has a column chart showing the number of M&A deals from 2016 to 2021 and a table listing details of M&A deals in 2021, including date, segment, target, country, seller, and acquirer. Text sections add context.
Mergers and Acquisitions
Financial Services
The slide provides an overview of M&A activities in the European outdoor market, with data on the number of deals over recent years and specific details of major deals in 2021, indicating a rebound in M&A activity.
M&A activity, financial services, European market, mergers, acquisitions
false
Mergers and Acquisitions
Financial Services
Mixed Chart
Deloitte
Add to my slides
Remove from favorites
The slide presents bar charts showing historical and projected M&A activity in industrial automation, along with key trends and factors driving this activity.
Mergers and Acquisitions
Industrial & Manufacturing
The slide forecasts increased M&A activity in industrial automation, driven by trends such as digitalization, recurring revenues, and the impact of COVID-19 on investment strategies.
M&A activity, industrial automation, trends, digitalization, COVID-19, investment strategies
false
Mergers and Acquisitions
Industrial & Manufacturing
Multiple Chart
LEK
Add to my slides
Remove from favorites
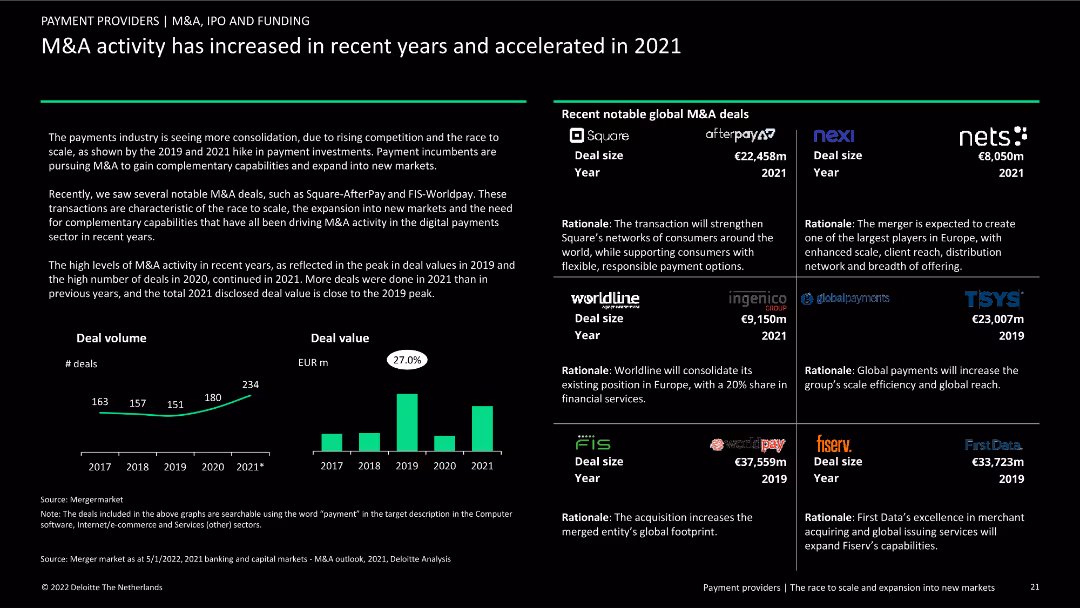
Contains a bar chart showing deal volume and value from 2017 to 2021, and text boxes with notable global M&A deals.
Mergers and Acquisitions
Financial Services
Examination of recent M&A activity in the payments industry, highlighting key deals and the increase in M&A volume and value from 2017 to 2021.
M&A activity, payments industry, deal volume, deal value, notable deals, financial services, market analysis, trends, global perspective
false
Mergers and Acquisitions
Financial Services
Multiple Chart
Deloitte
Add to my slides
Remove from favorites
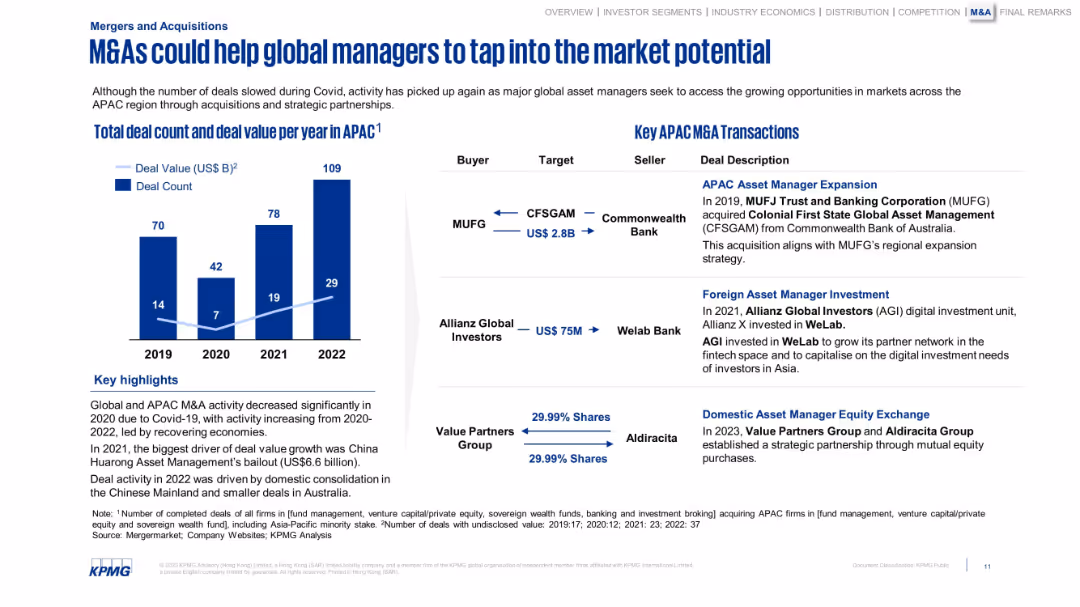
Split-layout slide: Left side features a vertical bar chart on deal count and value in APAC (2019–2022); right side lists key M&A transactions with logos and structured table format. Blue-themed corporate design.
Mergers and Acquisitions
Financial Services
The slide analyzes M&A activity trends in the APAC region, showing recovery post-COVID with rising deal counts and values. It highlights notable transactions involving asset managers like MUFG and Allianz, emphasizing strategic acquisitions and equity exchanges.
M&A, APAC, asset management, strategic partnerships, deal volume, MUFG, Allianz, Value Partners, equity transactions, post-COVID
false
Mergers and Acquisitions
Financial Services
Mixed Chart
KPMG
Add to my slides
Remove from favorites
Contains three pie charts displaying awareness and usage of Mobility-as-a-Service (MaaS), and its availability.
Market Analysis and Trends
Transportation & Logistics
Analyzes consumer awareness and engagement with Mobility-as-a-Service (MaaS), indicating low familiarity and usage despite available services.
MaaS, awareness, usage, transportation services, availability
false
Market Analysis and Trends
Transportation & Logistics
Multiple Chart
Deloitte
Add to my slides
Remove from favorites
Features a bar chart outlining the percentage of consumers willing to adopt MaaS and preferred transport types included in MaaS.
Strategic Planning
Transportation & Logistics
Details consumer willingness to adopt Mobility-as-a-Service as their primary transport, with a focus on age demographics and preferences for transport types.
MaaS, consumer preferences, transportation types, age demographics, adoption rates
false
Strategic Planning
Transportation & Logistics
Mixed Chart
Deloitte
Add to my slides
Remove from favorites
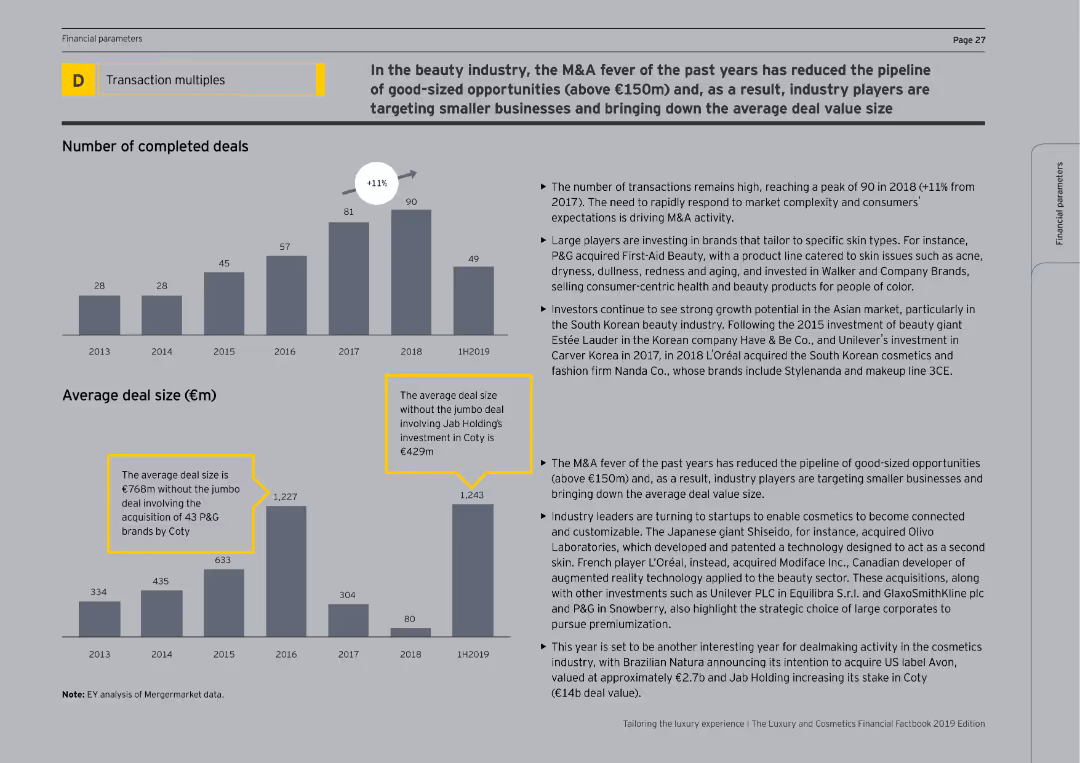
The slide contains column charts depicting the number of completed deals and average deal sizes from 2013 to 1H2019. The text discusses the reduction in large M&A opportunities and the focus on smaller, specialized beauty brands.
Mergers and Acquisitions
Consumer Goods
The slide discusses the trends in M&A activity within the beauty industry, noting a high number of transactions in recent years but a decline in large deal sizes. It highlights the strategic shift towards acquiring smaller, niche beauty brands and the potential for future growth in the sector.
M&A, Beauty, Deals, Acquisitions, Industry Trends
false
Mergers and Acquisitions
Consumer Goods
Multiple Chart
EY
Add to my slides
Remove from favorites
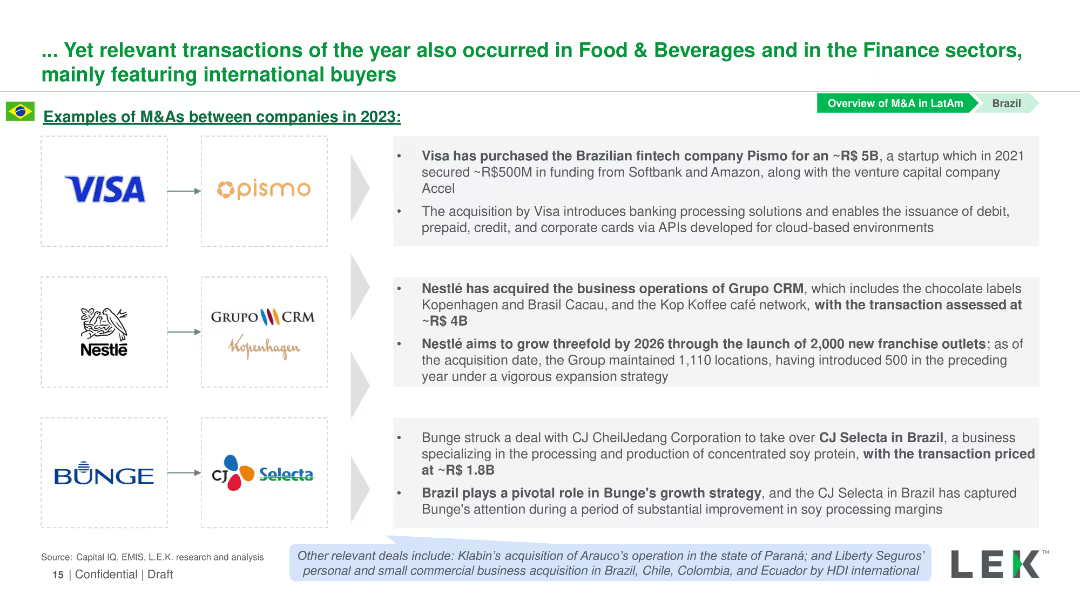
Contains logos of companies involved in M&A deals in 2023, with text descriptions next to each logo detailing the transactions.
Mergers and Acquisitions
Financial Services
Highlights significant M&A transactions in Brazil’s Food & Beverages and Finance sectors, listing the companies involved and details of each deal.
M&A, Brazil, Finance, Food & Beverages, Transactions
false
Mergers and Acquisitions
Financial Services
Table
LEK
Add to my slides
Remove from favorites
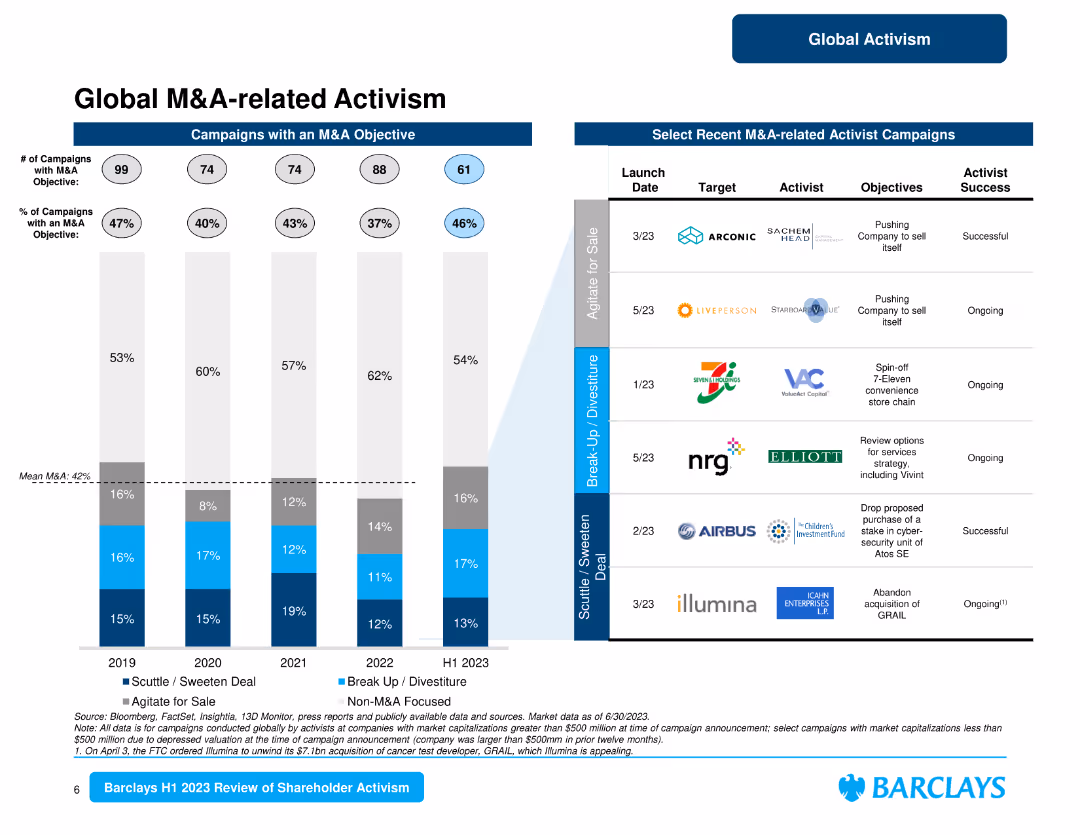
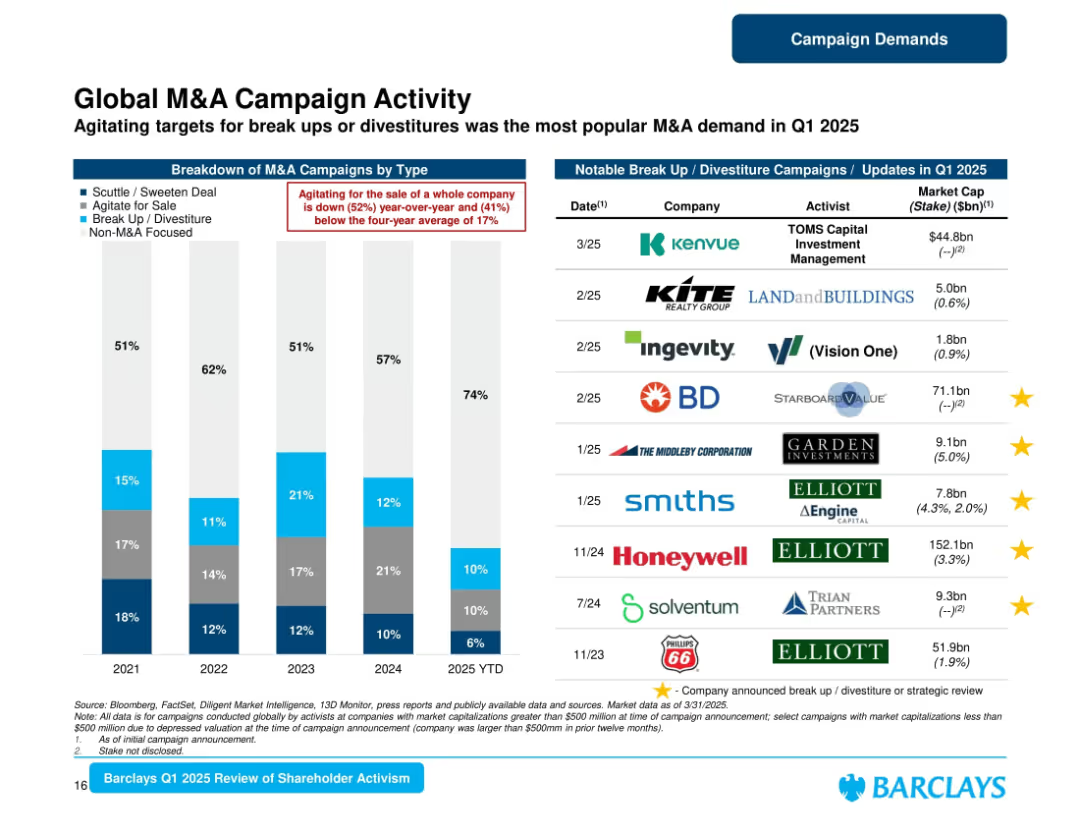
Left section shows stacked bars; right section is a table of notable campaigns with logos and company names.
Mergers and Acquisitions
Financial Services
Reviews M&A-related activist campaigns globally, showing breakdowns by type and a decline in campaigns agitating for full company sales. Includes a list of key break-up/divestiture campaigns with associated firms and market cap data.
M&A, Campaigns, Divestiture, Activists, Global, Shareholder, Barclays, Breakup, 2025
false
Mergers and Acquisitions
Financial Services
Mixed Chart
Barclays
Add to my slides
Remove from favorites
Similar to the previous slide, it outlines a case study with opportunity, client, need, offered solutions, and a timeline showing the progression over years.
Client Case Studies
Financial Services
This case study covers an M&A transaction as a product multiplier, detailing the client's needs, offered solutions, and outcomes over an eight-year timeline.
M&A, case study, client solutions, investment realization, product multiplier
false
Client Case Studies
Financial Services
Linear Flow
Credit Suisse
Add to my slides
Remove from favorites
The slide features a column chart showing global M&A volume by deal type from 2017 to 2023, and a line chart depicting S&P 500 cash/assets from 2007 to Q3 2023. The layout is moderately complex with well-structured visual elements.
Financial Performance
Financial Services
The slide analyzes the trend in global M&A volumes and the cash position of corporates over time, highlighting their financial resilience and strategic positioning.
M&A, cash position, S&P 500, financial trend
false
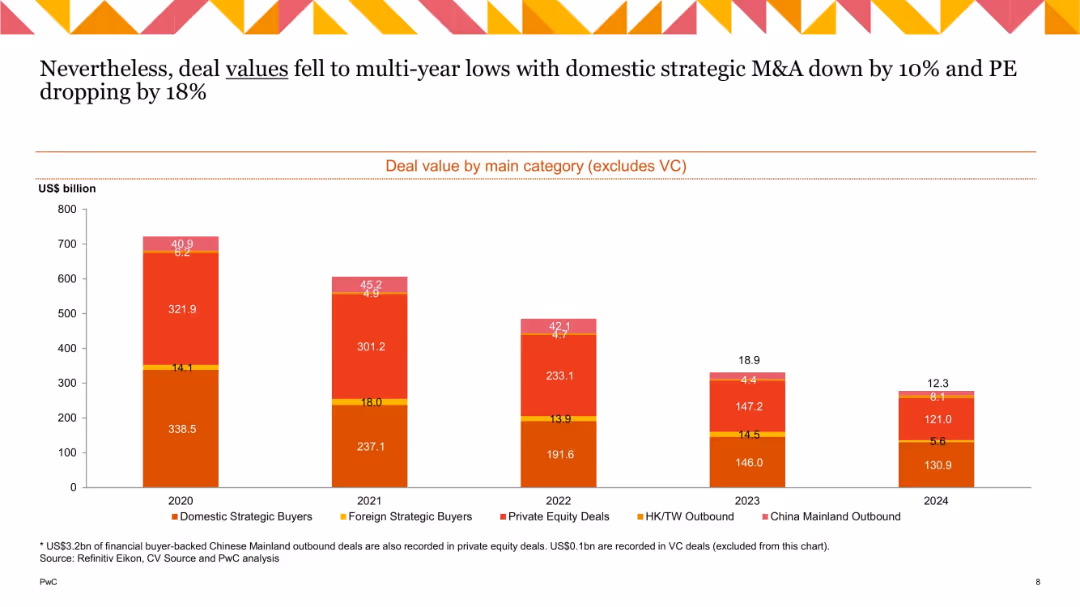
Financial Performance
Financial Services
Multiple Chart
JP Morgan
Add to my slides
Remove from favorites
Stacked bar chart (2020–2024) segmented by M&A category; muted red, orange, and yellow colors; value axis on left.
Strategic Planning
Financial Services
Shows the composition of M&A deal value across categories excluding venture capital. Domestic strategic and PE deals saw a significant decline in 2023–24, with PE dropping 18%. Foreign strategic and outbound activity remains limited.
M&A categories, PE, strategic buyers, outbound deals, 2024, deal value
false
Strategic Planning
Financial Services
Single Chart
PwC/Strategy&
Add to my slides
Remove from favorites
The slide features a scatter plot with bubbles of various sizes and colors representing different industries and use cases. The axes show 'Volume' of data and 'Impact score' of machine learning applications.
Industry Overview
Technology & Software
This slide analyzes the potential impact of machine learning across various industries like healthcare, consumer goods, and energy, highlighting areas with higher data volumes and impact scores.
Machine Learning, Industries, Data Volume, Impact, Visualization
false
Industry Overview
Technology & Software
Single Chart
McKinsey
Add to my slides
Remove from favorites
Previous
Next
You don't have any favorites yet.
Please wait loading your favorites slides...
Create a FREE account to continue browsing
Receive Instant Access to 1,000+ slides from companies like McKinsey, Google, and Goldman Sachs
First Name
Last Name
Email
Password
I agree to all
Terms & Privacy Policy
Thank you! Your submission has been received!
Oops! Something went wrong while submitting the form.
Have an account?
Sign in
Upgrade to PRO to Save slides
Advanced Search and Filters
Access to 15,000+ slides
Access to Category Pages
Save/Bookmark Slides
PowerPoint Template Library
Pick a Plan
MONTHLY
$12/month
Billed every month, Cancel anytime.
YEARLY
$9/year
Billed $108 annually, Cancel anytime.
Checkout for $12/month
Checkout for $108/yr
Secured by Stripe | AES-256 bit encryption