My Account
My Slides
Search by Category
Pricing
Templates
View All Templates
Download Template Slides
✦ AI Search
Feedback
Login
Logout
Get Started
Browse all Slides
Browse all Slides
Create a FREE Account
Instant access to 1,000+ real slides from top companies like McKinsey, BCG, Goldman Sachs, Google and many more!
First Name
Last Name
Email
Password
I agree to all
Terms & Privacy Policy
Thank you! Your submission has been received!
Oops! Something went wrong while submitting the form.
Have an account?
Sign in
Saved Slides
Total No. of slides saved
0
↻ Refresh
✖ Clear all
Two columns with icons and text detailing inefficiencies in the value chain for the machinery and equipment sector, focusing on production and end-of-life stages.
Operational Efficiency
Industrial & Manufacturing
Discusses inefficiencies specifically in the machinery and equipment sector, identifying areas for improvement at different stages of the value chain. The slide provides insights into how companies can optimize production and extend the life cycle of machinery and equipment.
machinery, inefficiencies, value chain, optimization, production
false
Operational Efficiency
Industrial & Manufacturing
Header Vertical
Accenture
Add to my slides
Remove from favorites
Slide features three main columns: Key Opportunities, Enablers, and Examples, with icons and bullet points under each. There are references at the bottom with index numbers.
Operational Efficiency
Industrial & Manufacturing
Focuses on strategies to enhance machinery repairability and use of unutilized capacity in the industry, highlighting case studies and strategic enablers like R&D investments.
machinery, repairability, capacity, R&D, sustainability
false
Operational Efficiency
Industrial & Manufacturing
Table
Accenture
Add to my slides
Remove from favorites
This slide visually separates Macquarie's business activities into annuity-style and markets-facing activities, each with its net profit contribution. The information is presented using colored sections, clear text hierarchy, and minimal icons. The design is clean, focused, and easy to follow.
Financial Performance
Financial Services
The slide offers an overview of Macquarie's business divisions and their contributions to net profit, illustrating the company's diversified revenue streams. It can be used to convey Macquarie’s business model and profitability across various sectors, crucial for investor and stakeholder presentations.
Macquarie, business overview, net profit contribution, annuity-style activities, markets-facing activities, revenue streams, financial services
false
Financial Performance
Financial Services
Multiple Chart
Morgan Stanley
Add to my slides
Remove from favorites
The slide presents a column chart illustrating the division of capital across different factors, with negative impacts represented in gray and positive in blue. A summary box on the right provides context with key drivers in bulleted form. The design is simple yet informative.
Financial Performance
Financial Services
Analyzes financial results for Macquarie Capital, including areas such as investment-related income and credit impairments, suited for discussions on capital allocation, financial strategy, and performance evaluation in the financial sector.
Macquarie Capital, financial results, investment income, credit, performance evaluation, financial strategy
false
Financial Performance
Financial Services
Mixed Chart
Goldman Sachs
Add to my slides
Remove from favorites
The slide combines text blocks with visual elements such as icons and images. A large world map in the background ties into the global theme, and text sections are well defined with bullet points and subheadings.
Strategic Planning
Financial Services
Highlighting the strategic initiatives and achievements of Macquarie Capital, the slide encapsulates key financial contributions and significant deals. It showcases the division's global reach and expertise in various market segments, with an emphasis on infrastructure and energy project development.
macquarie capital, strategic, global, investment, infrastructure, energy, finance, deals
false
Strategic Planning
Financial Services
Mixed Chart
Morgan Stanley
Add to my slides
Remove from favorites
The slide combines text and graphics with a two-column layout. The left side features a segmented bar chart depicting company divisions and their contributions, while the right side shows a global presence map with data points.
Industry Overview
Financial Services
Providing an overview of Macquarie's business divisions, global presence, and key statistics, this slide is useful for investors, clients, or stakeholders needing a comprehensive introduction to the company's scope and scale.
Macquarie, Global Presence, Financial Services, Asset Management, Market Share
false
Industry Overview
Financial Services
Mixed Chart
Goldman Sachs
Add to my slides
Remove from favorites
The slide presents bullet points of recent global events, alongside comparative graphs for equity markets, credit spreads, and bond yields with a simple blue and white layout.
Market Analysis and Trends
Financial Services
Discussing recent macroeconomic events and their impact on financial markets, this slide provides an overview of market conditions. It's intended to give stakeholders an understanding of external factors influencing market performance, including geopolitical events and economic indicators.
macroeconomic, equity markets, credit spreads, bond yields
false
Market Analysis and Trends
Financial Services
Mixed Chart
Goldman Sachs
Add to my slides
Remove from favorites
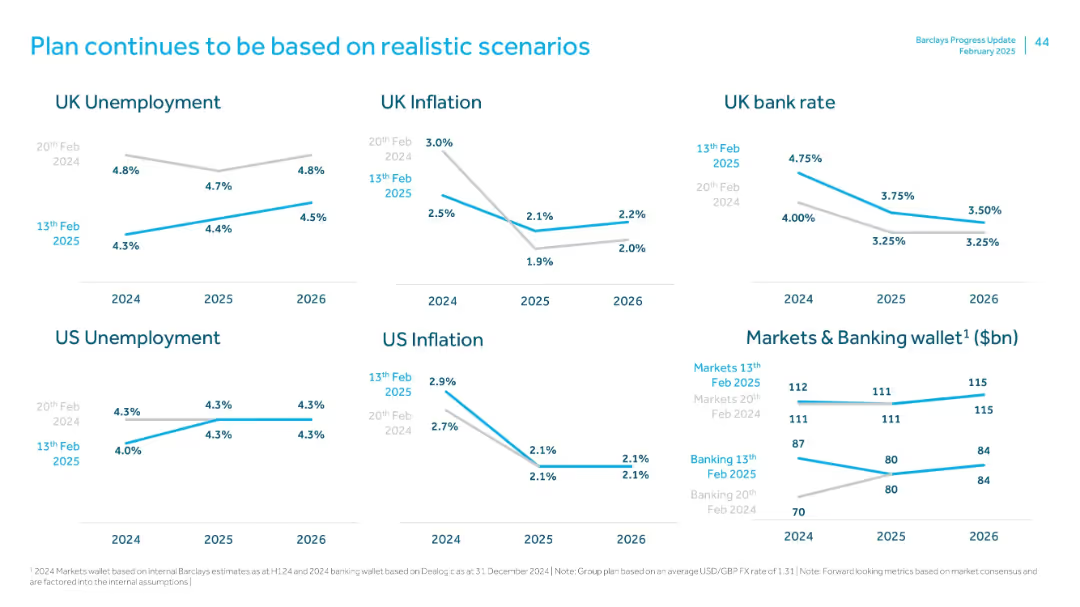
Grid of line charts forecasting UK/US macroeconomic indicators (unemployment, inflation, bank rate) and market wallet size.
Strategic Planning
Financial Services
Provides Barclays' forward-looking assumptions for 2024–2026. Covers UK and US economic indicators (inflation, unemployment, bank rates) and estimated market/banking wallet sizes. Compares internal projections with previous year benchmarks.
macroeconomic forecast, inflation, unemployment, interest rates, banking wallet
false
Strategic Planning
Financial Services
Multiple Chart
Barclays
Add to my slides
Remove from favorites
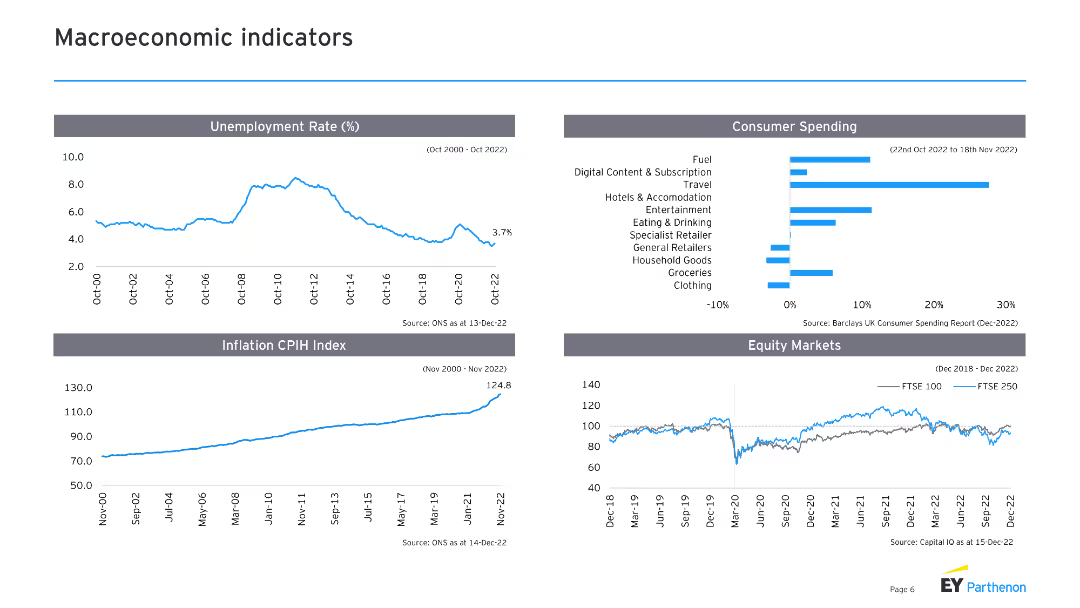
The slide includes four sections with line charts and column charts: unemployment rate, consumer spending, inflation CPIH index, and equity markets. Each chart has supporting text explaining the trends and data sources.
Market Analysis and Trends
Financial Services
This slide covers key macroeconomic indicators, including unemployment rates, consumer spending patterns, inflation trends, and equity market performance. It provides a comprehensive overview of the current economic landscape.
Macroeconomic indicators, unemployment, consumer spending, inflation, equity markets
false
Market Analysis and Trends
Financial Services
Multiple Chart
EY
Add to my slides
Remove from favorites
Contains bar charts detailing macroeconomic concerns by region.
Risk Assessment and Management
Financial Services
Analyzes executive concerns about macroeconomic factors like inflation and supply chain disruptions, with a focus on differences across North America, Europe, and Asia.
macroeconomic, inflation, supply chain, concerns, regions
false
Risk Assessment and Management
Financial Services
Multiple Chart
BCG
Add to my slides
Remove from favorites
Features a bar chart showing the top macro risk factors for investors, like 'Interest rates and US Federal Reserve policy', with color indicators showing changes from a previous survey. Green and teal color scheme.
Risk Assessment and Management
Financial Services
Assesses investor perceptions of macroeconomic risks impacting their strategies, with emphasis on the importance of Federal Reserve policies and geopolitical risks in shaping investment decisions.
macroeconomic risks, Federal Reserve, investment risk, geopolitical
false
Risk Assessment and Management
Financial Services
Single Chart
BCG
Add to my slides
Remove from favorites
This slide presents a list of macroeconomic risks as perceived by investors, with bar charts showing the significance of factors like interest rates and inflation.
Risk Assessment and Management
Financial Services
Analyzes investor perspectives on macroeconomic risks, with a primary focus on how interest rates and federal policies shape investment decisions and perceptions of risk in the financial sector.
macroeconomic risks, interest rates, investment decisions, financial sector
false
Risk Assessment and Management
Financial Services
Single Chart
BCG
Add to my slides
Remove from favorites
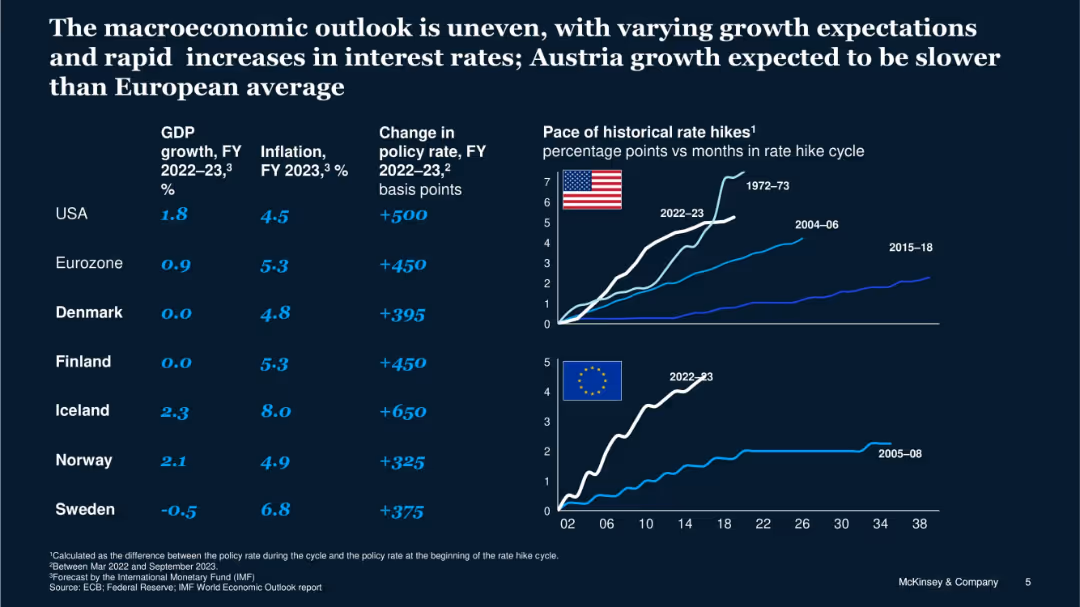
Table of macro indicators by country, and two line charts comparing interest rate hike cycles (US and EU) across decades.
Market Analysis and Trends
Financial Services
This slide reviews recent macroeconomic conditions across select economies, showing varying growth rates and inflation alongside historical policy rate hikes. It notes Austria's lagging growth and contextualizes interest rate shifts in historical perspective.
macroeconomics, growth, inflation, interest rates, rate hikes, policy, Europe, US
false
Market Analysis and Trends
Financial Services
Multiple Chart
McKinsey
Add to my slides
Remove from favorites
The slide presents a linear progression of trends and impacts in a data-driven format. Key trends and challenges are highlighted with icons and brief descriptions, each marked with a red dot. The red-to-black gradient emphasizes the flow from current trends to delayed impacts.
Risk Assessment and Management
Professional Services
This slide is utilized to describe the current macroeconomic challenges and uncertainties. It emphasizes trends like natural resource shortages, global food pricing disruption, and financial market instability, leading to potential delayed impacts such as technological disruption and geopolitical realignment.
Macro Environment, Challenges, Trends, Uncertainty, Risks, Geopolitical, Technological, Economic Slowdown
false
Risk Assessment and Management
Professional Services
Linear Flow
Bain
Add to my slides
Remove from favorites
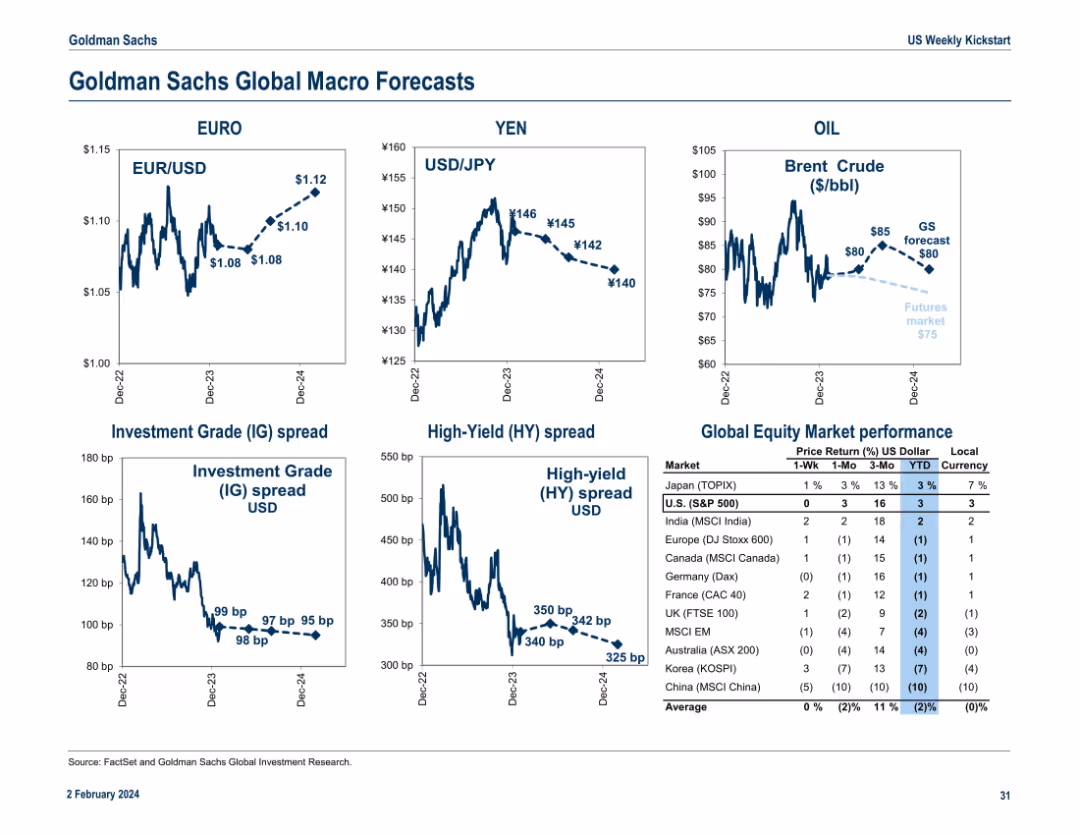
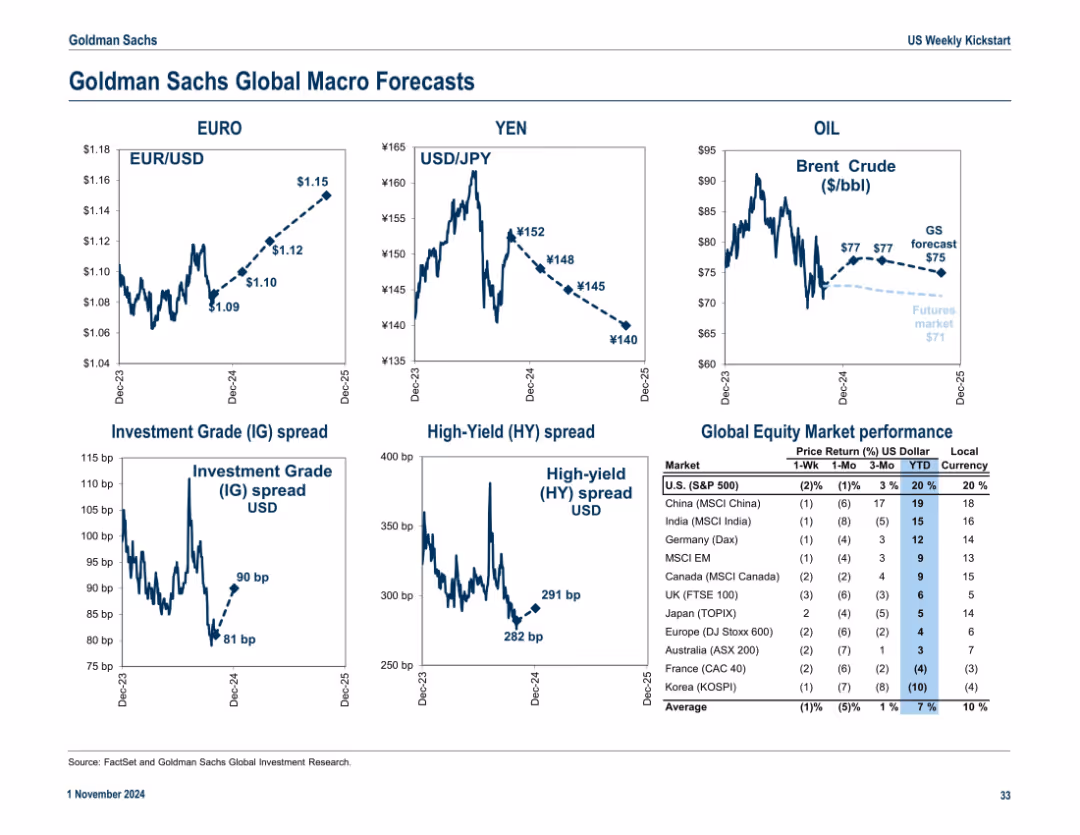
Forecast grid with six line charts (EUR/USD, USD/JPY, Oil, credit spreads) and a table summarizing global equity market performance. Predictive style with dashed trend lines.
Strategic Planning
Financial Services
This slide presents Goldman Sachs' macroeconomic forecasts for currencies, oil prices, and credit spreads. It also includes a table of equity market performance across global indices. The slide helps inform asset allocation and macro strategy planning.
macro forecast, currencies, oil, credit spreads, equity performance
false
Strategic Planning
Financial Services
Multiple Chart
Goldman Sachs
Add to my slides
Remove from favorites
3x2 grid with forecasted exchange rates, spreads, and oil prices. Table on the right shows equity market performance across global indices. Trend arrows and dotted forecast lines included.
Strategic Planning
Financial Services
This macro forecast slide projects exchange rates (EUR/USD, USD/JPY), oil prices, and credit spreads. It also ranks global equity market performance, highlighting U.S. and international returns in both local and USD terms.
macro forecast, exchange rates, oil, IG/HY spreads, global equities, market return
false
Strategic Planning
Financial Services
Multiple Chart
Goldman Sachs
Add to my slides
Remove from favorites
This slide shows a column chart assessing public opinion on reforms implemented during President Macron's second term, with detailed quotes from business leaders on the reforms' impacts.
Market Analysis and Trends
Government & Public Sector
Evaluates public and corporate opinions on various reforms implemented by President Macron, focusing on economic and social impacts, with diverse viewpoints from industry leaders.
Macron, political reforms, public opinion, France, government policy, corporate opinion, social impact, economic reforms, leadership evaluation
false
Market Analysis and Trends
Government & Public Sector
Mixed Chart
Bain
Add to my slides
Remove from favorites
A bar chart with horizontal bars showing the importance of various macro risk factors to investors, including Federal Reserve policies and inflation. Includes percentage labels and change indicators.
Risk Assessment and Management
Financial Services
Summarizes investor perspectives on critical macroeconomic risks impacting investment decisions, highlighting the prominence of interest rates, inflation, and geopolitical concerns as top factors.
macro risks, investments, inflation, Federal Reserve
false
Risk Assessment and Management
Financial Services
Single Chart
BCG
Add to my slides
Remove from favorites
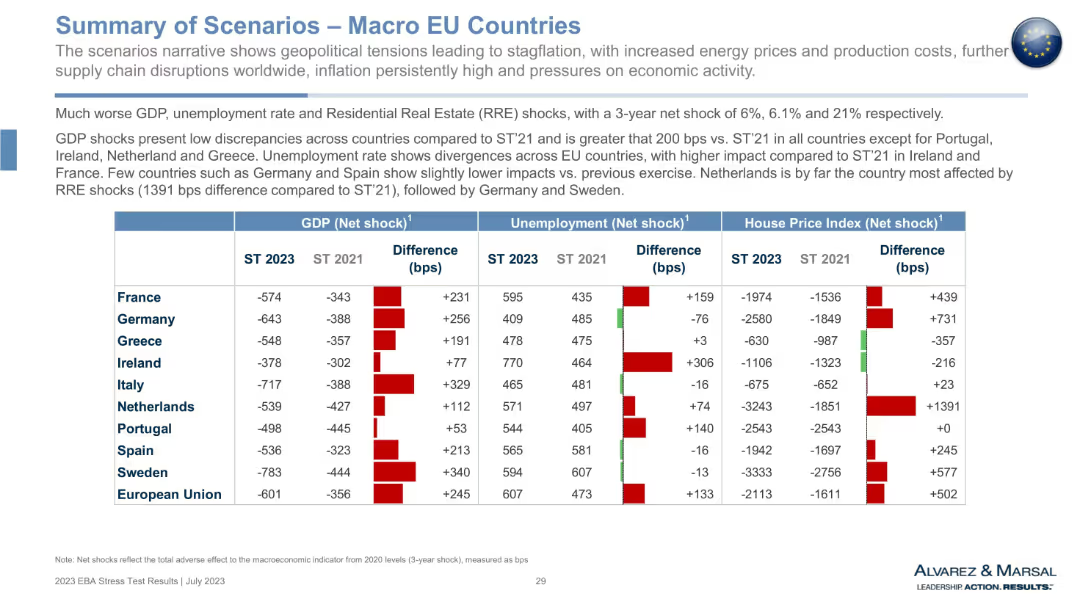
Large table with country rows and metrics columns for GDP, unemployment, and house price shocks. Red/green bar indicators show differences vs 2021.
Market Analysis and Trends
Government & Public Sector
This slide compares macroeconomic stress scenarios for EU countries in 2023 vs. 2021. It highlights GDP contraction, rising unemployment, and steep declines in house prices. Color-coded differences show the worsening of economic indicators, especially in countries like Netherlands and Sweden. It aids in evaluating systemic vulnerabilities across the EU.
macro scenarios, GDP shock, house price index, unemployment, EU economy, financial stress, comparative analysis, 2023 vs 2021
false
Market Analysis and Trends
Government & Public Sector
Mixed Chart
Alvarez & Marsal
Add to my slides
Remove from favorites
Text with three column charts showing cross-border deal volumes (outbound, inbound, and Middle East) from fiscal years 2021 to 2023.
Mergers and Acquisitions
Financial Services
Provides data on cross-border M&A deal volumes, showing outbound, inbound, and regional trends, and emphasizing the resilience of the Middle East market.
M&A, cross-border, deal volume, outbound, inbound, Middle East, fiscal, years, market
false
Mergers and Acquisitions
Financial Services
Mixed Chart
PwC/Strategy&
Add to my slides
Remove from favorites
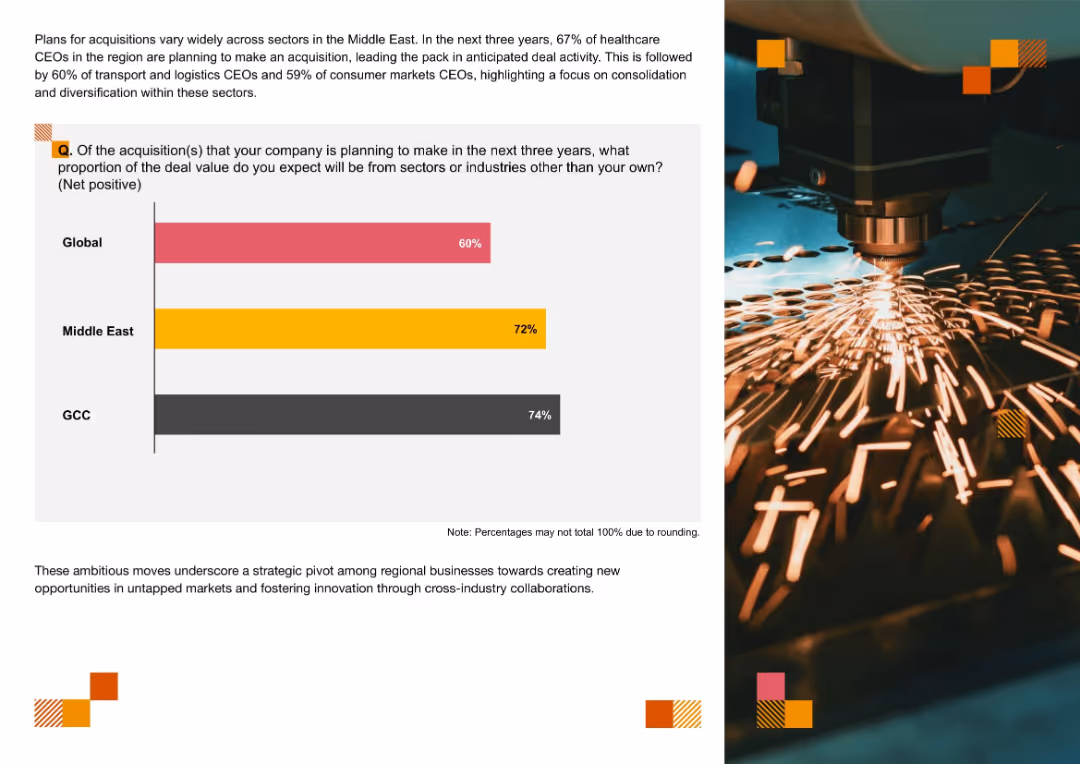
Bar chart on the left comparing anticipated cross-industry acquisition percentages globally, in the Middle East, and the GCC; right side features an image of industrial machinery and thematic visual accents.
Mergers and Acquisitions
Professional Services
The slide compares the anticipated share of cross-industry M&A deals over the next three years, with the GCC leading (74%), followed by the Middle East (72%) and Global (60%). It emphasizes a regional trend toward cross-industry diversification and innovation-driven acquisitions, especially in healthcare, logistics, and consumer markets.
M&A, cross-industry, diversification, GCC, Middle East, deal value, strategic pivot, innovation, new markets, acquisition planning
false
Mergers and Acquisitions
Professional Services
Mixed Chart
PwC/Strategy&
Add to my slides
Remove from favorites
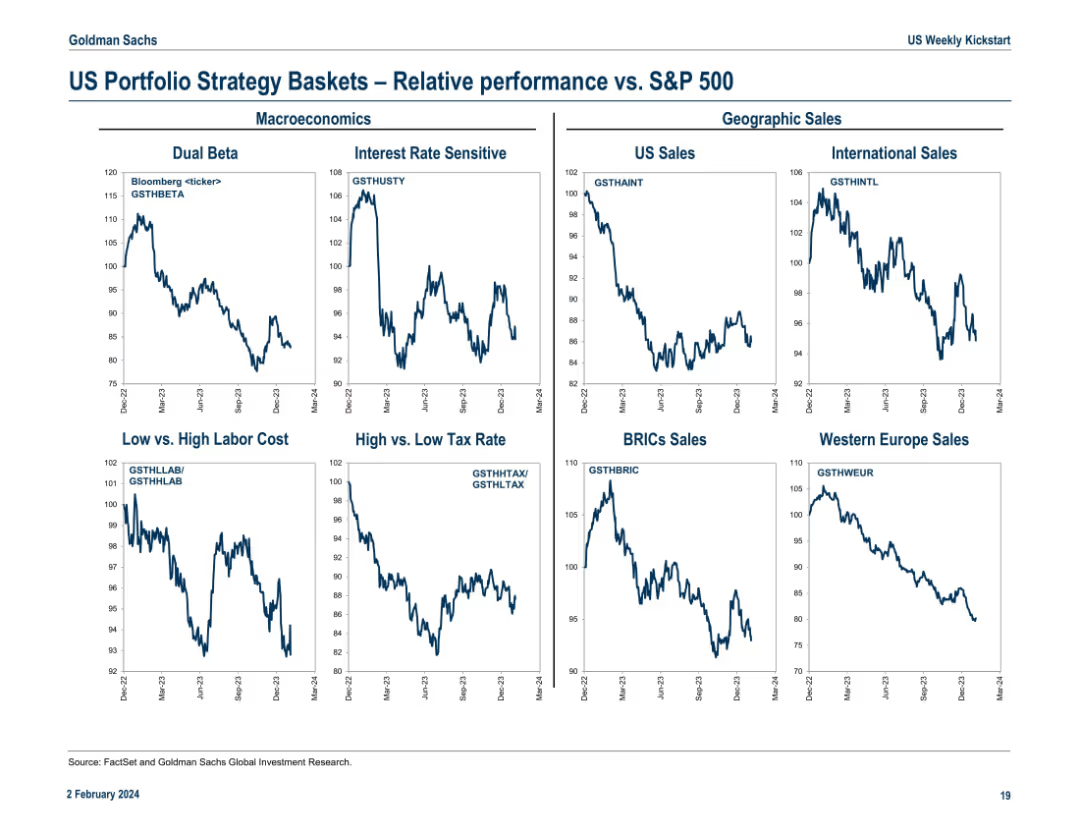
Grid layout of 8 line charts split by themes like Macroeconomics and Geographic Sales. Shows comparative trends of strategy baskets vs. S&P 500 with Bloomberg tickers labeled.
Investment Analysis
Financial Services
This slide visualizes the relative performance of strategy baskets vs. the S&P 500 across macroeconomic (e.g., dual beta, tax sensitivity) and geographic sales themes (e.g., BRICs, Western Europe). All charts use a time series format, providing clarity on how themes evolve over time and under different macroeconomic backdrops.
macro themes, geographic sales, S&P 500, relative trends, dual beta, BRICs, tax strategy, Europe sales, performance charts
false
Investment Analysis
Financial Services
Multiple Chart
Goldman Sachs
Add to my slides
Remove from favorites
Visually dramatic layout with circular stats and icons on dark purple landscape image.
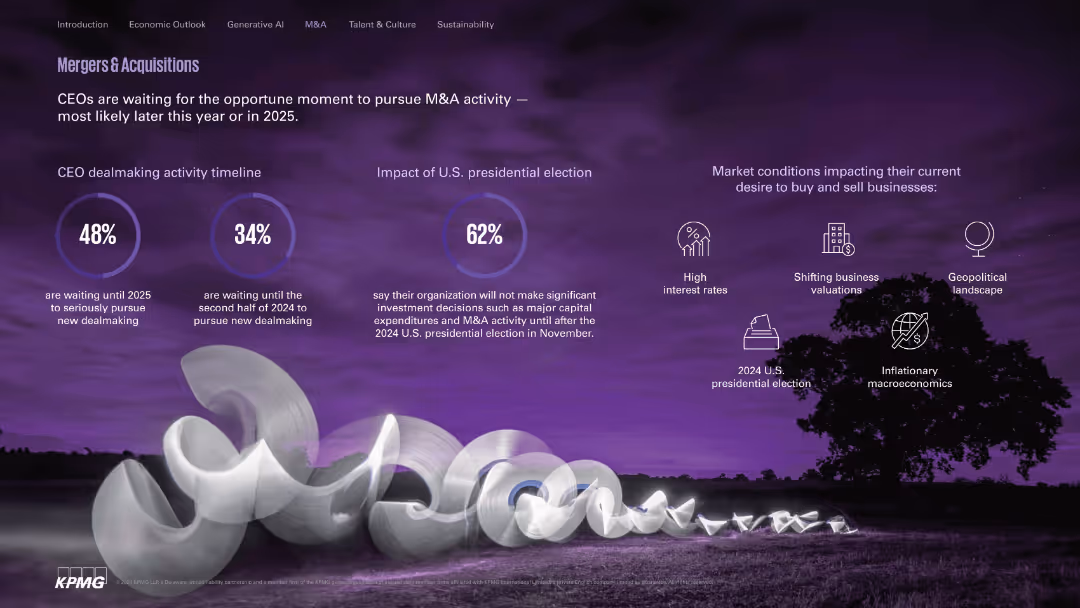
Mergers and Acquisitions
Financial Services
Outlines CEO timing for dealmaking, showing hesitancy until after the 2024 U.S. election. Identifies external factors like high interest rates and geopolitical tensions impacting M&A appetite.
M&A, dealmaking, investment timing, election, interest rates, valuations
false
Mergers and Acquisitions
Financial Services
Mixed Chart
KPMG
Add to my slides
Remove from favorites
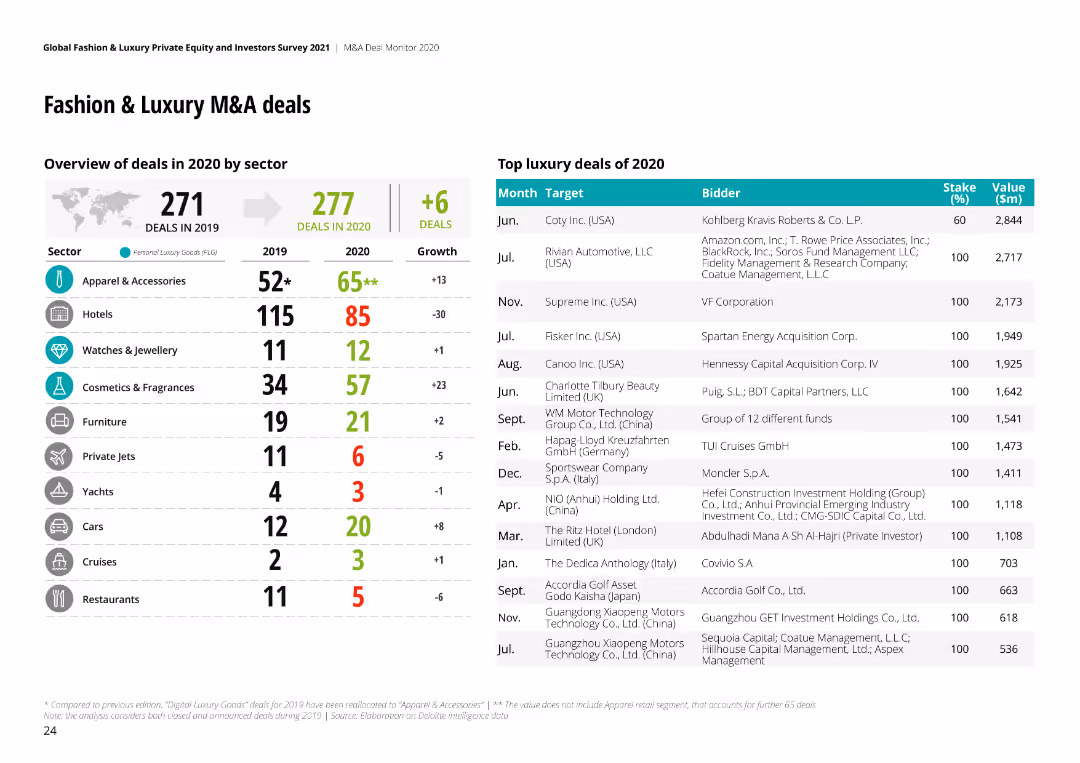
The slide has a table listing M&A deals by sector with a bar chart comparing the number of deals in 2019 and 2020.
Mergers and Acquisitions
Consumer Goods
It provides an overview of M&A deals in the fashion and luxury sector, highlighting growth and decline across various sectors.
M&A, Deals, Fashion, Luxury, Sectors, 2020, 2019
false
Mergers and Acquisitions
Consumer Goods
Header Horizontal
Deloitte
Add to my slides
Remove from favorites
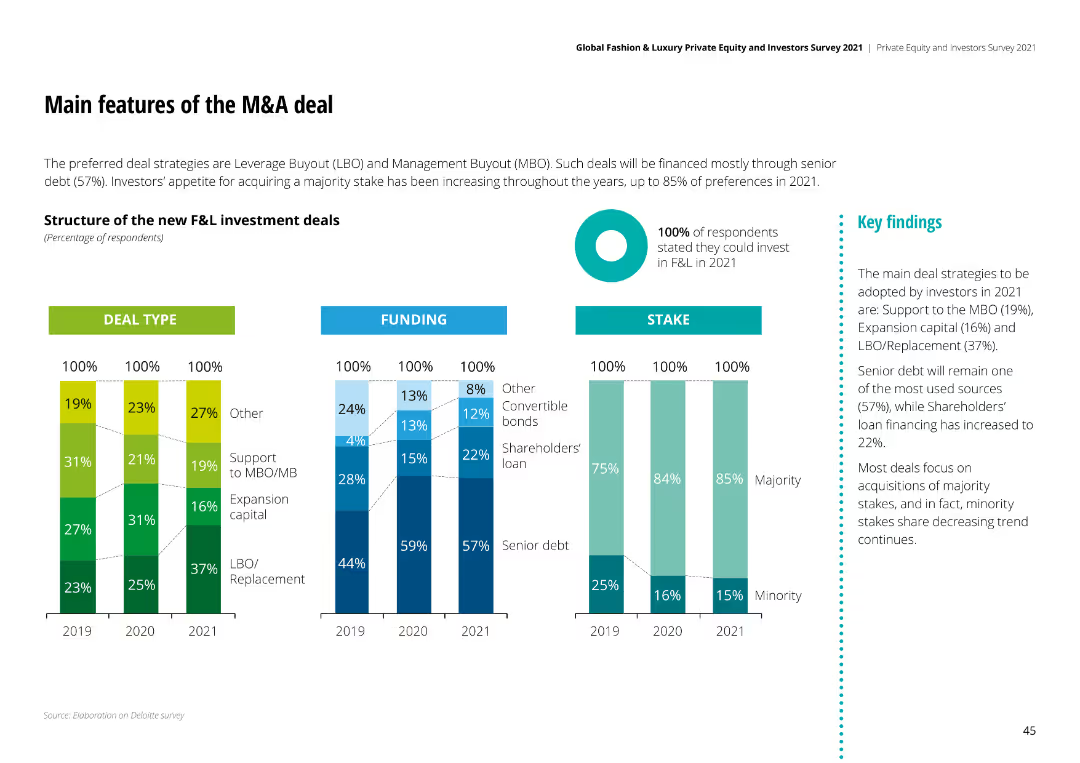
Column charts showing deal types, funding structures, and stake preferences for F&L investment deals, highlighting Leverage Buyouts and Management Buyouts.
Mergers and Acquisitions
Financial Services
Preferred deal strategies are Leverage Buyout (LBO) and Management Buyout (MBO), with senior debt being the primary funding source and majority stakes preferred.
M&A deals, investment strategies, funding structures, stake preferences, Leverage Buyouts
false
Mergers and Acquisitions
Financial Services
Multiple Chart
Deloitte
Add to my slides
Remove from favorites
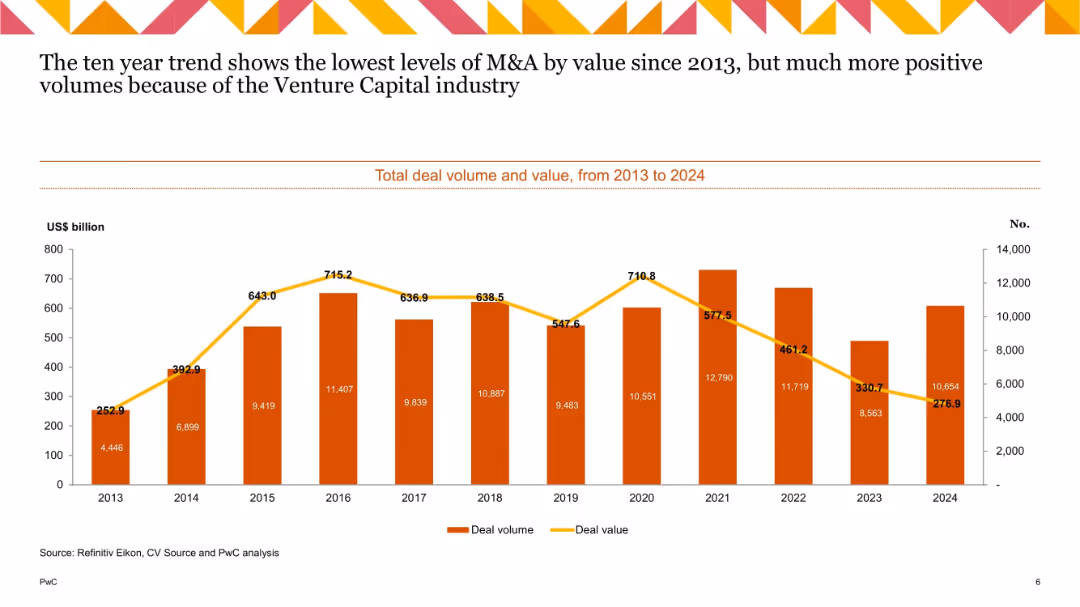
Bar and line chart with orange bars (deal volume) and a yellow line (deal value) across years; dual-axis layout; geometric border top.
Market Analysis and Trends
Financial Services
Presents a decade-long view of M&A trends, showing a steep decline in deal value despite some recovery in volumes due to venture capital activity. Highlights 2021 as a peak year and 2023–24 as low points in value.
M&A, deal volume, deal value, venture capital, trend analysis, 2024
false
Market Analysis and Trends
Financial Services
Single Chart
PwC/Strategy&
Add to my slides
Remove from favorites
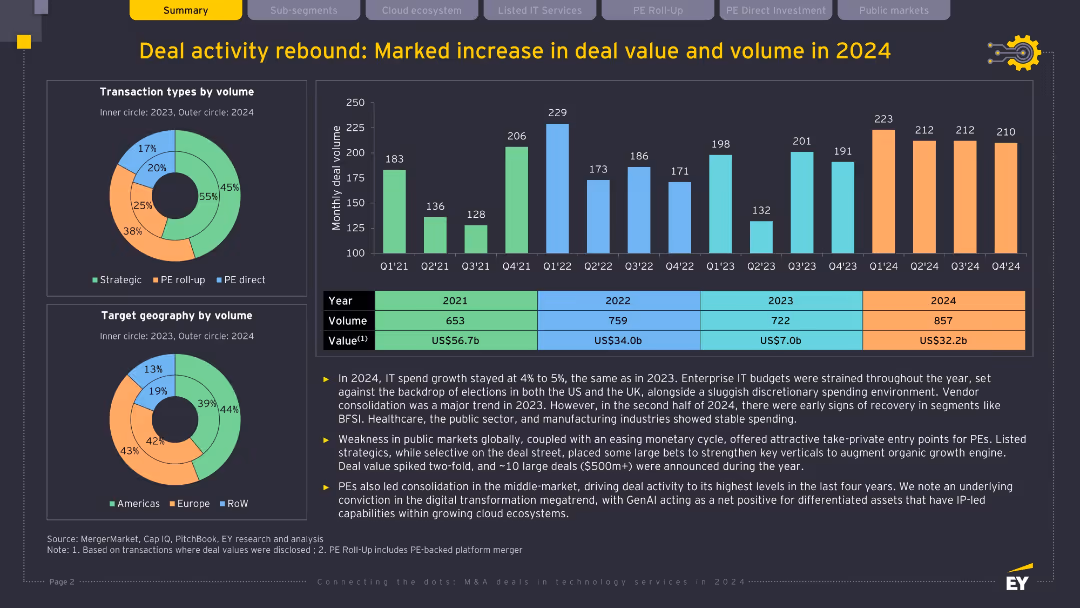
Dark background, multiple charts and tables (bar chart, donut charts, data table); yellow and turquoise highlights; visually dense with transactional and volume data.
Mergers and Acquisitions
Technology & Software
This slide details the resurgence in IT deal activity in 2024, with increases in volume and value. It attributes growth to digital transformation, GenAI-driven differentiation, and private equity-led consolidation. It presents data by deal type, geography, and monthly trends, highlighting strategic investor behavior.
M&A, deal volume, private equity, GenAI, digital transformation, IT services
false
Mergers and Acquisitions
Technology & Software
Multiple Chart
EY
Add to my slides
Remove from favorites
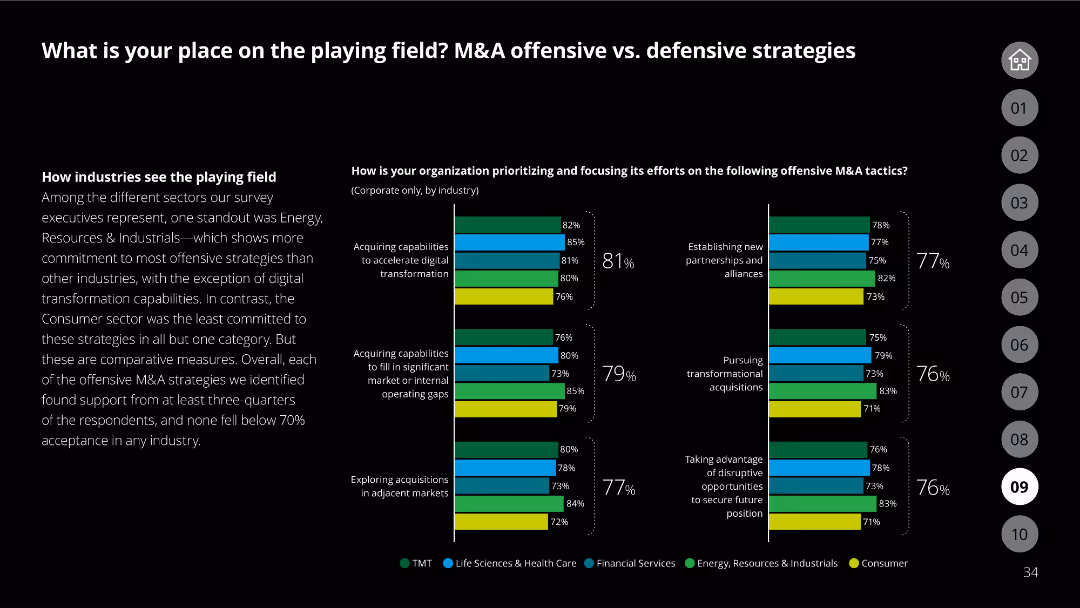
Slide with column charts detailing defensive M&A strategies by industry, focusing on aspects like cash flow and rapid turnaround situations.
Strategic Planning
Financial Services
Highlights survey results on defensive M&A strategies, showing the importance of liquidity, turnaround situations, and synergies from recent acquisitions.
M&A, defensive strategies, industry, cash flow, turnaround, synergies, survey, column chart
false
Strategic Planning
Financial Services
Multiple Chart
Deloitte
Add to my slides
Remove from favorites
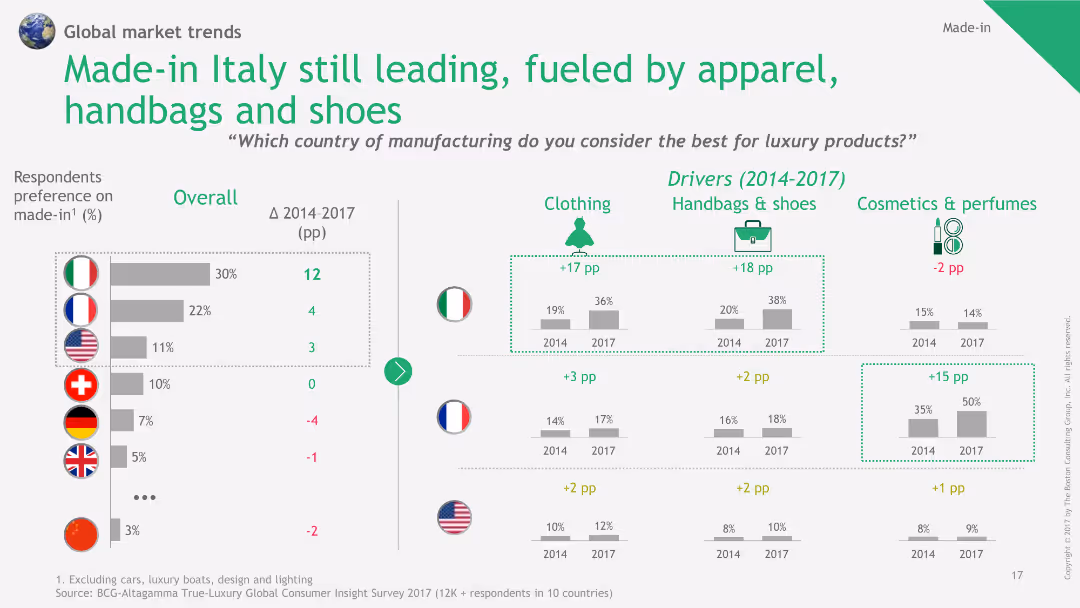
This slide features a combination of column charts and tables to show the preference for "Made-in Italy" products over time, across different product categories.
Market Analysis and Trends
Consumer Goods
The slide illustrates the leading preference for Italian-made luxury products, particularly in apparel, handbags, and shoes, supported by historical data and trends from 2014 to 2017.
Made-in Italy, luxury products, product categories, column chart, preference trends
false
Market Analysis and Trends
Consumer Goods
Multiple Chart
BCG
Add to my slides
Remove from favorites
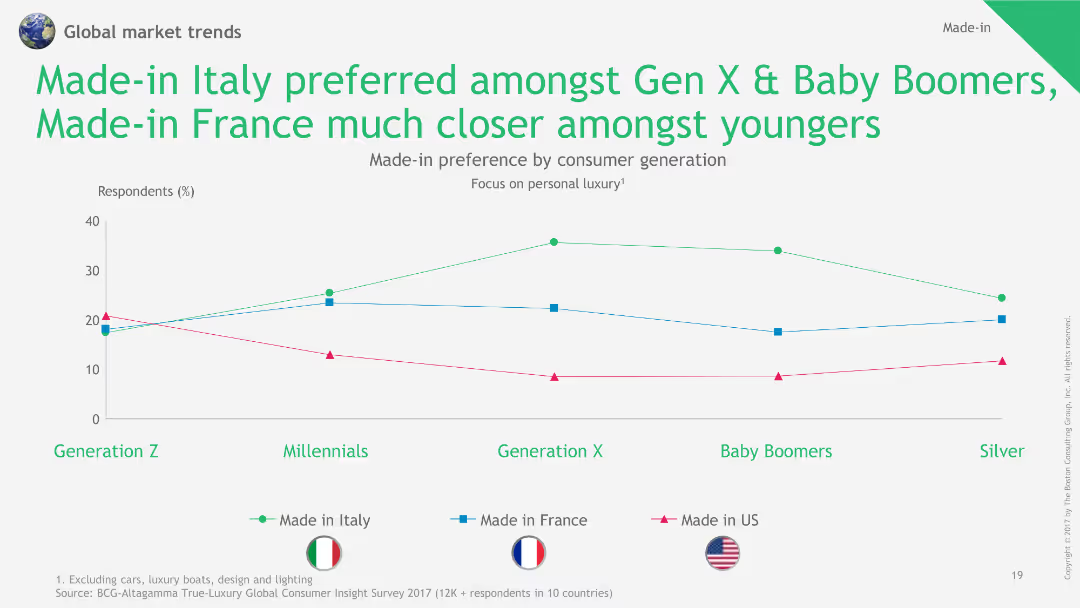
This slide features a line chart comparing preferences for Made-in Italy, Made-in France, and Made-in US products among different generations.
Market Analysis and Trends
Consumer Goods
The slide highlights generational preferences for luxury products, with Gen X and Baby Boomers favoring Italian-made items, and younger generations showing a closer preference for French-made.
Made-in Italy, Made-in France, generational preference, line chart, luxury products
false
Market Analysis and Trends
Consumer Goods
Single Chart
BCG
Add to my slides
Remove from favorites
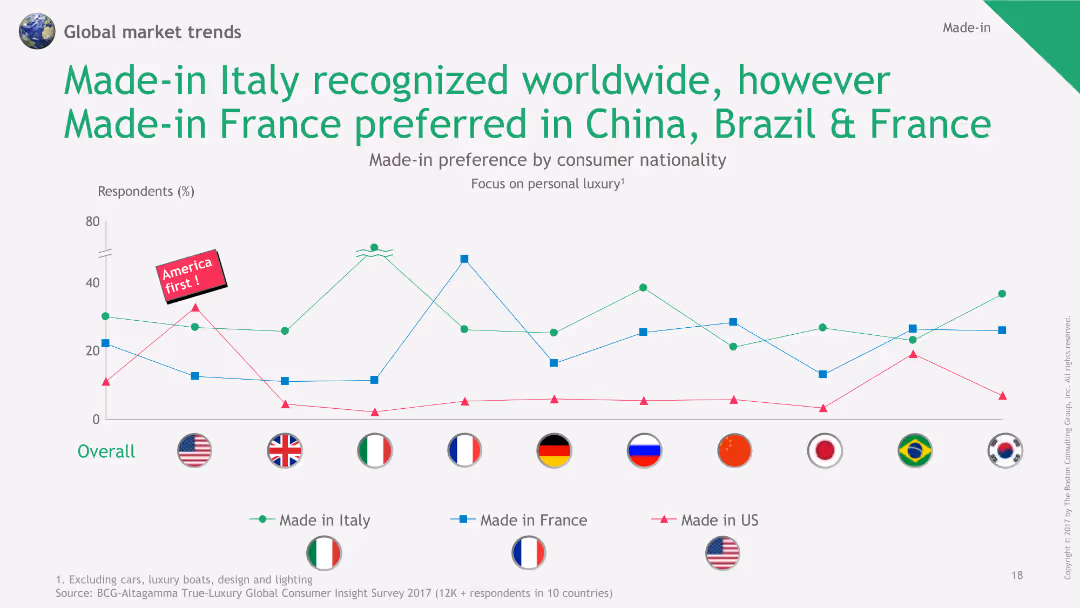
This slide includes a line chart comparing the preference for Made-in Italy, Made-in France, and Made-in US products across different nationalities, with flags for visual clarity.
Market Analysis and Trends
Consumer Goods
The slide shows the global recognition of Italian-made products, while highlighting regional preferences for French-made products in China, Brazil, and France.
Made-in Italy, Made-in France, product preference, line chart, nationality comparison
false
Market Analysis and Trends
Consumer Goods
Single Chart
BCG
Add to my slides
Remove from favorites
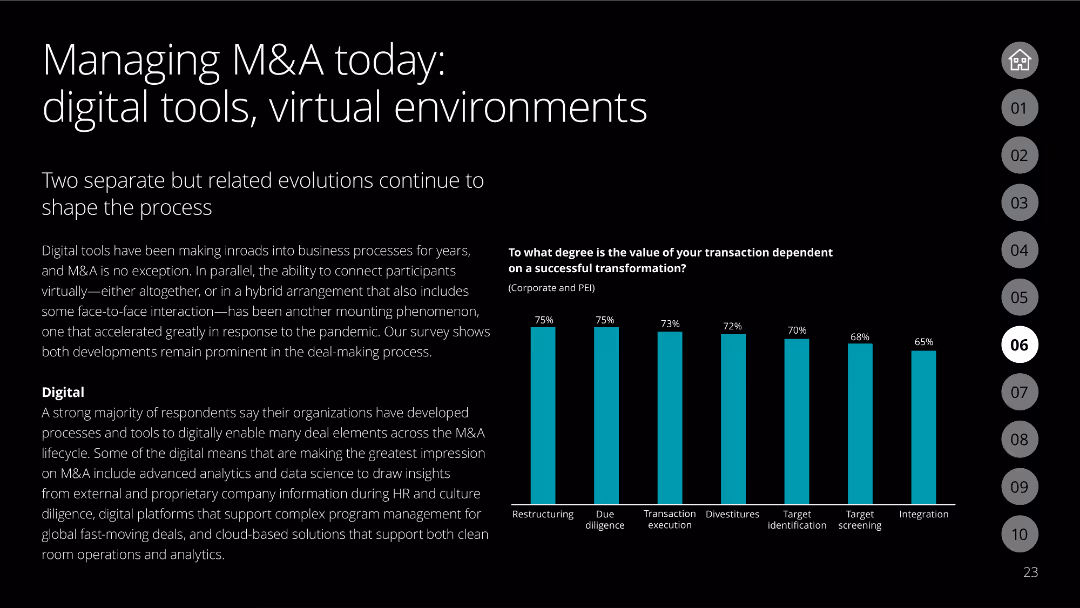
The slide contains a black background with white text, two separate sections with text and a column chart showing degrees of value dependence on successful transformation.
Mergers and Acquisitions
Financial Services
Discusses the evolution of M&A processes with the integration of digital tools and virtual environments, supported by survey data on the importance of digital and virtual interaction.
M&A, digital tools, virtual environments, survey data, transformation
false
Mergers and Acquisitions
Financial Services
Mixed Chart
Deloitte
Add to my slides
Remove from favorites
Features a comparative line graph analyzing the performance of M&A deals during weak and strong economic conditions.
Mergers and Acquisitions
Financial Services
Compares the outcomes of mergers and acquisitions during different economic conditions, highlighting the superior performance of deals made during economic downturns.
M&A, economic conditions, downturns, performance, comparative analysis
false
Mergers and Acquisitions
Financial Services
Single Chart
BCG
Add to my slides
Remove from favorites
This slide displays a column chart with four bars representing completed M&A activity in emerging private education markets from 2002 to 2013, labeled with "n" numbers indicating the count of deals. There's a title at the top and a table below showing global deals totals.
Investment Analysis
Education & Training
The slide is used to present M&A activity trends in Asian education, highlighting a substantial increase in completed deals over four specified periods, from 2002-2004 to 2011-2013. The upward trend suggests growing investor interest in the sector.
M&A, Education, Asia, Trend, Increase, Deals, Private, Investor Participation, Exponential, Decade
false
Investment Analysis
Education & Training
Single Chart
EY
Add to my slides
Remove from favorites
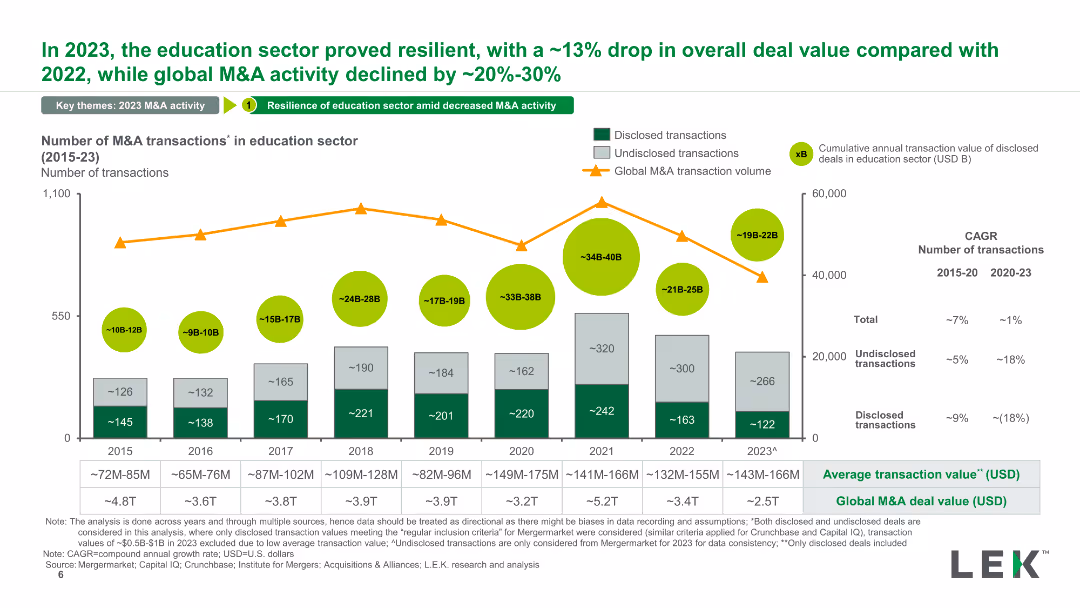
A column chart depicting the number of M&A transactions in the education sector from 2015 to 2023. It includes disclosed and undisclosed transactions and an overlay of global M&A transaction volume trends. Color-coded sections highlight values.
Mergers and Acquisitions
Education & Training
The slide analyzes the trend in M&A transactions within the education sector, showing resilience in 2023 compared to the global decline. It highlights transaction values and provides cumulative annual transaction data for disclosed deals.
M&A, education sector, transactions, disclosed, global trend
false
Mergers and Acquisitions
Education & Training
Mixed Chart
LEK
Add to my slides
Remove from favorites
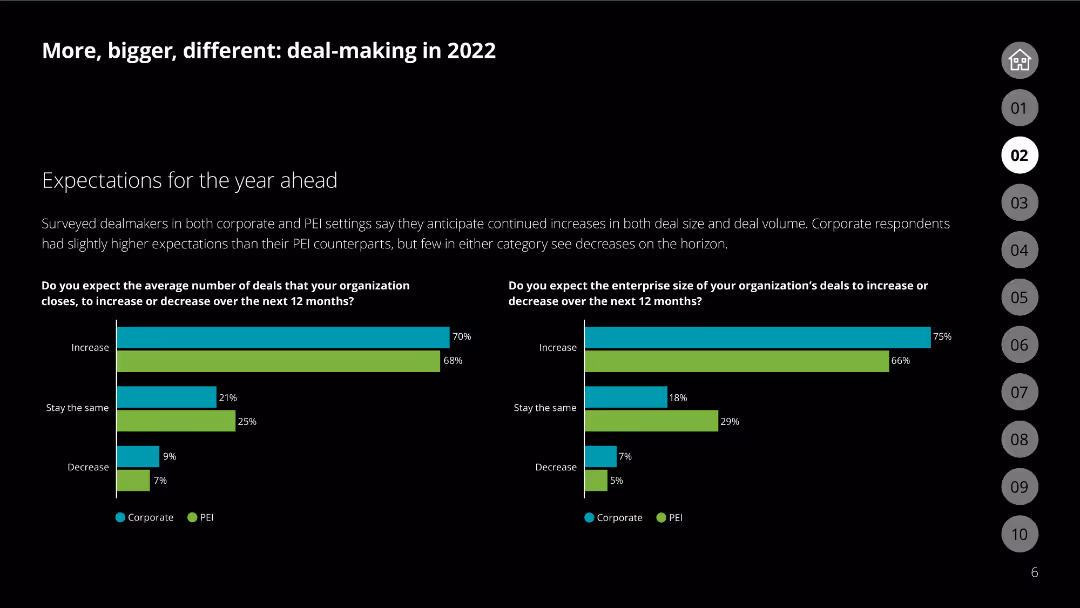
Column charts comparing corporate and PEI settings on expected number and size of deals
Mergers and Acquisitions
Financial Services
Forecasts increased deal activity and enterprise size in the coming year, based on expectations from corporate and PEI respondents.
M&A, expectations, deals, corporate, PEI
false
Mergers and Acquisitions
Financial Services
Multiple Chart
Deloitte
Add to my slides
Remove from favorites
Slide includes two pie charts and a column chart, contrasting the perceptions of value creation with actual outcomes in M&A transactions. It also details factors contributing to the failure of achieving the expected synergies, like integration and due diligence issues.
Mergers and Acquisitions
Financial Services
Explores the common pitfalls in M&A transactions that lead to failure in achieving expected outcomes, focusing on integration challenges and discrepancies in perceived versus actual value.
M&A, Failures, Value, Integration, Due Diligence, Transactions, Challenges
false
Mergers and Acquisitions
Financial Services
Multiple Chart
Deloitte
Add to my slides
Remove from favorites
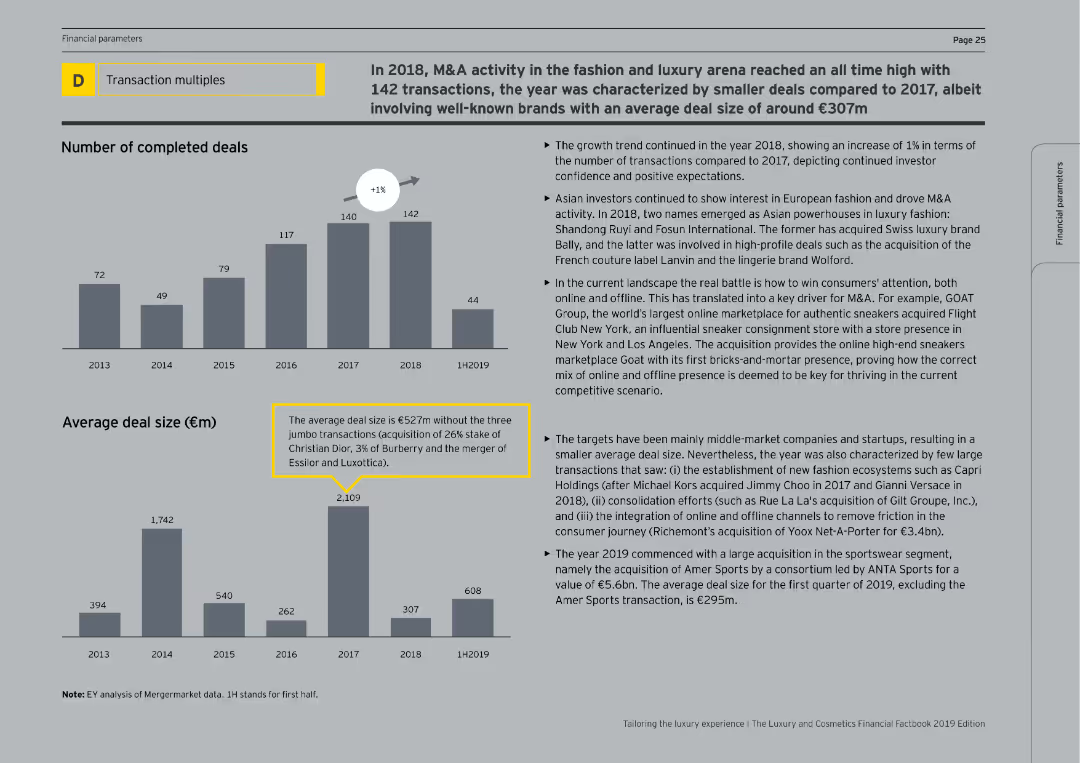
The slide includes a column chart showing the number of completed deals from 2013 to 1H2019 and average deal sizes. The text on the right provides an analysis of M&A trends, with a focus on smaller deal sizes and high-profile acquisitions.
Mergers and Acquisitions
Consumer Goods
The slide details the record-high M&A activity in 2018 within the fashion and luxury sectors, emphasizing the number of transactions, average deal sizes, and notable acquisitions. It also discusses the trends driving this activity, including the focus on smaller, high-value brands.
M&A, Fashion, Luxury, Deals, Acquisitions
false
Mergers and Acquisitions
Consumer Goods
Multiple Chart
EY
Add to my slides
Remove from favorites
Two sets of column charts show Goldman Sachs M&A Fee Share by deal size and coverage rate by client size. Annotations provide additional context about client coverage and deal segmentation.
Market Analysis and Trends
Financial Services
The slide presents data on the firm's M&A fee share across different deal sizes and its client coverage rate in Americas and EMEA. It emphasizes the uniform fee share for well-covered clients across all sizes and the potential to increase fee share by expanding client coverage, showcasing strategic market positioning and client relationship management.
M&A, Fee Share, Client Coverage, Deal Size, Strategy, Market Positioning
false
Market Analysis and Trends
Financial Services
Multiple Chart
Goldman Sachs
Add to my slides
Remove from favorites
Bar and patterned bar charts compare the deal values of FGA acquisitions in technology M&A, with highlights on major deals such as Google's and Facebook's acquisitions.
Mergers and Acquisitions
Technology & Software
The slide compares FGA acquisitions against overall technology M&A deal values, underscoring their relatively small proportion with emphasis on notable exceptions. Suitable for M&A trend analysis.
M&A, FGA, Technology, Deal Value, Acquisitions
false
Mergers and Acquisitions
Technology & Software
Mixed Chart
Oliver Wyman
Add to my slides
Remove from favorites
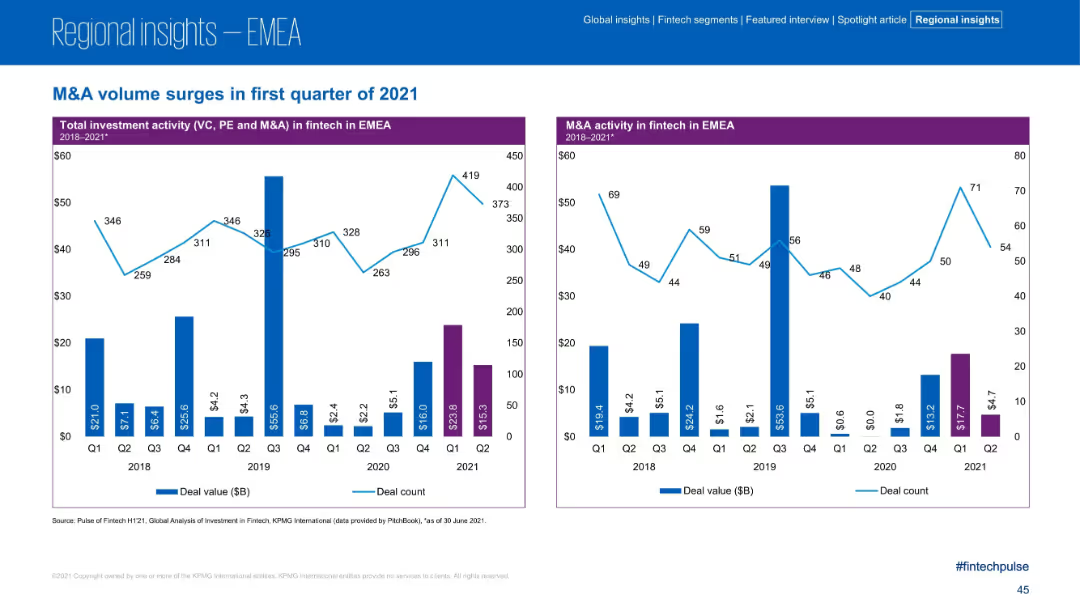
Two-panel bar and line chart layout; left chart covers total investment activity (VC, PE, M&A); right chart focuses on M&A activity; consistent blue and purple color scheme; simple data visuals.
Strategic Planning
Financial Services
The slide showcases the surge in fintech M&A activity in the EMEA region during Q1 2021, with strong increases in both deal value and count. It provides quarterly trend data from 2018–2021 for total investment and M&A-specific metrics, highlighting Q1 2021 as a peak period.
M&A, Fintech, EMEA, Investment, Deal Value, Deal Count, Q1 2021, Trends, PE, VC
false
Strategic Planning
Financial Services
Multiple Chart
KPMG
Add to my slides
Remove from favorites
The slide has high visual complexity with multiple bar graphs, data points, and text blocks. It provides a comprehensive analysis of M&A trends and expectations in the process automation sector over the next few years.
Technology and Digital Transformation
Industrial & Manufacturing
This slide forecasts increased M&A activity in process automation, emphasizing the strategic and financial interests driving these trends. It provides a detailed analysis of the market, including expected investment levels and the sectors most likely to see activity, underscoring the ongoing demand for innovative process automation solutions in a post-COVID-19 economy.
M&A forecasting, Process automation trends, Market analysis, Investment interest
false
Technology and Digital Transformation
Industrial & Manufacturing
Multiple Chart
LEK
Add to my slides
Remove from favorites
Magic Quadrant chart positioning various vendors in the API management space, with honorable mentions listed for non-gateway-centric and service mesh providers, such as Ambassador Labs and Gravitee.
Competitive Landscape
Technology & Software
The slide displays the competitive landscape of API management vendors in a Magic Quadrant, identifying leaders like Salesforce and Google, and honorable mentions for other significant contributors.
Magic Quadrant, API management, vendors, competitive
false
Competitive Landscape
Technology & Software
Mixed Chart
Gartner
Add to my slides
Remove from favorites
A combination of text and column charts showing global M&A volume, control premium, and deal statistics for 2023.
Financial Performance
Financial Services
Summarizes key statistics of global M&A activity in 2023, highlighting volumes, premiums, and major deals.
M&A, global highlights, key stats, 2023, volume, control premium, deals, statistics, summary
false
Financial Performance
Financial Services
Multiple Chart
JP Morgan
Add to my slides
Remove from favorites
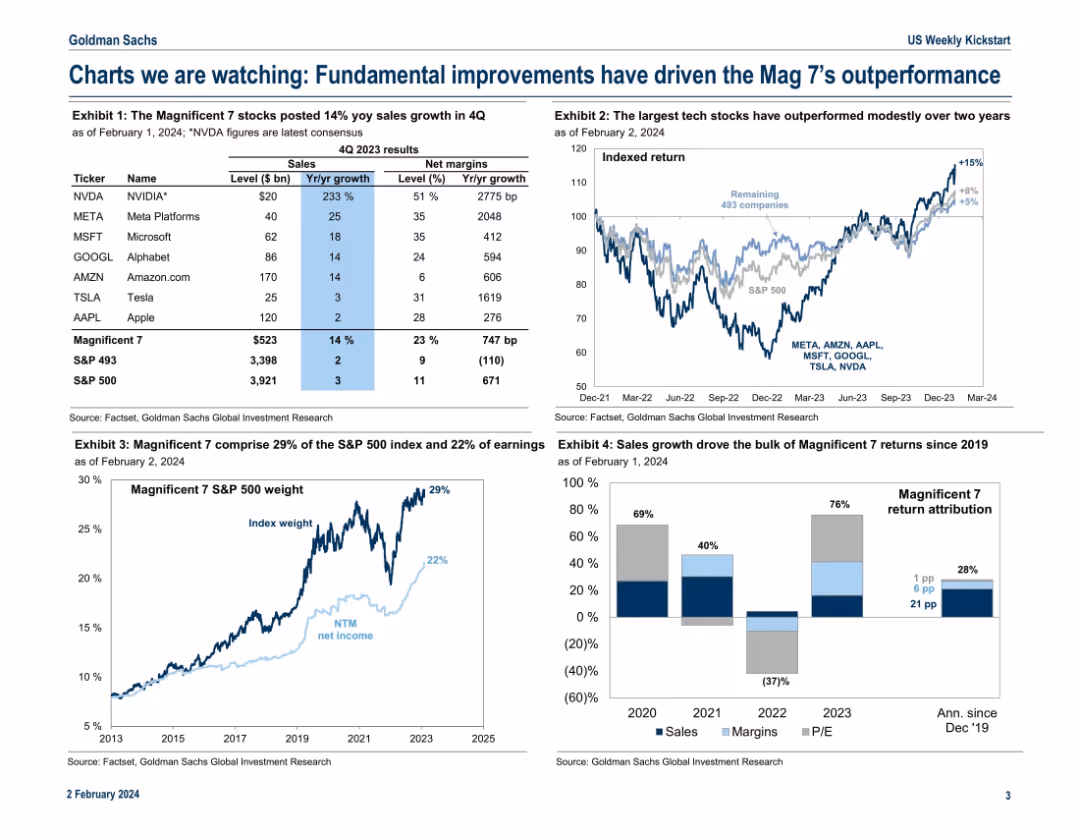
Grid layout of four exhibits; includes tables, line charts, and stacked bar charts to highlight performance and earnings contribution of the “Magnificent 7”.
Performance Metrics and KPIs
Technology & Software
The slide analyzes the top 7 tech-driven companies in the S&P 500, showing their sales growth, net margins, stock returns, and contribution to index weight and earnings. It emphasizes their outperformance and attributes it to fundamentals like revenue growth, with comparisons to the broader index.
Magnificent 7, sales growth, net margins, S&P 500, tech stocks, index weight, earnings, performance
false
Performance Metrics and KPIs
Technology & Software
Multiple Chart
Goldman Sachs
Add to my slides
Remove from favorites
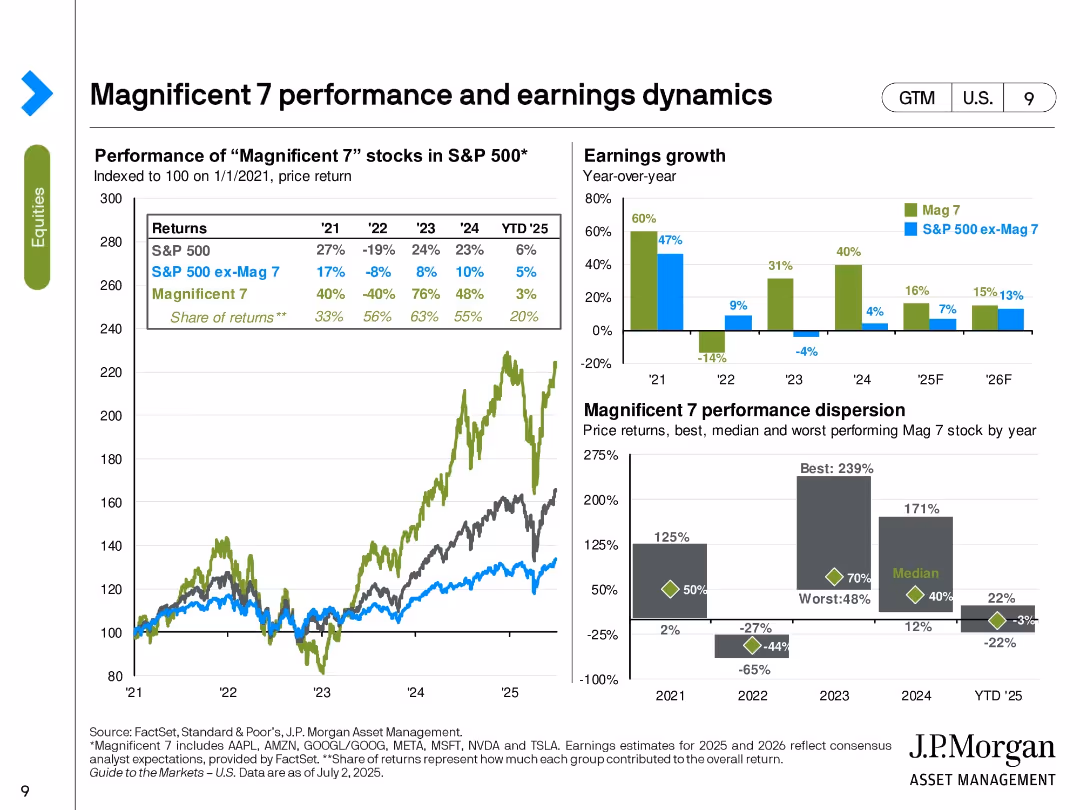
Multi-panel chart: left shows price return since 2021, top right shows earnings growth, bottom right shows performance dispersion of Magnificent 7.
Performance Metrics and KPIs
Financial Services
This slide focuses on the "Magnificent 7" tech-related stocks and their outsized contribution to S&P 500 performance. It presents comparative earnings growth, return dispersion, and the dominance of these stocks in recent years, showing they contributed 55% of 2024 S&P returns.
Magnificent 7, stock returns, earnings growth, S&P 500, dispersion, tech stocks, market concentration, valuation
false
Performance Metrics and KPIs
Financial Services
Multiple Chart
JP Morgan
Add to my slides
Remove from favorites
Heatmap table format showing relative stock weightings across years; color-coded cells from green (overweight) to red (underweight)
Product and Service Analysis
Financial Services
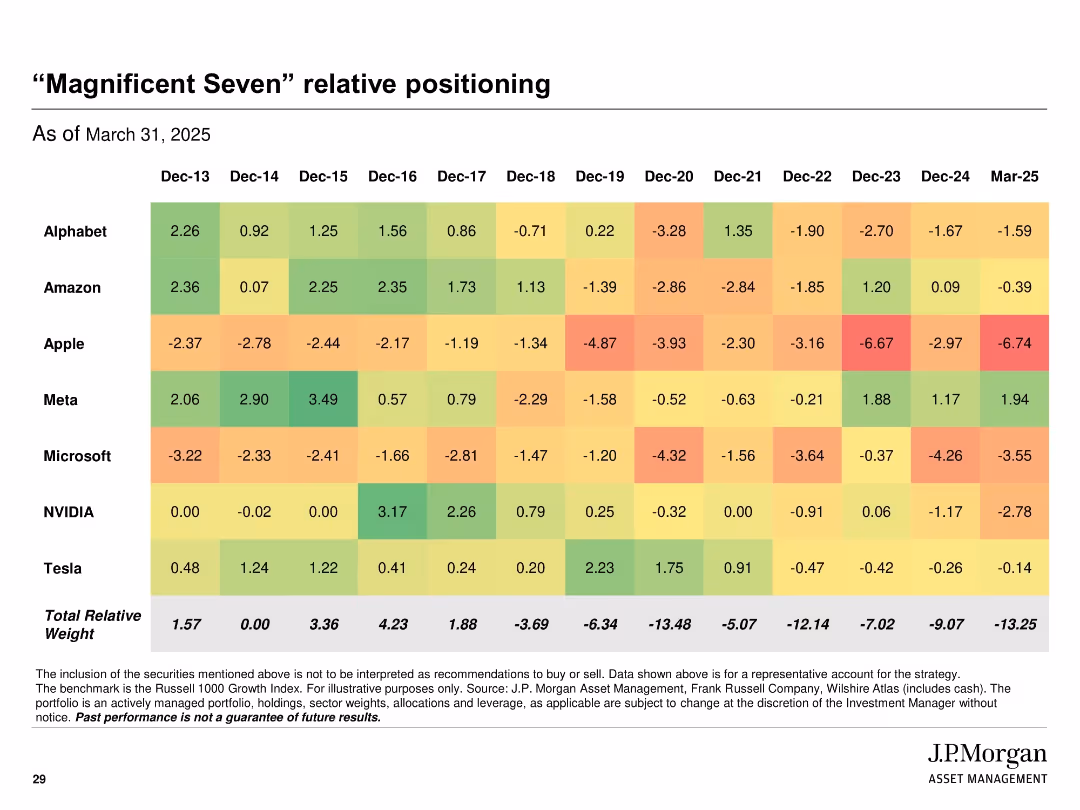
Displays the strategy's relative positioning in key large-cap tech names ("Magnificent Seven") over time, from 2013 to 2025. The chart tracks year-by-year portfolio weight differences versus benchmark, providing insights into historical and current exposure trends.
magnificent seven, tech stocks, relative weight, heatmap, positioning, strategy, J.P. Morgan
false
Product and Service Analysis
Financial Services
Single Chart
JP Morgan
Add to my slides
Remove from favorites
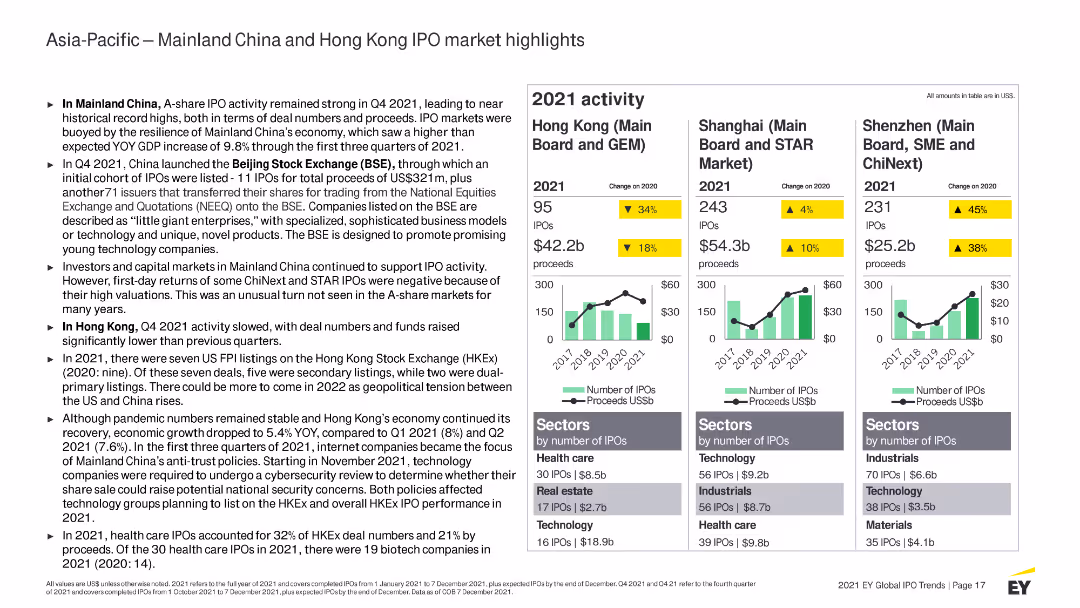
This slide includes column charts, data tables, and text sections with highlighted key statistics. Uses green and yellow to indicate changes and comparisons.
Market Analysis and Trends
Financial Services
Highlights IPO activities and performance in Mainland China and Hong Kong for 2021, covering specific exchanges and sectors with detailed figures and analysis.
Mainland China, Hong Kong, IPO, 2021 activity, market highlights, stock exchanges, sectors, proceeds, Beijing Stock Exchange, performance
false
Market Analysis and Trends
Financial Services
Multiple Chart
EY
Add to my slides
Remove from favorites
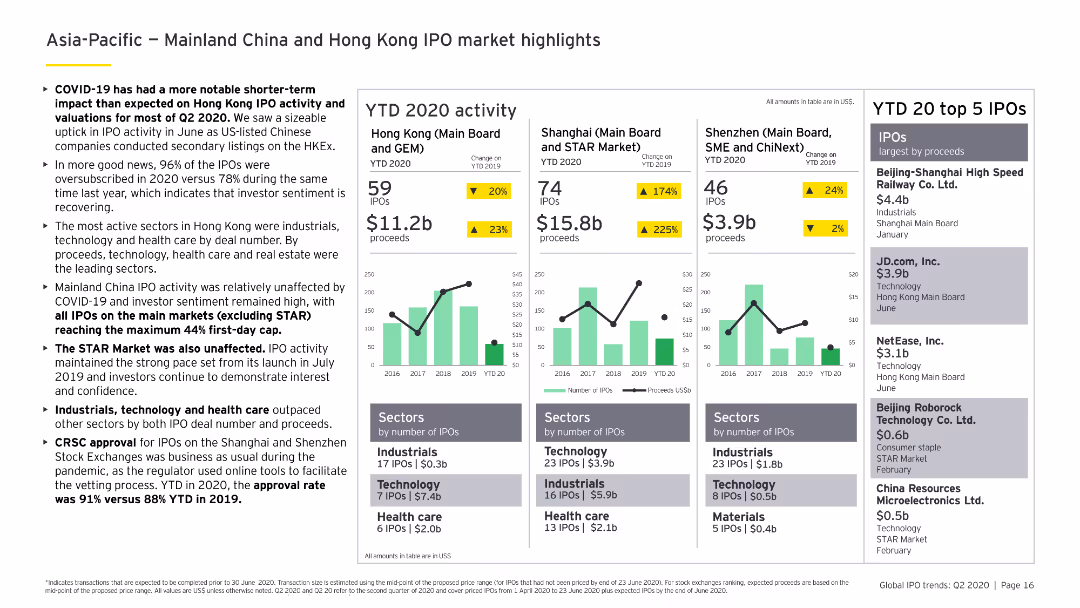
Contains column charts and bar charts showing IPO activities in Hong Kong, Shanghai, Shenzhen, and notable top 5 IPOs by proceeds.
Market Analysis and Trends
Financial Services
Highlights the IPO market trends in Mainland China and Hong Kong, with detailed data on leading stock exchanges, sectors, and top IPOs by proceeds.
Mainland China, Hong Kong, IPO highlights, stock exchanges, sectors
false
Market Analysis and Trends
Financial Services
Multiple Chart
EY
Add to my slides
Remove from favorites
Column charts and tables are used to display IPO numbers and proceeds for Mainland China and Hong Kong stock exchanges.
Market Analysis and Trends
Financial Services
The slide highlights key IPO market data for Mainland China and Hong Kong, including sector breakdowns and changes from 2021 to 2022.
Mainland China, Hong Kong, IPOs, stock exchanges, sectors
false
Market Analysis and Trends
Financial Services
Multiple Chart
EY
Add to my slides
Remove from favorites
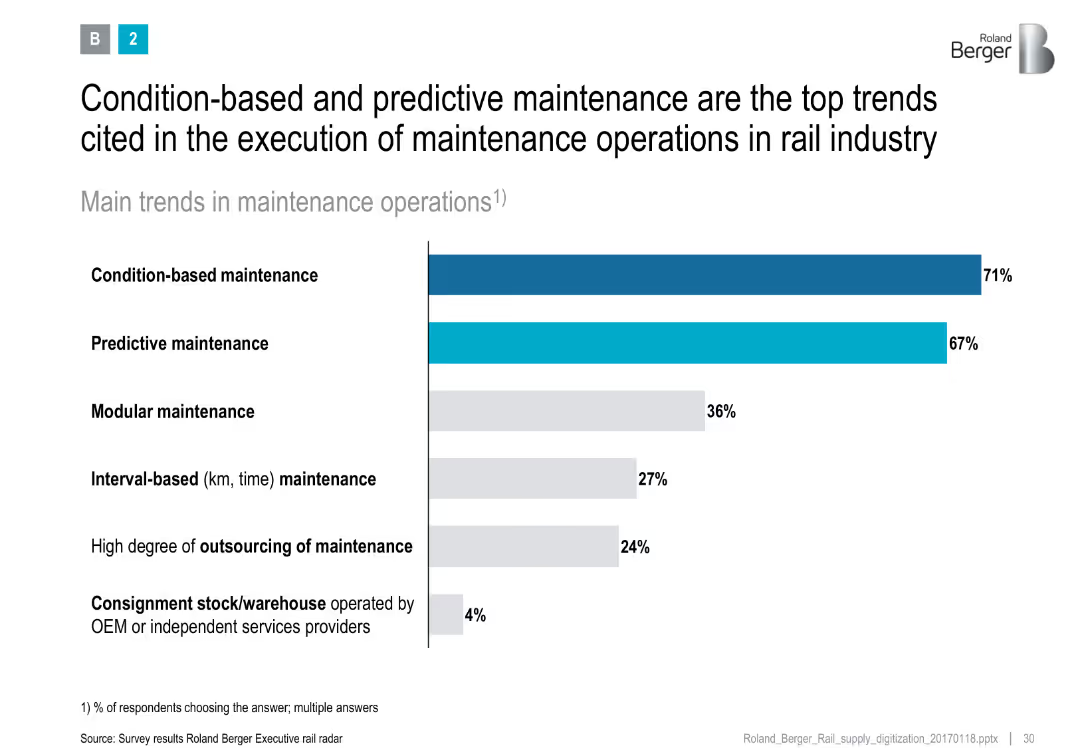
Vertical bar chart ranking maintenance methods by popularity
Performance Metrics and KPIs
Transportation & Logistics
Identifies top trends in rail maintenance, with condition-based and predictive methods leading, followed by modular and interval-based approaches.
maintenance, predictive analytics, condition-based, modular maintenance, trends
false
Performance Metrics and KPIs
Transportation & Logistics
Single Chart
Roland Berger
Add to my slides
Remove from favorites
Multiple bar charts depicting transaction types, number of deals, and M&A trends over recent years.
Mergers and Acquisitions
Financial Services
Analyzes trends in investment and M&A activity within the warehouse automation sector, highlighting key areas of interest.
M&A, investment, warehouse automation, deals, trends
false
Mergers and Acquisitions
Financial Services
Multiple Chart
LEK
Add to my slides
Remove from favorites
Features two graphs: a line graph representing M&A activity and a column chart depicting IPO activity, both against a historical average. It has a straightforward design with clear labels and a legend.
Investment Analysis
Technology & Software
The slide provides insights into market trends for mergers, acquisitions, and IPOs in the tech sector, offering a comparative analysis of past and projected activities, which can guide strategic decisions in finance.
M&A, IPO, market trends, tech sector, strategic planning, financial analysis, VC-backed, buyout activity
false
Investment Analysis
Technology & Software
Multiple Chart
JP Morgan
Add to my slides
Remove from favorites
Line chart showing the monetary impact of major losses from 2001 to 2018 with emphasis on 2018.
Risk Assessment and Management
Financial Services
Analyzes the significant financial impact of major claims on Lloyd's in 2018, detailing events like Hurricane Michael and California wildfires, and the trend in syndicates' combined ratios.
Major, Losses, Financial, Impact, 2018
false
Risk Assessment and Management
Financial Services
Mixed Chart
PwC/Strategy&
Add to my slides
Remove from favorites
Contains a column chart, tables, and several informational boxes outlining Malaysia's carbon strategy and investment details, using clear and distinct visuals for data separation.
Regulatory and Compliance
Energy & Utilities
Discusses Malaysia's strategies for carbon reduction, investment flows, and government actions needed to align with ambitious environmental targets.
Malaysia, carbon initiatives, government strategy, investment, environmental policy
false
Regulatory and Compliance
Energy & Utilities
Mixed Chart
Bain
Add to my slides
Remove from favorites
This slide displays a dark blue background with one large column chart showing the progressive increase in deal values...
Investment Analysis
Financial Services
The slide provides an overview of deal values in the first half of 2021 compared to previous years, indicating a sign...
Malaysia, deal value, investments, financial analysis, H1 2021, trend, surpass, previous years
false
Investment Analysis
Financial Services
Single Chart
Bain
Add to my slides
Remove from favorites
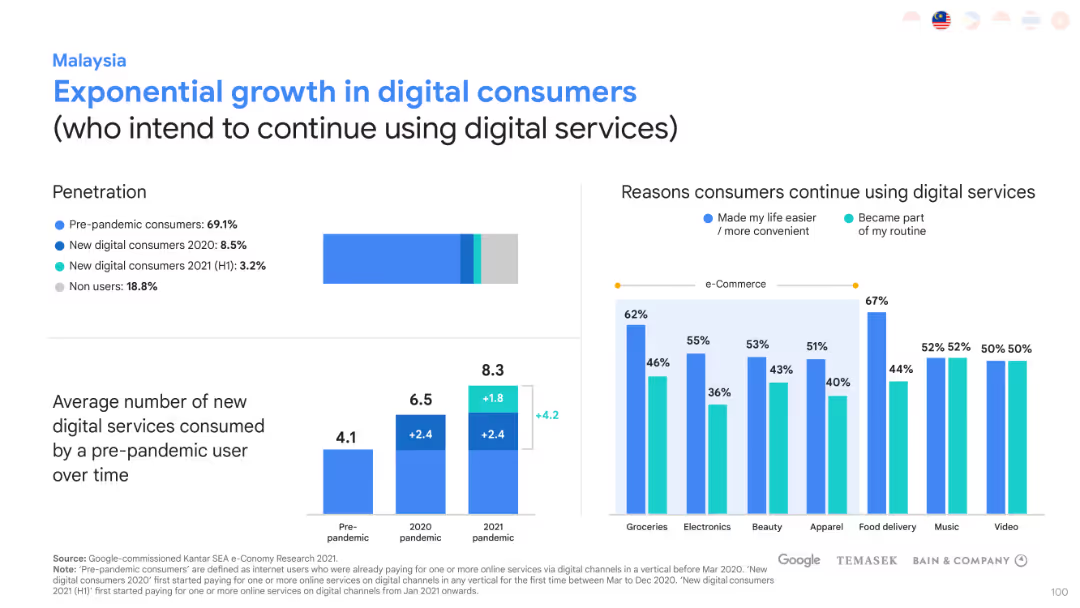
Contains bar graphs representing digital service consumption growth in Malaysia and the reasons for continued usage of these services, color-coded for clarity.
Customer and Market Segmentation
Financial Services
Evaluates the dramatic increase in digital service usage in Malaysia and the motivations behind the sustained consumer engagement.
Malaysia, Digital Growth, Consumer Engagement, Digital Services, Exponential Growth
false
Customer and Market Segmentation
Financial Services
Multiple Chart
Bain
Add to my slides
Remove from favorites
Similar to slide 1491, displays three sets of vertical column charts, showing percentages of digital merchants' expected use of various services in Malaysia.
Market Analysis and Trends
Financial Services
Analyses the reliance on digital platforms among Malaysian digital merchants, with predictions for increasing technological integration.
Malaysia, Digital Merchants, Tech-Savvy, Digital Platforms, Financial Services, Future Trends
false
Market Analysis and Trends
Financial Services
Multiple Chart
Bain
Add to my slides
Remove from favorites
The slide presents a clean and professional look with a white background. It contains four bar charts comparing sectoral...
Market Analysis and Trends
Financial Services
This slide illustrates the growth in various sectors in Malaysia from 2019 to 2025. It focuses on the increase in GMV...
Malaysia, e-commerce, transport, food, media, travel, growth, GMV, 2025, analysis
false
Market Analysis and Trends
Financial Services
Multiple Chart
Bain
Add to my slides
Remove from favorites
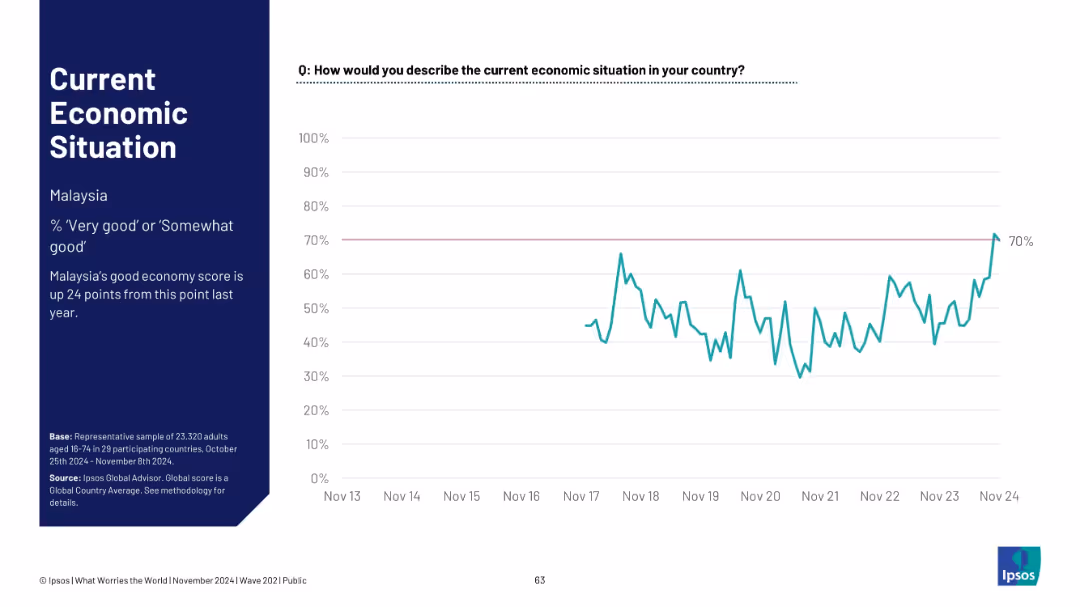
Malaysia data slide. Layout consistent: left text summary, right chart. Final % marked at 70%
Market Analysis and Trends
Government & Public Sector
Malaysia’s economy sentiment has significantly improved, reaching 70%—a 24-point increase year-over-year. The trend chart shows marked growth in optimism among citizens.
Malaysia, economic recovery, high sentiment, growth perception, Ipsos, trend analysis, Southeast Asia
false
Market Analysis and Trends
Government & Public Sector
Single Chart
IPSOS
Add to my slides
Remove from favorites
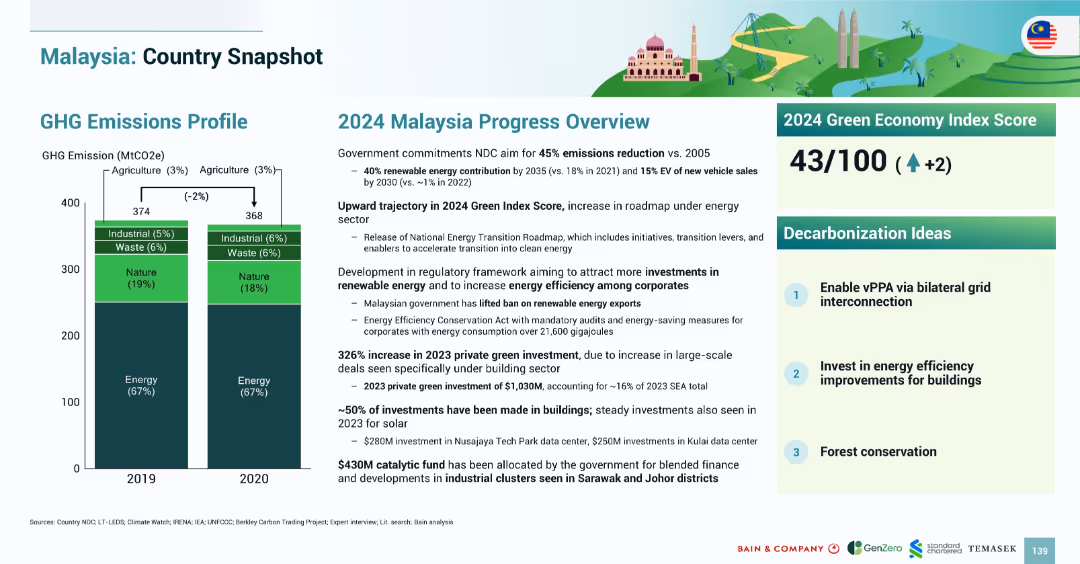
Dual-column layout with emissions bar chart on left and progress summary on right; includes index score and decarbonization ideas in boxes.
Strategic Planning
Government & Public Sector
The slide summarizes Malaysia’s GHG emissions profile and outlines the 2024 progress on decarbonization. It highlights emission reduction targets, the growth in green investment, regulatory updates, and presents a Green Economy Index Score of 43/100. Decarbonization strategies include vPPA enablement, building energy efficiency, and forest conservation.
Malaysia, emissions, decarbonization, energy efficiency, forest, vPPA, 2024, policy, Green Index
false
Strategic Planning
Government & Public Sector
Mixed Chart
Bain
Add to my slides
Remove from favorites
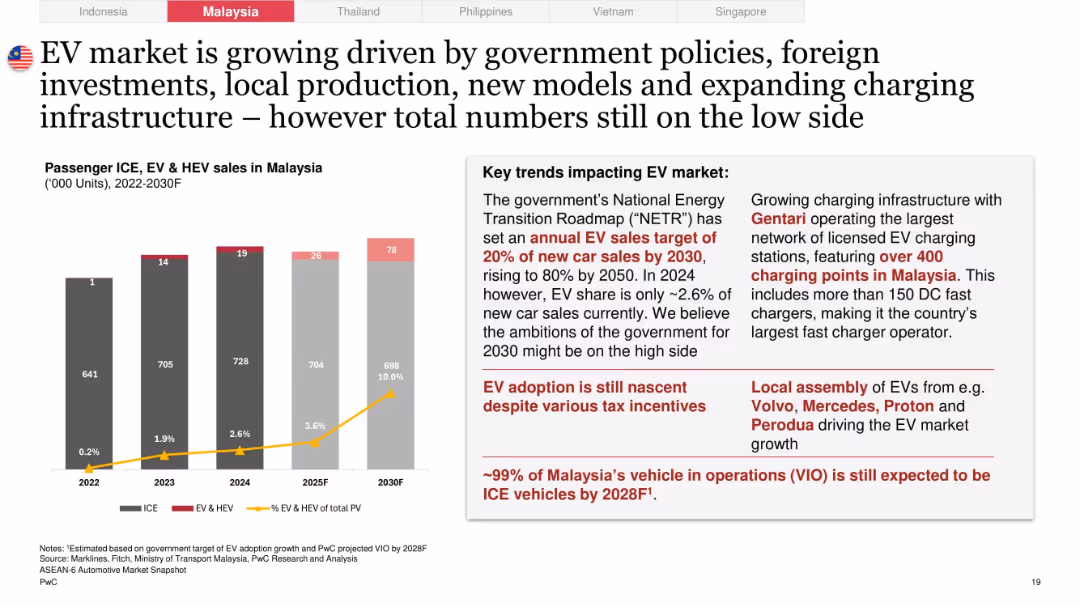
Left-aligned bar chart for EV/ICE sales 2022–2030F, overlaid with line tracking EV % of PV; right section lists EV market trends
Technology and Digital Transformation
Industrial & Manufacturing
Discusses Malaysia’s EV market trajectory with slow early growth (2.6% share in 2024) and government ambitions for 20% by 2030. Identifies charging infra, local EV assembly, and policy as enablers, while noting that ICE dominance will persist through 2028.
Malaysia, EV adoption, ICE vs EV, charging infrastructure, Gentari, local assembly, government targets, market maturity
false
Technology and Digital Transformation
Industrial & Manufacturing
Mixed Chart
PwC/Strategy&
Add to my slides
Remove from favorites
Features several bar graphs to compare spending habits of HVUs vs non-HVUs in Malaysia, along with demographic compositions. It has a clear blue and gray color scheme.
Customer and Market Segmentation
Technology & Software
Highlights spending discrepancies between HVUs (high-value users) and non-HVUs in Malaysia, with insights into their demographic distribution and projected spend change.
Malaysia, HVUs, Spending, Demographics, Online Spend, Gaming, Travel, E-commerce, Market Segmentation, Spending Habits
false
Customer and Market Segmentation
Technology & Software
Multiple Chart
Bain
Add to my slides
Remove from favorites
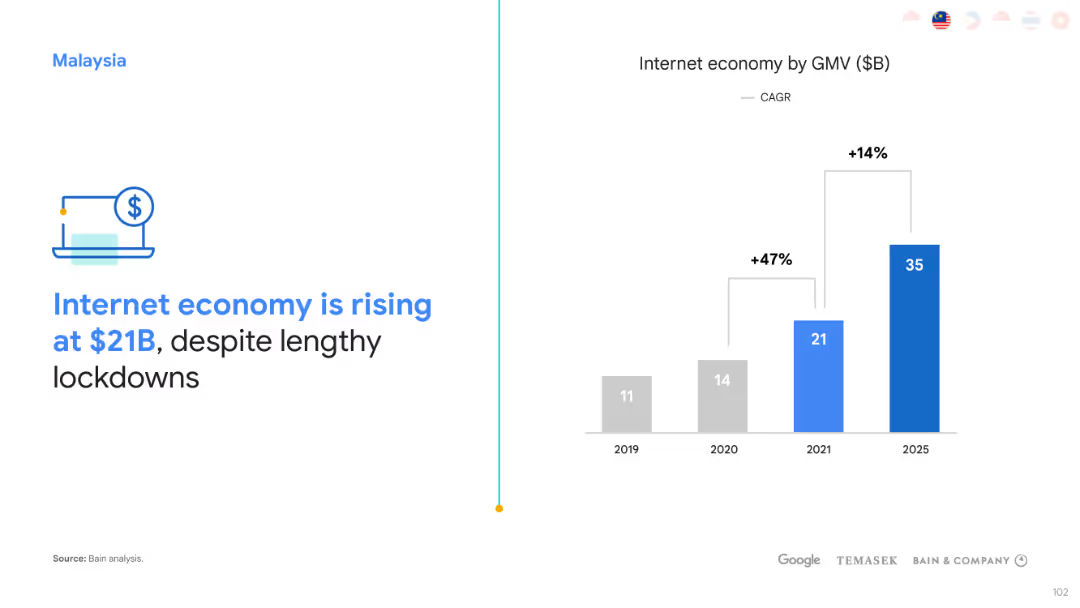
Features a bold column chart depicting the growth of Malaysia's internet economy by GMV with a projection to 2025, alongside a line graph for CAGR.
Market Analysis and Trends
Technology & Software
Details the rise of Malaysia's internet economy to $21B, highlighting resilience and growth despite extended lockdowns.
Malaysia, Internet Economy, GMV, Growth, Projection, CAGR, Resilience, $21B, 2025
false
Market Analysis and Trends
Technology & Software
Single Chart
Bain
Add to my slides
Remove from favorites
Slide includes a mekko chart showcasing investment distribution by sector in Malaysia, focusing on solar and sustainable industries. Visuals are clean and professionally presented.
Investment Analysis
Energy & Utilities
Reviews the investment landscape in Malaysia, particularly in the renewable energy sector, highlighting potential growth areas and key investors.
Malaysia, investment, green energy, solar, sustainable development
false
Investment Analysis
Energy & Utilities
Single Chart
Bain
Add to my slides
Remove from favorites
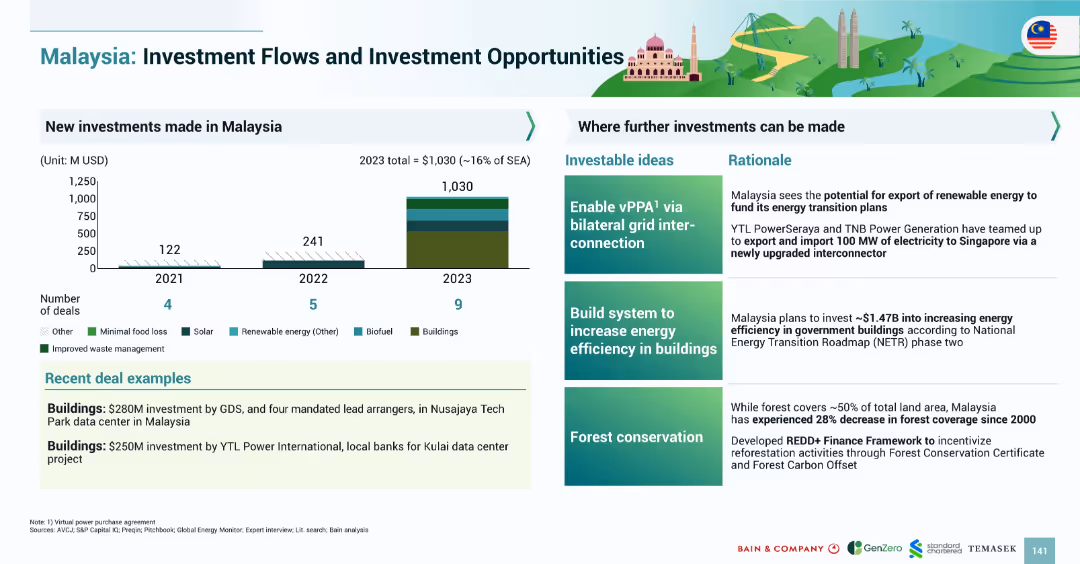
Left side presents a bar chart showing new green investments from 2021–2023, color-coded by sector. Right side includes potential investment areas with rationale.
Investment Analysis
Government & Public Sector
This slide presents Malaysia’s investment trends in green initiatives, with a notable increase to $1.03B in 2023. Key areas for future investments include enabling vPPAs, improving building efficiency, and forest conservation. Recent examples include major data center investments.
Malaysia, investment, renewable energy, green finance, vPPA, energy efficiency, forest, 2023
false
Investment Analysis
Government & Public Sector
Mixed Chart
Bain
Add to my slides
Remove from favorites
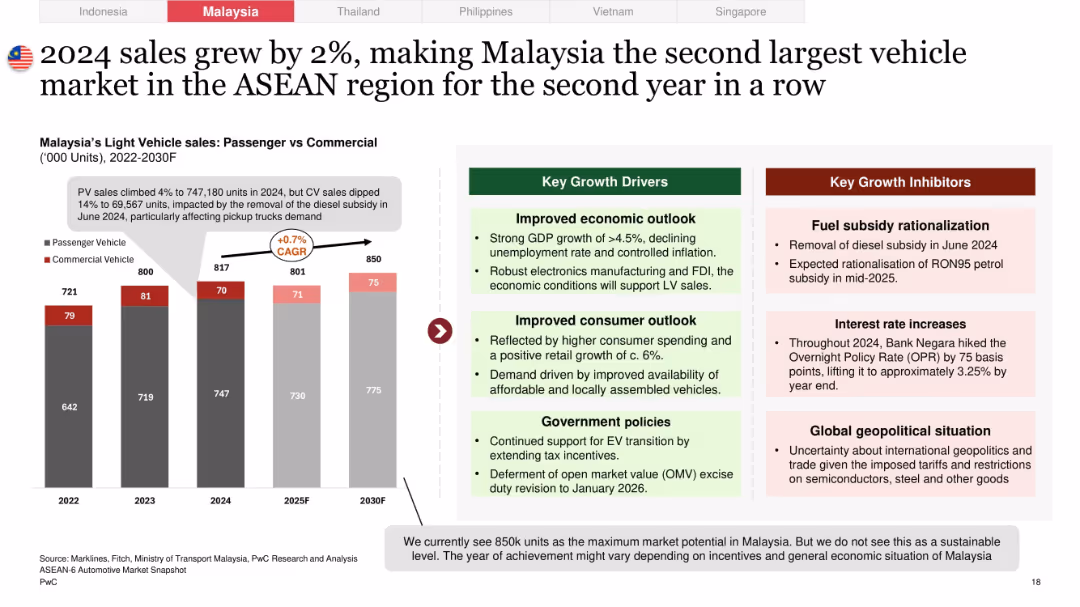
Dual-panel layout with a bar chart (2022–2030F) on the left comparing PV and CV sales, and side-by-side boxes for growth drivers/inhibitors on the right
Market Analysis and Trends
Industrial & Manufacturing
Highlights Malaysia's modest 2% growth in light vehicle sales in 2024, emphasizing strong passenger vehicle (PV) performance but a decline in commercial vehicle (CV) sales. Includes economic, policy, and consumer outlook drivers, as well as risks like fuel subsidy cuts and interest rate hikes.
Malaysia, light vehicle sales, CAGR, commercial vehicle, growth drivers, economic outlook, fuel subsidy, PV vs CV, automotive market, ASEAN
false
Market Analysis and Trends
Industrial & Manufacturing
Mixed Chart
PwC/Strategy&
Add to my slides
Remove from favorites
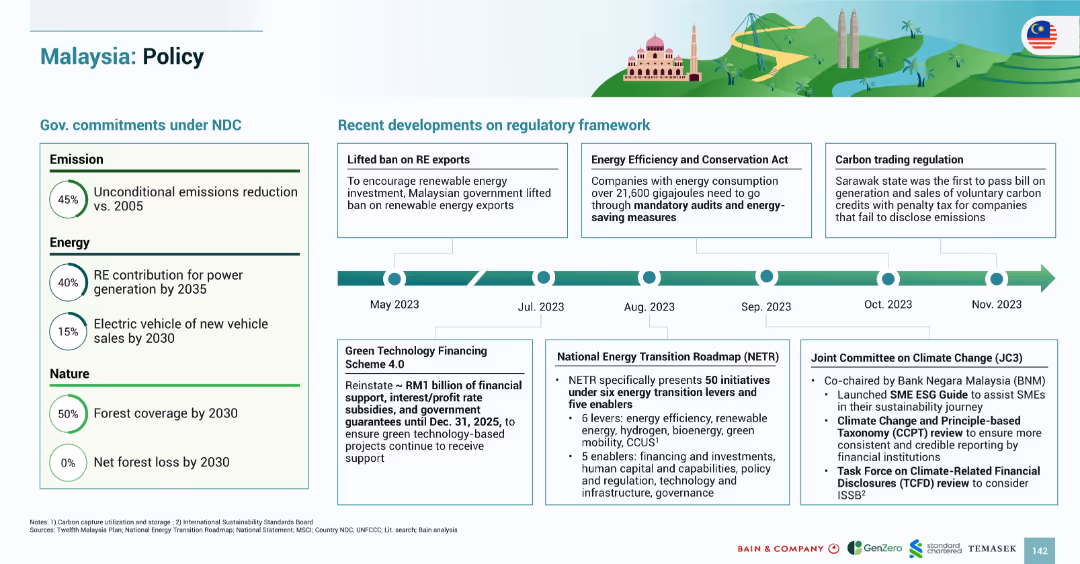
Clean layout with two sections: government NDC commitments on the left and a horizontal regulatory timeline on the right.
Regulatory and Compliance
Government & Public Sector
This slide outlines Malaysia’s commitments under the NDC including 45% emissions reduction and 50% forest coverage by 2030. It details regulatory changes from May to November 2023 such as lifted RE export ban, new Energy Efficiency Act, and carbon trading regulation in Sarawak.
Malaysia, policy, emissions, RE exports, carbon trading, regulation, 2030 targets, NETR
false
Regulatory and Compliance
Government & Public Sector
Mixed Chart
Bain
Add to my slides
Remove from favorites
A bar graph with clear annotations showing the private funding value in Malaysia from 2019 to H1 2023. Colors differentiate the sectors, and the deal count is at the bottom.
Market Analysis and Trends
Financial Services
Demonstrates a downward trend in private funding in various sectors in Malaysia, indicating a shift in investment landscape.
Malaysia, Private Funding, Decline, Sectors, E-commerce, Digital Media, Travel, Investment Landscape, Deal Count
false
Market Analysis and Trends
Financial Services
Single Chart
Bain
Add to my slides
Remove from favorites
A table on the left shows M&A league table rankings by industry and region. The right side features a vertical breakdown of various sectors within the Tech, Media, and Telecom industry.
Competitive Landscape
Financial Services
The slide conveys the company's dominant position in M&A activities, with league table rankings reflecting its top-tier status across regions and industries. It also highlights the potential for growth in the tech, media, and telecom sectors, suggesting room for further market share expansion despite current leadership.
M&A, League Table, Ranking, Tech, Media, Telecom, Market Share, Growth
false
Competitive Landscape
Financial Services
Single Chart
Goldman Sachs
Add to my slides
Remove from favorites
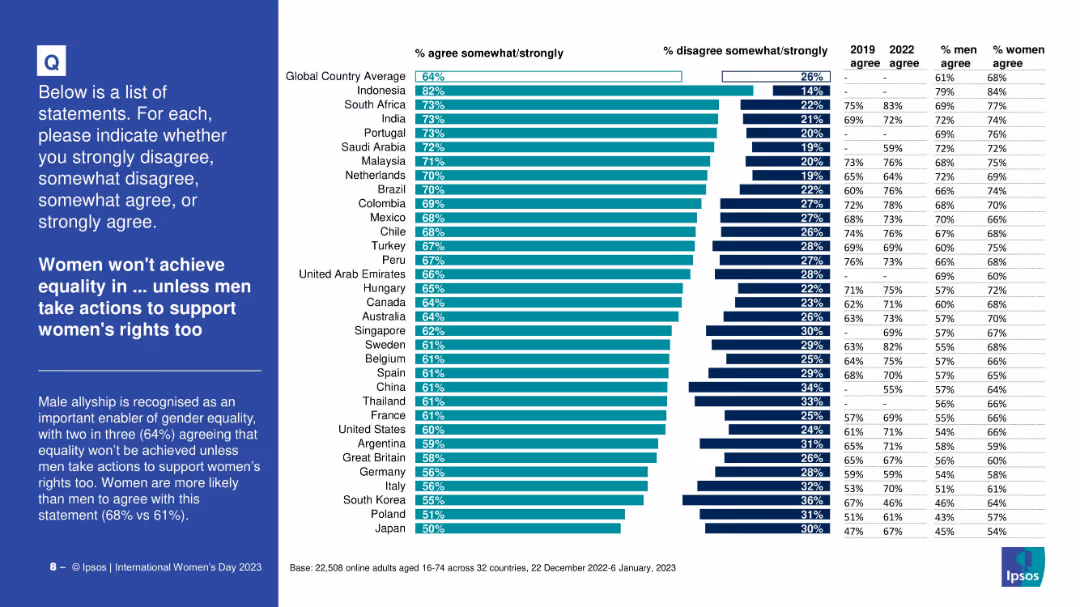
Ranked bar chart by country showing % agreement; includes past year comparisons and male/female agreement percentages.
Human Resources and Talent Management
Government & Public Sector
This slide highlights support across countries for the belief that male allyship is essential for achieving gender equality, with country-specific and gender-specific comparisons.
male allyship, gender equality, support for women, country comparison, Ipsos, equality drivers, global perspectives
false
Human Resources and Talent Management
Government & Public Sector
Mixed Chart
IPSOS
Add to my slides
Remove from favorites
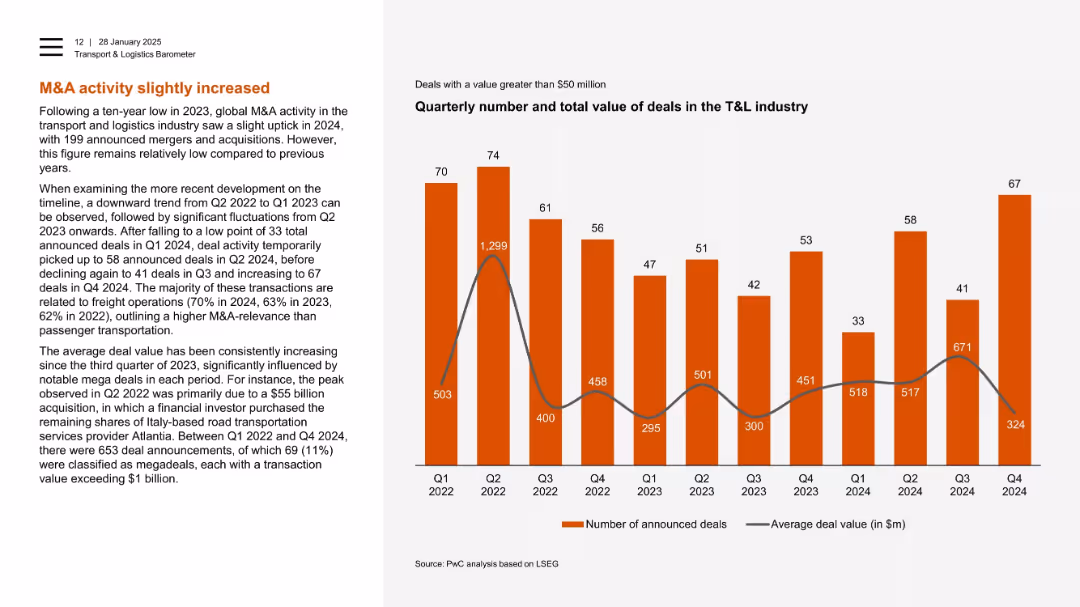
Left-text with a bar chart on the right showing deal count and value trends from Q1 2022 to Q4 2024.
Mergers and Acquisitions
Transportation & Logistics
M&A activity in transport and logistics rose slightly in 2024 after a long decline. The slide breaks down quarterly deal counts and highlights mega-deals, including significant acquisitions in freight operations, which dominate deal activity in this industry.
M&A, logistics, freight operations, deal value, mega deals, quarterly trends, investment
false
Mergers and Acquisitions
Transportation & Logistics
Mixed Chart
PwC/Strategy&
Add to my slides
Remove from favorites
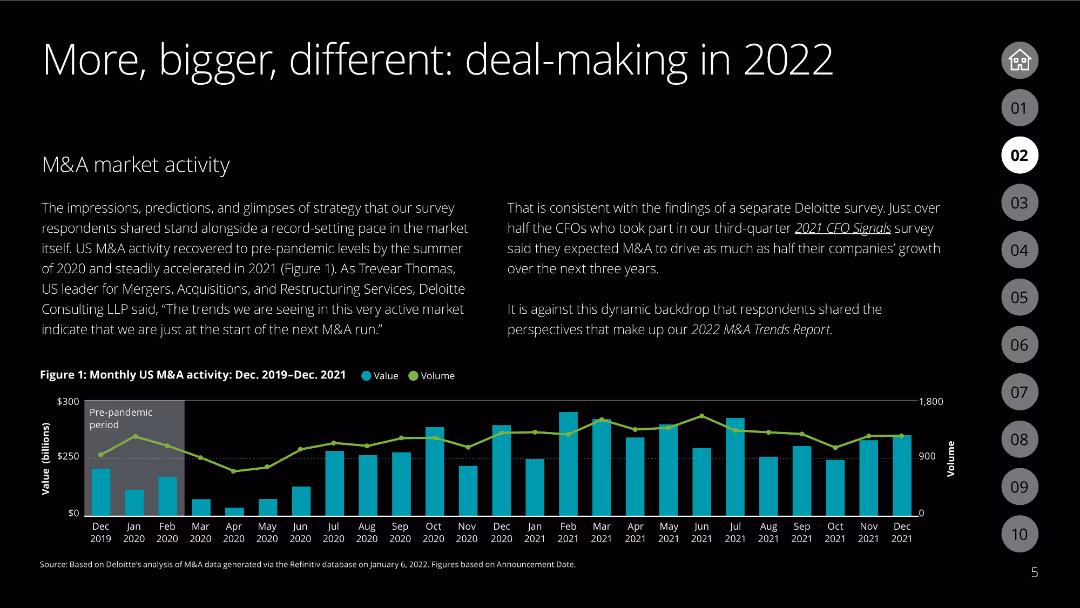
Line chart showing monthly US M&A activity (value and volume) from Dec 2019 to Dec 2021
Mergers and Acquisitions
Financial Services
Analyzes the recovery and growth of US M&A market activity, highlighting trends and expectations for future growth.
M&A, market activity, trends, value, volume
false
Mergers and Acquisitions
Financial Services
Mixed Chart
Deloitte
Add to my slides
Remove from favorites
Text with a bar chart showing Middle East M&A deal volumes by deal size and category for fiscal years 2021 to 2023.
Mergers and Acquisitions
Financial Services
Examines M&A deal volumes in the Middle East, highlighting trends in deal sizes and the impact of economic conditions.
M&A, Middle East, deal size, volumes, fiscal, years, economic, trends, analysis
false
Mergers and Acquisitions
Financial Services
Mixed Chart
PwC/Strategy&
Add to my slides
Remove from favorites
Text with two bar charts showing Middle East M&A deal volumes by fiscal year and by deal size category.
Mergers and Acquisitions
Financial Services
Analyzes the Middle East M&A market's mixed performance in 2023, with data on deal volumes and the impact of economic factors.
M&A, Middle East, deals, volumes, fiscal, year, market, analysis, economic
false
Mergers and Acquisitions
Financial Services
Mixed Chart
PwC/Strategy&
Add to my slides
Remove from favorites
Features column charts comparing revenue growth and operating margin between companies with and without a managed services partner from 2023-2025.
Strategic Planning
Professional Services
Highlights the advantages of partnering with managed services, showing expected improvements in revenue growth and operating margins.
managed services, growth, margins, comparison, strategy
false
Strategic Planning
Professional Services
Multiple Chart
Accenture
Add to my slides
Remove from favorites
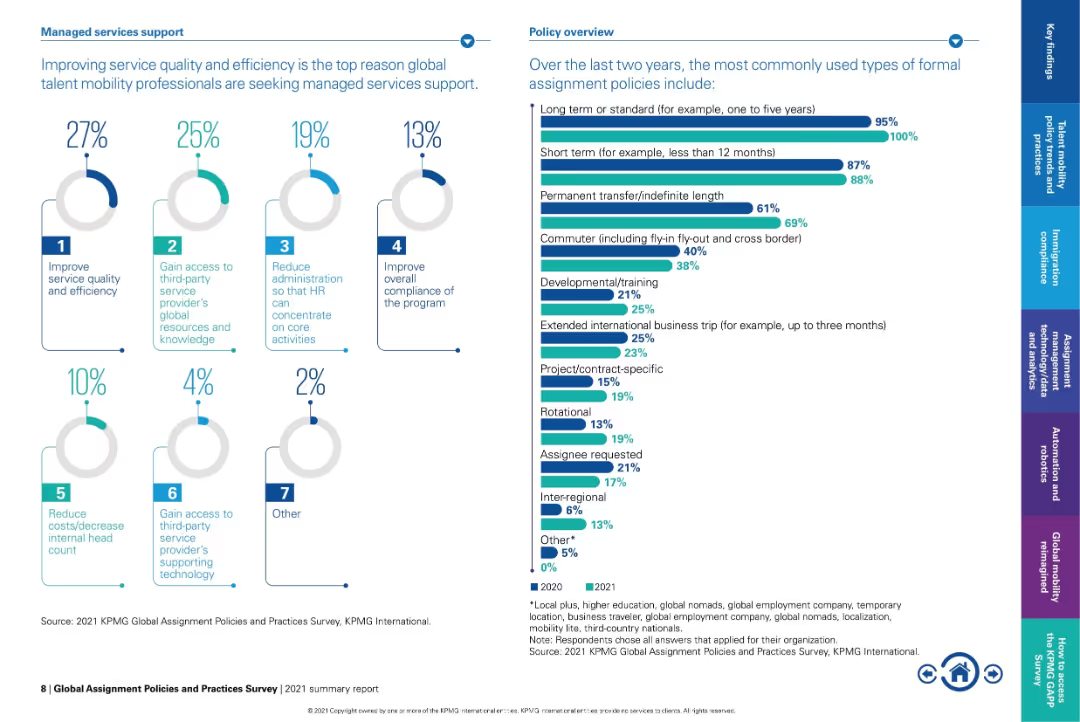
Dual-column layout: left side covers reasons for using managed services; right side lists common assignment policy types via horizontal bar chart.
Human Resources and Talent Management
Professional Services
This slide outlines why HR departments use managed services, including efficiency, compliance, and resource access. It also presents commonly used formal assignment types (e.g., long-term, short-term, project-based), based on recent trends.
managed services, HR outsourcing, assignment policy, compliance, global mobility, international relocation, workforce planning, efficiency
false
Human Resources and Talent Management
Professional Services
Multiple Chart
KPMG
Add to my slides
Remove from favorites
Contains icons representing survey data on manager stress and support across countries.
Organizational Structure and Change
Professional Services
Examines the growing difficulties in management roles, highlighting issues like stress and lack of support, crucial for discussions on organizational restructuring and manager support systems.
management challenges, job stress, support, organizational change, survey data, international comparison, professional services, management trends
false
Organizational Structure and Change
Professional Services
Header Horizontal
BCG
Add to my slides
Remove from favorites
Bar charts showing survey results about management difficulty over time in various countries.
Organizational Structure and Change
Professional Services
Highlights perceptions of increased difficulty in management roles from both managers and employees, useful for assessing global workforce sentiments and planning interventions.
management difficulty, survey results, global comparison, workforce sentiment, professional services, organizational challenges
false
Organizational Structure and Change
Professional Services
Multiple Chart
BCG
Add to my slides
Remove from favorites
The slide includes a stacked bar chart showing how respondents manage their investments, with different categories.
Operational Efficiency
Financial Services
The slide discusses the various methods respondents use to manage their investments, including advisors and self-directed approaches.
Management, Investments, Advisors, Self-Directed, Pension
false
Operational Efficiency
Financial Services
Single Chart
IPSOS
Add to my slides
Remove from favorites
A stacked column chart shows how Canadians managed their investments in 2022 and 2023, with percentages for each method.
Market Analysis and Trends
Financial Services
It presents the ways Canadians managed their investments, comparing different methods between 2022 and 2023.
Management, Investments, Canadians, Methods, 2023, 2022, Column Chart, Financial, Trends
false
Market Analysis and Trends
Financial Services
Mixed Chart
IPSOS
Add to my slides
Remove from favorites
The slide features an organizational chart with portraits and names of key management team members, alongside a text summary of management strategies.
Organizational Structure and Change
Professional Services
Overview of the joint management structure following a merger, highlighting leadership roles and strategic integration efforts.
management, organizational structure, leadership, merger, strategic planning, team integration
false
Organizational Structure and Change
Professional Services
Diagram
Barclays
Add to my slides
Remove from favorites
Pie chart and bar graphs showing managers' perceptions of their roles' advantages versus disadvantages in several countries.
Human Resources and Talent Management
Professional Services
Evaluates managers' views on the pros and cons of their roles, highlighting a general sentiment of more disadvantages, key for HR and management strategy adjustments.
management perception, role evaluation, advantages, disadvantages, HR planning, professional services, international comparison
false
Human Resources and Talent Management
Professional Services
Multiple Chart
BCG
Add to my slides
Remove from favorites
The slide displays a quartet of column charts comparing various financial aspects over time. Each chart has a percentage scale and is labeled with the financial year quarters. The slide background is white, and the charts use a gradient of blue shades.
Market Analysis and Trends
Financial Services
This slide tracks the performance of management services, leasing, investment sales, and commercial mortgage origination, comparing current data to pre-pandemic levels. It's valuable for stakeholders interested in post-pandemic recovery and growth strategies in these specific financial areas.
Management Services, Leasing, Investment Sales, Mortgage Origination, Pandemic Recovery
false
Market Analysis and Trends
Financial Services
Multiple Chart
Goldman Sachs
Add to my slides
Remove from favorites
Percentage data addressing managers' future in their roles and their views on the pros and cons of management.
Organizational Structure and Change
Professional Services
Discusses the sustainability of traditional management roles and the shifting aspirations of managers and employees, pertinent for strategic organizational planning and HR policies.
management sustainability, future roles, organizational change, employee aspirations, career planning, professional services, HR strategies
false
Organizational Structure and Change
Professional Services
Header Horizontal
BCG
Add to my slides
Remove from favorites
Shows heatmap comparing attributes of an ideal manager across different regions.
Organizational Structure and Change
Professional Services
Defines and compares preferred managerial attributes in various international contexts.
managerial attributes, regional comparisons, team development, decision making, feedback
false
Organizational Structure and Change
Professional Services
Table
BCG
Add to my slides
Remove from favorites
The slide presents a donut chart and a gauge chart showing the extent of managerial engagement in developing team engagement plans. Both charts use vibrant colors to differentiate levels of agreement and disagreement.
Human Resources and Talent Management
Professional Services
Focuses on how actively managers engage in team development, crucial for HR training sessions or leadership workshops to enhance managerial effectiveness.
managerial engagement, HR, development
false
Human Resources and Talent Management
Professional Services
Multiple Chart
PwC/Strategy&
Add to my slides
Remove from favorites
Displays a donut chart and a gauge chart focused on tracking managerial progress. The charts are effectively color-coded to highlight various degrees of agreement on effectiveness of the tracking methods.
Human Resources and Talent Management
Professional Services
Provides insights into the tracking of managerial progress, useful for HR meetings focused on improving monitoring practices and performance reviews.
managerial progress, tracking, HR
false
Human Resources and Talent Management
Professional Services
Multiple Chart
PwC/Strategy&
Add to my slides
Remove from favorites
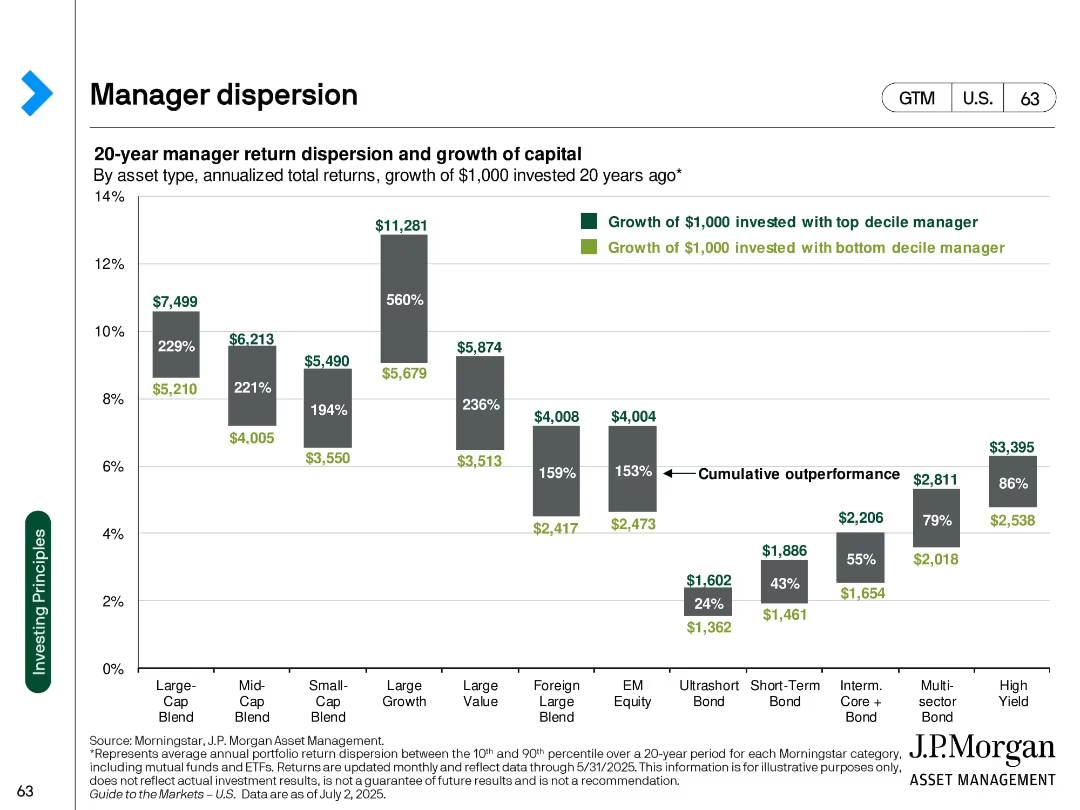
Bar chart comparing top vs. bottom decile manager returns across asset types; values labeled in $ terms
Performance Metrics and KPIs
Financial Services
Shows 20-year dispersion in returns among investment managers across asset categories, emphasizing the large performance gap between top and bottom decile performers.
manager performance, return dispersion, asset types, long-term returns, growth of capital, performance gap, mutual funds
false
Performance Metrics and KPIs
Financial Services
Single Chart
JP Morgan
Add to my slides
Remove from favorites
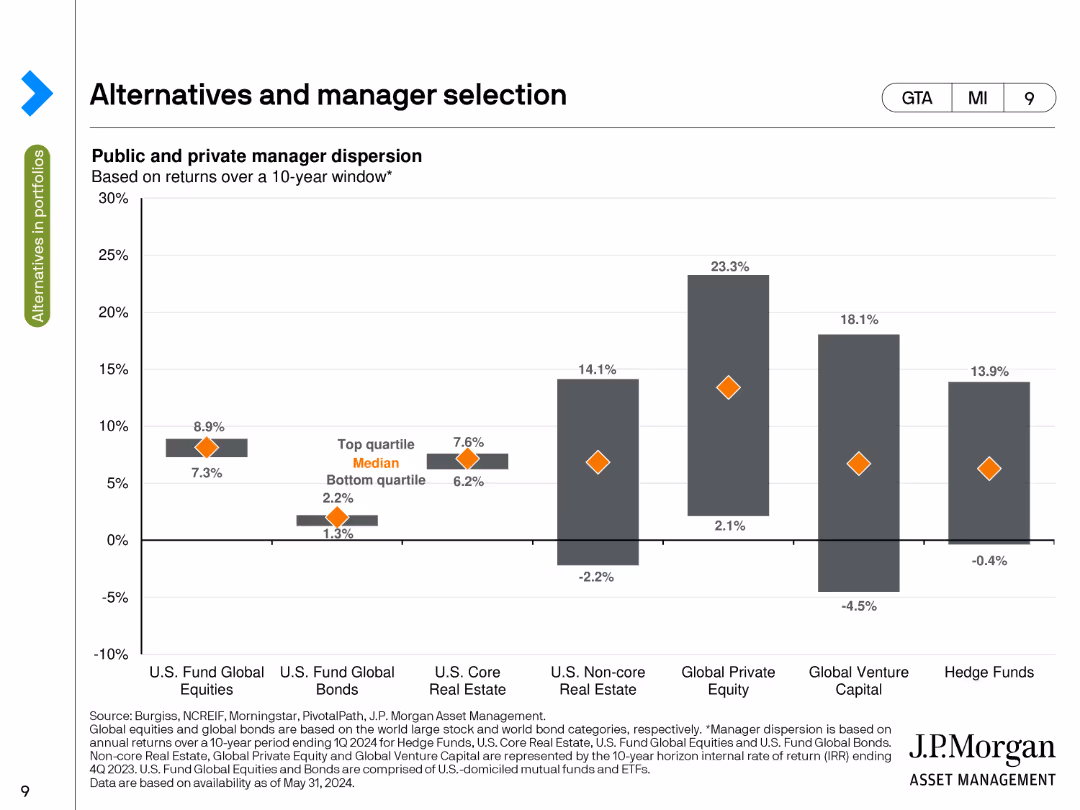
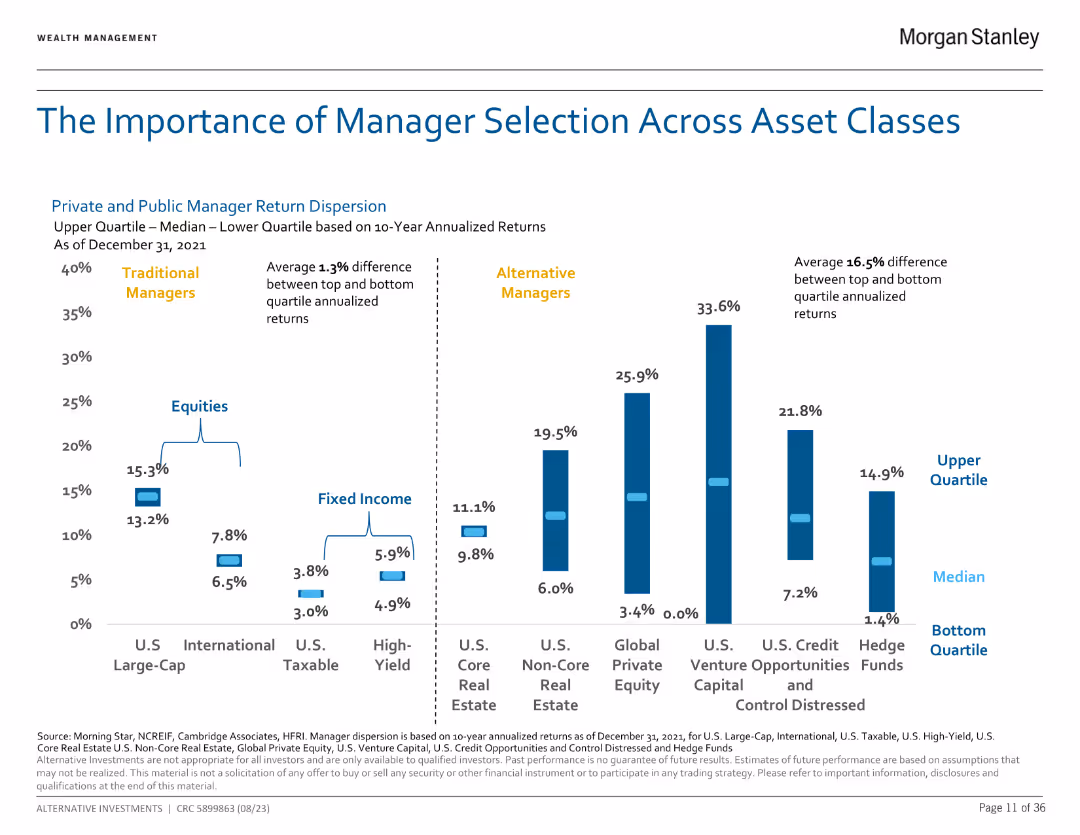
This slide features a column chart displaying public and private manager dispersion based on returns over a 10-year window. The chart includes quartile ranges and median values for various asset classes, highlighted with orange diamonds for median values.
Performance Metrics and KPIs
Financial Services
The slide examines the dispersion in performance among managers of different asset classes over a 10-year period, showing the range from bottom quartile to top quartile returns, including the median performance for each category.
Manager Selection, Dispersion, Returns, Asset Classes, Quartiles
false
Performance Metrics and KPIs
Financial Services
Single Chart
JP Morgan
Add to my slides
Remove from favorites
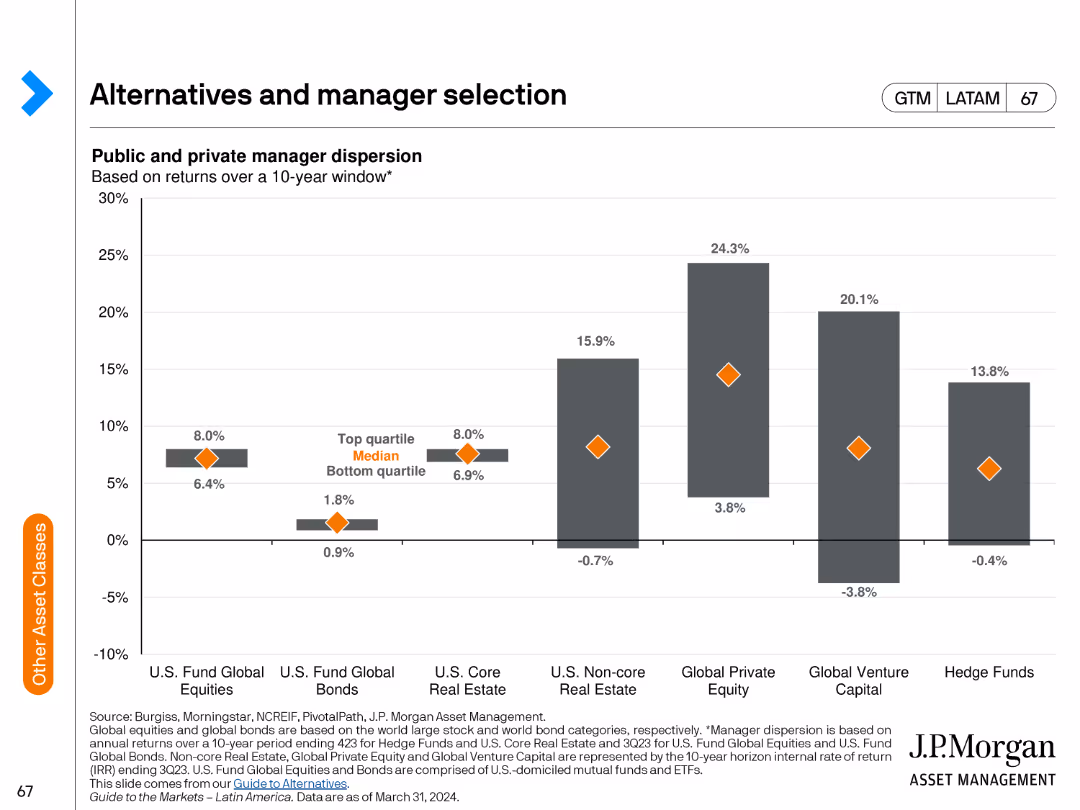
The slide displays a column chart illustrating the dispersion of public and private managers' performance over a 10-year window.
Performance Metrics and KPIs
Financial Services
The slide highlights the performance dispersion among public and private managers, providing insights into manager selection for investment portfolios.
manager selection, performance dispersion, public managers, private managers, investment strategies, performance analysis, financial metrics
false
Performance Metrics and KPIs
Financial Services
Single Chart
JP Morgan
Add to my slides
Remove from favorites
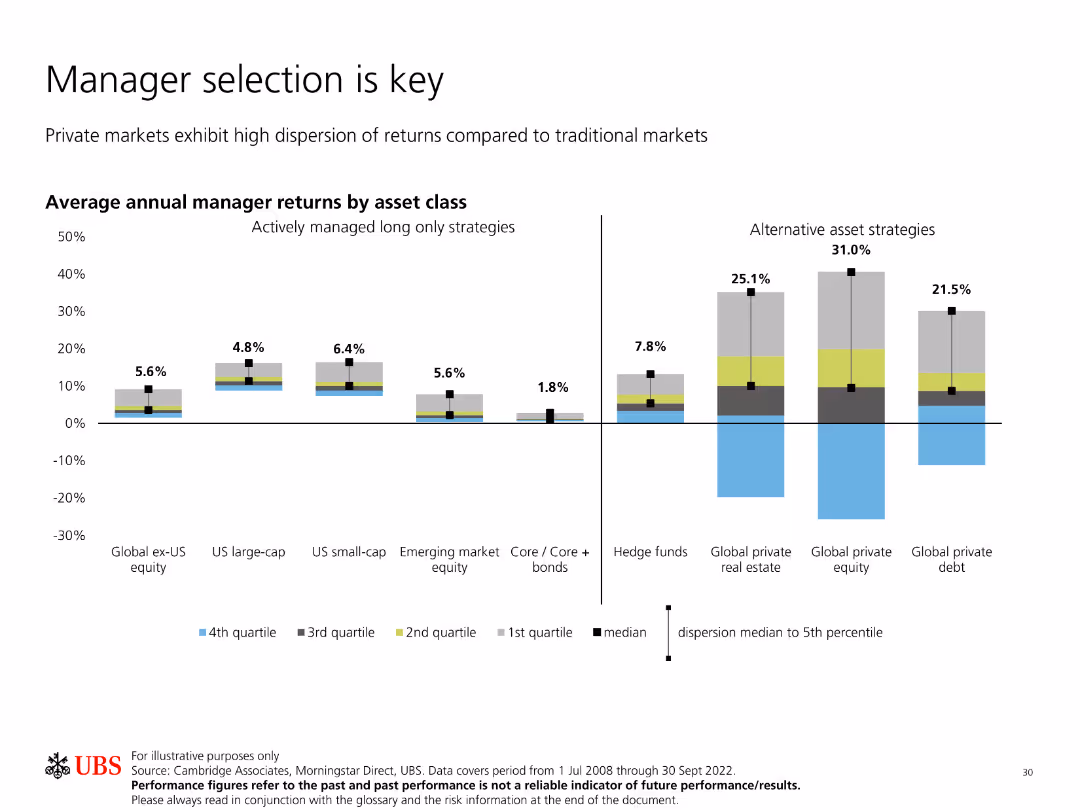
Contains bar charts showing average annual manager returns by asset class, highlighting the dispersion of returns among different strategies.
Risk Assessment and Management
Financial Services
Emphasizes the importance of manager selection in private markets, demonstrating the variability in returns across different asset classes and strategies.
Manager Selection, Private Markets, Asset Classes, Returns, Dispersion, Risk, Investment, Analysis, Strategies
false
Risk Assessment and Management
Financial Services
Single Chart
UBS
Add to my slides
Remove from favorites
Column chart depicting return dispersion across asset classes for private and public managers.
Risk Assessment and Management
Financial Services
Highlights the variability in returns based on manager selection, emphasizing the importance of choosing the right managers.
Manager, selection, returns, asset classes
false
Risk Assessment and Management
Financial Services
Multiple Chart
Morgan Stanley
Add to my slides
Remove from favorites
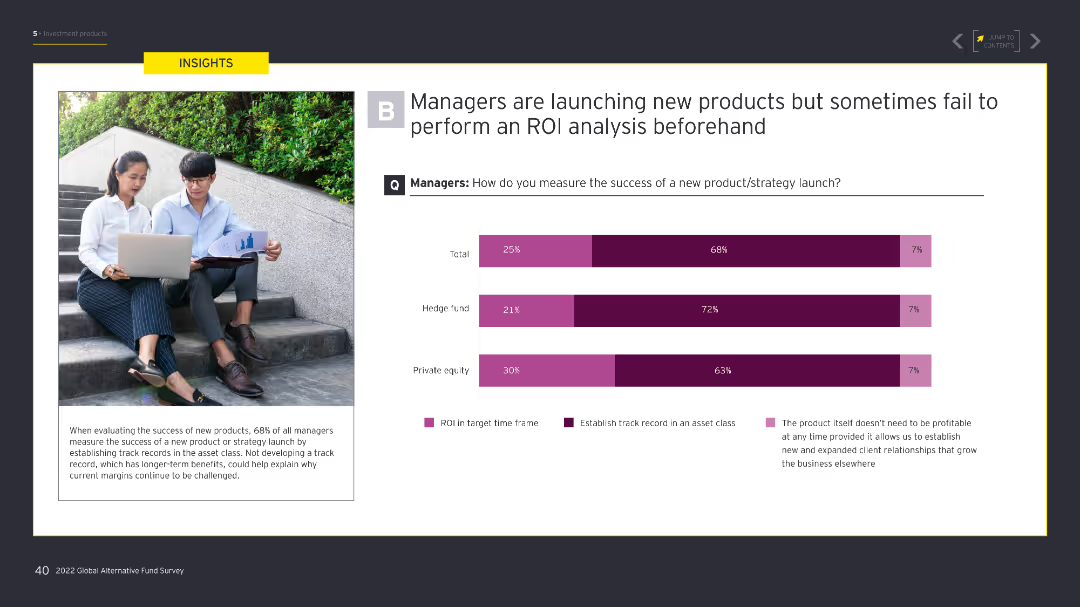
This slide features a column chart on how managers measure the success of new product launches, with categories like ROI in target time frame and establishing a track record. An image of professionals with laptops is on the left.
Investment Analysis
Financial Services
Evaluates how managers measure the success of new product launches, detailing different criteria used, including ROI timeframes and track records.
managers, product launch, success, ROI, track record, investment, strategies, analysis, professionals, laptops
false
Investment Analysis
Financial Services
Multiple Chart
EY
Add to my slides
Remove from favorites
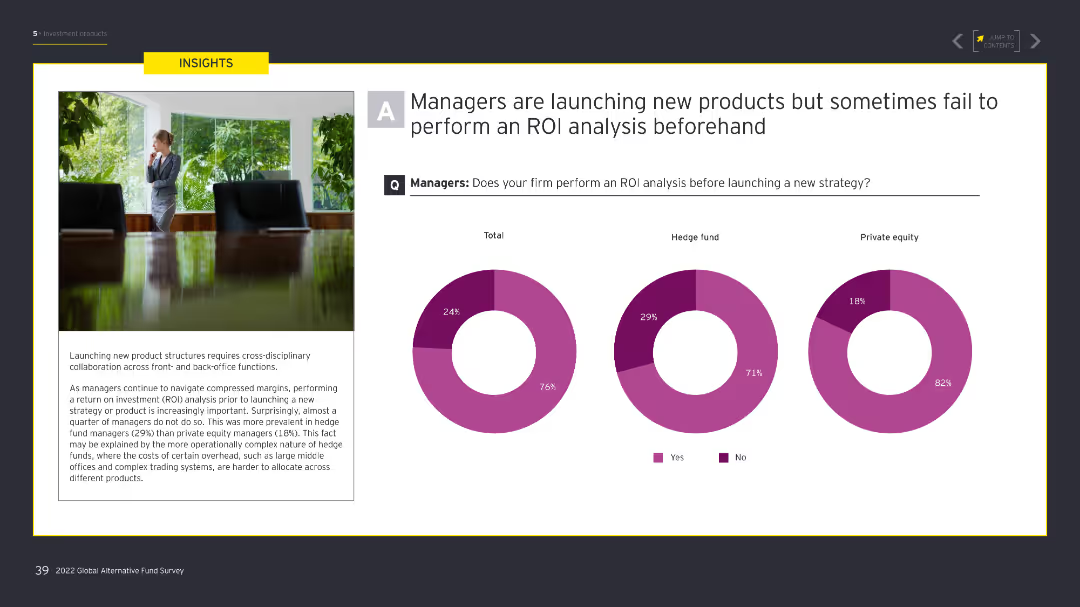
The slide includes two pie charts comparing the percentage of managers who perform ROI analyses before launching new strategies in hedge funds and private equity. An image of a professional in an office is on the left.
Investment Analysis
Financial Services
Discusses the tendency of managers to launch new products without performing an ROI analysis, focusing on hedge funds and private equity.
managers, ROI analysis, new products, launch, hedge funds, private equity, investment, strategies, office, professional
false
Investment Analysis
Financial Services
Multiple Chart
EY
Add to my slides
Remove from favorites
Bar charts comparing feelings of stress, overwork, and support among managers in different countries.
Human Resources and Talent Management
Professional Services
Analyzes the emotional and professional strains on managers across different regions, crucial for developing targeted support and wellness programs.
manager stress, overwork, support, international comparison, HR strategies, professional services, wellness programs
false
Human Resources and Talent Management
Professional Services
Multiple Chart
BCG
Add to my slides
Remove from favorites
Features a dual-axis line chart comparing accelerator attendance and equity investment in Manchester, with textual analysis of trends.
Market Analysis and Trends
Technology & Software
Analyzes the impact of accelerators on Manchester's tech sector, noting a correlation between accelerator activity and equity investment, with predictions for post-2020 recovery.
Manchester, accelerators, investment, equity trends, pandemic impact, business startups, local economy, government support, future outlook
false
Market Analysis and Trends
Technology & Software
Mixed Chart
Barclays
Add to my slides
Remove from favorites
Slide displays a bar chart listing top investors in Manchester tech companies, with counts of equity deals from 2011–2020, alongside descriptive text.
Investment Analysis
Technology & Software
Reviews major tech investors in Manchester, showing the number of deals each investor has completed, indicating a strong investment landscape.
Manchester, investors, tech companies, equity deals, investment trends, Mercia Asset Management, Growth Company Angels, Northern Powerhouse, business funding
false
Investment Analysis
Technology & Software
Mixed Chart
Barclays
Add to my slides
Remove from favorites
Features a vertical column chart and a line chart showing trends in equity investment in tech companies, with numerical stats and textual descriptions.
Financial Performance
Technology & Software
Details equity investment in Manchester's tech sector from 2011-2020, highlighting total investment and the distribution across tech and non-tech companies.
Manchester, tech investment, equity, financial data, investment trends, tech sector, decade review, economic growth, The Hut Group, IPO
false
Financial Performance
Technology & Software
Mixed Chart
Barclays
Add to my slides
Remove from favorites
Contains a map of Manchester highlighting tech company locations, differentiated by type with a legend and descriptive text.
Market Analysis and Trends
Technology & Software
This slide maps high-growth technology companies in Manchester, indicating clusters and new hubs like the digital security hub by Manchester City Council.
Manchester, technology, high-growth companies, map, digital hub, Northern Quarter, innovation hub, local economy, ecosystem features, strategic locations
false
Market Analysis and Trends
Technology & Software
Graphic
Barclays
Add to my slides
Remove from favorites
Previous
Next
You don't have any favorites yet.
Please wait loading your favorites slides...
Create a FREE account to continue browsing
Receive Instant Access to 1,000+ slides from companies like McKinsey, Google, and Goldman Sachs
First Name
Last Name
Email
Password
I agree to all
Terms & Privacy Policy
Thank you! Your submission has been received!
Oops! Something went wrong while submitting the form.
Have an account?
Sign in
Upgrade to PRO to Save slides
Advanced Search and Filters
Access to 15,000+ slides
Access to Category Pages
Save/Bookmark Slides
PowerPoint Template Library
Pick a Plan
MONTHLY
$12/month
Billed every month, Cancel anytime.
YEARLY
$9/year
Billed $108 annually, Cancel anytime.
Checkout for $12/month
Checkout for $108/yr
Secured by Stripe | AES-256 bit encryption