My Account
My Slides
Search by Category
Pricing
Templates
View All Templates
Download Template Slides
✦ AI Search
Feedback
Login
Logout
Get Started
Browse all Slides
Browse all Slides
Create a FREE Account
Instant access to 1,000+ real slides from top companies like McKinsey, BCG, Goldman Sachs, Google and many more!
First Name
Last Name
Email
Password
I agree to all
Terms & Privacy Policy
Thank you! Your submission has been received!
Oops! Something went wrong while submitting the form.
Have an account?
Sign in
Saved Slides
Total No. of slides saved
0
↻ Refresh
✖ Clear all
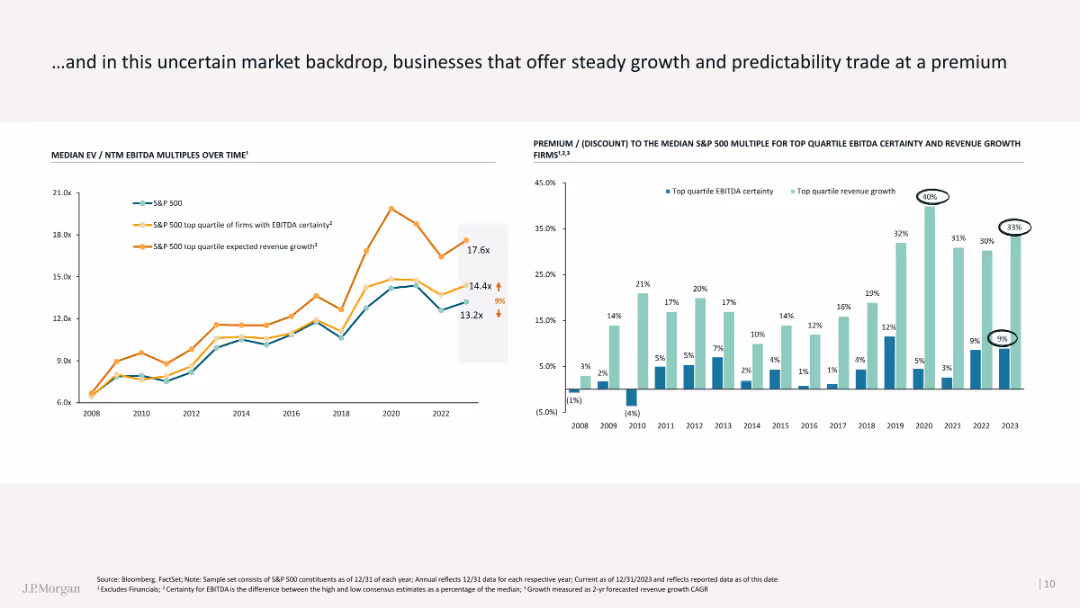
The slide shows a combination of line and column charts comparing EBITDA multiples over time and market premiums.
Investment Analysis
Financial Services
This slide explains how businesses with steady growth and predictability are valued higher in uncertain markets.
Market premium, EBITDA, line chart, column chart, growth predictability
false
Investment Analysis
Financial Services
Multiple Chart
JP Morgan
Add to my slides
Remove from favorites
Features six circle icons representing countries, accompanied by text detailing sales figures, organic growth rates, and years of market presence.
Market Analysis and Trends
Consumer Goods
This slide provides a snapshot of Nestlé's longstanding market presence and sales performance in six major emerging markets. Useful for understanding geographical distribution of sales and historical market penetration.
market presence, sales, emerging markets, growth, Nestlé
false
Market Analysis and Trends
Consumer Goods
Table
Deutsche Bank
Add to my slides
Remove from favorites
Displays a complex multi-circle diagram estimating future solar market capacities under different growth scenarios (low to high). Each scenario circle is annotated with projected gigawatts by 2030, providing a strategic forecast view.
Strategic Planning
Energy & Utilities
Projects the potential growth of Nigeria's solar market using different international benchmarks and growth scenarios, useful for strategic decision-making and policy formulation in the energy sector.
market projection, solar capacity, Nigeria, growth scenarios, strategic forecast
false
Strategic Planning
Energy & Utilities
Mixed Chart
BCG
Add to my slides
Remove from favorites
The slide includes multiple charts: a column chart comparing annualized returns and risks, and a table summarizing realized returns and forecasts.
Financial Performance
Financial Services
This slide evaluates past and projected market returns, emphasizing the benefits of diversification for enhancing return potential.
market returns, diversification, risk, forecast, return potential
false
Financial Performance
Financial Services
Mixed Chart
UBS
Add to my slides
Remove from favorites
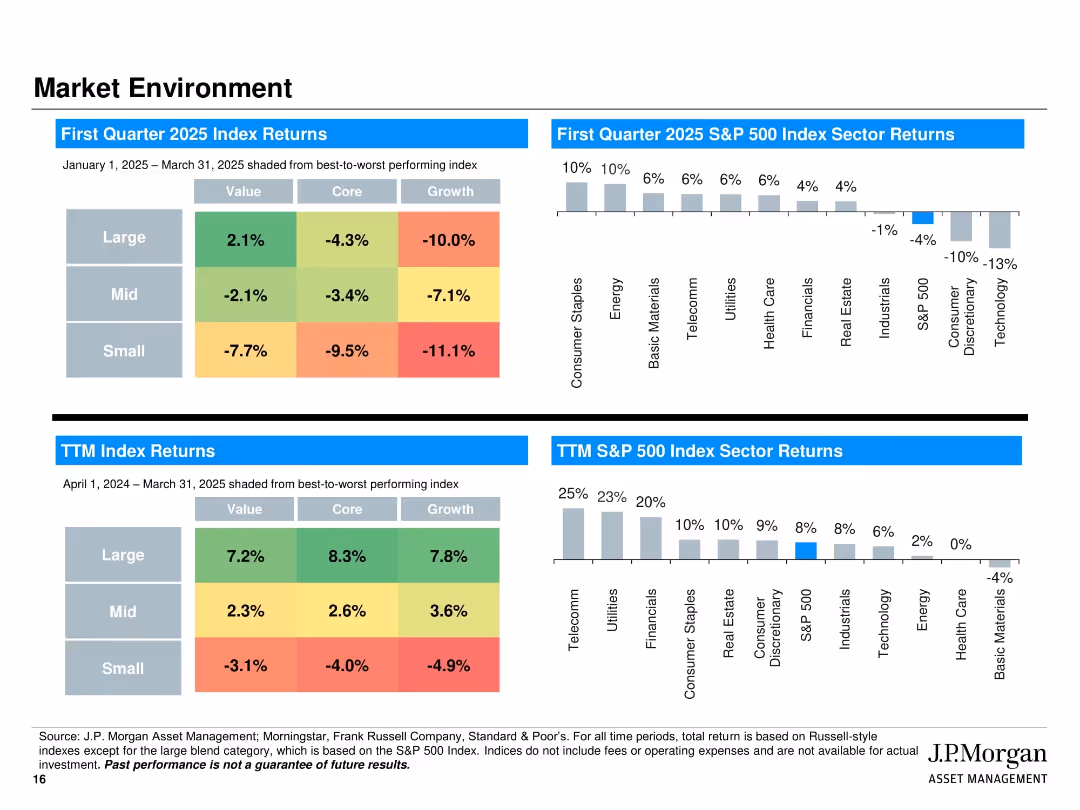
Grid heatmaps on the left and bar charts on the right; performance returns segmented by size, style, and sectors
Market Analysis and Trends
Financial Services
This slide analyzes market performance across equity size and style segments, with a focus on quarterly and trailing twelve-month (TTM) index returns. Sector performance comparisons from the S&P 500 are provided to contextualize current trends and investment positioning.
Market returns, TTM, Q1 2025, index performance, equity size, equity style, S&P 500, sector analysis, heatmap
false
Market Analysis and Trends
Financial Services
Multiple Chart
JP Morgan
Add to my slides
Remove from favorites
Two main sections divide the slide, both using checkmark lists for clarity. The color scheme is consistent with blue and white, creating a professional look.
Risk Assessment and Management
Financial Services
It provides a continuation of risk management strategies focusing on market and credit risk, with key measures highlighted for each. This slide is suitable for risk management and strategic planning meetings.
market risk, credit risk, resource management, Goldman Sachs, risk intermediation, client dialogue, consumer credit, loan security, financial strategy, risk mitigation
false
Risk Assessment and Management
Financial Services
Table
Goldman Sachs
Add to my slides
Remove from favorites
This slide features three column charts comparing the "Worst case," "Base case," and "Best case" scenarios for 2019 with data points and percentages.
Market Analysis and Trends
Consumer Goods
Analyzes different growth scenarios for the luxury goods market in 2019 based on the holiday season's performance, Hong Kong's situation, and the US/China trade war.
Market scenarios, Growth impact, Trade war
false
Market Analysis and Trends
Consumer Goods
Multiple Chart
Bain
Add to my slides
Remove from favorites
Features pie charts illustrating the market share and growth of Earth Observation satellites.
Market Analysis and Trends
Technology & Software
Analyzes the market distribution and growth of Earth Observation satellite systems, highlighting leading manufacturers and satellite types.
Market segmentation, EO satellites, manufacturers, growth analysis
false
Market Analysis and Trends
Technology & Software
Multiple Chart
PwC/Strategy&
Add to my slides
Remove from favorites
Presents segmented column charts showing the online luxury goods market by region and category, emphasizing growth rates and market shares with a color-coded design.
Market Analysis and Trends
Retail & E-commerce
Examines the segmentation of the online luxury goods market by geographical region and product category, highlighting the growth trends and the predominant role of Asia and the Americas in online sales.
Market Segmentation, Online Sales, Luxury Goods, Asia
false
Market Analysis and Trends
Retail & E-commerce
Multiple Chart
Bain
Add to my slides
Remove from favorites
The slide features three sections each with a circular icon, title, and bulleted lists. Icons are colored blue, green, and teal. The layout is clean with distinct sections.
Industry Overview
Financial Services
The slide presents three market topics: Growth in Equities, Impact of Electronification, and Performance of Client Franchise with details on each.
markets, equities, electronification, performance, finance
false
Industry Overview
Financial Services
Table
JP Morgan
Add to my slides
Remove from favorites
This slide includes icons, a pie chart, and key financial highlights to underscore the leading position in global markets.
Market Analysis and Trends
Financial Services
Highlights sustained growth and client excellence in global markets, detailing revenue and market share statistics.
markets, financial growth, market leadership, client relationships, revenue
false
Market Analysis and Trends
Financial Services
Mixed Chart
JP Morgan
Add to my slides
Remove from favorites
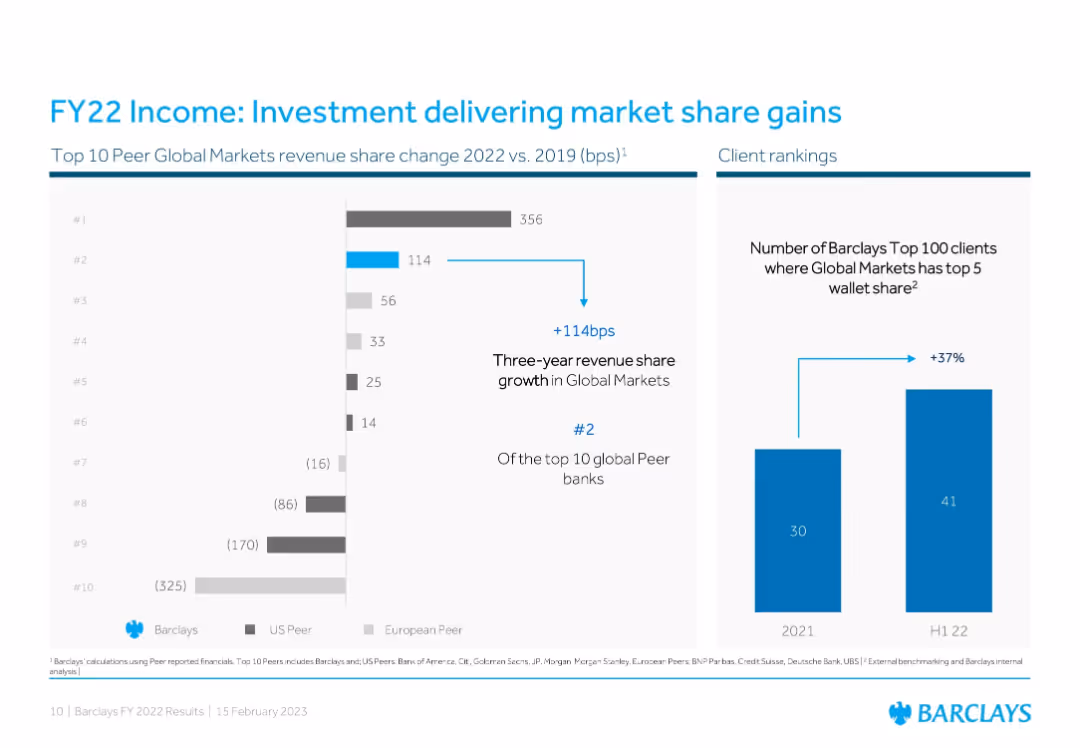
Two-panel layout: bar chart on peer comparison + vertical bar on client rankings
Competitive Landscape
Financial Services
Demonstrates Barclays’ improvement in Global Markets revenue share and client penetration. A bar chart shows Barclays gaining 114 bps since 2019, ranking #2 among peers, while a second graph shows a 37% rise in top-client share penetration.
Market Share, Barclays, Client Ranking, Global Markets, Peer Comparison, Revenue, FY22
false
Competitive Landscape
Financial Services
Multiple Chart
Barclays
Add to my slides
Remove from favorites
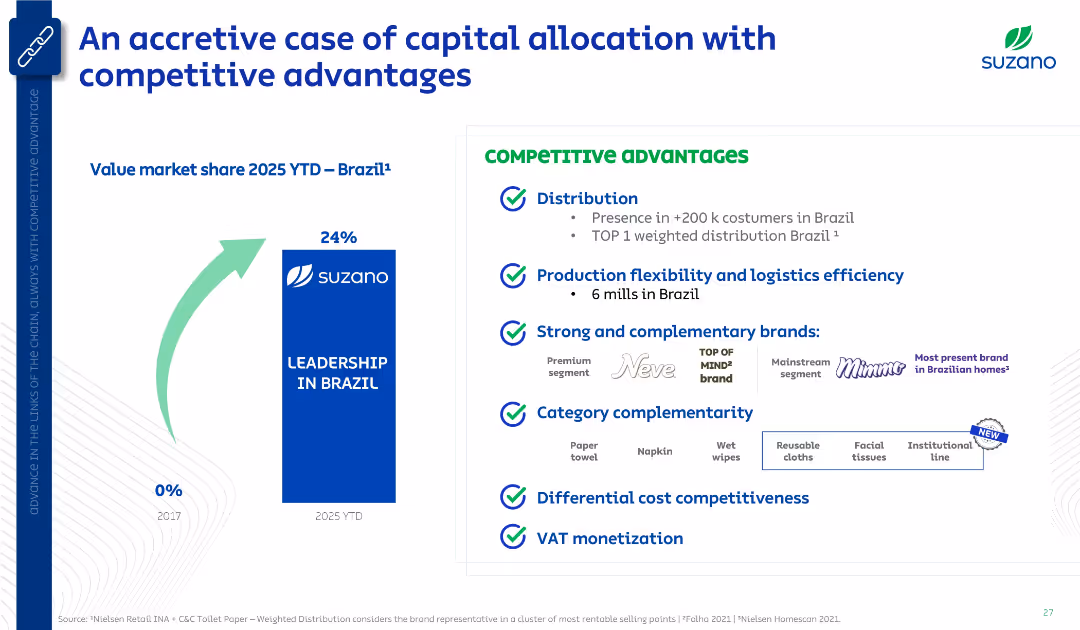
Left-aligned bar chart with growth arrow; right-aligned list of competitive advantages with icons and bullet points. Clean, corporate layout.
Investment Analysis
Consumer Goods
This slide presents Suzano’s increase in Brazilian market share from 0% in 2017 to 24% in 2025, driven by its distribution reach, production flexibility, strong brands, and cost competitiveness. It emphasizes VAT monetization and brand/category complementarity.
market share, Brazil, Suzano, distribution, production efficiency, brand strength, cost advantage, VAT
false
Investment Analysis
Consumer Goods
Mixed Chart
Goldman Sachs
Add to my slides
Remove from favorites
Pie charts and bar charts comparing market data.
Strategic Planning
Financial Services
Analyzes business segments with top market share and the strategic significance of these positions.
Market Share, Business Analysis, Strategy, Segmentation, Performance
false
Strategic Planning
Financial Services
Multiple Chart
Barclays
Add to my slides
Remove from favorites
This slide juxtaposes two sets of data: a bar chart comparing market share changes between 2014-2018 and 2017-2018, and two circular graphs showing the number of businesses where the company ranks in the market from 2014 to 2018.
Market Analysis and Trends
Financial Services
Suited for business analysts and investors, the slide provides a competitive analysis of market share gains in the Corporate Investment Banking sector, underlining the company's improving market position relative to its peers over time.
market share, CIB, leadership, competitive analysis, 2014, 2018, business ranking
false
Market Analysis and Trends
Financial Services
Multiple Chart
JP Morgan
Add to my slides
Remove from favorites
Slide displays multiple column charts comparing business units' market share and growth with industry.
Market Analysis and Trends
Financial Services
Analyzes market share growth in various business units and outlines competitive advantages.
Market share, competitive advantage, business units, growth analysis, industry comparison
false
Market Analysis and Trends
Financial Services
Multiple Chart
JP Morgan
Add to my slides
Remove from favorites
A column chart displaying Nestlé's market share in terms of consumer expenditure across various countries, emphasizing both developed and emerging markets.
Market Analysis and Trends
Consumer Goods
Evaluates Nestlé's current market share in consumer expenditure, suggesting growth opportunities in large markets. This slide is intended for strategizing market penetration and investment decisions.
market share, consumer expenditure, growth opportunities, Nestlé, emerging markets
false
Market Analysis and Trends
Consumer Goods
Single Chart
Deutsche Bank
Add to my slides
Remove from favorites
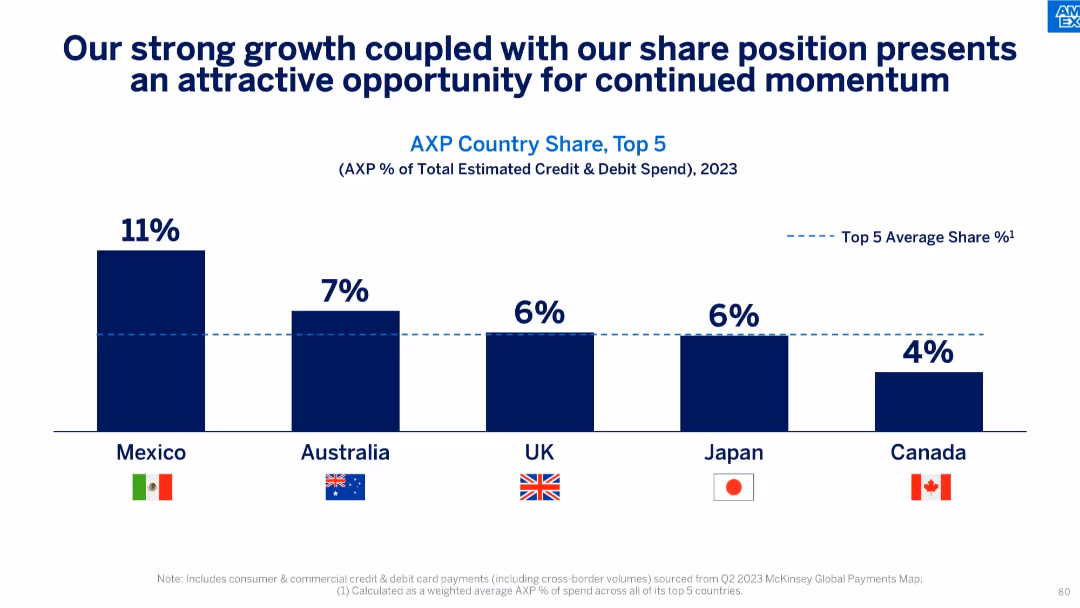
Horizontal bar chart with country flags; highlights percentage share in 5 key markets.
Strategic Planning
Financial Services
Highlights AXP's market share in credit and debit card spend across five countries, with Mexico leading at 11%. The slide suggests that this performance, paired with ongoing growth, positions AXP for further expansion in these regions.
market share, country analysis, card spend, credit & debit, growth opportunity, international, financial services, AXP share
false
Strategic Planning
Financial Services
Single Chart
McKinsey
Add to my slides
Remove from favorites
Slide with bar graphs displaying digital payment market shares and a section describing penetration strategies of different payment platforms.
Competitive Landscape
Financial Services
This slide presents the competitive landscape of digital payment platforms in 2019, showing market shares and penetration strategies. It's useful for analyzing market dominance and strategic linkages in the payment sector, highlighting how major players are leveraging partnerships to enhance their market position.
Market Share, Digital Payments, Penetration Strategy, Competition, Strategic Alliances
false
Competitive Landscape
Financial Services
Mixed Chart
Kearney
Add to my slides
Remove from favorites
A dense slide featuring charts, circular diagrams, and statistical data. Colors are used to differentiate various financial services sectors, with blue tones dominating.
Market Analysis and Trends
Financial Services
This slide shows the market share growth in different sectors of financial services, emphasizing the company's leading position in the market.
market share, financial services, client-centric, growth, data, charts, competitive, statistics
false
Market Analysis and Trends
Financial Services
Diagram
JP Morgan
Add to my slides
Remove from favorites
Pie charts depicting market size and Morgan Stanley's share in various financial service categories. Utilizes blue shades and annotations.
Competitive Landscape
Financial Services
Examines Morgan Stanley's market share in different financial service sectors, identifying opportunities to deepen market penetration.
Market share, financial services, Morgan Stanley, client reach, industry sectors, market penetration, opportunity
false
Competitive Landscape
Financial Services
Multiple Chart
Goldman Sachs
Add to my slides
Remove from favorites
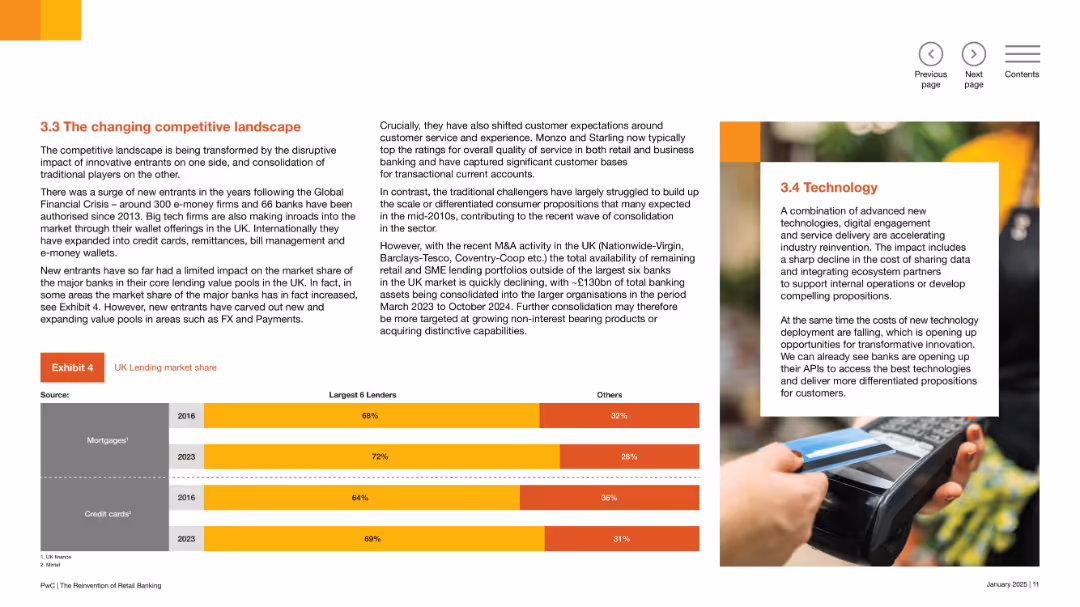
Three-column layout, text-heavy with an orange bar chart labeled “Exhibit 4” showing market share data.
Competitive Landscape
Financial Services
This slide covers the transformation of the banking competitive landscape driven by fintech entrants and M&A activity. It highlights how traditional banks maintain lending share but face disruption in areas like FX and payments. M&A trends among UK banks are noted.
market share, fintech, banking disruption, lending, consolidation, challenger banks, FX, M&A
false
Competitive Landscape
Financial Services
Mixed Chart
PwC/Strategy&
Add to my slides
Remove from favorites
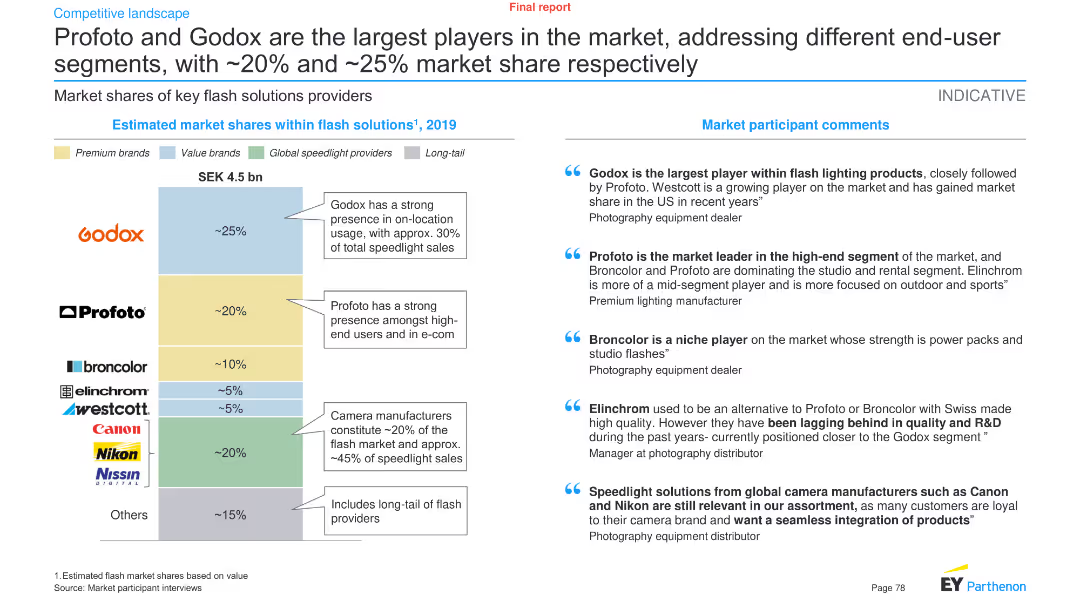
This slide contains a column chart and text boxes comparing the market shares of key flash solution providers, along with participant comments.
Competitive Landscape
Technology & Software
It shows the market share distribution within flash solutions for 2019, highlighting the dominance of Godox and Profoto, along with insights from market participants.
Market share, flash solutions, Godox, Profoto, key players, segments, market, technology, analysis, trends
false
Competitive Landscape
Technology & Software
Mixed Chart
EY
Add to my slides
Remove from favorites
This slide displays column charts and world maps indicating improvements in market share across different regions and financial results from 2017 to 2021.
Market Analysis and Trends
Financial Services
This slide details JP Morgan's market share growth and financial outcomes across all business sectors and global regions from 2017 to 2021. It emphasizes their sustained expense management and operational leverage, contributing to their solid financial positioning in various markets.
market share, global, growth, financial
false
Market Analysis and Trends
Financial Services
Multiple Chart
JP Morgan
Add to my slides
Remove from favorites
It includes bar and pie charts showing market share gains in various business sectors and regions, with blue tones indicating growth.
Market Analysis and Trends
Financial Services
The slide presents market share growth in investment banking, markets, payments, and securities, highlighting improvements over peers.
market share, investment banking, securities, regional growth, financial analysis
false
Market Analysis and Trends
Financial Services
Multiple Chart
JP Morgan
Add to my slides
Remove from favorites
The slide presents a series of column charts comparing Morgan Stanley's net new assets (NNA) as a percentage of assets with various peers for full year 2023.
Market Analysis and Trends
Financial Services
The slide shows Morgan Stanley's market share in net new assets compared to peers, indicating continued growth and dominance in 2023.
Market Share, Net New Assets, Morgan Stanley, 2023, Peers Comparison, Column Chart, Financial Performance, Growth
false
Market Analysis and Trends
Financial Services
Multiple Chart
Morgan Stanley
Add to my slides
Remove from favorites
Features a pie chart showing the 2020 market share of brake and fuel lines, with TI Fluid Systems highlighted as the market leader. Accompanying text provides additional context on market positioning and relationships with OEMs.
Market Analysis and Trends
Industrial & Manufacturing
This slide analyzes the market share for brake and fuel lines, showcasing TI Fluid Systems' leading position and their sustained dominance over a decade, attributed to strong global OEM relationships.
market share, OEM, automotive, 2020, pie chart
false
Market Analysis and Trends
Industrial & Manufacturing
Mixed Chart
Deutsche Bank
Add to my slides
Remove from favorites
Features column charts for population growth and market share, along with a map indicating market presence. The color scheme is blue, grey, and white, with a clear data representation.
Market Analysis and Trends
Financial Services
Analyzes market dominance and growth prospects, likely used for market positioning, investment discussions, or strategic planning sessions to highlight competitive advantages in high-growth areas.
market share, population growth, competitive advantage, strategic planning
false
Market Analysis and Trends
Financial Services
Multiple Chart
Goldman Sachs
Add to my slides
Remove from favorites
Contains two grouped column charts representing revenue and EBITDA from 2016 to 2020, comparing Telkom with competitors. Color-coded to distinguish between companies, with additional details on profitability margins included.
Financial Performance
Telecommunications
Analyzes Telkom's market leadership in terms of revenue and EBITDA, attributing its higher profitability to its scale advantage and leading market share in both mobile and fixed broadband sectors. Notes the financial strategies that keep it ahead of competitors like Indosat and XL.
market share, profitability, Telkom, revenue, EBITDA, competitors
false
Financial Performance
Telecommunications
Multiple Chart
BCG
Add to my slides
Remove from favorites
The slide shows a comparative analysis with text sections, outlining market share growth in various regions and products from 2015 to 2019.
Market Analysis and Trends
Financial Services
The slide demonstrates market share growth faster than peers across regions and products, showing leadership improvement.
Market Share, Regions, Products, Bar Chart, Growth, Leadership, Comparative Analysis, Financial
false
Market Analysis and Trends
Financial Services
Diagram
JP Morgan
Add to my slides
Remove from favorites
This slide shows a column chart with a dark background, representing banking and markets revenues against prior years with annotations.
Market Analysis and Trends
Financial Services
Examines market share and financing gains in the Global Banking & Markets revenues over a period, indicating growth and trends.
market share, revenue, growth, banking, trends
false
Market Analysis and Trends
Financial Services
Single Chart
Goldman Sachs
Add to my slides
Remove from favorites
Contains column charts detailing JP Morgan's market share by product and sector from 2017 to 2021, alongside strategic pillars for business growth.
Strategic Planning
Financial Services
Analyzes JP Morgan's market share strategy by product and sector, emphasizing their leadership and strategic positioning. The slide discusses four key strategic pillars focused on industry specialization, digital platforms, and regional coverage, aiming to enhance market presence and client service in diverse sectors.
market share, strategy, growth, sector
false
Strategic Planning
Financial Services
Multiple Chart
JP Morgan
Add to my slides
Remove from favorites
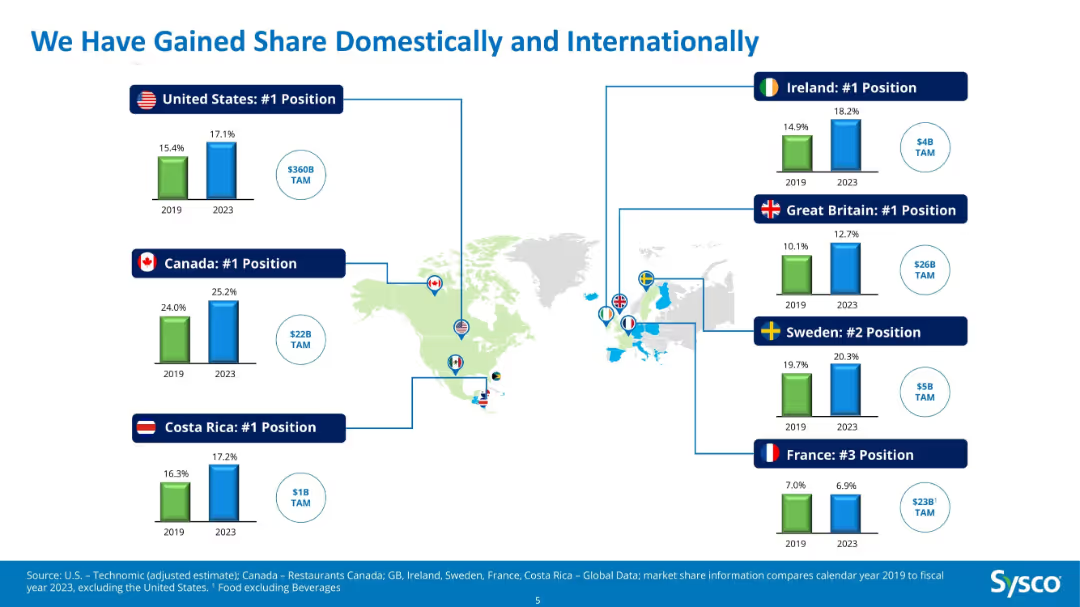
World map with bar charts and country flags, comparing 2019 vs 2023 market share in 7 countries.
Competitive Landscape
Consumer Goods
The slide showcases Sysco's market share growth in the U.S., Canada, Costa Rica, Ireland, Great Britain, Sweden, and France from 2019 to 2023. It emphasizes Sysco’s #1 position in multiple regions within a $441B combined TAM.
market share, Sysco, global growth, food distribution, TAM, international, competitive position, bar chart
false
Competitive Landscape
Consumer Goods
Single Chart
Barclays
Add to my slides
Remove from favorites
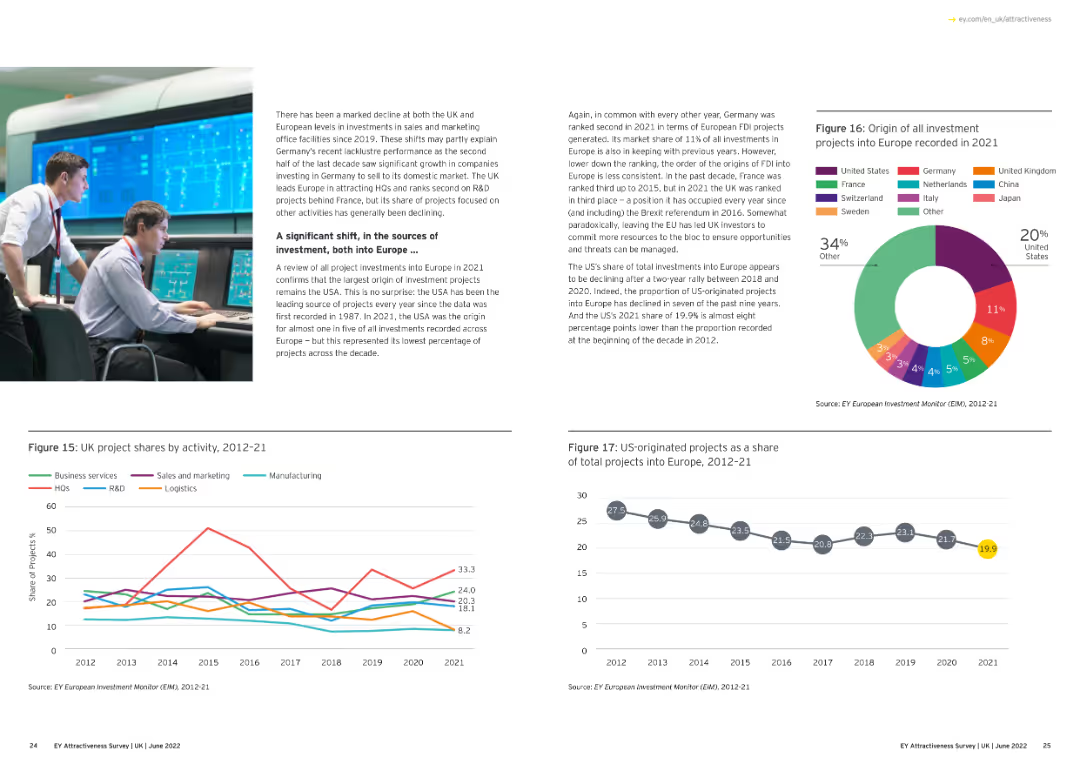
Includes a line chart that outlines the UK's market share of European projects by sector from 2012 to 2021, with lines for different sectors.
Market Analysis and Trends
Financial Services
This slide analyzes the UK's share of European projects by sector over the years, showing which sectors have gained or lost market share.
market share, UK, European projects, sectors, 2012-21
false
Market Analysis and Trends
Financial Services
Multiple Chart
EY
Add to my slides
Remove from favorites
The slide includes a title at the top, text on the left, and a column chart on the right, comparing market share growth among all entrants, finalists, and winners.
Financial Performance
Consumer Goods
Discusses market share growth among winners, finalists, and all entrants in a marketing context. Provides data from Effie 2020 entries showing 57% market share growth for winners.
Market Share, Winners, Growth, Marketing, Data
false
Financial Performance
Consumer Goods
Mixed Chart
IPSOS
Add to my slides
Remove from favorites
Displays a shift in the newspaper classified revenue from predominantly newspapers in 2003 to a majority online in 2019, illustrated with a before-and-after pie chart comparison. The slide provides detailed annotations about key players in the online classified market.
Competitive Landscape
Media & Entertainment
Examines the transition of classified ad revenues from traditional newspapers to online platforms, identifying key players that dominate the new market landscape. This slide is valuable for strategic planning in media and advertising, providing insights into market dynamics and potential areas for investment or innovation.
market shift, classified ads, online platforms, media strategy, competitive analysis
false
Competitive Landscape
Media & Entertainment
Multiple Chart
Accenture
Add to my slides
Remove from favorites
Contains flow chart and icons illustrating three major market trends affecting the financial sector.
Strategic Planning
Financial Services
Outlines key trends shaping the market, such as the growth of B2B, competitive B2C environments, and alternative payments.
market shifts, B2B growth, competition, B2C, payments
false
Strategic Planning
Financial Services
Pillar
BCG
Add to my slides
Remove from favorites
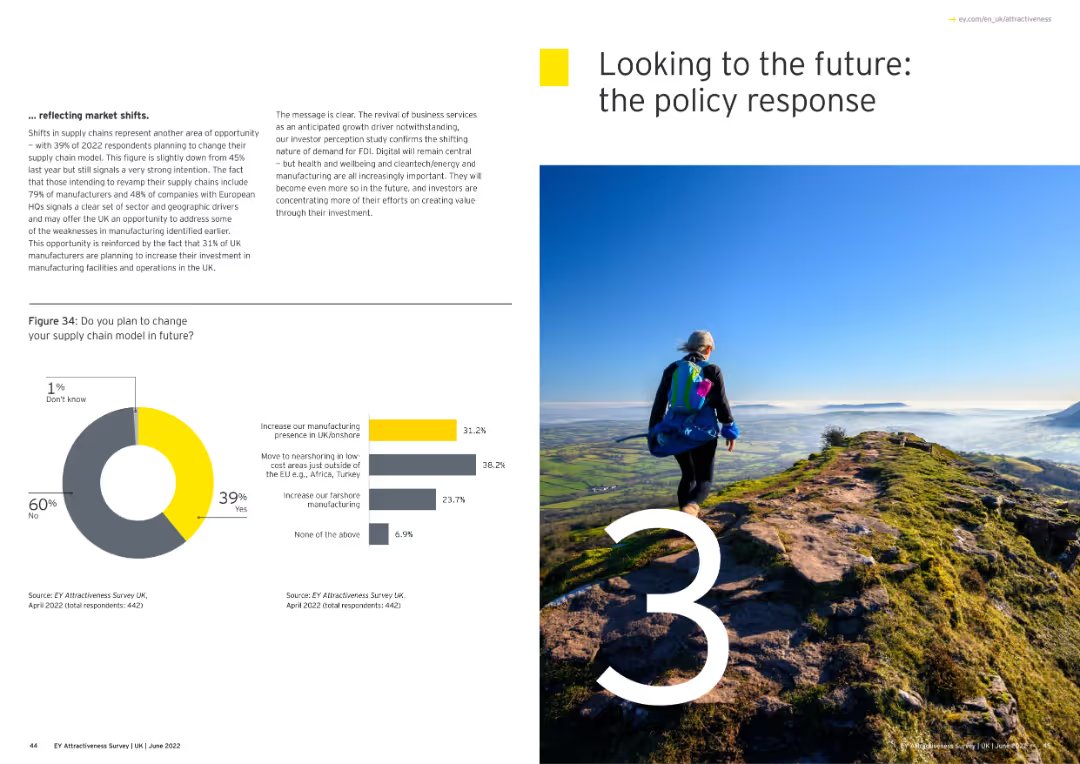
Text and an image of a person hiking. The text discusses market shifts and supply chain models. The layout is balanced with a clean design.
Strategic Planning
Financial Services
The slide addresses policy responses and strategic shifts in market and supply chain models, emphasizing future planning.
market shifts, supply chain, policy response, strategic planning, hiking image
false
Strategic Planning
Financial Services
Multiple Chart
EY
Add to my slides
Remove from favorites
Slide includes column charts comparing preparedness across industries and regions.
Risk Assessment and Management
Financial Services
Evaluates the preparedness of executives in various industries for market shocks in 2024, highlighting significant improvements, especially in Asia.
market shocks, preparedness, industry, regional
false
Risk Assessment and Management
Financial Services
Multiple Chart
BCG
Add to my slides
Remove from favorites
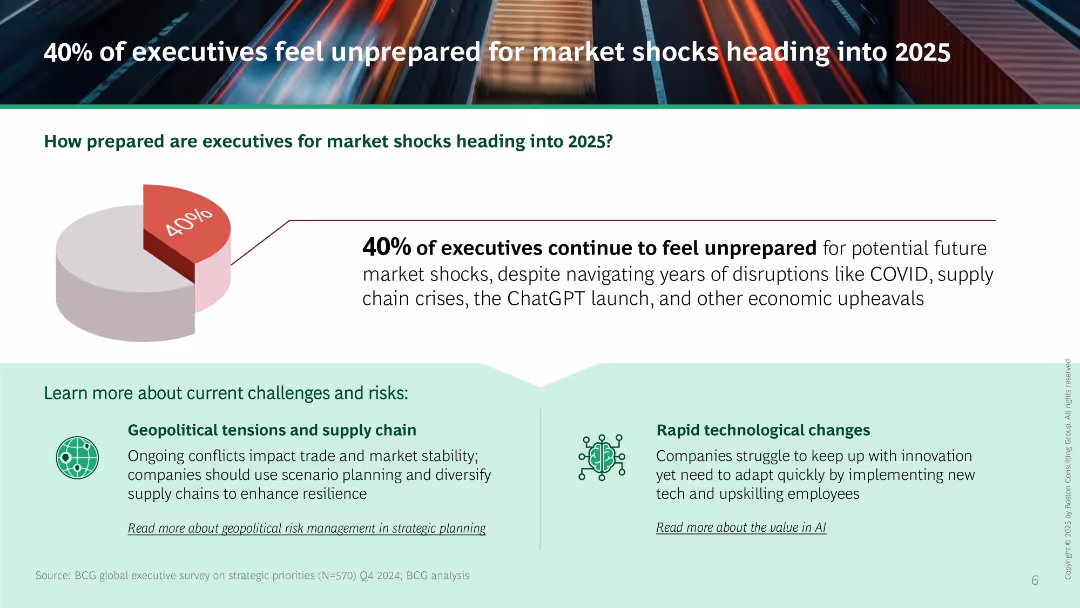
Left-aligned 3D pie chart; center quote with stat; two boxes below outlining challenges: Geopolitical tensions and Tech changes.
Risk Assessment and Management
Professional Services
This slide highlights that 40% of executives feel unprepared for future market shocks. It cites prior disruptions like COVID and AI shifts, and lists key risks such as geopolitical instability and rapid technological change, suggesting scenario planning and upskilling as mitigants.
market shocks, risk, scenario planning, technological disruption, executive concerns, preparedness
false
Risk Assessment and Management
Professional Services
Mixed Chart
BCG
Add to my slides
Remove from favorites
The slide includes vertical bar graphs with predictions for market size in 2020, sub-sector growth drivers are also listed to provide context to the data showcased.
Financial Performance
Consumer Goods
This slide provides an estimation of the digital consumer spending in various sectors by 2020, emphasizing the growth in market size and the sub-sectors driving this growth, such as apparel & consumer electronics, and international air travel.
Market size, digital spending, consumer electronics, air travel
false
Financial Performance
Consumer Goods
Single Chart
BCG
Add to my slides
Remove from favorites
Slide presents column charts showing transaction volumes and serviceable markets with projections up to 2027.
Market Analysis and Trends
Financial Services
Examines the serviceable market and growth potential in the B2B and B2C sectors with future growth projections.
market size, growth projections, B2B, B2C, SAM
false
Market Analysis and Trends
Financial Services
Multiple Chart
BCG
Add to my slides
Remove from favorites
Column chart showing Ipsos US revenues vs. US research market with additional text highlighting key market metrics. Text boxes with various market statistics and competitive positions.
Market Analysis and Trends
Professional Services
Presents data on the market size, competitive landscape, and opportunities for growth in the US research market. Highlights Ipsos' position and potential for expansion.
Market Size, Growth, US Research Market, Ipsos, Revenues
false
Market Analysis and Trends
Professional Services
Mixed Chart
IPSOS
Add to my slides
Remove from favorites
A treemap chart displaying market sizes of private K-12 education in key cities globally, segmented by fee points.
Market Analysis and Trends
Education & Training
Illustrates the market size for private K-12 education with high fee points across key cities worldwide.
market size, K-12, fee point, private, global
false
Market Analysis and Trends
Education & Training
Mixed Chart
LEK
Add to my slides
Remove from favorites
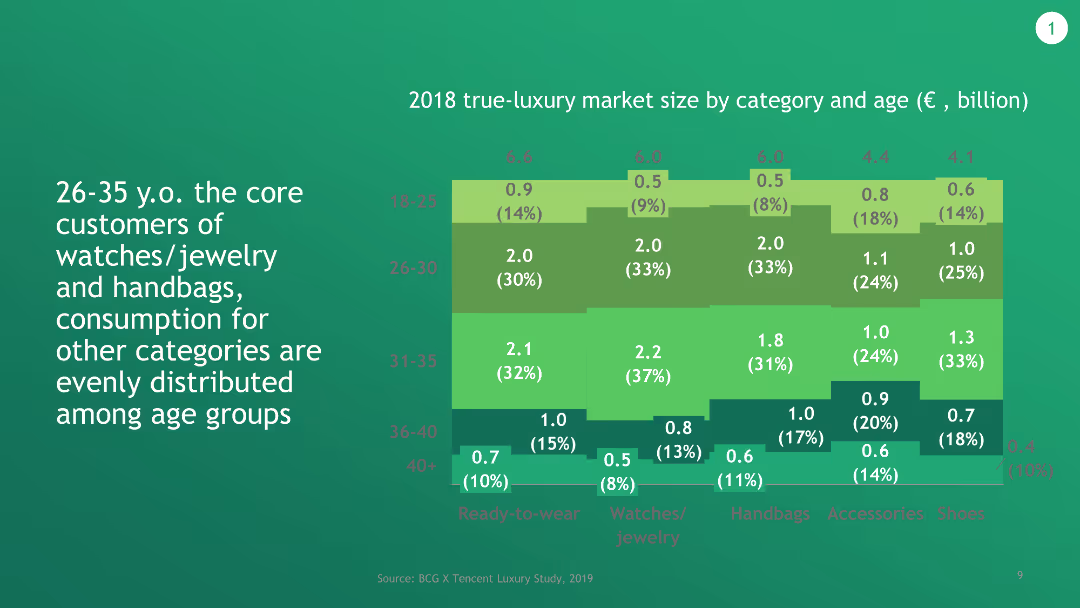
A stacked bar chart depicting the market size of true luxury goods by category and age group for 2018. Various shades of green highlight different segments.
Market Analysis and Trends
Consumer Goods
The slide illustrates the market size of true luxury goods by category and age group, highlighting the core consumers for each category in 2018.
Market Size, Luxury Goods, Age Groups, True Luxury, 2018 Data
false
Market Analysis and Trends
Consumer Goods
Mixed Chart
BCG
Add to my slides
Remove from favorites
This slide features a prominent title, a column chart on the left comparing FICC and Equities revenues from 2017 and 2021, and a list of focus areas for discussions on the right. It uses blue as the primary color for charts and bullet points, with a clean, professional layout.
Financial Performance
Financial Services
The slide communicates the maintenance of a leading position in the Markets franchise by JPMorgan Chase, with comparative revenue data from 2017 and 2021 and strategic focus areas. It could be used in financial performance reviews or strategic meetings to discuss key business areas and strategies for growth and customer relationship management.
Markets, Revenue, FICC, Equities, Leadership, Strategy, Growth, Performance, Clients, Trading
false
Financial Performance
Financial Services
Mixed Chart
JP Morgan
Add to my slides
Remove from favorites
The slide consists of several sections, including icons and charts. It features rankings and a pie chart for client distribution. The color palette is blue, gray, and white, maintaining brand consistency.
Market Analysis and Trends
Financial Services
The slide discusses continued growth through comprehensive services and client excellence at JPMorgan Chase. With statistics on market share, revenue, and client distribution, it's useful for presentations that aim to highlight market leadership, growth trends, and commitment to client service across various business sectors.
Markets, Revenue, Growth, Excellence, Client Distribution, Global Expertise, Service Provider, Omnichannel, Trading
false
Market Analysis and Trends
Financial Services
Mixed Chart
JP Morgan
Add to my slides
Remove from favorites
Slide shows stacked column charts comparing regional market outlooks.
Market Analysis and Trends
Financial Services
Compares executive views on market stability in North America, Europe, and Asia from 2023 to 2024, showing increased optimism in Asia and shifts in Europe.
market stability, optimism, executive views, regional comparison
false
Market Analysis and Trends
Financial Services
Multiple Chart
BCG
Add to my slides
Remove from favorites
Utilizes icons and brief points to propose strategies like ecosystem development and scaling for market leadership.
Strategic Planning
Retail & E-commerce
Suggests actionable strategies for businesses to dominate in competitive markets, focusing on digital and network growth.
market strategies, digital growth, ecosystem, scaling
false
Strategic Planning
Retail & E-commerce
Pillar
BCG
Add to my slides
Remove from favorites
Detailed flow diagram breaking down the Goldman Sachs Ecosystem into components like 'Pricing Capabilities' and 'Clients'.
Investment Analysis
Financial Services
Analyzes new market structures within credit systems, suitable for financial analysts or investors.
Market Structure, Credit, Goldman Sachs, Ecosystem, Analysis
false
Investment Analysis
Financial Services
Diagram
Goldman Sachs
Add to my slides
Remove from favorites
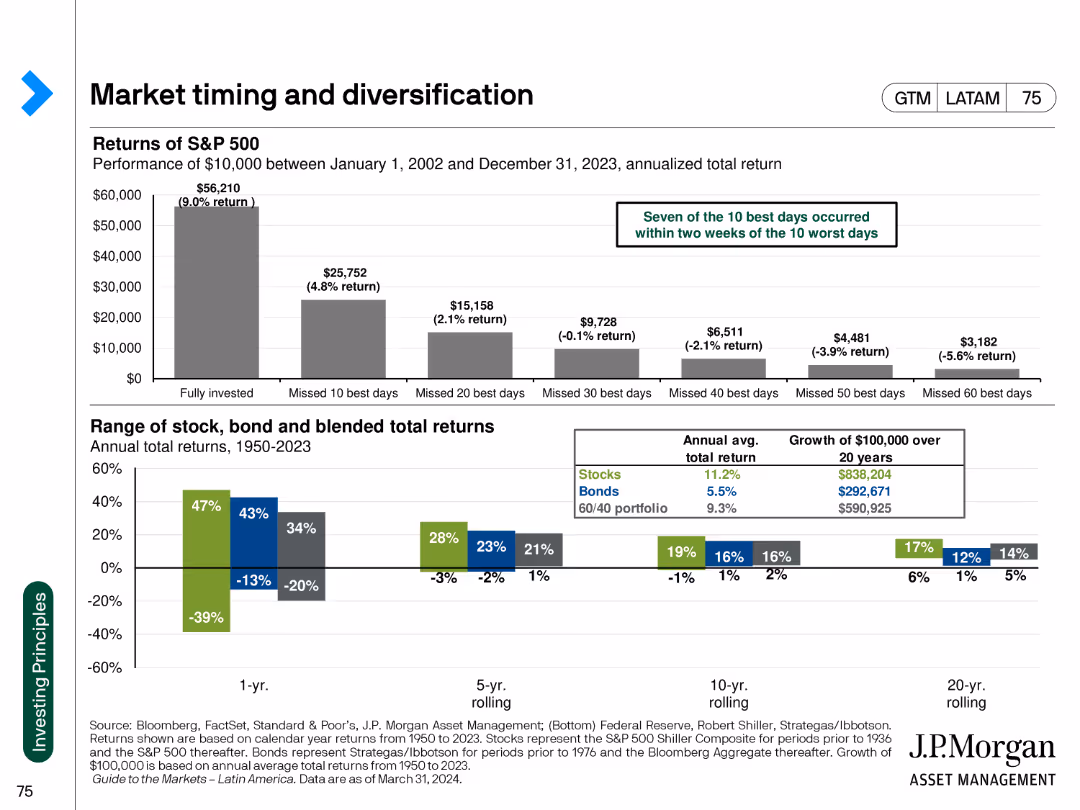
The slide features bar charts analyzing the impact of market timing on S&P 500 returns and the range of returns for stock, bond, and blended portfolios.
Strategic Planning
Financial Services
This slide explores the importance of market timing and diversification in investment strategies, providing data on returns for different portfolios over time.
market timing, diversification, S&P 500, investment returns, portfolio analysis, strategic planning, financial performance, risk management
false
Strategic Planning
Financial Services
Multiple Chart
JP Morgan
Add to my slides
Remove from favorites
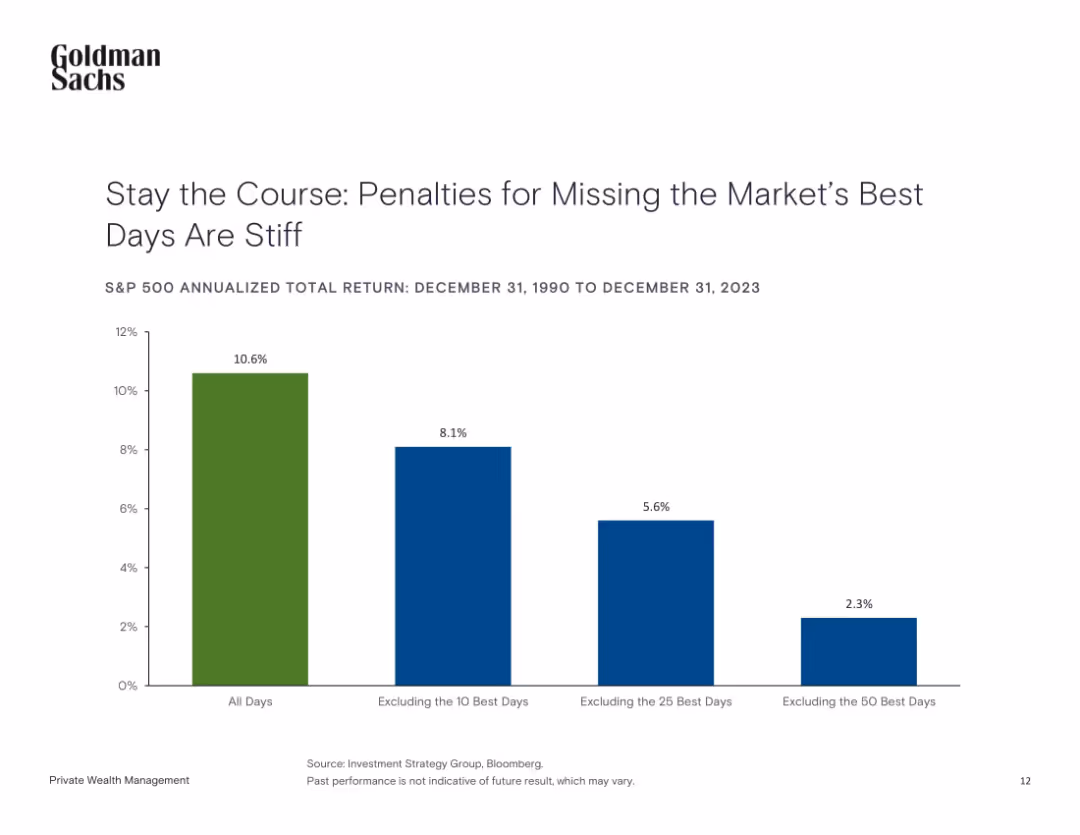
Bar chart comparing annualized returns with and without best trading days.
Risk Assessment and Management
Financial Services
This slide shows the consequences of missing the best-performing days in the market over a 30+ year span. It emphasizes long-term investment discipline by comparing total returns with different exclusions.
market timing, investment discipline, risk, annual returns, S&P 500, volatility, performance analysis
false
Risk Assessment and Management
Financial Services
Single Chart
Goldman Sachs
Add to my slides
Remove from favorites
Two-panel slide with a line chart (S&P 500 index) and a bar chart (return ranges)
Market Analysis and Trends
Financial Services
Examines implications of investing at market all-time highs, using S&P 500 data. Highlights that investing at highs still yields strong long-term returns on average.
market timing, S&P 500, all-time highs, forward returns, historical performance, investment behavior, risk, long-term gains
false
Market Analysis and Trends
Financial Services
Multiple Chart
JP Morgan
Add to my slides
Remove from favorites
Line graph comparing the market capitalization trends of the top five companies over a decade, with detailed annotations and specific performance highlights of notable companies.
Market Analysis and Trends
Financial Services
Highlights market trends and the stability of the top companies despite economic fluctuations, offering insights into business resilience and market dynamics.
market trends, company performance, business analysis
false
Market Analysis and Trends
Financial Services
Multiple Chart
PwC/Strategy&
Add to my slides
Remove from favorites
Column chart showcasing changes in market capitalization of the top 100 companies, with accompanying analysis text and highlights of significant data points.
Market Analysis and Trends
Financial Services
Discusses the impact of fiscal policies on corporate valuations, offering insights into economic trends and investor confidence.
market trends, fiscal policies, investor confidence
false
Market Analysis and Trends
Financial Services
Mixed Chart
PwC/Strategy&
Add to my slides
Remove from favorites
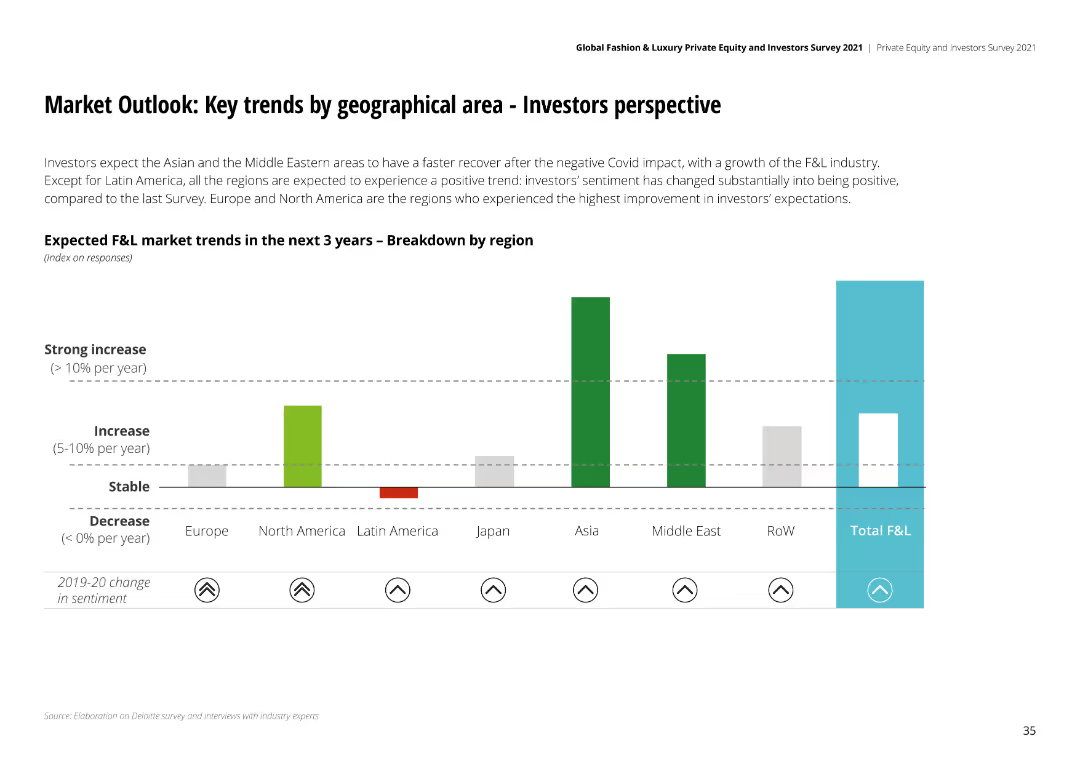
Column chart showing expected F&L market trends over the next 3 years by region, with bars indicating strong increase, increase, stable, and decrease for each region.
Market Analysis and Trends
Financial Services
Investors expect faster recovery in Asia and Middle East post-Covid-19, with a positive trend in all regions except Latin America. Europe and North America show strong investor sentiment.
Market trends, geographical analysis, investor sentiment, Covid-19 recovery, regional trends
false
Market Analysis and Trends
Financial Services
Single Chart
Deloitte
Add to my slides
Remove from favorites
A timeline chart tracking market trends from 1985 to 2025, using graphical representations of pyramids to depict segments like "Aspirational" and "Accessible".
Market Analysis and Trends
Consumer Goods
Analyzes the diminishing relevance of traditional market segmentation in the luxury goods industry over time, highlighting major shifts and consumer growth metrics.
Market Trends, Luxury, Segments
false
Market Analysis and Trends
Consumer Goods
Single Chart
Bain
Add to my slides
Remove from favorites
The slide consists of a large green column chart showing the growth of the UK platform market from FY15 to FY18, accompanied by a key trends list and a forecast column chart for global asset management flows. It uses shades of green, white, and black for clear differentiation between sections. Visual elements include column charts, with corresponding annotations for clarity. The layout is clean and allows each section to stand out individually.
Market Analysis and Trends
Financial Services
The slide details the growth of the UK platform market driven by structural trends and projects the composition of global asset management flows. This would be useful in financial market trend analyses or investment strategy presentations.
Market Trends, Platform Growth, Asset Management, UK Financial Market, Investment Forecast, Pension Consolidation, Financial Planning
false
Market Analysis and Trends
Financial Services
Multiple Chart
Morgan Stanley
Add to my slides
Remove from favorites
The slide is primarily text-based with a bold black and blue color scheme. It presents two columns of bullet-pointed text: 'The facts today (examples)' on the left and 'How this may evolve' on the right. The top of the slide features a title and a symbol of two circular arrows, suggesting a cycle or evolution.
Market Analysis and Trends
Professional Services
This slide presents current economic and public health observations alongside speculative developments on how they might evolve, suggesting possible future trends. It serves as a thought-provoking examination for strategists and analysts when considering long-term impacts and changes in market dynamics.
market trends, public health, economic response, future speculation, long-term impact
false
Market Analysis and Trends
Professional Services
Header Horizontal
McKinsey
Add to my slides
Remove from favorites
This slide contains a stacked and regular column chart with a line chart in the center showing trends in upstream spending and contracting activity in the oil industry. The graphs are color-coded to differentiate between data types (e.g., offshore, onshore, shale oil) and years. Key figures are clearly labeled, and trend lines indicate changes over time. The slide's layout is structured to facilitate comparison between different sectors and time periods, enhancing the viewer's ability to quickly grasp market trends.
Market Analysis and Trends
Energy & Utilities
The slide presents an analysis of the recovery signs in the oil market, highlighting increasing upstream spending and contracting activity from 2014 to 2018. It aims to provide stakeholders with insights into market dynamics, supporting strategic planning or investment decisions. By showing historical trends and forecasts, it helps in understanding how Seadrill might align its operations to take advantage of emerging market opportunities.
market trends, recovery, oil industry, upstream spending, contracting, bar graphs, column charts, strategic planning, investment, Seadrill
false
Market Analysis and Trends
Energy & Utilities
Multiple Chart
Barclays
Add to my slides
Remove from favorites
Includes a column chart and text describing trends in satellite payload manufacturing and launches globally.
Market Analysis and Trends
Technology & Software
Explores global trends in the Earth Observation upstream market, including investments and technological advancements.
Market trends, satellite payloads, global scale, investments
false
Market Analysis and Trends
Technology & Software
Mixed Chart
PwC/Strategy&
Add to my slides
Remove from favorites
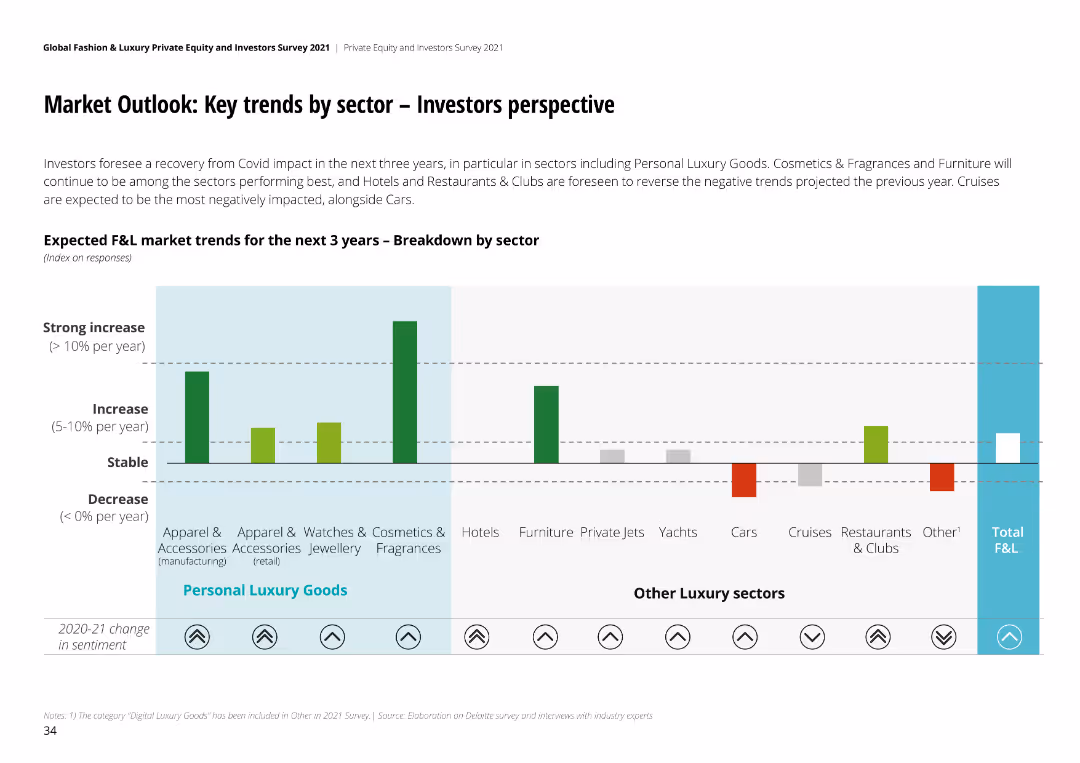
The slide includes a column chart with expected F&L market trends for the next three years, broken down by sector, and indicating expected changes.
Market Analysis and Trends
Consumer Goods
It forecasts market trends in the fashion and luxury sectors over the next three years, identifying sectors with expected growth and decline.
Market Trends, Sector, Forecast, F&L, Next Three Years
false
Market Analysis and Trends
Consumer Goods
Single Chart
Deloitte
Add to my slides
Remove from favorites
Two complex line graphs are overlaid with shaded areas representing the market trends for passenger and truck tires. Annotations and a legend are provided for clarity.
Market Analysis and Trends
Industrial & Manufacturing
The slide analyzes the year-to-date trends in tire markets, focusing on sell-in trends and projections. It highlights different scenarios and market responses, with particular attention to passenger and truck tire segments.
Market trends, Tire industry, Projections, Passenger vehicles, Trucks
false
Market Analysis and Trends
Industrial & Manufacturing
Multiple Chart
Morgan Stanley
Add to my slides
Remove from favorites
Circular diagram in the center with surrounding logos of companies serving different market segments (Citizens, Consumers, Patients, Professionals).
Competitive Landscape
Professional Services
Illustrates Ipsos' comprehensive market understanding by showing its relationships with various segments in the US market through a central human insights diagram.
Market Understanding, US Market, Segments, Ipsos, Insights
false
Competitive Landscape
Professional Services
Diagram
IPSOS
Add to my slides
Remove from favorites
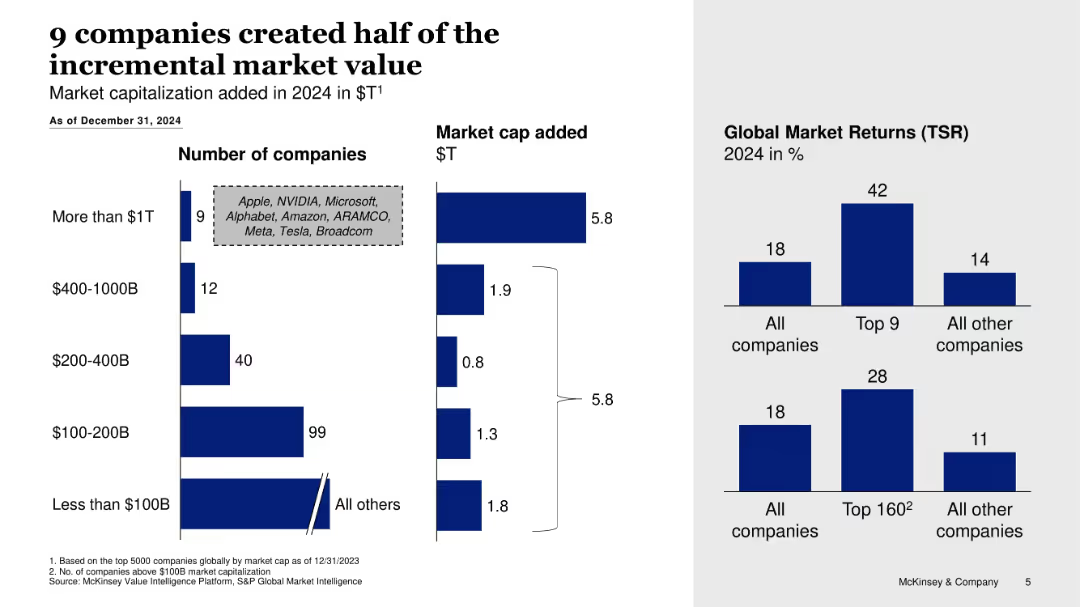
Clustered bar charts showing companies by market cap group, value added, and TSR comparison
Strategic Planning
Financial Services
Reveals that 9 large companies generated half of the market value growth in 2024, showing their outsized contribution to global returns and outperforming other firms.
market value, mega-cap, company performance, shareholder return, valuation concentration
false
Strategic Planning
Financial Services
Multiple Chart
McKinsey
Add to my slides
Remove from favorites
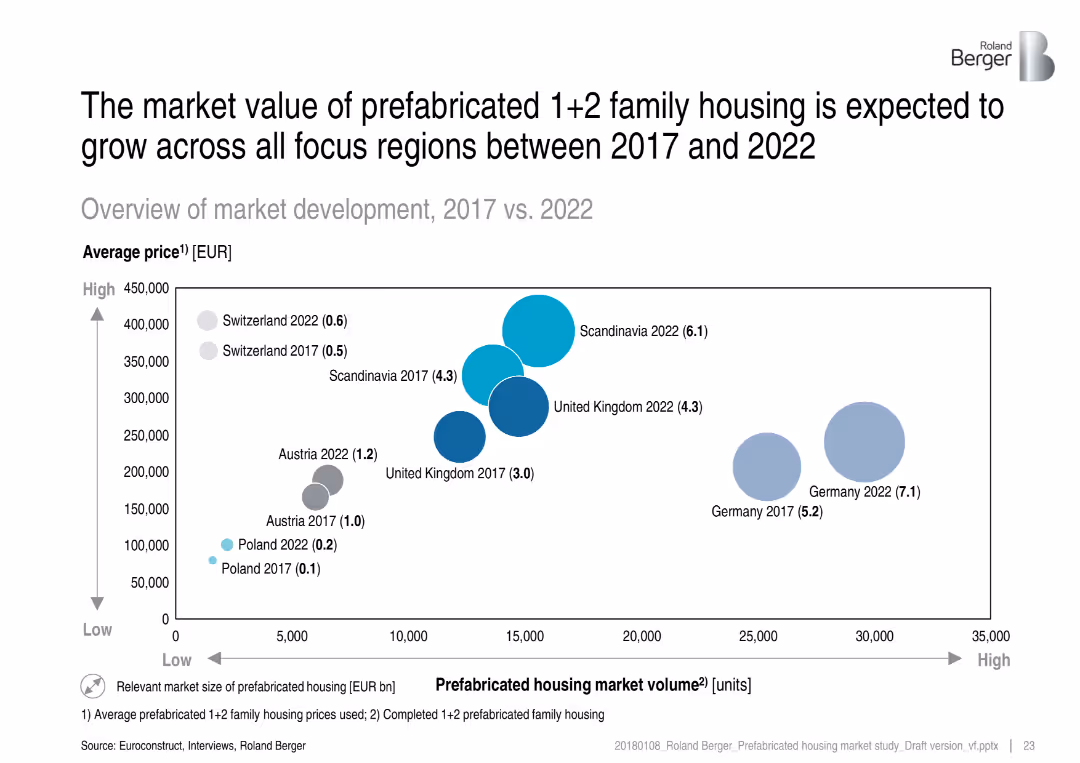
Bubble chart showing market volume vs. price comparison for 2017 and 2022, with bubble size indicating market size.
Investment Analysis
Real Estate & Construction
This slide forecasts market expansion for prefabricated family housing by 2022 across various regions. It shows both price and volume growth, identifying Germany and Scandinavia as leading markets with strong value and scale.
market value, prefabricated housing, forecast, regional comparison, family housing, price trends, volume
false
Investment Analysis
Real Estate & Construction
Single Chart
Roland Berger
Add to my slides
Remove from favorites
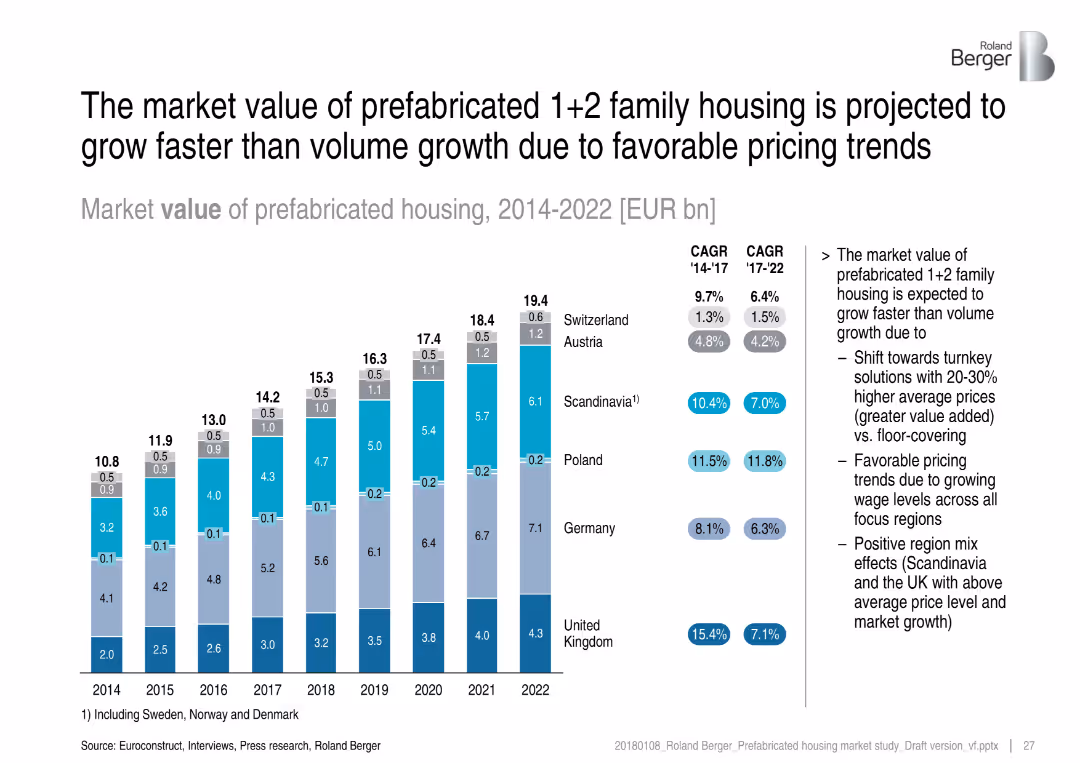
Stacked bar chart in euros by year and country, growth drivers listed on the right, CAGR values annotated
Market Analysis and Trends
Real Estate & Construction
The slide outlines market value growth for prefabricated 1+2 family housing from 2014 to 2022, showing that value is increasing faster than volume due to higher prices and premium solutions. The shift toward turnkey solutions and regional effects support this trend.
market value, prefabricated housing, pricing trends, CAGR, premium, turnkey, growth
false
Market Analysis and Trends
Real Estate & Construction
Mixed Chart
Roland Berger
Add to my slides
Remove from favorites
The slide includes a visual with a pie chart showing investor types, detailed text on net sellers, buyers, and net zero investors, and an image of a person analyzing documents. White background.
Risk Assessment and Management
Financial Services
This slide analyzes the effects of market volatility during COVID-19, categorizing investors into net sellers, buyers, and net zero, and detailing their financial assessments and strategies.
market volatility, net sellers, net buyers, investment strategies, COVID-19
false
Risk Assessment and Management
Financial Services
Multiple Chart
IPSOS
Add to my slides
Remove from favorites
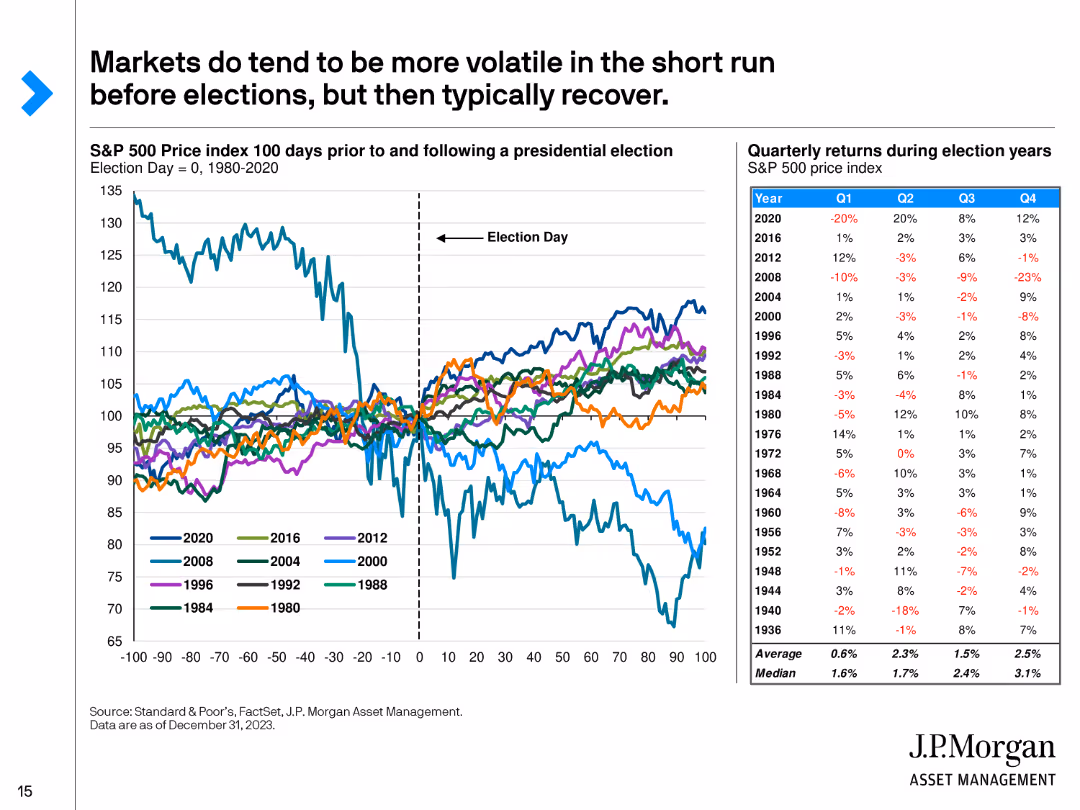
The slide includes a line chart showing the S&P 500 Price Index 100 days before and after presidential elections from 1980 to 2020, and a table of quarterly returns during election years.
Market Analysis and Trends
Financial Services
This slide analyzes market volatility around presidential elections, demonstrating that although markets can be volatile in the short term, they typically recover. It includes historical data and quarterly returns.
Market Volatility, Presidential Elections, Recovery, Historical Data, Analysis
false
Market Analysis and Trends
Financial Services
Mixed Chart
JP Morgan
Add to my slides
Remove from favorites
Multiple column charts showing M&A activities with Russian involvement by sector and deal type.
Mergers and Acquisitions
Transportation & Logistics
Focuses on Russian involvement in global M&A activities, especially in the transportation and logistics sectors.
M&A, Russia, Transportation, Logistics, Global, Activities, Involvement, Sector
false
Mergers and Acquisitions
Transportation & Logistics
Multiple Chart
PwC/Strategy&
Add to my slides
Remove from favorites
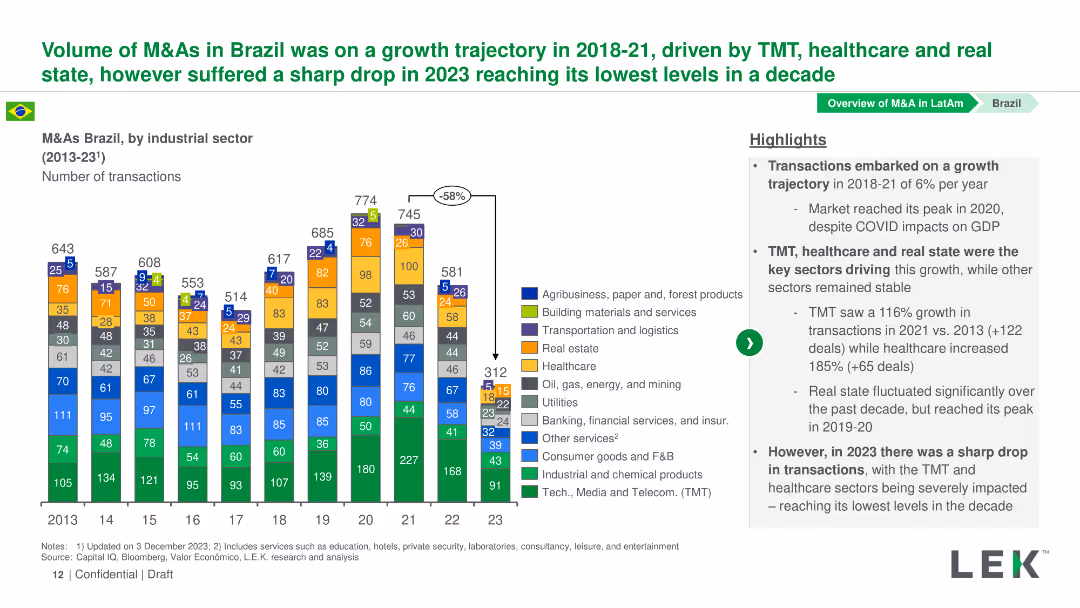
Column chart showing M&A transaction volumes by industrial sector in Brazil from 2013 to 2023, with highlights on growth and significant declines, especially in 2023.
Market Analysis and Trends
Financial Services
Details the growth trajectory of M&As in Brazil from 2018-2021, driven by TMT and healthcare, followed by a sharp decline in 2023, reaching the lowest levels in a decade.
M&As, Brazil, TMT, healthcare, transaction volumes
false
Market Analysis and Trends
Financial Services
Mixed Chart
LEK
Add to my slides
Remove from favorites
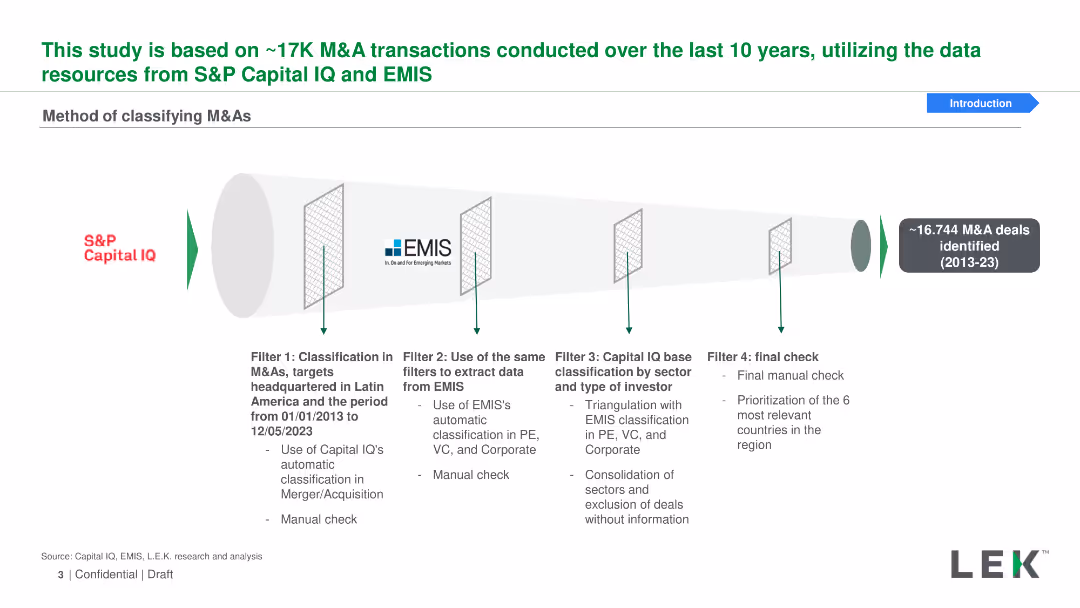
Funnel diagram with four filters for classifying M&As using data from S&P Capital IQ and EMIS, representing various stages of data filtration and classification.
Mergers and Acquisitions
Financial Services
Explains the method of classifying M&A transactions using data from S&P Capital IQ and EMIS, including filtering by region, investor type, and manual checks for accuracy.
M&As, classification, S&P Capital IQ, EMIS, filtering
false
Mergers and Acquisitions
Financial Services
Linear Flow
LEK
Add to my slides
Remove from favorites
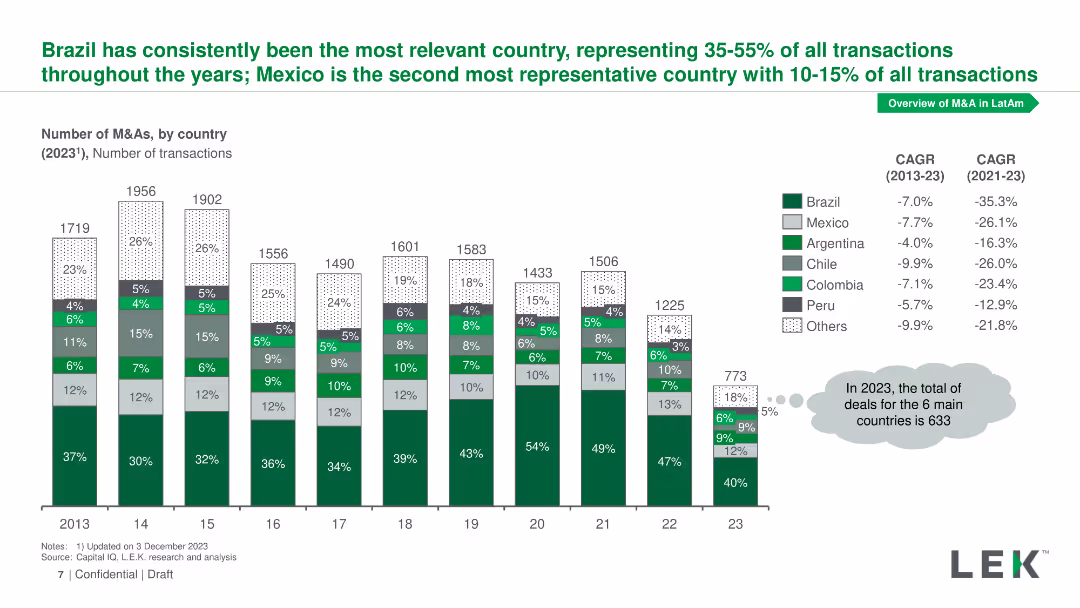
Column chart representing the number of M&As by country from 2013 to 2023, with percentages indicating each country's share of total transactions.
Market Analysis and Trends
Financial Services
Illustrates the distribution of M&A transactions by country, highlighting Brazil and Mexico as leading countries, with CAGR values for 2013-2023 and 2021-2023.
M&As, country distribution, Brazil, Mexico, CAGR
false
Market Analysis and Trends
Financial Services
Mixed Chart
LEK
Add to my slides
Remove from favorites
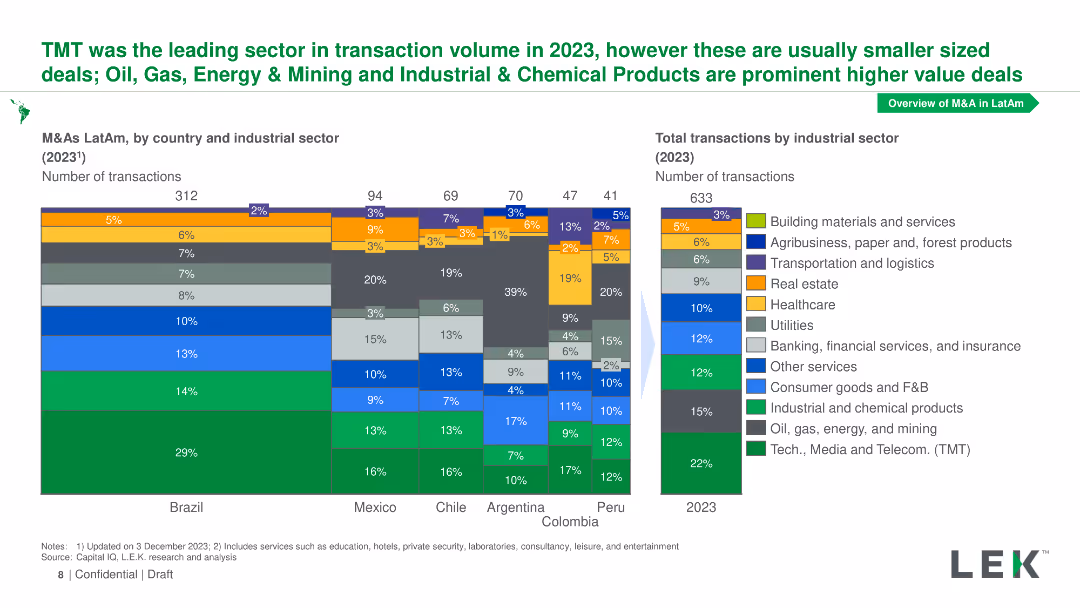
Stacked bar chart showing M&As by industrial sector for several Latin American countries in 2023, with a breakdown of sectors per country and total transactions.
Market Analysis and Trends
Financial Services
Shows M&A transaction volumes by industrial sector for Brazil, Mexico, Chile, Argentina, Peru, and Colombia, highlighting TMT as the leading sector in 2023.
M&As, industrial sector, Latin America, TMT, transaction volumes
false
Market Analysis and Trends
Financial Services
Multiple Chart
LEK
Add to my slides
Remove from favorites
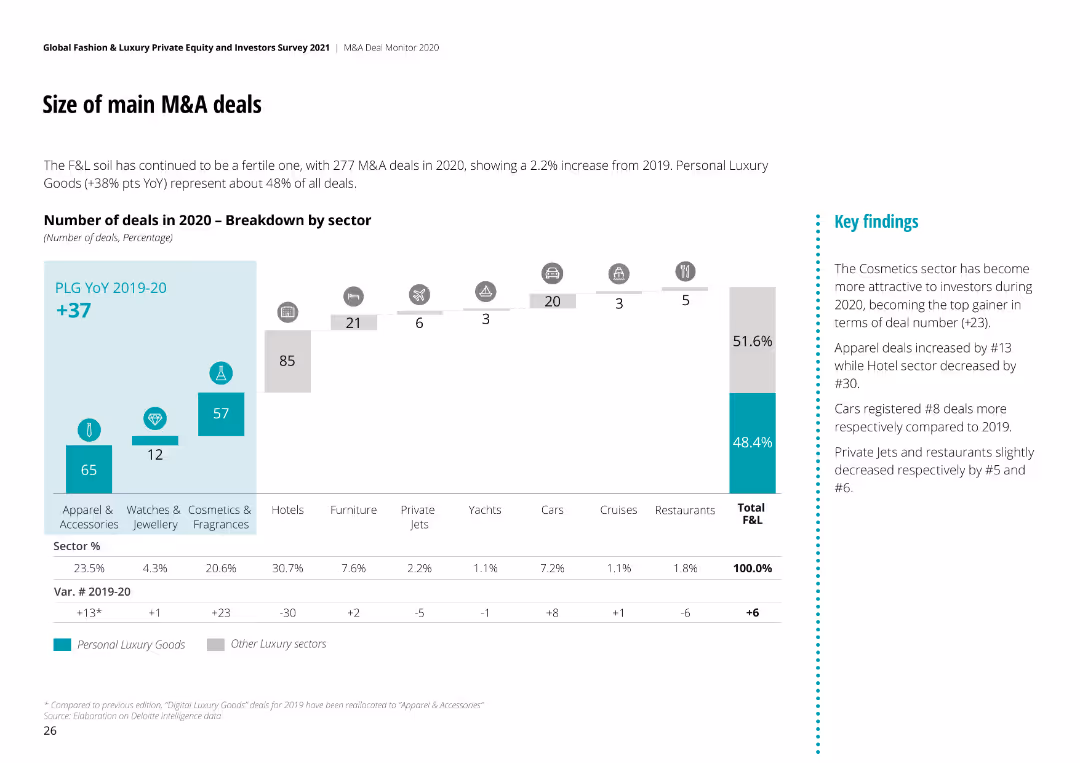
The slide has a bar chart showing the number of M&A deals in 2020 by sector, with a breakdown for Personal Luxury Goods and other sectors.
Market Analysis and Trends
Consumer Goods
It highlights the size of M&A deals in 2020, with a focus on personal luxury goods and other luxury sectors.
M&A, Size, Deals, 2020, Personal Luxury, Sectors
false
Market Analysis and Trends
Consumer Goods
Mixed Chart
Deloitte
Add to my slides
Remove from favorites
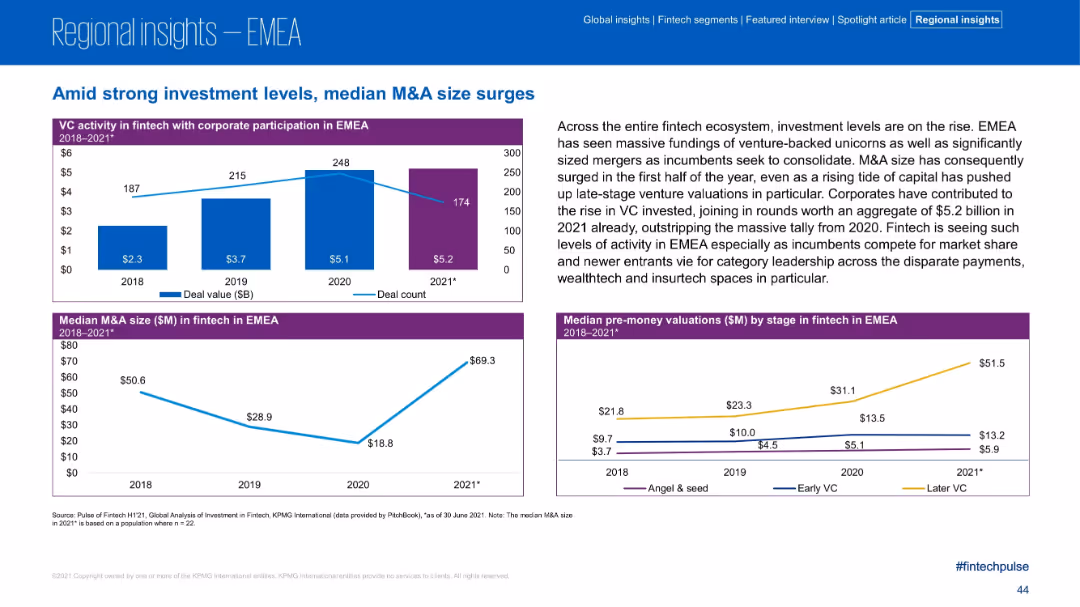
Top chart on corporate VC participation, bottom charts on M&A size and pre-money valuations; narrative highlights surge in unicorns and M&A sizes
Investment Analysis
Financial Services
EMEA fintech saw increased deal sizes and valuations in H1 2021, with rising corporate VC participation. Median M&A deal size jumped to $69.3M. The slide attributes the growth to unicorn funding and consolidation among incumbents. Later VC stages saw a notable rise in pre-money valuations.
M&A size, unicorns, EMEA, corporate VC, fintech growth, valuations, later stage VC, consolidation
false
Investment Analysis
Financial Services
Multiple Chart
KPMG
Add to my slides
Remove from favorites
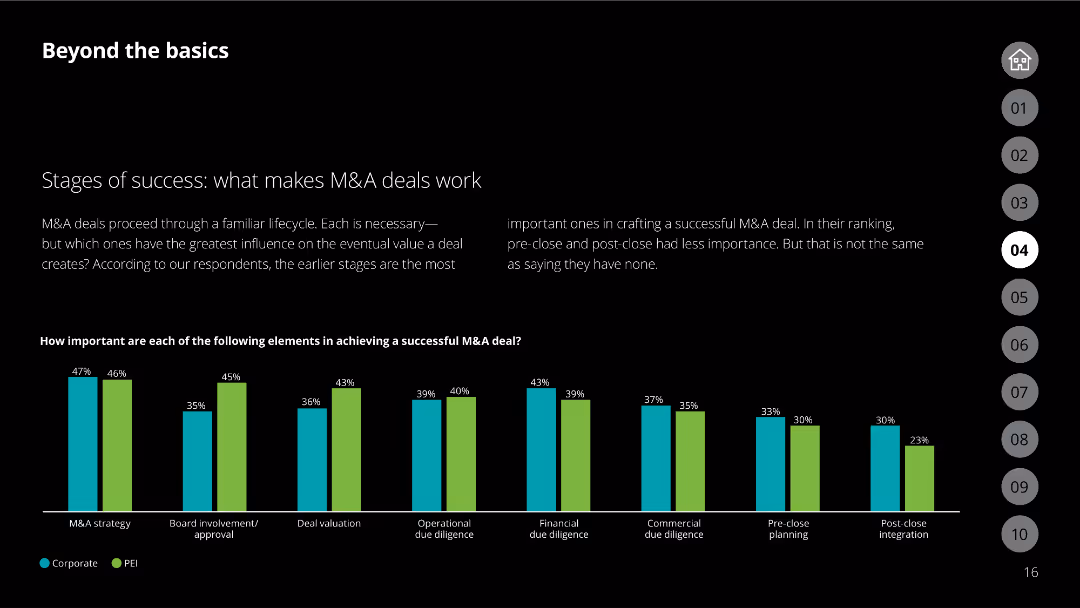
The slide features a column chart comparing corporate and PEI views on the importance of various M&A stages.
Mergers and Acquisitions
Financial Services
Discusses the stages of M&A deals and their influence on the success of these deals according to respondents.
M&A stages, corporate, PEI, deal success, stages importance
false
Mergers and Acquisitions
Financial Services
Single Chart
Deloitte
Add to my slides
Remove from favorites
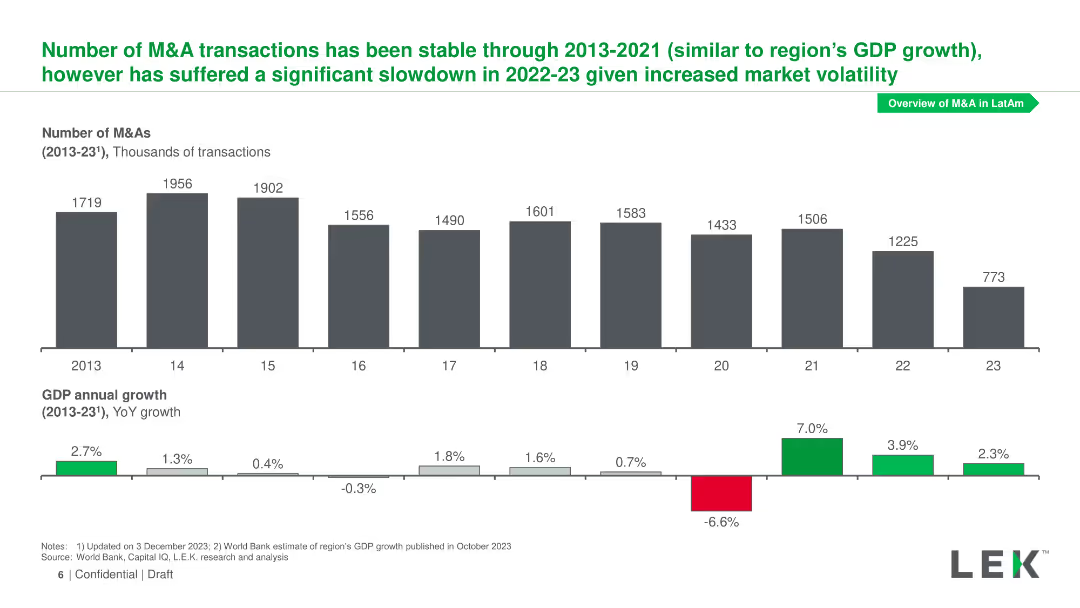
Column chart showing the number of M&A transactions from 2013 to 2023 and line chart displaying GDP annual growth over the same period.
Market Analysis and Trends
Financial Services
The slide displays M&A transaction trends from 2013-2023 alongside GDP growth rates, noting a significant slowdown in 2022-23 due to market volatility.
M&As, transaction trends, GDP growth, market volatility
false
Market Analysis and Trends
Financial Services
Multiple Chart
LEK
Add to my slides
Remove from favorites
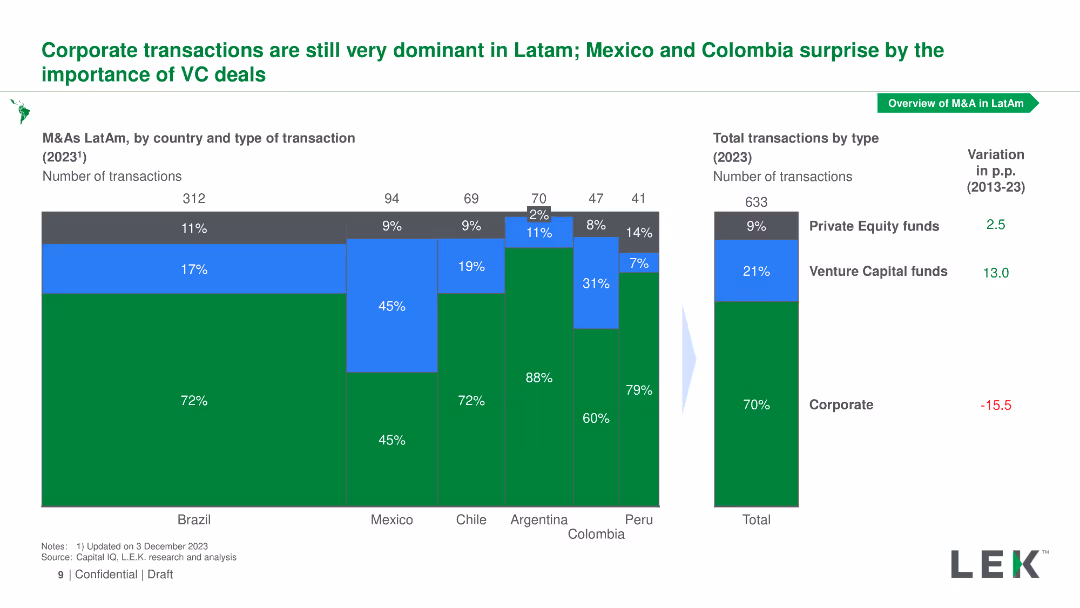
Stacked bar chart displaying M&A transaction types (corporate, private equity, venture capital) for Latin American countries in 2023, with total transactions and variation.
Market Analysis and Trends
Financial Services
Highlights the dominance of corporate transactions in Latin America, with notable VC activity in Mexico and Colombia, and presents total transactions by type for 2023.
M&As, transaction types, Latin America, VC activity, corporate transactions
false
Market Analysis and Trends
Financial Services
Multiple Chart
LEK
Add to my slides
Remove from favorites
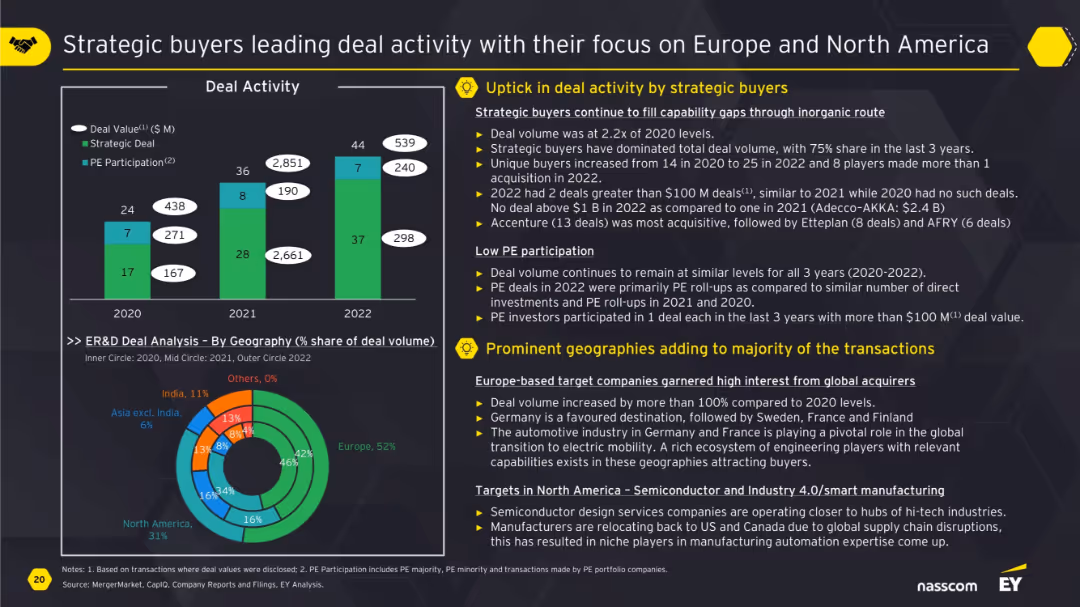
Vertical bar chart on deal activity with strategic vs PE split, pie chart by geography, and supporting text explanations.
Mergers and Acquisitions
Professional Services
This slide shows strategic buyers dominating deal activity over PE firms, particularly in Europe and North America. It discusses deal value growth, unique buyer activity, and key regions. Europe-based targets are increasingly attractive due to capability gaps, while PE participation remains low and focused.
M&A, strategic buyers, deal activity, Europe, North America, PE participation, ER&D
false
Mergers and Acquisitions
Professional Services
Multiple Chart
EY
Add to my slides
Remove from favorites
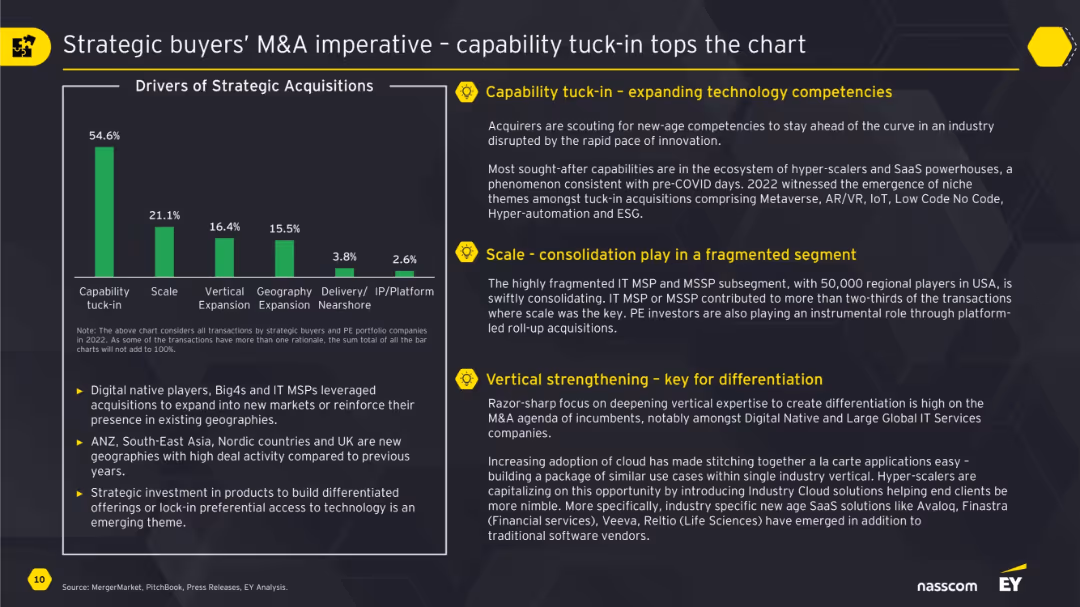
Bar chart on left visualizes strategic acquisition drivers; three yellow-highlighted text boxes explain capability tuck-in, scale, and vertical strengthening strategies.
Mergers and Acquisitions
Technology & Software
The slide explains the strategic rationale behind acquisitions, with “capability tuck-in” emerging as the most common driver (54.6%). It outlines how companies aim to expand tech competencies and consolidate fragmented segments. The commentary further details vertical integration strategies and the importance of innovation through M&A, especially in tech-related areas.
M&A, strategic buyers, tuck-in, vertical, acquisitions, tech strategy
false
Mergers and Acquisitions
Technology & Software
Mixed Chart
EY
Add to my slides
Remove from favorites
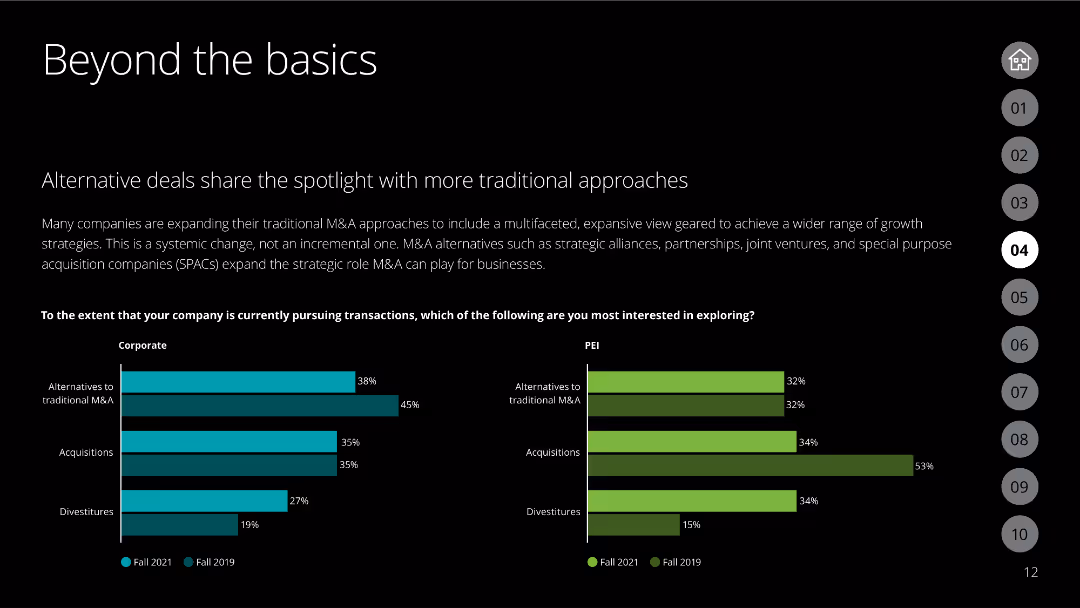
The slide features a column chart comparing corporate and PEI interests in different M&A transaction types in 2021 vs. 2019.
Market Analysis and Trends
Financial Services
Discusses the interest in traditional vs. alternative M&A strategies among corporations and PEIs.
M&A strategies, corporate, PEI, alternative deals, traditional M&A
false
Market Analysis and Trends
Financial Services
Multiple Chart
Deloitte
Add to my slides
Remove from favorites
This slide uses text blocks and icons to depict strategies for using M&A to improve core business functions, move into adjacent markets, and create new business segments. It features logos of notable companies to illustrate examples of each strategy.
Strategic Planning
Financial Services
Outlines how M&A is strategically used to enhance company offerings, enter new markets, and create innovative business models. It emphasizes the role of M&A in corporate strategy with practical examples from well-known companies.
M&A, Strategy, Business Improvement, New Markets, Innovation, Companies
false
Strategic Planning
Financial Services
Diagram
Deloitte
Add to my slides
Remove from favorites
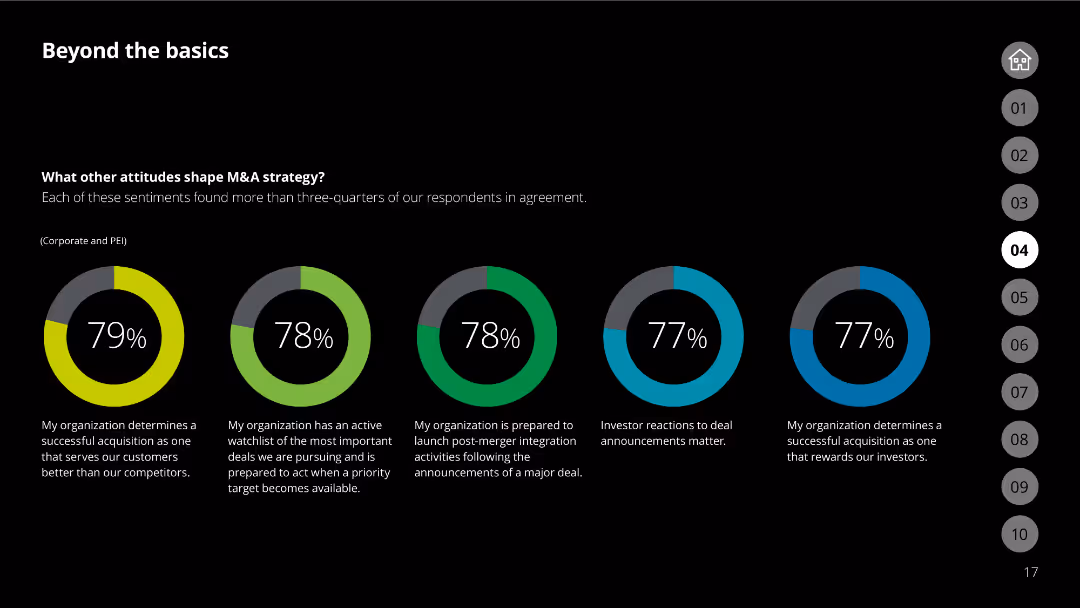
The slide has multiple donut charts showing respondent attitudes towards different M&A strategies.
Strategic Planning
Financial Services
Explores various attitudes that shape M&A strategies among corporations and PEIs.
M&A strategy, corporate, PEI, attitudes, survey
false
Strategic Planning
Financial Services
Multiple Chart
Deloitte
Add to my slides
Remove from favorites
Presents a textual and graphical analysis on a gray and green background, illustrating various strategic options within M&A transactions, categorized into improving core business, moving into adjacent markets, and creating new business opportunities.
Mergers and Acquisitions
Financial Services
Describes the strategic use of M&A as a mechanism for corporate growth and innovation, detailing different approaches like enhancing core operations, entering adjacent markets, and launching new ventures.
M&A, Strategy, Growth, Innovation, Markets, Business, Opportunities
false
Mergers and Acquisitions
Financial Services
Table
Deloitte
Add to my slides
Remove from favorites
This slide presents a complex layout with a mix of text boxes, icons, and background images, highlighting key mergers and acquisitions (M&A) activities and their strategic importance. It includes timeline elements and bullet-point lists to describe major deals and steps within the company's strategy. The slide has the Michelin logo and uses the company's color scheme.
Strategic Planning
Industrial & Manufacturing
This slide reviews major M&A activities and strategic steps taken by Michelin, focusing on enhancing its portfolio in line with the "Michelin in Motion 2030 strategy." It is likely used in strategic business meetings or investor relations presentations to discuss company growth and strategic direction.
M&A, strategy, Michelin, portfolio, deals, innovation, acquisition, growth, planning, management
false
Strategic Planning
Industrial & Manufacturing
Pillar
Morgan Stanley
Add to my slides
Remove from favorites
The slide displays a segmented circular diagram (pie chart) breaking down the components deemed crucial for successful M&A deals as identified by 1,000 executives, such as effective integration and proper target identification.
Mergers and Acquisitions
Financial Services
Illustrates the key factors identified by executives that contribute to the success of M&A deals, emphasizing effective integration and accurate target valuation.
M&A, Success, Factors, Integration, Target Identification, Executives
false
Mergers and Acquisitions
Financial Services
Single Chart
Deloitte
Add to my slides
Remove from favorites
The slide includes column charts showing the number of take-private transactions and the level of tech corporate divestitures from 2019 to 2023, and a commentary section.
Mergers and Acquisitions
Financial Services
The slide discusses the expected rebound in M&A transactions, driven by opportunities in take-private transactions, carve-outs, and add-on acquisitions, supported by a stable interest rate outlook.
M&A, take-private, interest rates, carve-outs, acquisitions
false
Mergers and Acquisitions
Financial Services
Multiple Chart
Accenture
Add to my slides
Remove from favorites
The slide features a column chart with four red bars representing average match rates by DCR type, and a quote from a Director, Retailer on the left.
Risk Assessment and Management
Professional Services
Discusses the challenges of maintaining match rates due to signal loss and privacy legislation, showing various DCR types and their average match rates in a column chart.
match rates, DCR types, privacy legislation, signal loss, efficacy
false
Risk Assessment and Management
Professional Services
Mixed Chart
IPSOS
Add to my slides
Remove from favorites
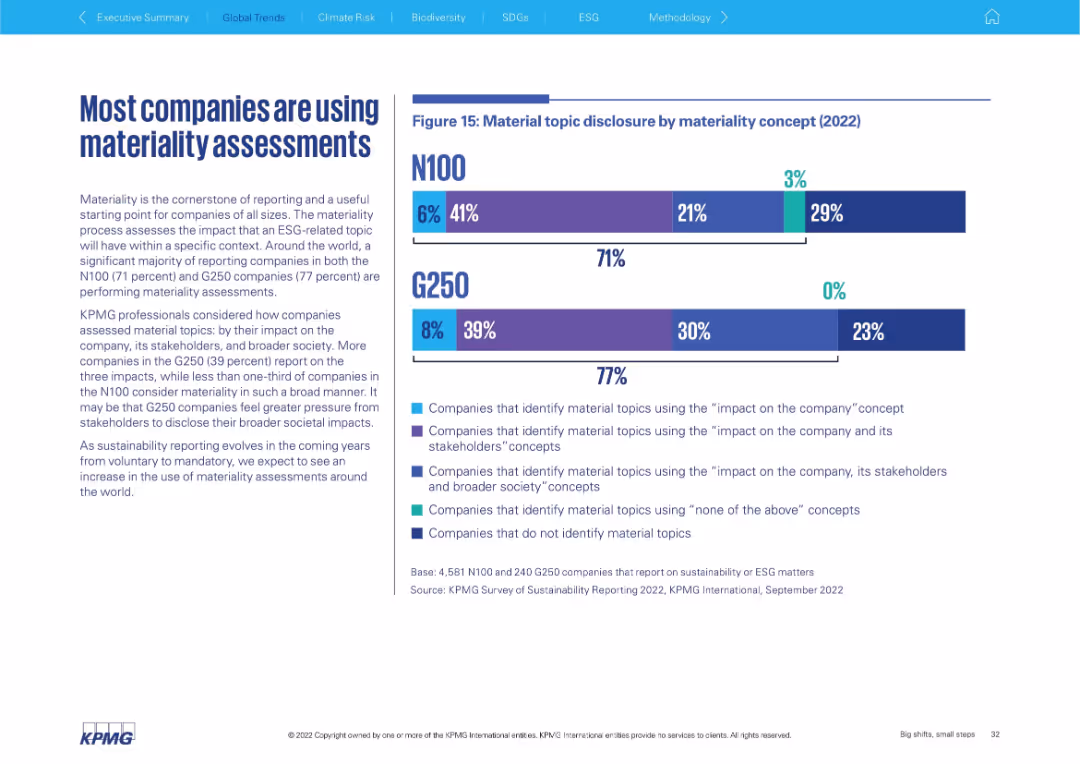
Left side text explains materiality; right side shows stacked bar charts for N100 and G250 based on assessment concepts
Risk Assessment and Management
Professional Services
Explains the growing use of materiality assessments in ESG reporting, breaking down how companies assess impacts (on company, stakeholders, society). Shows 71% of N100 and 77% of G250 perform such assessments.
materiality, ESG, impact assessment, N100, G250, stakeholder engagement, risk analysis
false
Risk Assessment and Management
Professional Services
Mixed Chart
KPMG
Add to my slides
Remove from favorites
A complex slide with a dual-axis matrix comparing the importance of ESG topics to external stakeholders and to the company, using a gradient color scale and descriptive text.
Market Analysis and Trends
Professional Services
The slide assesses the materiality of ESG issues, comparing stakeholder and company views. It might be used in strategic planning to identify and prioritize areas of focus for sustainability efforts.
Materiality, ESG Topics, Stakeholder Importance, Company Priority
false
Market Analysis and Trends
Professional Services
Table
McKinsey
Add to my slides
Remove from favorites
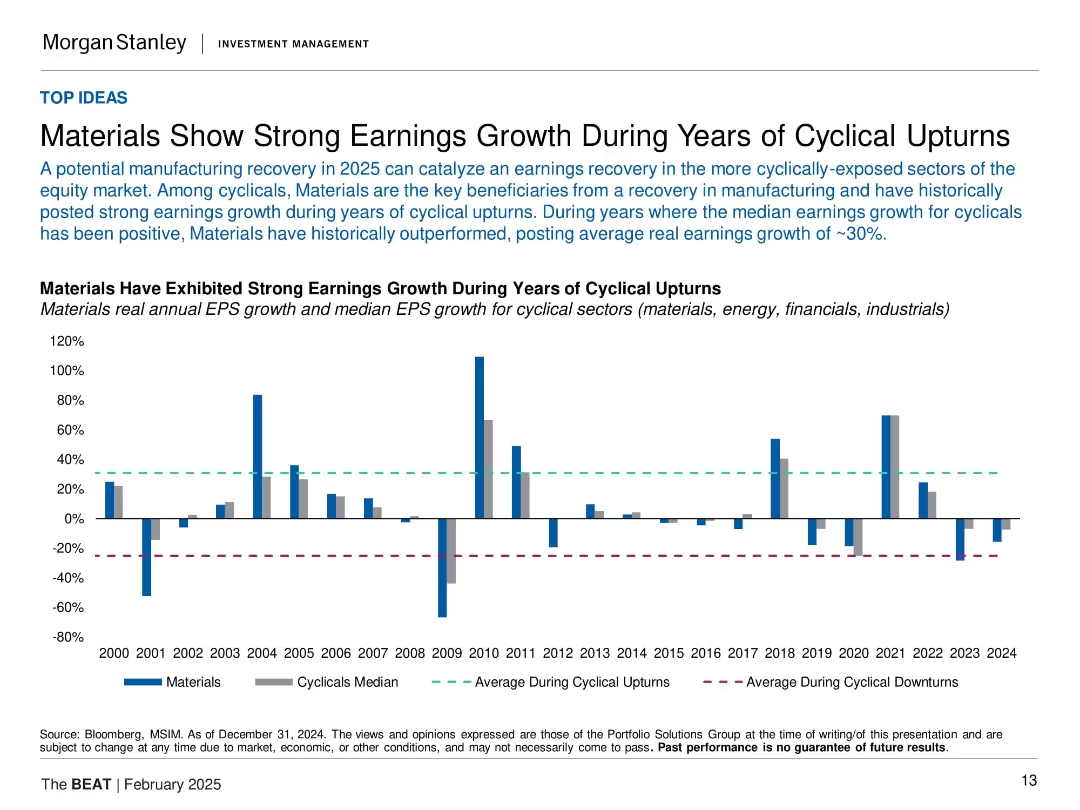
Bar chart (2000–2024) showing EPS growth for materials vs. cyclicals median. Includes dashed lines for upturn and downturn averages.
Financial Performance
Industrial & Manufacturing
The slide presents materials as a high-performing sector during cyclical economic recoveries. It includes EPS growth data, contrasting materials performance against other cyclicals and highlighting that in years of economic upturns, materials often post above-average earnings. The visual underscores the strategic importance of timing in sector allocation.
materials sector, earnings growth, cyclicals, economic cycle, EPS, upturn, industrials, recovery investing
false
Financial Performance
Industrial & Manufacturing
Single Chart
Morgan Stanley
Add to my slides
Remove from favorites
Continues the format of the previous slide with added industries. The layout is consistent, featuring a list format with industry icons.
Market Analysis and Trends
Transportation & Logistics
Continues from the previous slide, discussing the secondary implications of mobility trends on various industries and the shifts in resource demands and value pools.
materials usage, electricity demand, solutions integration, claims portfolio, city infrastructure
false
Market Analysis and Trends
Transportation & Logistics
Header Vertical
McKinsey
Add to my slides
Remove from favorites
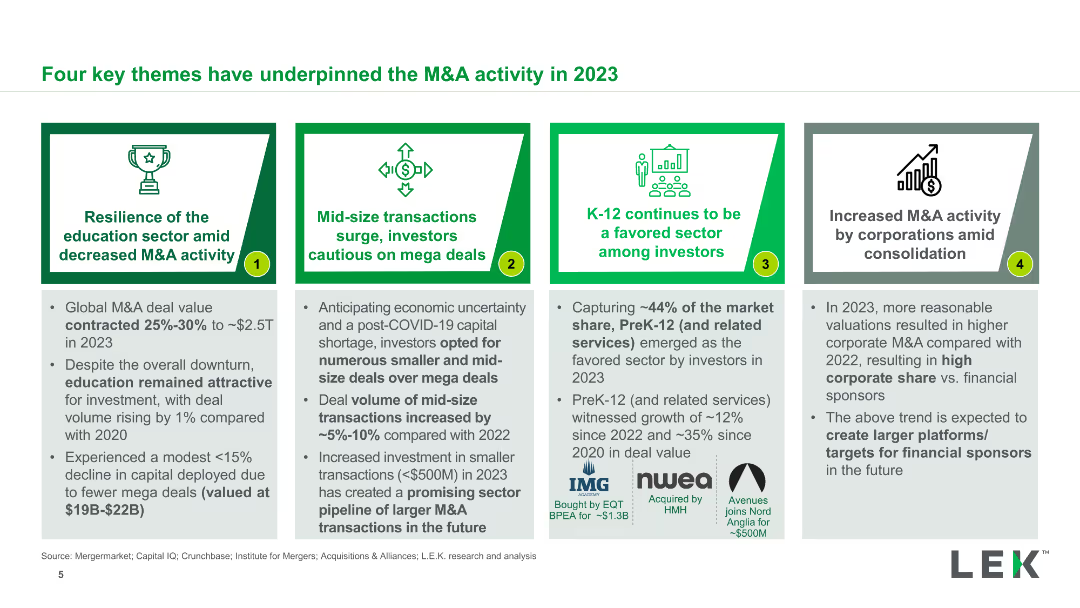
Four comparative boxes each detailing a key theme influencing M&A activity in 2023, such as resilience of the education sector, mid-size transaction surge, etc.
Strategic Planning
Financial Services
This slide outlines four major themes that influenced M&A activities in 2023, including sector resilience, the surge in mid-size transactions, and investor caution on mega deals.
M&A, Themes, 2023, Education, Mid-size Transactions, Strategic Planning
false
Strategic Planning
Financial Services
Pillar
LEK
Add to my slides
Remove from favorites
Features two tables with top M&A deals over three years, alongside bar graphs comparing investment sectors in the Philippines.
Investment Analysis
Financial Services
Summarizes the top M&A deals in the Philippines from 2018 to 2020, focusing on deal value and key players, alongside sector investments.
M&A, top deals, Philippines, investment, sectors, deal value
false
Investment Analysis
Financial Services
Mixed Chart
Deloitte
Add to my slides
Remove from favorites
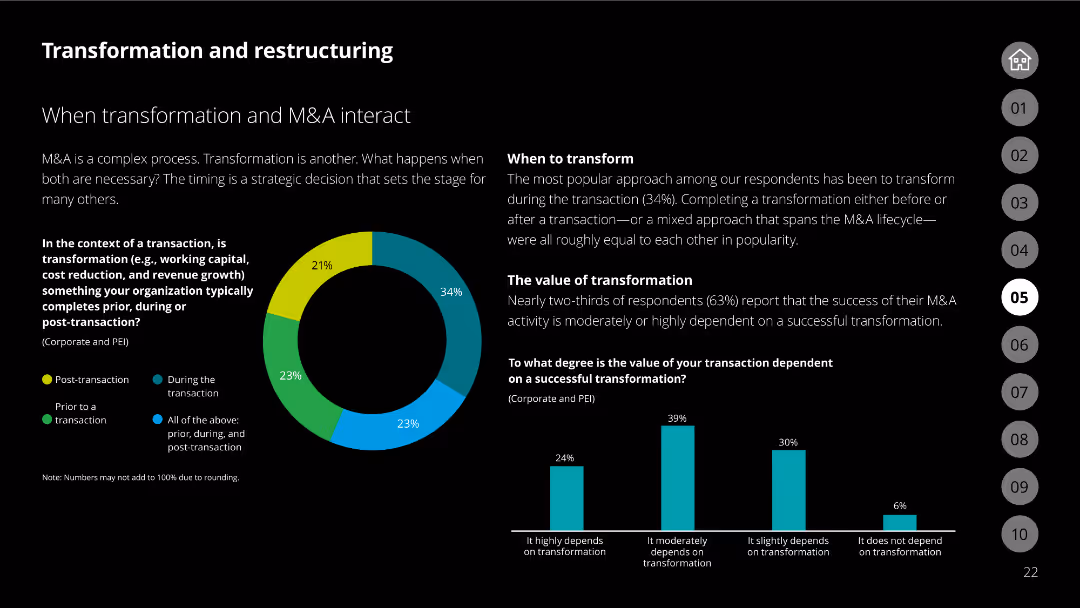
Slide with a pie chart and column charts, detailing the interaction between transformation and M&A. Highlights approaches and dependency on successful transformation.
Mergers and Acquisitions
Financial Services
This slide explores the relationship between transformation and M&A, presenting data on timing, transformation dependency, and the value placed on successful transactions.
M&A, transformation, interaction, timing, value, dependency, charts, pie chart, column chart
false
Mergers and Acquisitions
Financial Services
Multiple Chart
Deloitte
Add to my slides
Remove from favorites
Column charts displaying median deal valuations in T&L subsectors over several years, with a focus on recent trends.
Mergers and Acquisitions
Transportation & Logistics
Reviews valuation trends in T&L M&A, highlighting how economic conditions affect deal evaluations.
M&A, Transportation, Logistics, Valuation, Deals, Trends, Economic, Subsectors
false
Mergers and Acquisitions
Transportation & Logistics
Multiple Chart
PwC/Strategy&
Add to my slides
Remove from favorites
Features a column chart showing the trends in global M&A volumes from 2002-2018 and a circular diagram depicting the expectations of organizations regarding the number of deals in the next 12 months, split by 2018 and 2019 data.
Mergers and Acquisitions
Financial Services
Summarizes global M&A trends, highlighting the increase in transaction volumes over time and the anticipations for future deals. It provides a historical context to understand the growing significance of M&A activities.
M&A, Trends, Global, Future, Deals, Volumes, Growth, Expectations
false
Mergers and Acquisitions
Financial Services
Multiple Chart
Deloitte
Add to my slides
Remove from favorites
Column chart detailing merger and acquisition trends in the Philippines, against a background image of power lines at sunset.
Mergers and Acquisitions
Financial Services
Discusses trends in M&A activity from 2018 to 2020, highlighting a decrease in deal volume and value, with focus on high-value transactions.
M&A, trends, Philippines, deal volume, high-value, pandemic impact, financial services
false
Mergers and Acquisitions
Financial Services
Mixed Chart
Deloitte
Add to my slides
Remove from favorites
The slide features four maturity curves comparing conditioning, pretreatment, conversion technologies, and biofuels maturity levels. Each curve shows the progression from research to mature technology, highlighting key processes and technologies at different maturity stages.
Technology and Digital Transformation
Energy & Utilities
This slide illustrates the maturity levels of various bioenergy technologies, including conditioning, pretreatment, conversion, and biofuels, showing their development stages from research to mature deployment.
maturity curve, conditioning technologies, pretreatment, conversion, biofuels, research, deployment, maturity levels
false
Technology and Digital Transformation
Energy & Utilities
Multiple Chart
Kearney
Add to my slides
Remove from favorites
Previous
Next
You don't have any favorites yet.
Please wait loading your favorites slides...
Create a FREE account to continue browsing
Receive Instant Access to 1,000+ slides from companies like McKinsey, Google, and Goldman Sachs
First Name
Last Name
Email
Password
I agree to all
Terms & Privacy Policy
Thank you! Your submission has been received!
Oops! Something went wrong while submitting the form.
Have an account?
Sign in
Upgrade to PRO to Save slides
Advanced Search and Filters
Access to 15,000+ slides
Access to Category Pages
Save/Bookmark Slides
PowerPoint Template Library
Pick a Plan
MONTHLY
$12/month
Billed every month, Cancel anytime.
YEARLY
$9/year
Billed $108 annually, Cancel anytime.
Checkout for $12/month
Checkout for $108/yr
Secured by Stripe | AES-256 bit encryption