My Account
My Slides
Search by Category
Pricing
Templates
View All Templates
Download Template Slides
✦ AI Search
Feedback
Login
Logout
Get Started
Browse all Slides
Browse all Slides
Create a FREE Account
Instant access to 1,000+ real slides from top companies like McKinsey, BCG, Goldman Sachs, Google and many more!
First Name
Last Name
Email
Password
I agree to all
Terms & Privacy Policy
Thank you! Your submission has been received!
Oops! Something went wrong while submitting the form.
Have an account?
Sign in
Saved Slides
Total No. of slides saved
0
↻ Refresh
✖ Clear all
Features column charts detailing newspaper and magazine revenue trends globally and in India from 2020 to 2025.
Market Analysis and Trends
Media & Entertainment
Analyzes declining global trends in newspaper and magazine revenues with a contrasting slight growth in India.
newspaper, magazines, revenue decline, India growth, global trend, 2025 forecast, media industry
false
Market Analysis and Trends
Media & Entertainment
Multiple Chart
PwC/Strategy&
Add to my slides
Remove from favorites
Features column charts and a stacked bar chart detailing news access numbers and frequency in Western Europe.
Market Analysis and Trends
Media & Entertainment
Highlights the growth in news readership and frequency of news access in Western Europe, emphasizing an engaged and informed public.
news readership, Western Europe, engagement, frequency, access numbers, growth, public inform, media analysis, trends
false
Market Analysis and Trends
Media & Entertainment
Multiple Chart
Accenture
Add to my slides
Remove from favorites
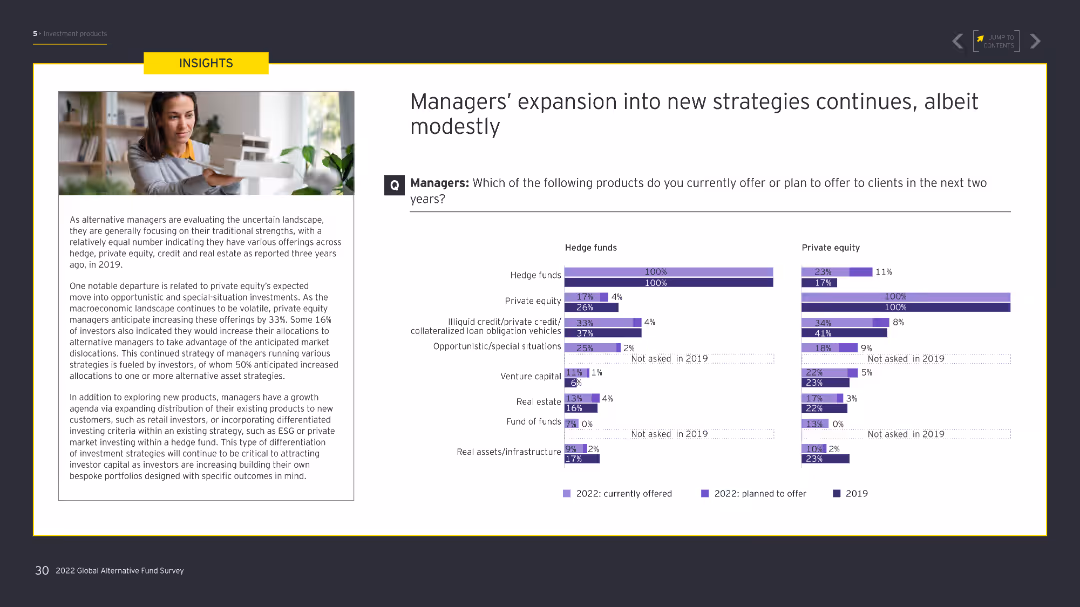
The slide features two bar charts comparing current and planned product offerings by hedge funds and private equity. An image on the left shows a professional working with a laptop. The charts use shades of blue and purple.
Strategic Planning
Financial Services
The slide highlights the moderate expansion into new strategies by managers, focusing on product offerings in hedge funds and private equity, with some managers planning to increase allocations to alternative asset strategies.
New strategies, hedge funds, private equity, product offerings, strategic planning
false
Strategic Planning
Financial Services
Multiple Chart
EY
Add to my slides
Remove from favorites
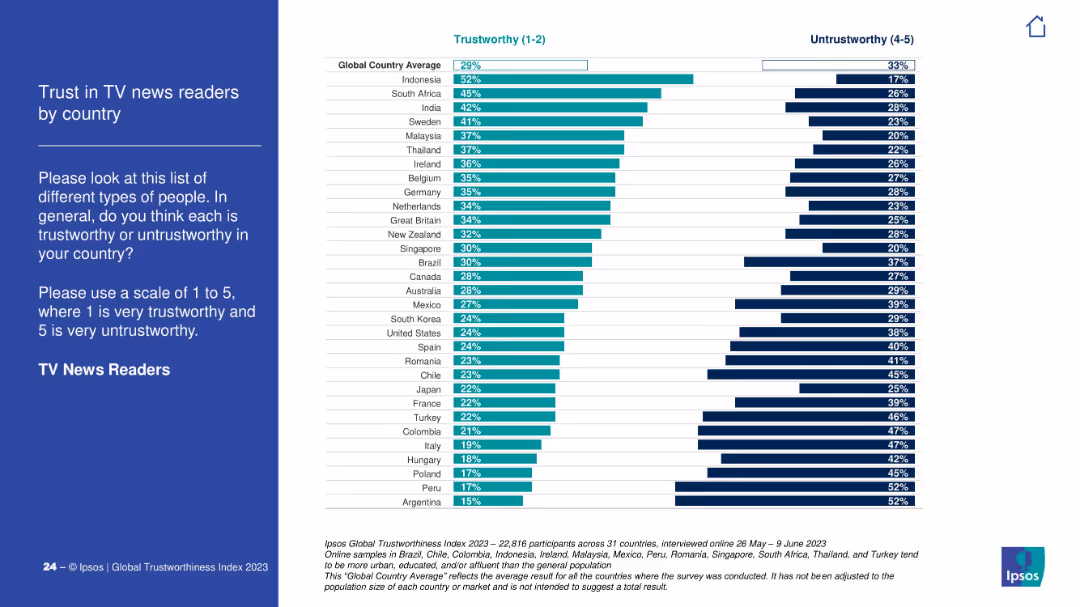
Similar layout as previous: blue sidebar on left, bar chart on right comparing trustworthy and untrustworthy scores for TV news readers across countries.
Market Analysis and Trends
Media & Entertainment
This slide displays comparative trust levels in TV news readers globally. Indonesia and South Africa rank highest in trust, while Argentina ranks lowest.
news, TV anchors, credibility, country comparison, Ipsos, media trust, 2023, survey
false
Market Analysis and Trends
Media & Entertainment
Mixed Chart
IPSOS
Add to my slides
Remove from favorites
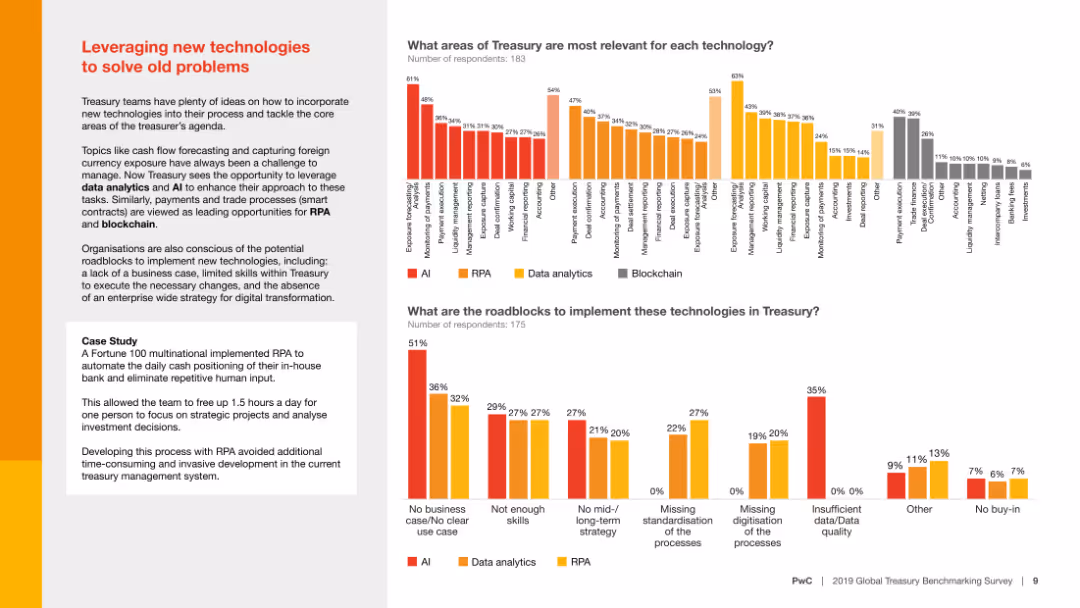
Column charts comparing areas of treasury relevance and roadblocks for implementing technologies like AI, RPA, and data analytics, with a case study example included.
Technology and Digital Transformation
Financial Services
The slide analyzes how new technologies can solve traditional treasury problems, highlighting the relevance of different technologies and potential implementation roadblocks.
New technologies, treasury, AI, RPA, data analytics
false
Technology and Digital Transformation
Financial Services
Multiple Chart
PwC/Strategy&
Add to my slides
Remove from favorites
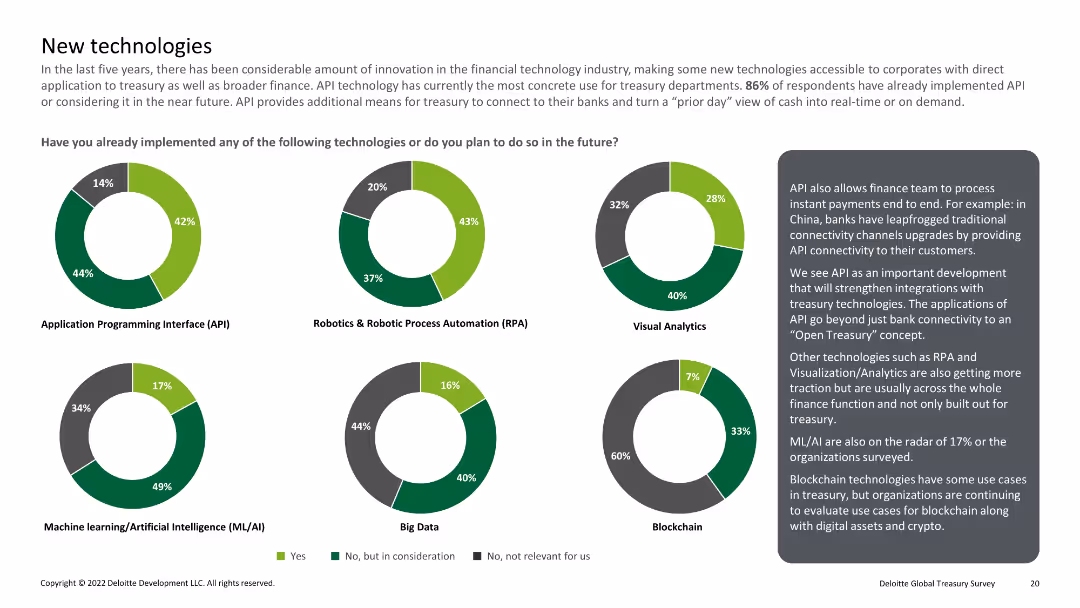
Multiple pie charts showing implementation of technologies like API, RPA, visual analytics, ML/AI, big data, and blockchain
Technology and Digital Transformation
Financial Services
Reviews the implementation of emerging technologies in treasury departments, including APIs, RPA, and blockchain.
New technology, API, RPA, ML/AI, blockchain
false
Technology and Digital Transformation
Financial Services
Multiple Chart
Deloitte
Add to my slides
Remove from favorites
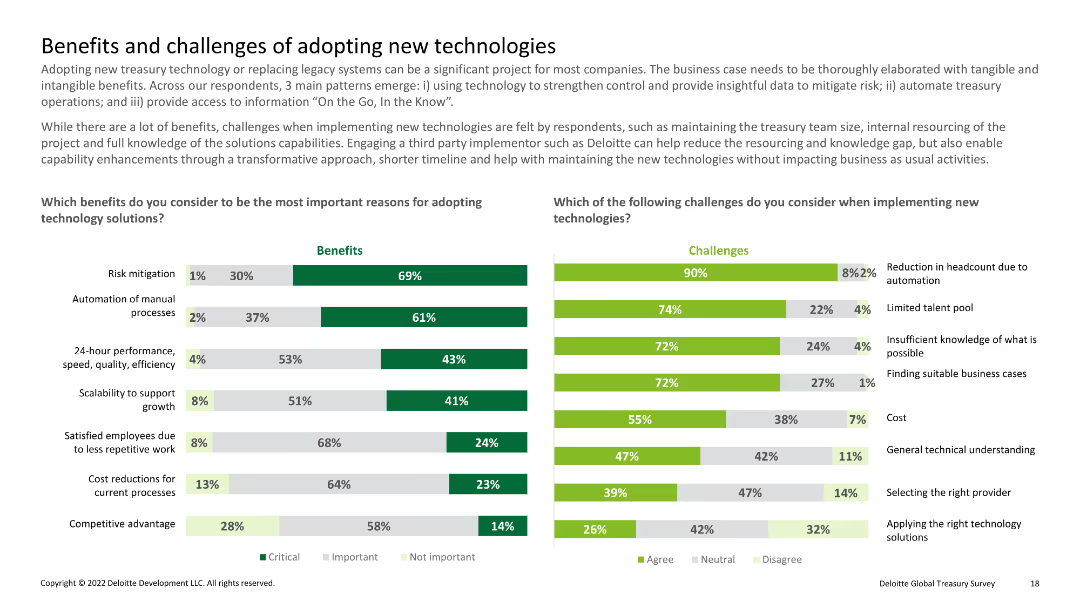
Dual column charts comparing benefits and challenges of new technology adoption, with categories like risk mitigation and cost
Technology and Digital Transformation
Financial Services
Highlights the benefits and challenges associated with adopting new treasury technologies, focusing on risk mitigation and operational efficiency.
New technology, benefits, challenges, treasury, adoption
false
Technology and Digital Transformation
Financial Services
Multiple Chart
Deloitte
Add to my slides
Remove from favorites
Features a column chart with various percentages of disagreement on productivity impact by different sectors.
Market Analysis and Trends
Professional Services
Analyzes employee views on the impact of new ways of working on productivity, focusing on those who disagree with mixed on-site and remote work.
New ways of working, Productivity, Employee views, Mixed work, Sectors
false
Market Analysis and Trends
Professional Services
Multiple Chart
EY
Add to my slides
Remove from favorites
The slide displays a column chart tracking residential work put in place in New Zealand from FY07 to FY25, with actual values up to FY12 and projections thereafter in three scenarios (base, downside, upside). The slide layout includes a descriptive title, annotations for key data points, and a legend for scenario differentiation.
Market Analysis and Trends
Real Estate & Construction
This slide analyzes the resilience and variability of residential work put in place in New Zealand, comparing past actuals with future projections across different economic scenarios, highlighting potential growth or declines.
New Zealand, residential, projections, economic scenarios, growth
false
Market Analysis and Trends
Real Estate & Construction
Mixed Chart
Deloitte
Add to my slides
Remove from favorites
Multi-brand case study layout, each with a visual and text description of how brands like Coca-Cola and Clinique use NFTs.
Customer and Market Segmentation
Technology & Software
Discusses how major brands deploy NFTs to enhance consumer engagement, highlighting specific successful campaigns.
NFTs, Brands, Engagement, Marketing, Consumer
false
Customer and Market Segmentation
Technology & Software
Table
McKinsey
Add to my slides
Remove from favorites
Three-part comparison: Physical world, Digital disruptor, NFT Case. Icons and descriptions for music rights ownership and revenue models.
Technology and Digital Transformation
Media & Entertainment
Compares traditional music rights ownership, digital disruption through streaming, and NFTs, highlighting shifts in ownership and revenue models in the music industry. Useful for discussions on digital transformation.
NFTs, Digital Goods, Music Rights, Ownership, Revenue Models, Streaming, Transformation
false
Technology and Digital Transformation
Media & Entertainment
Linear Flow
McKinsey
Add to my slides
Remove from favorites
A list detailing NFT use cases across industries like Digital Art, Sports, Music, Real Estate, Gaming, and Finance. Each has icons and descriptions.
Industry Overview
Media & Entertainment
Outlines various NFT applications across multiple sectors, emphasizing the breadth of NFT adoption and its impact on different industries. Essential for industry overview presentations on NFTs.
NFTs, Use Cases, Digital Art, Sports, Music, Real Estate, Gaming, Finance
false
Industry Overview
Media & Entertainment
Table
McKinsey
Add to my slides
Remove from favorites
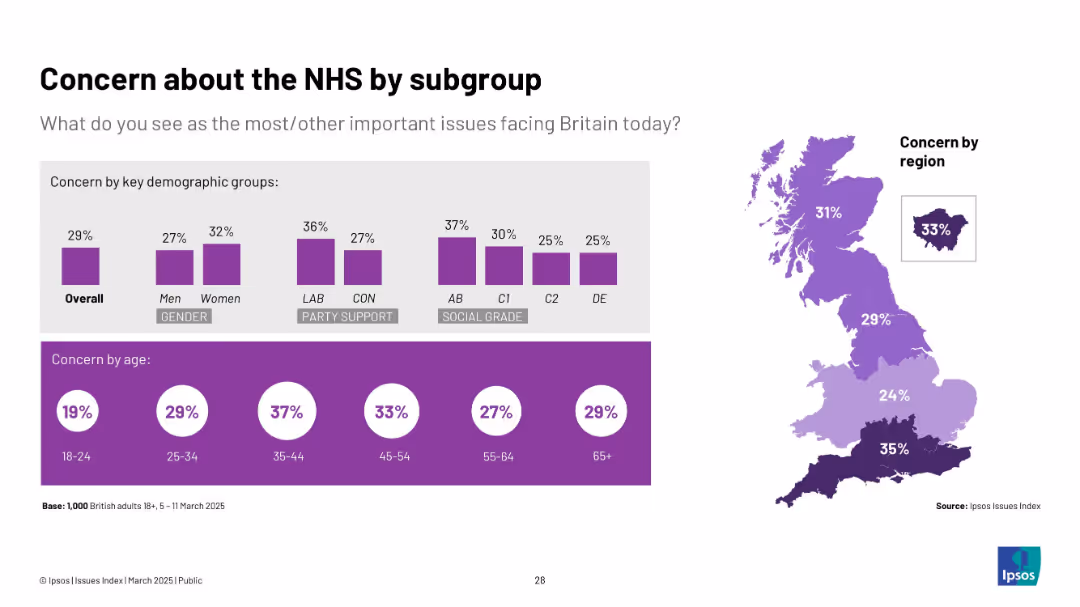
Purple-toned chart; similar demographic breakdown with map and bar visuals. Focuses on NHS concern levels by group.
Market Analysis and Trends
Healthcare & Pharmaceuticals
Explores NHS concern by age, gender, party, region, and social grade. Women, older adults, Labour supporters, and South England show higher concern. Least concern from young adults and DE social grade.
NHS, healthcare concern, regional views, Ipsos, demographics, UK healthcare
false
Market Analysis and Trends
Healthcare & Pharmaceuticals
Multiple Chart
IPSOS
Add to my slides
Remove from favorites
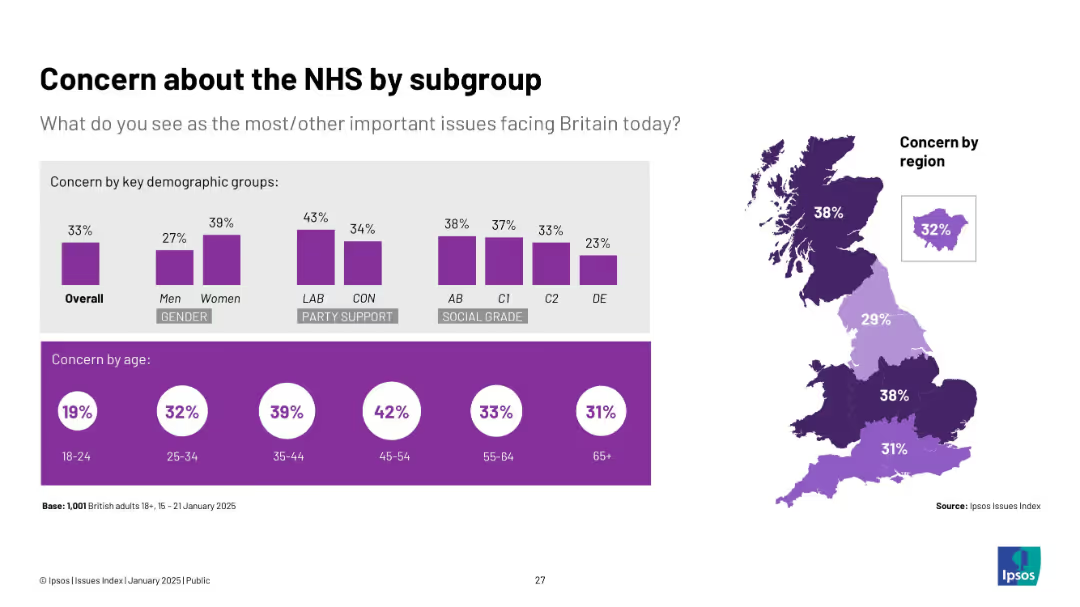
Mixed visuals: bar charts by gender, party, social grade, age + regional heat map.
Market Analysis and Trends
Healthcare & Pharmaceuticals
The slide presents concern about the NHS across key demographic groups. Women, Labour supporters, and those aged 35–54 show the highest concern. Regional analysis reveals Northern and Central England express greater NHS worries.
NHS, healthcare, gender, age, regional concern, Ipsos
false
Market Analysis and Trends
Healthcare & Pharmaceuticals
Multiple Chart
IPSOS
Add to my slides
Remove from favorites
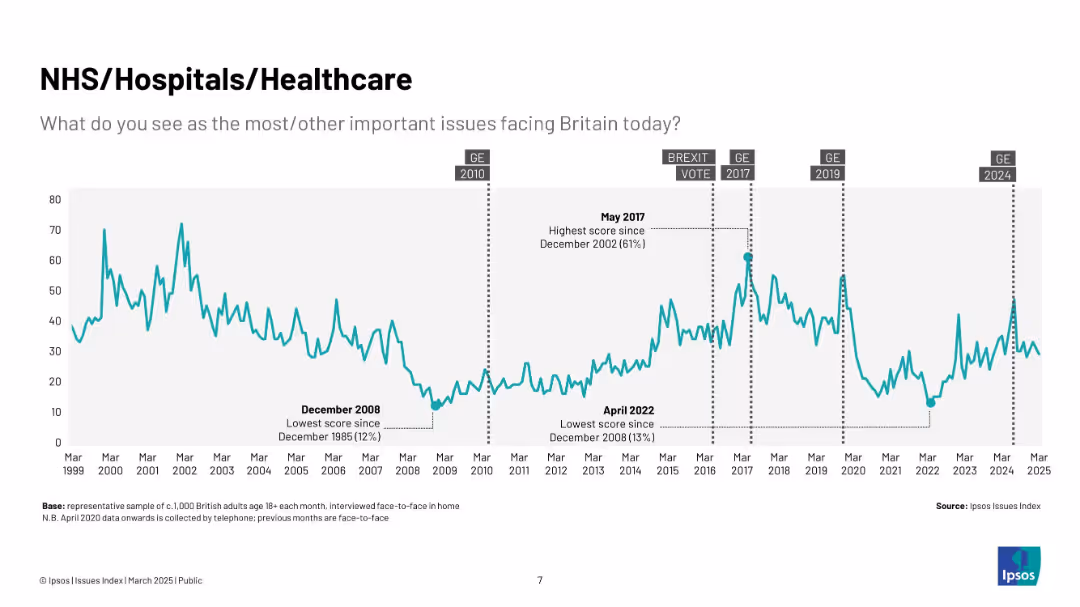
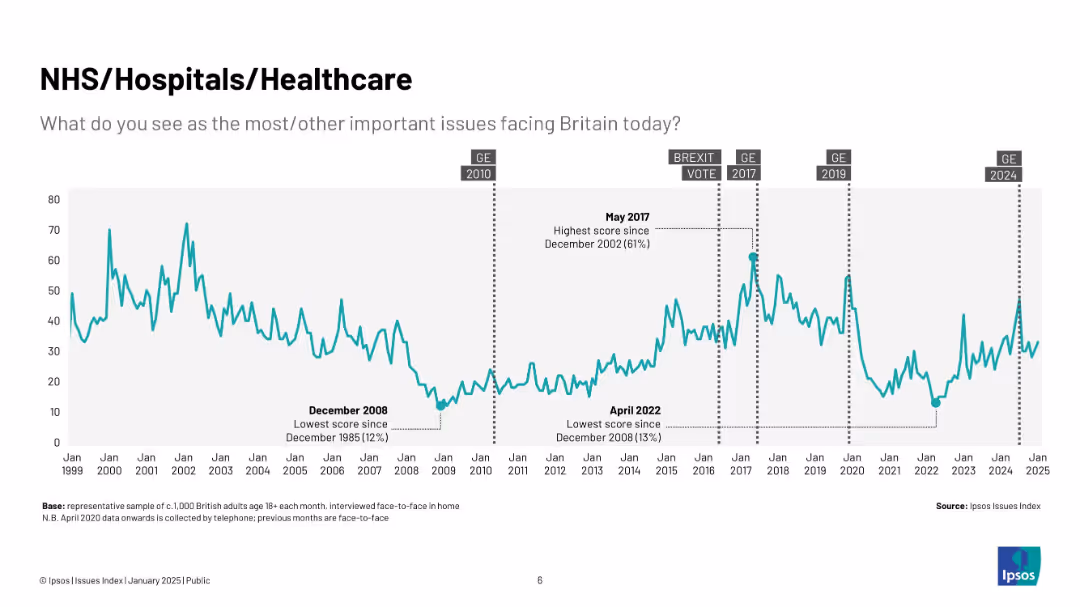
Teal line chart (1999–2025) showing public concern about NHS; includes peaks like 2017 and COVID era, with historic low in April 2022.
Market Analysis and Trends
Healthcare & Pharmaceuticals
Traces healthcare-related public concern trends, particularly focused on NHS performance and accessibility. Peaks are associated with systemic crises and political discourse.
NHS, healthcare, Ipsos, public concern, UK, pandemic, hospitals, medical
false
Market Analysis and Trends
Healthcare & Pharmaceuticals
Single Chart
IPSOS
Add to my slides
Remove from favorites
Timeline chart (1999–2025) of NHS concern levels; key points annotated; events like Brexit are noted
Market Analysis and Trends
Government & Public Sector
This slide shows fluctuations in public concern over healthcare from 1999 to 2025, highlighting peaks in 2017 and post-2020. Major political events are annotated for context.
NHS, healthcare, UK, concern, Ipsos, timeline, Brexit, trends, public health, chart
false
Market Analysis and Trends
Government & Public Sector
Single Chart
IPSOS
Add to my slides
Remove from favorites
Cumulative line chart depicting the cost curve for nickel production against a carbon penalty scenario for 2021 on a dark background.
Regulatory and Compliance
Environmental Services & Sustainability
Explores the implications of carbon pricing on the nickel value chain, quantifying the cost impact and discussing the broader financial and environmental considerations.
nickel, carbon pricing, cost impact, environment, sustainability
false
Regulatory and Compliance
Environmental Services & Sustainability
Single Chart
McKinsey
Add to my slides
Remove from favorites
Slide includes three line charts showing the future supply and demand forecasts for nickel, cobalt, and graphite up to 2040.
Competitive Landscape
Energy & Utilities
Analyzes the projected global supply and demand for nickel, cobalt, and graphite, highlighting potential shortages and their impact on industries dependent on these minerals.
nickel, cobalt, graphite, supply demand, mineral shortages
false
Competitive Landscape
Energy & Utilities
Multiple Chart
Accenture
Add to my slides
Remove from favorites
Dark background with dual bar charts showing nickel production and export by country in 2020, focusing on class 1 and class 2 nickel.
Competitive Landscape
Industrial & Manufacturing
Provides an overview of the global nickel market, showcasing the leading exporting countries and their market shares, with a specific focus on Russian production and export trends.
nickel, export, market share, Russia, global
false
Competitive Landscape
Industrial & Manufacturing
Multiple Chart
McKinsey
Add to my slides
Remove from favorites
Features a list format on a dark background with symbols representing various factors influencing the nickel market, from supply and demand shifts to technological advancements.
Strategic Planning
Technology & Software
Discusses several potential disruptors and opportunities in the nickel market, including changes in steel production, battery chemistry, and de-carbonization efforts by major automotive players.
nickel, market impact, technology, decarbonization, automotive
false
Strategic Planning
Technology & Software
Table
McKinsey
Add to my slides
Remove from favorites
Slide presents a line graph tracking the London Metal Exchange (LME) nickel prices from 2021 to 2022 with a significant spike highlighted on a dark background.
Investment Analysis
Financial Services
Highlights historical nickel price volatility and the impact of geopolitical conflicts, emphasizing the investment risks and opportunities within the nickel market.
nickel, price trends, investment, LME, volatility
false
Investment Analysis
Financial Services
Single Chart
McKinsey
Add to my slides
Remove from favorites
Provides a large column chart with one bar and additional textual information detailing the breakdown of capital costs for nickel sulphate production, emphasizing the minimal cost attributed to refining.
Financial Performance
Financial Services
Analyzes the capital cost distribution for producing nickel sulphate, focusing on the refining process's proportion to the total project cost and integration considerations with mining operations.
nickel sulphate, capital costs, production, refining
false
Financial Performance
Financial Services
Mixed Chart
Accenture
Add to my slides
Remove from favorites
Slide shows line graphs contrasting the current and potential trajectories of nickel supply (Class 1 and 2) against demand scenarios on a dark background.
Strategic Planning
Industrial & Manufacturing
Outlines strategies to address the tight supply of nickel by detailing supply chain dynamics, projected demands, and the influence of market conditions from 2012 to 2031.
nickel, supply chain, market dynamics, class 1, class 2
false
Strategic Planning
Industrial & Manufacturing
Multiple Chart
McKinsey
Add to my slides
Remove from favorites
Features combined column charts on demand, supply, and forecast of refined nickel with annotations on a dark background. Focuses on the discrepancy between supply and expected demand from 2021 to 2031.
Market Analysis and Trends
Energy & Utilities
Discusses the projected supply and demand for refined nickel, indicating a potential long-term shortage influenced by electric vehicle production, despite efforts to balance market pressures with alternative technologies.
nickel, supply demand, electric vehicles, shortage
false
Market Analysis and Trends
Energy & Utilities
Single Chart
McKinsey
Add to my slides
Remove from favorites
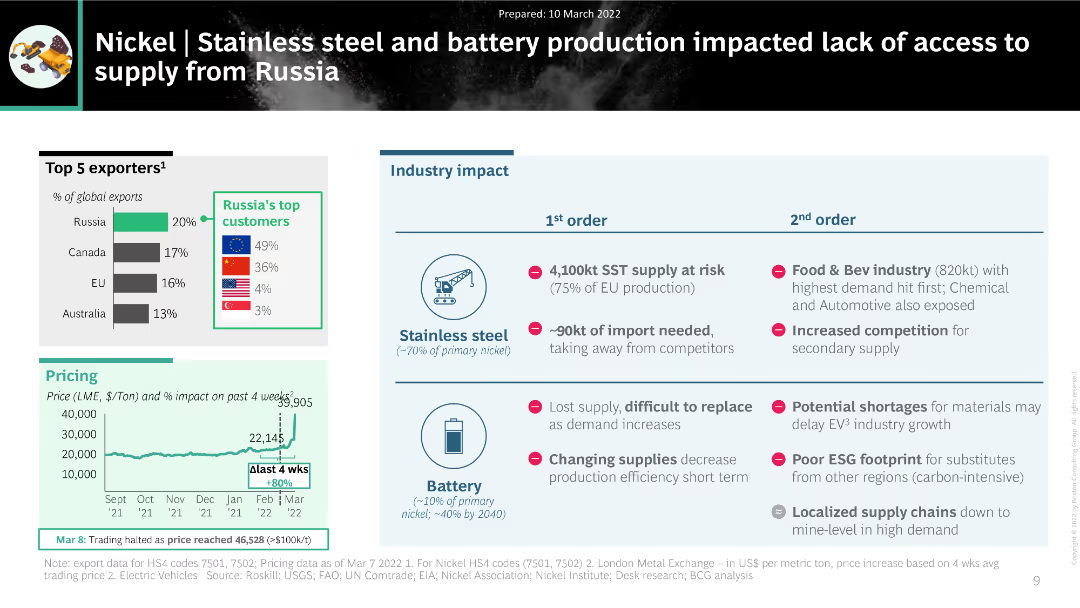
The slide features a combination of charts and tables, including a column chart showing the top exporters of nickel, a pricing trend chart, and a table summarizing the industry impact on stainless steel and battery production.
Market Analysis and Trends
Industrial & Manufacturing
The slide analyzes the impact of disrupted nickel supply from Russia on stainless steel and battery production. It includes data on top exporters, pricing trends, and the cascading effects on various industries, highlighting significant supply chain challenges.
nickel, supply disruption, stainless steel, battery production, industry impact
false
Market Analysis and Trends
Industrial & Manufacturing
Multiple Chart
BCG
Add to my slides
Remove from favorites
The slide uses a timeline format to outline the roadmap for Nielsen ONE Ads, featuring key milestones and phases from 2022 to 2023.
Strategic Planning
Media & Entertainment
It details the strategic roadmap for Nielsen ONE Ads, including milestones like the introduction of big data, Nielsen ID System, and commercial signatures.
Nielsen, Ads, Roadmap, Timeline, Big Data, Strategic Planning
false
Strategic Planning
Media & Entertainment
Linear Flow
Nielsen
Add to my slides
Remove from favorites
The slide features a column chart showing the ratio of direct to distributed traffic according to the Nielsen & Fletcher approach, which excludes subsequent visits. Detailed annotations explain the methodology and findings.
Market Analysis and Trends
Media & Entertainment
This slide presents the Nielsen & Fletcher approach to measuring the ratio of direct to distributed traffic, focusing on the last step before reaching news articles, excluding subsequent visits, and providing insights into traffic sources.
Nielsen & Fletcher, Direct Traffic, Distributed Traffic, Column Chart, Traffic Analysis
false
Market Analysis and Trends
Media & Entertainment
Single Chart
IPSOS
Add to my slides
Remove from favorites
The slide includes a column chart displaying market concentration levels across different access modes based on the Nielsen & Fletcher approach. Annotations provide detailed explanations of the concentration levels and their implications.
Market Analysis and Trends
Media & Entertainment
This slide explores market concentration levels (HHI) by access mode using the Nielsen & Fletcher approach, which considers only the last step before reaching news articles, excluding subsequent visits, offering insights into media concentration.
Nielsen & Fletcher, Market Concentration, HHI, Column Chart, Access Mode
false
Market Analysis and Trends
Media & Entertainment
Single Chart
IPSOS
Add to my slides
Remove from favorites
A process flow slide with three main sections: Objective, Feedback, and Time Frame, each represented by icons and brief descriptions.
Technology and Digital Transformation
Media & Entertainment
Outlines the objective, feedback process, and timeline for Nielsen ONE Content Alpha, focusing on client collaboration and iterative feedback.
Nielsen ONE, content, feedback, timeline, collaboration, software, versions
false
Technology and Digital Transformation
Media & Entertainment
Pillar
Nielsen
Add to my slides
Remove from favorites
Contains a detailed map of Nigeria showing application distribution across states and geopolitical zones, accompanied by a structured table.
Strategic Planning
Government & Public Sector
Detailed analysis of the distribution of applications within Nigeria, breaking down numbers and percentages by state and geopolitical zones.
Nigeria, applications, distribution, geopolitical, analysis
false
Strategic Planning
Government & Public Sector
Mixed Chart
Accenture
Add to my slides
Remove from favorites
The slide displays a map of Nigeria showing the geopolitical zones with respective application counts and gender distribution, complemented by bar graphs for each state's data.
Strategic Planning
Government & Public Sector
Focused on Nigeria, this slide details the regional distribution of applications, gender breakdown by state, and overall representation percentages, useful for demographic and regional planning.
Nigeria, Applications, Geopolitical, Distribution, Gender Breakdown, Demographic, Regional Planning, State Data, Percentages
false
Strategic Planning
Government & Public Sector
Multiple Chart
Accenture
Add to my slides
Remove from favorites
The slide features a column chart showing Nigeria's exports in Q1 – Q3 2023 by sector. It includes red columns representing various sectors and total export.
Financial Performance
Energy & Utilities
Highlights the overreliance on crude oil exports, accounting for 80.3% of total exports. It discusses challenges limiting non-oil export growth.
Nigeria, exports, crude oil, non-oil, challenges, revenue, energy, Q1-Q3 2023, total export
false
Financial Performance
Energy & Utilities
Mixed Chart
PwC/Strategy&
Add to my slides
Remove from favorites
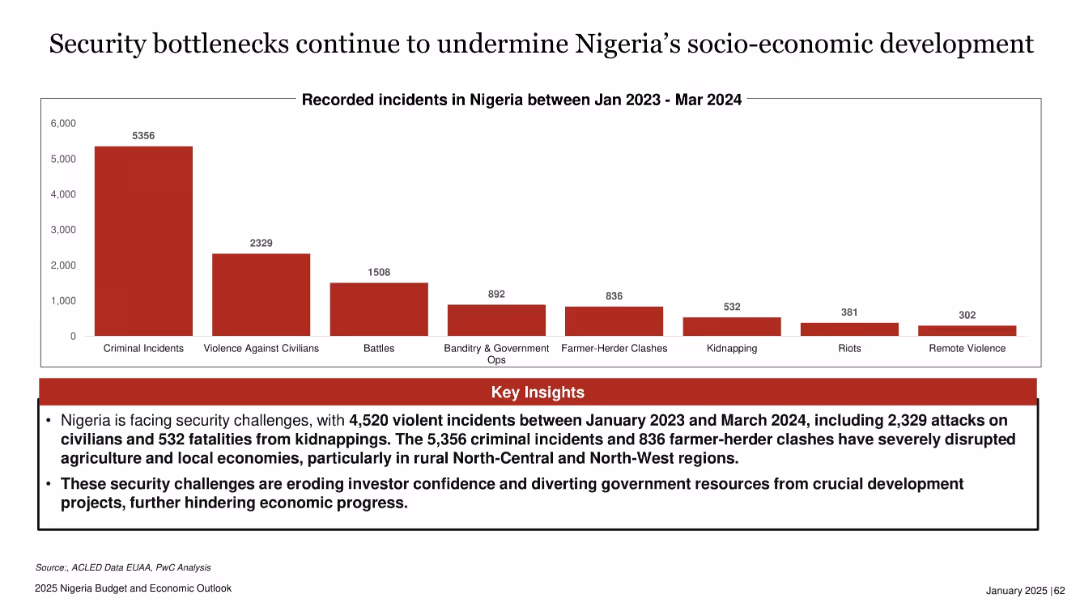
Bar chart with red bars representing different types of recorded incidents; header and insights in text box
Risk Assessment and Management
Government & Public Sector
The slide presents a bar chart showing the number of security incidents in Nigeria from Jan 2023 to Mar 2024. Criminal incidents dominate, followed by violence against civilians and battles. Key insights highlight the negative impacts on rural economies, agriculture, and investor confidence, urging attention to worsening insecurity trends.
Nigeria, security, incidents, criminal, rural, agriculture, investor confidence, development
false
Risk Assessment and Management
Government & Public Sector
Mixed Chart
PwC/Strategy&
Add to my slides
Remove from favorites
Slide with complex column charts depicting Group NII development over several years, alongside key highlights on the right.
Financial Performance
Financial Services
Discusses predictions and strategies for stable net interest income in banking, highlighting impacts from hedge portfolios and deposit volumes.
NII, banking, hedge, deposit, revenue, forecasting, financial stability
false
Financial Performance
Financial Services
Mixed Chart
Deutsche Bank
Add to my slides
Remove from favorites
A stylistic column chart with projected quarterly growth, using contrasting colors and a clear timeline, also includes bullet points on rate outlook and loan growth.
Financial Performance
Financial Services
Forecasts the net interest income growth for a financial institution, detailing contributing factors and expectations for the upcoming quarters.
NII, financial forecast, interest income, growth, quarterly, finance, loan growth, projections
false
Financial Performance
Financial Services
Single Chart
JP Morgan
Add to my slides
Remove from favorites
This slide contains a series of column charts representing the Net Interest Income (NII) excluding markets with projections and impacts of various factors. A sidebar lists assumptions and sources of uncertainty related to the financial outlook. The color scheme differentiates current outlook from medium-term impacts.
Financial Performance
Financial Services
The slide provides a financial outlook on Net Interest Income (NII), excluding market influences, and accounts for the impact of the First Republic and other variables. The assumptions and uncertainties section aids in understanding the factors that may affect the bank's financial projections, offering a strategic view of the bank's future earning potential for investors and stakeholders.
NII, Financial Outlook, Projections, First Republic, Market Exclusion, Assumptions, Uncertainties, Financial Planning, Banking
false
Financial Performance
Financial Services
Mixed Chart
JP Morgan
Add to my slides
Remove from favorites
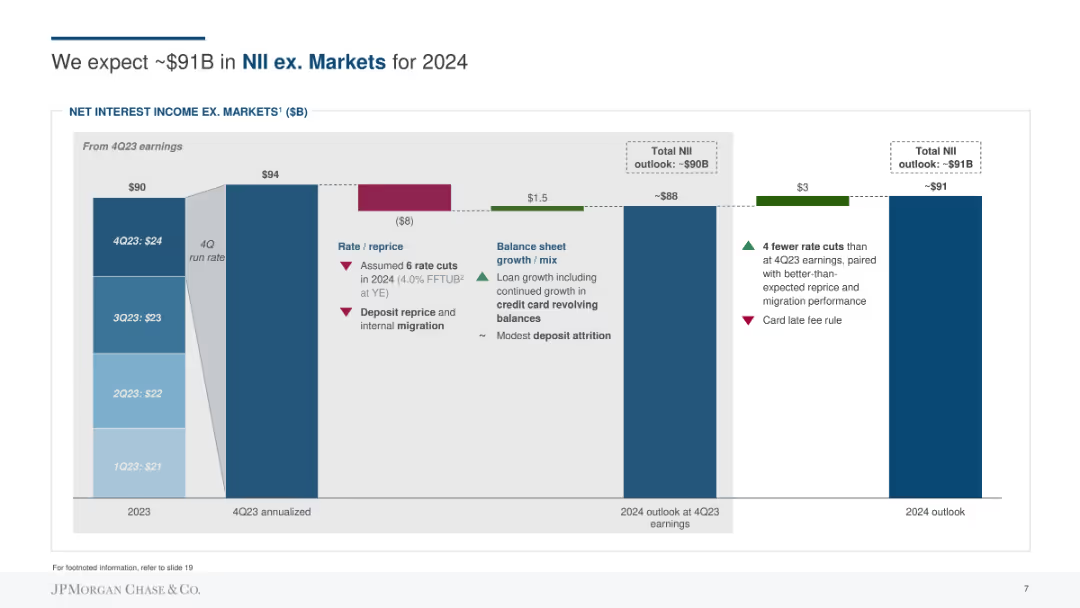
Column chart showing net interest income (NII) outlook, with factors affecting rate, repricing, balance sheet growth, and deposit migration.
Financial Performance
Financial Services
Forecasts the net interest income excluding markets for 2024, detailing rate and repricing assumptions, balance sheet growth, and migration impacts.
NII, forecasting, net interest income, rate, repricing, balance sheet growth, deposits
false
Financial Performance
Financial Services
Single Chart
JP Morgan
Add to my slides
Remove from favorites
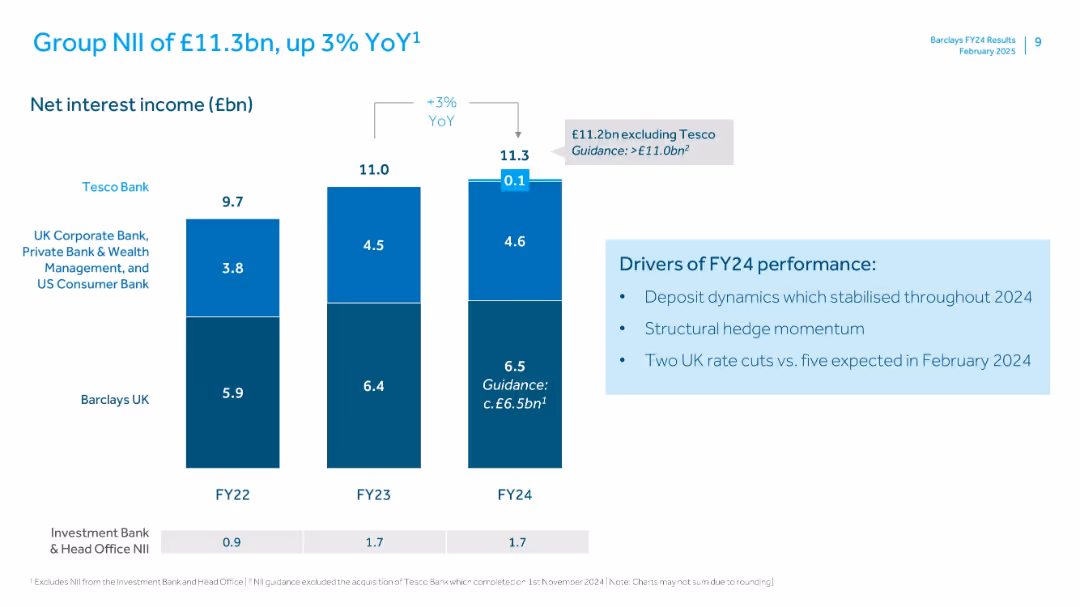
Features a column chart depicting net interest income and margins across different business sectors for FY23, providing insights into trends and projections for future financial guidance excluding certain business segments.
Financial Performance
Financial Services
Provides a detailed analysis of net interest income for FY23, highlighting performance across different business sectors, with a focus on year-over-year growth and the strategic implications for future financial planning.
NII, FY23, financial analysis, business sectors, financial planning
false
Financial Performance
Financial Services
Mixed Chart
Barclays
Add to my slides
Remove from favorites
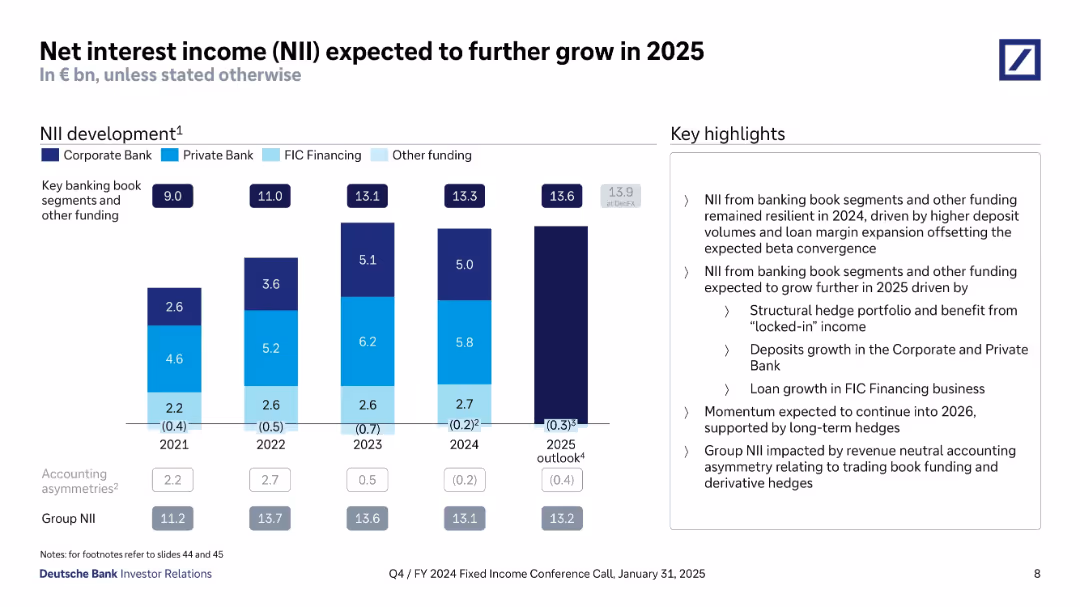
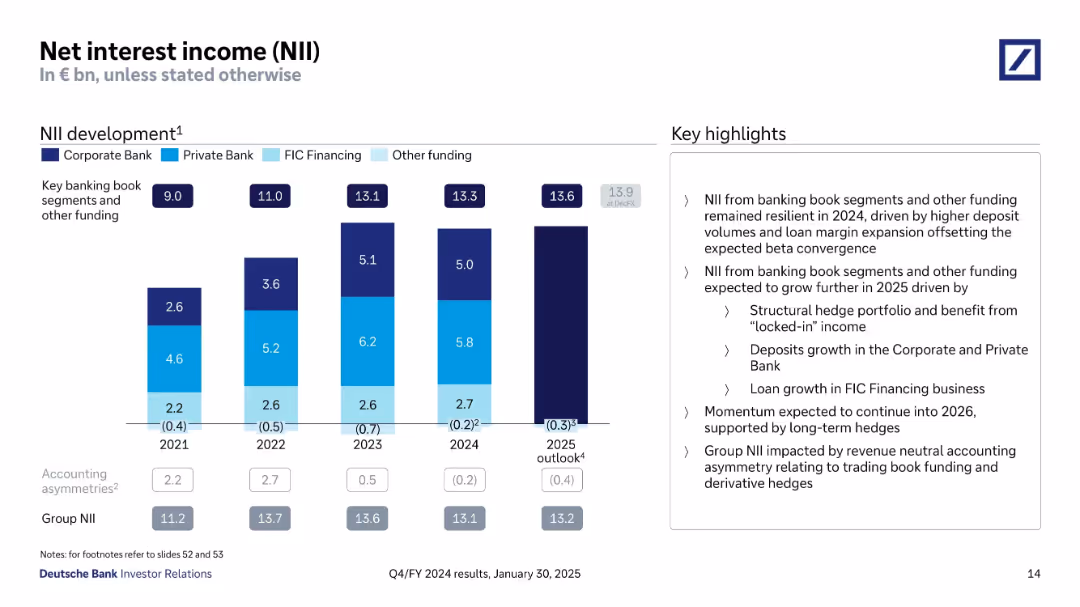
Left side shows multi-year bar chart of NII development by segment; right side lists highlights driving growth expectations.
Strategic Planning
Financial Services
The slide forecasts continued NII growth into 2025 due to drivers like structural hedge portfolios, deposit and loan growth, and long-term hedges. Historical and projected NII are visualized, while key growth factors are detailed in bullet form.
NII growth, 2025 outlook, deposits, hedges, loan growth, Deutsche Bank
false
Strategic Planning
Financial Services
Mixed Chart
Deutsche Bank
Add to my slides
Remove from favorites
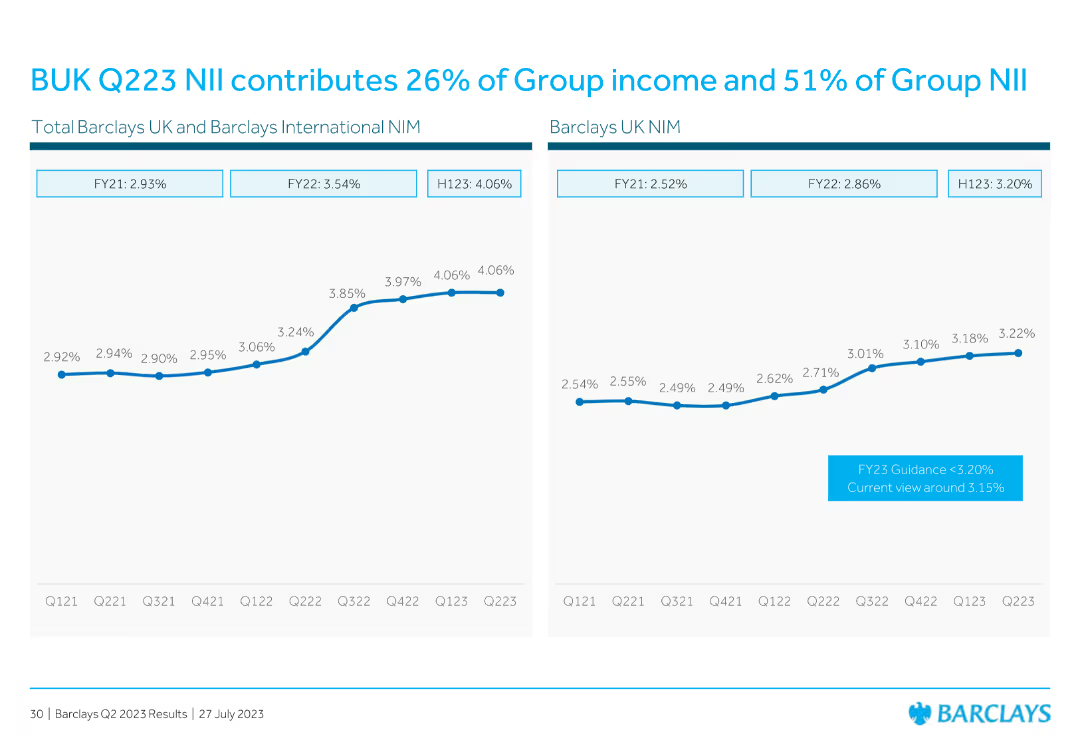
Features line charts comparing net interest margin (NIM) across different periods for Barclays UK and Barclays International.
Financial Performance
Financial Services
Describes the contribution of BUK Q223 net interest income (NII) to the group's overall income and NII, with historical comparisons.
NII, income, group, contribution, NIM
false
Financial Performance
Financial Services
Multiple Chart
Barclays
Add to my slides
Remove from favorites
Contains column charts detailing financial data.
Financial Performance
Financial Services
Analyzes net interest income over several years.
NII, interest, income, financial
false
Financial Performance
Financial Services
Mixed Chart
Deutsche Bank
Add to my slides
Remove from favorites
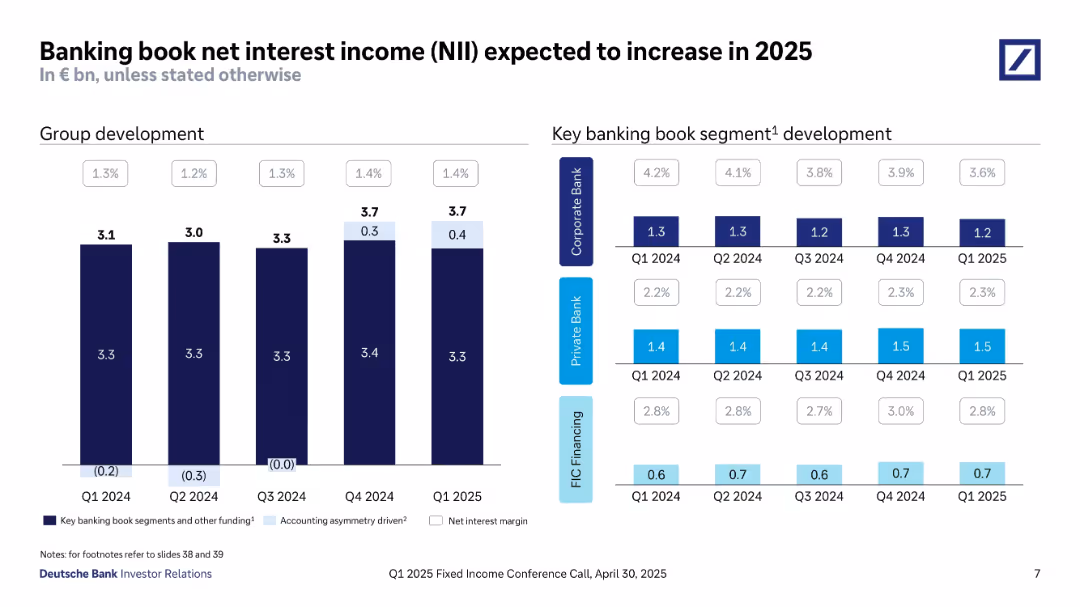
Left: vertical bar charts for group NII development; Right: grid chart for key segment performance over time.
Financial Performance
Financial Services
The slide forecasts increased NII in 2025, rising to €3.7bn. It breaks down performance by business segments including Corporate Bank, Private Bank, and FIC Financing. Highlights stable margins and strong contributions from Private Bank and FIC.
NII, Interest Income, Private Bank, Corporate Bank, FIC Financing, Forecast, Segment Analysis, 2025
false
Financial Performance
Financial Services
Multiple Chart
Deutsche Bank
Add to my slides
Remove from favorites
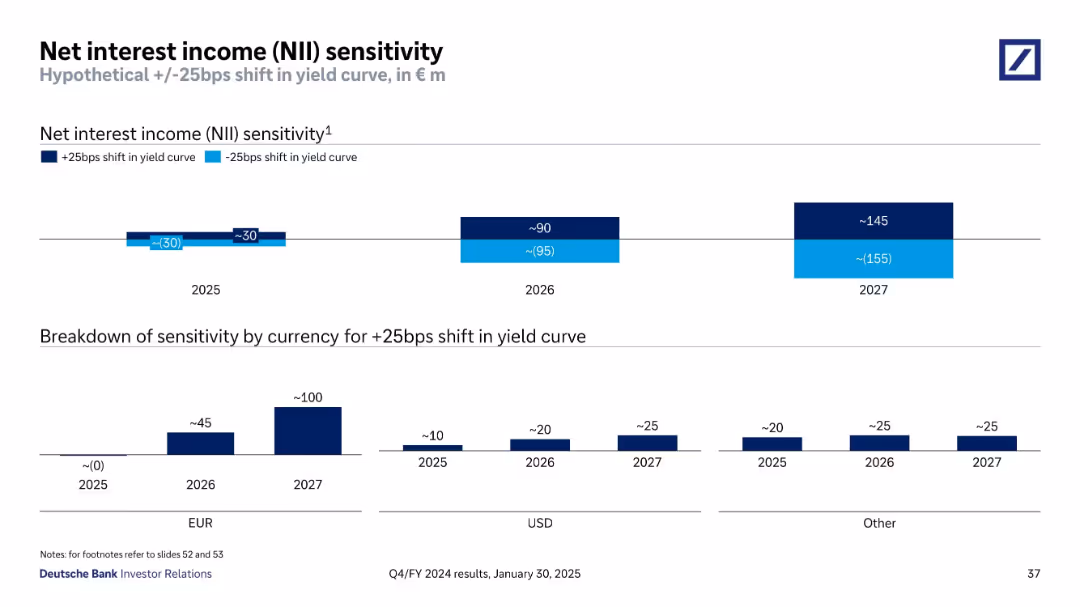
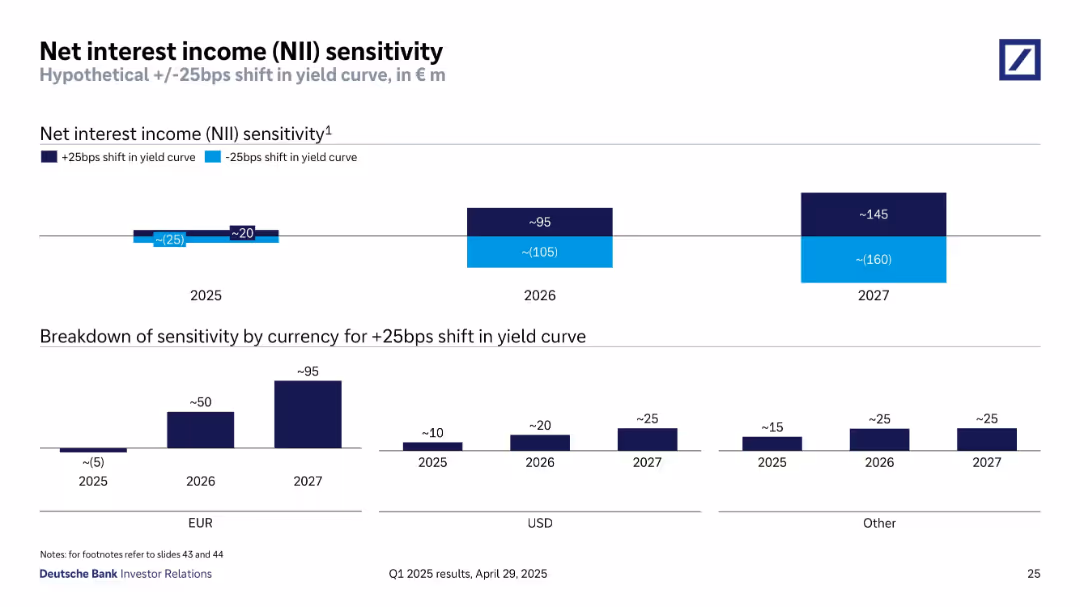
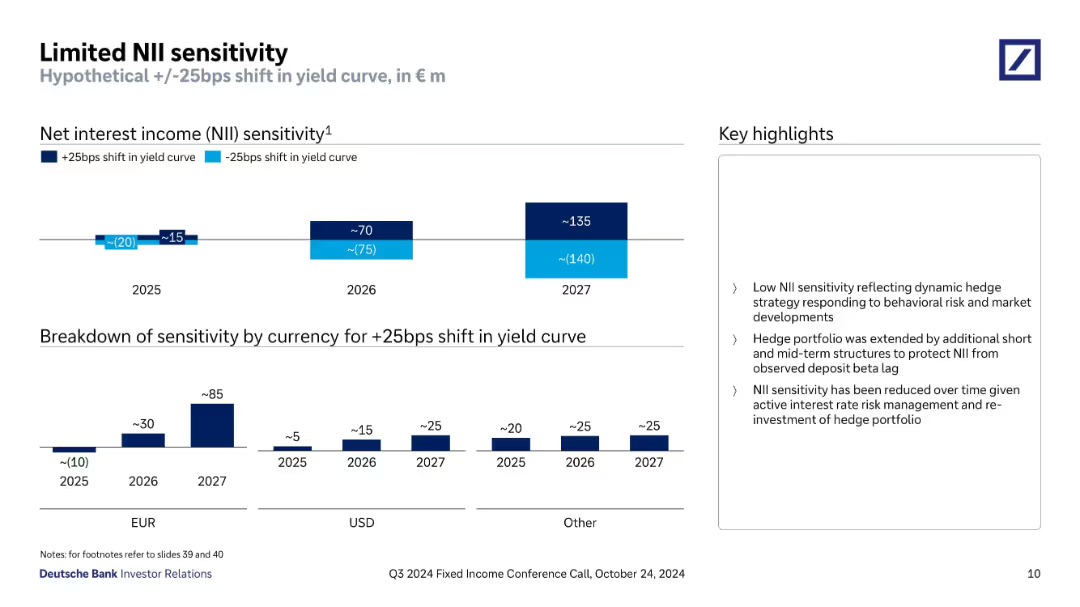
Bar chart displays net interest income (NII) sensitivity to +/-25bps yield curve shifts, broken down by year and currency. The layout uses a clean, dark-light blue contrast to show direction of sensitivity.
Risk Assessment and Management
Financial Services
This slide analyzes the bank’s net interest income sensitivity under hypothetical interest rate shifts of +/-25bps across years 2025–2027. It shows limited exposure in 2025 and gradually increasing sensitivity in later years. Sensitivity is broken down further by EUR, USD, and other currencies, illustrating manageable rate risk.
NII, interest rate sensitivity, yield curve, risk, 2025–2027, EUR, USD, Deutsche Bank, interest income
false
Risk Assessment and Management
Financial Services
Multiple Chart
Deutsche Bank
Add to my slides
Remove from favorites
Bar chart projections showing sensitivity to +/-25bps shift in yield curve over 2025–2027
Risk Assessment and Management
Financial Services
Displays Deutsche Bank’s estimated NII sensitivity to yield curve shifts through 2027. The breakdown indicates impact by year and by currency, showing increasing NII benefit in future years under a rising rate scenario.
NII, Interest Rates, Yield Curve, Sensitivity, EUR, USD, Forecast
false
Risk Assessment and Management
Financial Services
Multiple Chart
Deutsche Bank
Add to my slides
Remove from favorites
Vertical stacked bars for net interest income (NII) across segments. Right-hand text box with performance drivers.
Financial Performance
Financial Services
Reports a 3% YoY rise in Barclays’ net interest income (NII), reaching £11.3bn in FY24. The slide outlines segment-level contributions and factors like deposit dynamics, hedge momentum, and interest rate cuts.
NII, Net Interest, FY24, Barclays, Tesco Bank, Deposit, Hedge, Rates, Income
false
Financial Performance
Financial Services
Mixed Chart
Barclays
Add to my slides
Remove from favorites
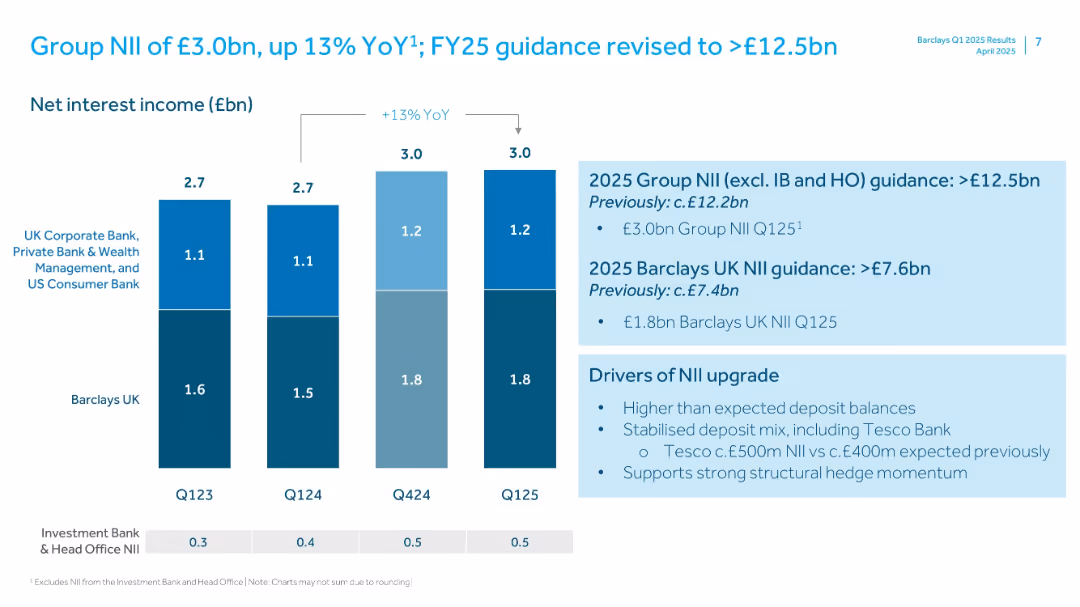
Stacked bar chart showing Net Interest Income by segment with projections.
Strategic Planning
Financial Services
Barclays outlines net interest income (NII) trends across business segments and upgrades FY25 guidance. The slide includes key drivers for the upward revision, including Tesco Bank’s contribution.
NII, net interest income, Barclays, UK bank, financial guidance, deposits, income projections, growth drivers
false
Strategic Planning
Financial Services
Mixed Chart
Barclays
Add to my slides
Remove from favorites
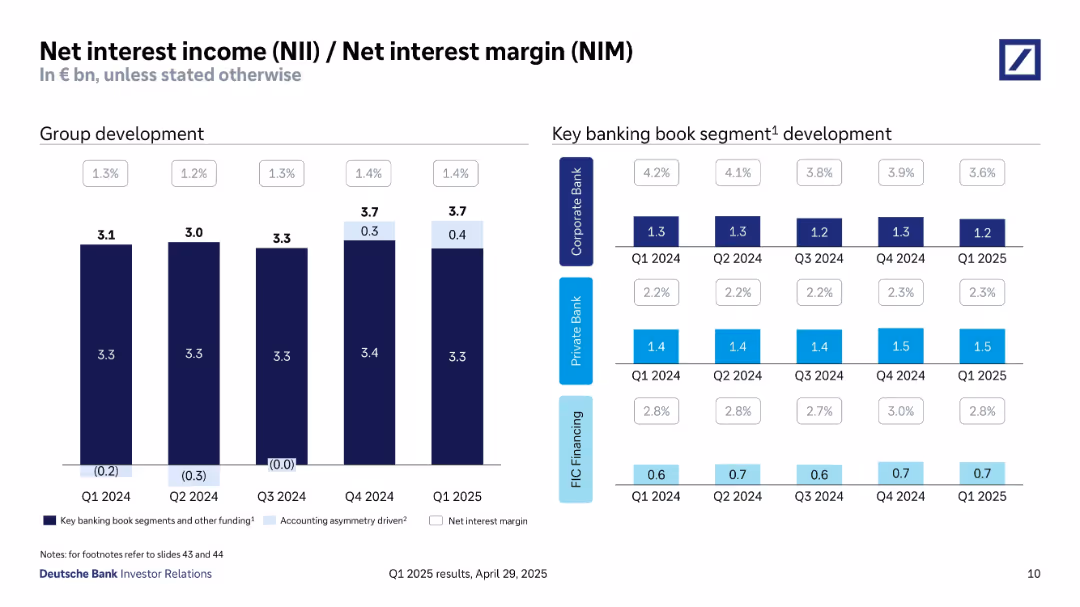
Bar charts comparing NII across quarters and margin metrics for business segments; grouped by banking units
Financial Performance
Financial Services
Shows Deutsche Bank's NII and NIM trends across four quarters, with detailed breakdowns across banking segments like Corporate Bank, Private Bank, and FIC Financing, reflecting stable NIM despite varied NII.
NII, NIM, banking segments, Q1 2025, revenue streams, Deutsche Bank
false
Financial Performance
Financial Services
Multiple Chart
Deutsche Bank
Add to my slides
Remove from favorites
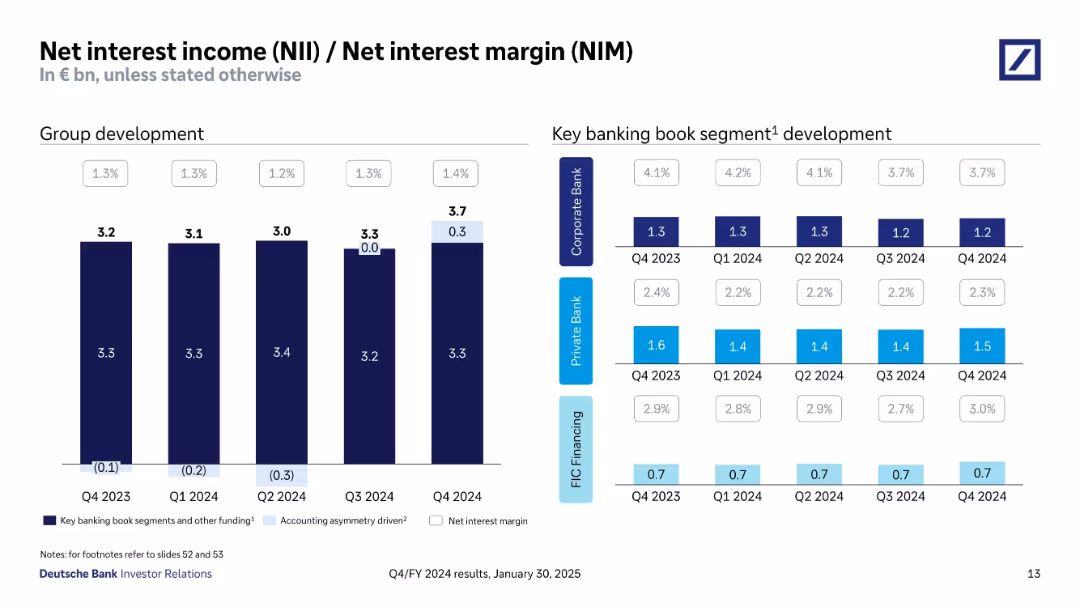
Left: stacked bar chart of NII and margin; Right: segmented bar chart by business units.
Performance Metrics and KPIs
Financial Services
Shows quarterly evolution of net interest income and margin across key banking segments. NIM remained stable overall despite minor fluctuations across segments. The charts reflect income drivers and margin trends within divisions.
NII, NIM, interest income, banking segments, margin trends
false
Performance Metrics and KPIs
Financial Services
Multiple Chart
Deutsche Bank
Add to my slides
Remove from favorites
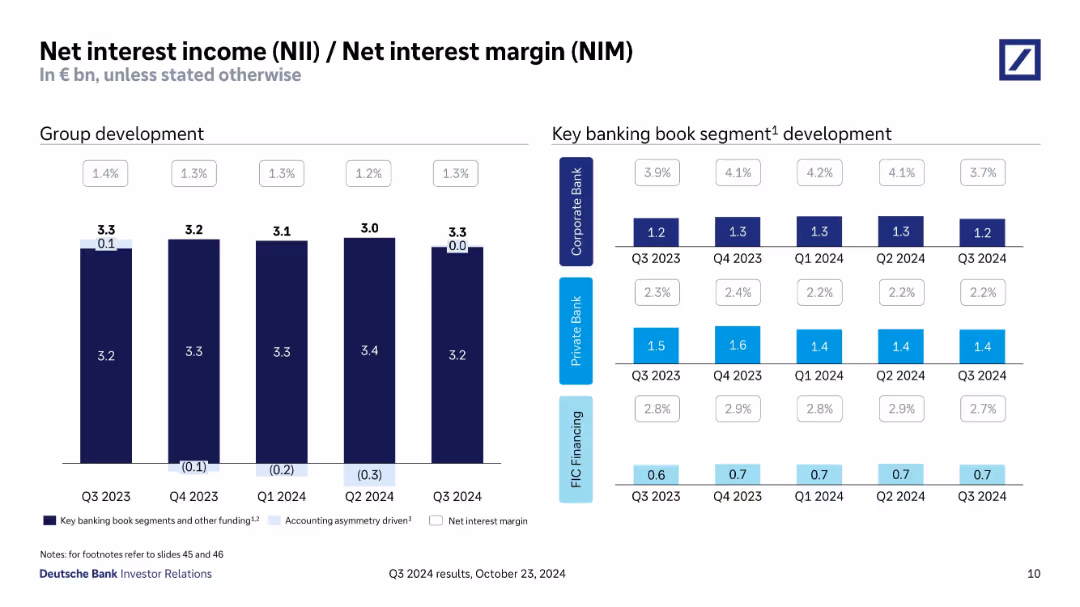
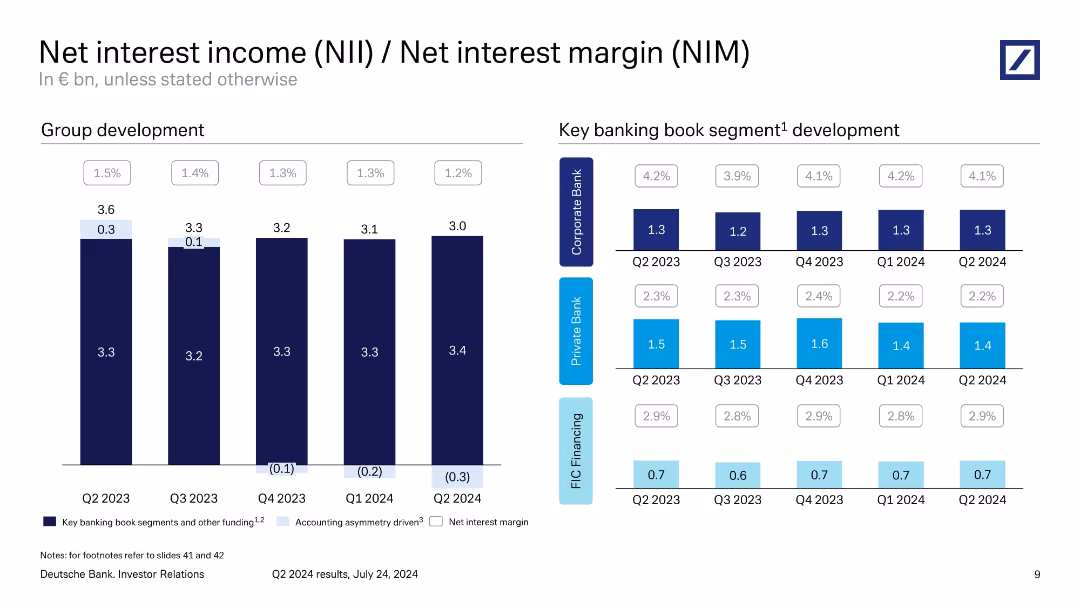
Left bar chart for group NII, right grid for NII by bank segment with margin overlays.
Financial Performance
Financial Services
Tracks quarterly development in net interest income and margin across the group and major banking segments. Shows gradual decline in NIM from Q2 2023 to Q2 2024 and provides insight into accounting asymmetry effects and segment-specific interest income contributions.
NII, NIM, interest margin, banking segments, Q2 2024, Deutsche Bank
false
Financial Performance
Financial Services
Multiple Chart
Deutsche Bank
Add to my slides
Remove from favorites
This slide features a column chart showing group net interest income (£bn) and net interest margin percentages from Q319 to Q323. On the right, it lists the contributions to group NII and NIM by different business units.
Financial Performance
Financial Services
The slide highlights Barclays' group net interest income of £3.2bn and a net interest margin of 3.98% for Q323, along with contributions from different business units such as Barclays UK, CC&P, and CIB.
NII, NIM, Q323, net interest, income
false
Financial Performance
Financial Services
Mixed Chart
Barclays
Add to my slides
Remove from favorites
Column charts and tables showing NII contributions and impacts over time. Uses green, blue, and grey colors for data segmentation.
Financial Performance
Financial Services
This slide details the expected NII contributions from Non-Core and swaps, providing medium-term outlook and potential impacts on net interest margin (NIM).
NII, Non-Core, swaps, contributions, NIM
false
Financial Performance
Financial Services
Mixed Chart
Barclays
Add to my slides
Remove from favorites
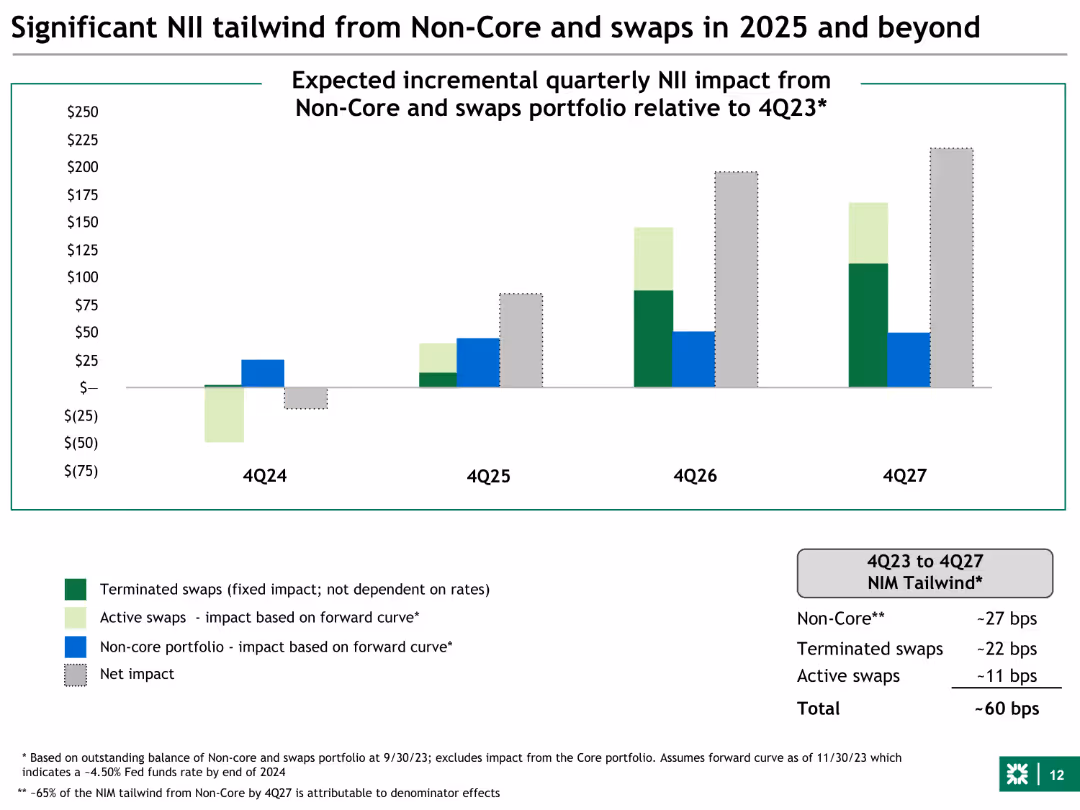
The slide features a column chart with four sets of bars representing expected quarterly NII impacts from non-core and swaps portfolios relative to 4Q23, spanning from 4Q24 to 4Q27. The bars are color-coded for terminated swaps, active swaps, non-core portfolio, and net impact.
Financial Performance
Financial Services
This slide shows the projected quarterly NII (Net Interest Income) impact from non-core and swaps portfolios for the years 2025 to 2027. It is used to illustrate the financial benefits of maintaining these portfolios, highlighting the substantial positive effects on the overall financial performance.
NII, non-core, swaps, financial performance, projections, 2025, 2026, 2027, portfolio, impact
false
Financial Performance
Financial Services
Mixed Chart
Goldman Sachs
Add to my slides
Remove from favorites
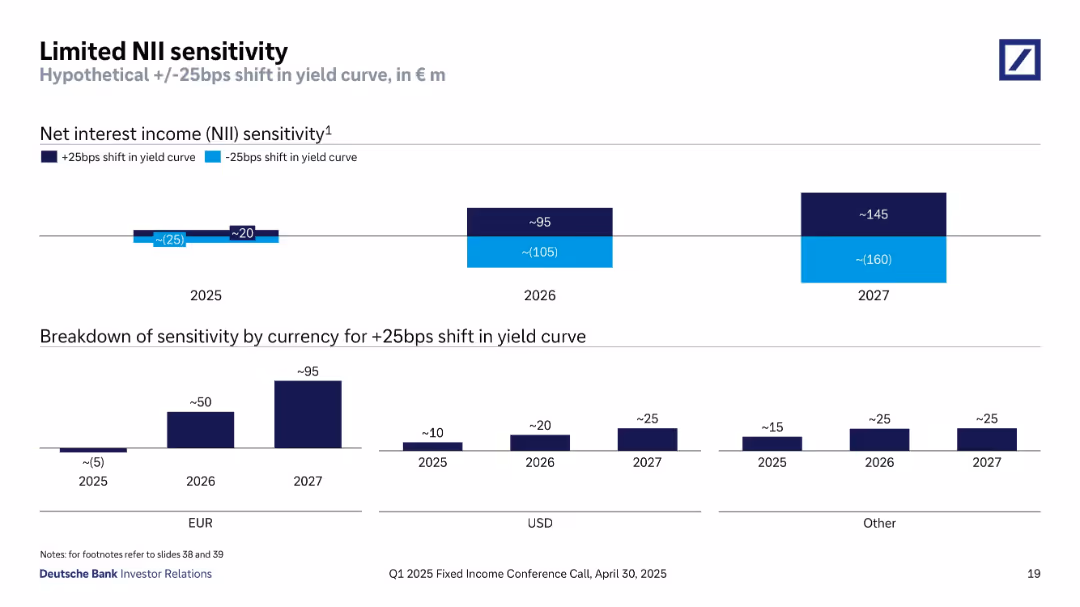
Two bar charts showing projected NII changes under +/-25bps yield curve shifts (total and by currency). Bars are segmented by year (2025–2027) and by EUR, USD, and other currencies. Consistent color coding for rate directions.
Risk Assessment and Management
Financial Services
This slide analyzes Deutsche Bank’s limited net interest income (NII) sensitivity to a 25bps shift in interest rates. NII impacts range from minor (€20–25m) in 2025 to larger swings (€145m gain / €160m loss) by 2027. Sensitivity is broken down by currency, with the EUR segment showing the most variation. It demonstrates well-managed interest rate risk and minimal NII volatility for near-term years.
NII sensitivity, interest rate risk, EUR, USD, yield curve shift, risk management, financial stability
false
Risk Assessment and Management
Financial Services
Multiple Chart
Deutsche Bank
Add to my slides
Remove from favorites
Features sensitivity analysis with column charts depicting hypothetical shifts in yield curve impacts on NII.
Risk Assessment and Management
Financial Services
Analyzes financial sensitivity to interest rate fluctuations, highlighting potential impacts on net interest income.
NII, sensitivity, interest rates, finance, risk management, forecasting
false
Risk Assessment and Management
Financial Services
Multiple Chart
Deutsche Bank
Add to my slides
Remove from favorites
Horizontal bar and column charts show projected NII impact by year and currency with +/-25bps yield curve shifts.
Risk Assessment and Management
Financial Services
Analyzes how a 25bps change in yield curves would affect NII from 2025 to 2027. Also includes breakdown by currency (EUR, USD, Other). Highlights highest sensitivity in 2027 and provides insight into interest rate risk.
NII sensitivity, interest rates, yield curve, EUR, USD, risk management, projections
false
Risk Assessment and Management
Financial Services
Multiple Chart
Deutsche Bank
Add to my slides
Remove from favorites
Dual-chart layout: one showing NII sensitivity to ±25bps shift in yield curves, the other breaking down by currency. Text highlights strategic measures to reduce sensitivity.
Risk Assessment and Management
Financial Services
Illustrates the bank’s limited sensitivity to yield curve shifts due to dynamic hedge strategies. Outlines currency-level exposure and notes structural hedge re-investments that have reduced potential volatility in net interest income.
NII sensitivity, interest rates, yield curve, hedge strategy, EUR/USD exposure, 2025–2027, beta lag
false
Risk Assessment and Management
Financial Services
Multiple Chart
Deutsche Bank
Add to my slides
Remove from favorites
Bar chart showing annual NII trends from 2021 to 2025 outlook. Key segments are color-coded. Includes right-hand bullet highlights of drivers and projections.
Market Analysis and Trends
Financial Services
Tracks Deutsche Bank’s NII from 2021 to 2024, with 2025 outlook. Shows growth across business segments with emphasis on deposit volumes, loan growth, and income stabilization. Describes momentum drivers and structural hedge impacts.
NII trends, interest income, deposits, loans, hedging, segment revenue
false
Market Analysis and Trends
Financial Services
Mixed Chart
Deutsche Bank
Add to my slides
Remove from favorites
This slide features multiple column charts displaying NII sensitivity to hypothetical +/- 25bps shifts in yield curve for years 2024, 2025, and 2026. Each chart is presented with two columns for potential increases or decreases in Euros, alongside breakdowns by currency (EUR and USD) showing the estimated impacts per year.
Risk Assessment and Management
Financial Services
The slide analyzes the sensitivity of net interest income to shifts in the yield curve, broken down by year and currency. It provides financial projections and potential impacts, helping in risk assessment and financial planning. Used to guide strategic financial decisions and risk management in banking.
NII, yield curve, risk management, financial planning, currency impact, EUR, USD, 2024-2026, projections
false
Risk Assessment and Management
Financial Services
Multiple Chart
Deutsche Bank
Add to my slides
Remove from favorites
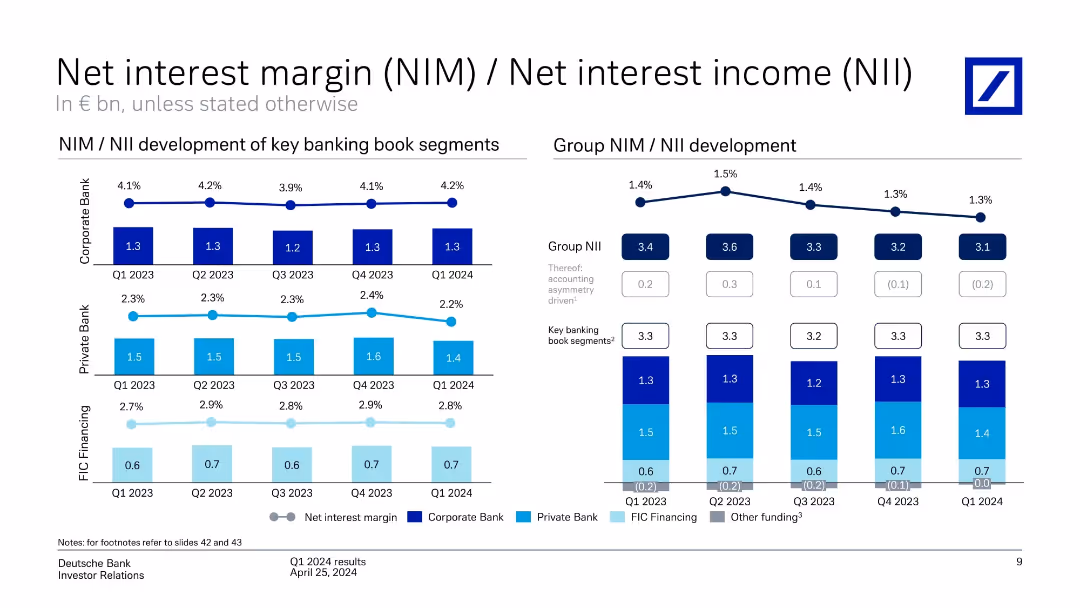
This slide features multiple line charts tracking the net interest margin development for Corporate and Private Banks. It includes column charts showing group NIM development. There's a side panel with key highlights in bullet points.
Financial Performance
Financial Services
The slide illustrates the development of net interest margins within a financial institution, comparing corporate and private banking sectors over several quarters.
NIM, banking, financial analysis, interest rates, quarterly performance
false
Financial Performance
Financial Services
Multiple Chart
Deutsche Bank
Add to my slides
Remove from favorites
Contains line and column charts showing the Net Interest Margin (NIM) development for Corporate and Private Banks. Includes data points over multiple quarters.
Financial Performance
Financial Services
Details trends in Net Interest Margin for Deutsche Bank's Corporate and Private Banking sectors, analyzing shifts in financial management strategies and market conditions.
NIM, banking, interest rates, financial analysis, trends
false
Financial Performance
Financial Services
Multiple Chart
Deutsche Bank
Add to my slides
Remove from favorites
Slide displays two line charts for Divisional NIM development and a column chart for Group NIM development. Key highlights in text.
Financial Performance
Financial Services
This slide presents the quarterly development of net interest margins for different banking divisions, detailing factors influencing these metrics, such as asset growth and policy changes.
NIM, banking, quarterly, asset growth, metrics, interest, development, corporate, private
false
Financial Performance
Financial Services
Multiple Chart
Deutsche Bank
Add to my slides
Remove from favorites
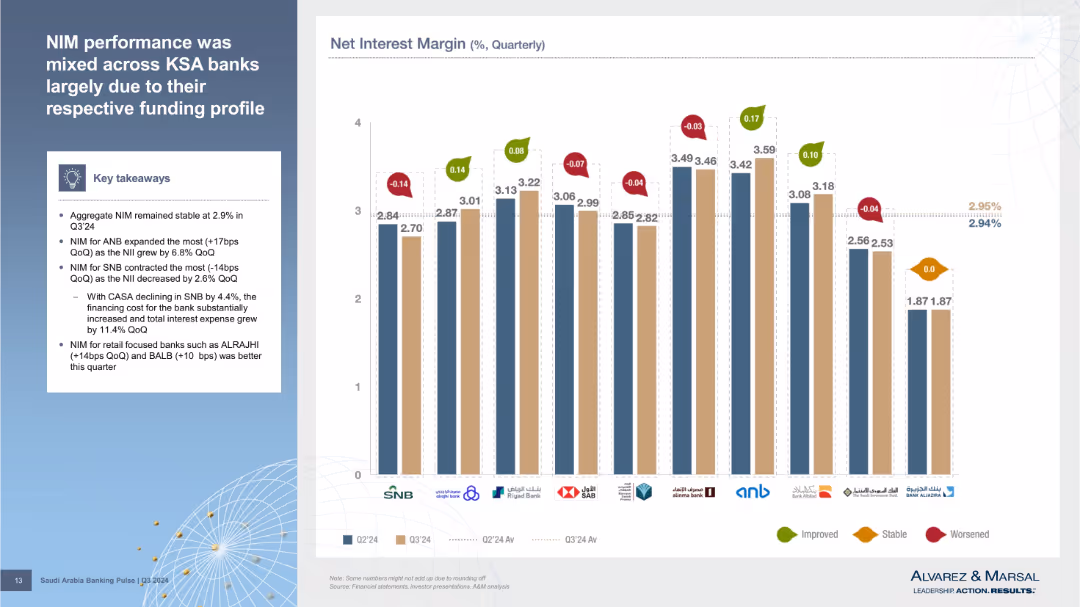
Left has textual insights; right features bar graph comparing Net Interest Margin by bank, with change indicators (colored arrows).
Performance Metrics and KPIs
Financial Services
Examines variation in NIM among individual banks for Q3’24, attributing changes to funding profiles and CASA movement. Highlights SNB and ANB as outliers in performance.
NIM, CASA, net interest margin, bank performance, funding cost, Q3’24, KSA banks, margin analysis
false
Performance Metrics and KPIs
Financial Services
Mixed Chart
Alvarez & Marsal
Add to my slides
Remove from favorites
Detailed line graphs show NIM trends across divisions, complemented by column chart that represent average interest earning assets. The design is clean, with blue and gray colors providing distinct visual segments.
Financial Performance
Financial Services
Analyzes NIM performance in Deutsche Bank's corporate and private banking sectors, showing past and current trends, and how they compare to the overall group NIM. Useful for financial analysis and strategic decision-making.
NIM, interest margins, financial analysis, banking sectors
false
Financial Performance
Financial Services
Multiple Chart
Deutsche Bank
Add to my slides
Remove from favorites
This slide uses line charts to show the Net Interest Margin (NIM) development for different banking sectors over time, presented in a clean and organized manner.
Financial Performance
Financial Services
Discusses the impact of interest rates on Net Interest Margin in different banking sectors, providing insights into financial trends and earnings. This slide is valuable for financial presentations focusing on interest rate impacts and profitability.
NIM, interest rates, banking, finance, profitability
false
Financial Performance
Financial Services
Multiple Chart
Deutsche Bank
Add to my slides
Remove from favorites
Dual-panel layout: bar chart of group NII/NIM on the left and segmented banking performance table on the right. Uses consistent blue tones for segment differentiation.
Performance Metrics and KPIs
Financial Services
Displays the quarterly development of net interest income and margin for FY 2024. Breaks down performance by corporate, private, and FIC financing segments. Indicates margin stability and segment-specific performance over time.
NIM, NII, banking income, segment margin, FY2024, interest earnings
false
Performance Metrics and KPIs
Financial Services
Multiple Chart
Deutsche Bank
Add to my slides
Remove from favorites
Multiple mini-bar charts tracking NIM and NII over five quarters for Corporate, Private Bank, and Group levels. Color-coded segments with annotations.
Financial Performance
Financial Services
Tracks trends in net interest margin and income across key divisions. Group NII remains stable while margin slightly declines. Illustrates income components and effects of funding costs across banking units.
NIM, NII, interest income, banking segments, margin trends
false
Financial Performance
Financial Services
Multiple Chart
Deutsche Bank
Add to my slides
Remove from favorites
Contains line graphs and column charts detailing the net interest margin (NIM) for different bank divisions and the group overall, alongside key financial highlights.
Performance Metrics and KPIs
Financial Services
Analyzes the net interest margin trends within the bank, highlighting changes due to market conditions and bank strategies, crucial for assessing profitability.
NIM, trends, profitability, bank strategy
false
Performance Metrics and KPIs
Financial Services
Multiple Chart
Deutsche Bank
Add to my slides
Remove from favorites
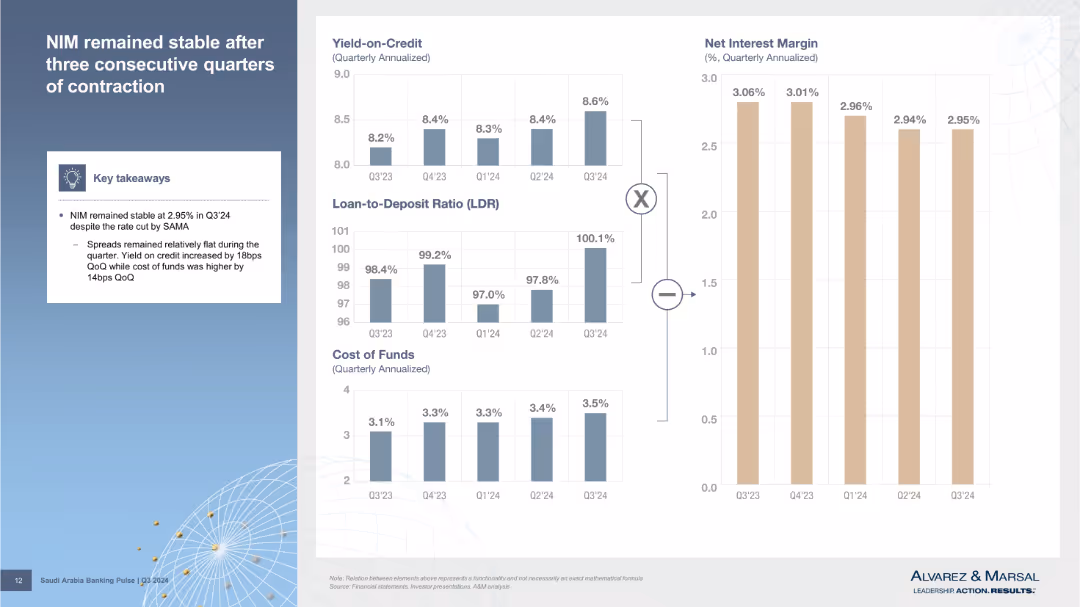
Left column features key takeaways; right contains small stacked bar charts for yield on credit, LDR, CoF, and NIM trends. Clean, modular layout.
Performance Metrics and KPIs
Financial Services
Discusses Net Interest Margin (NIM) stability in Q3’24. Shows relationships between yield on credit, loan-to-deposit ratio, and cost of funds using visual breakdowns.
NIM, yield, cost of funds, LDR, interest margin, Q3’24, SAMA, bank metrics, credit spreads
false
Performance Metrics and KPIs
Financial Services
Multiple Chart
Alvarez & Marsal
Add to my slides
Remove from favorites
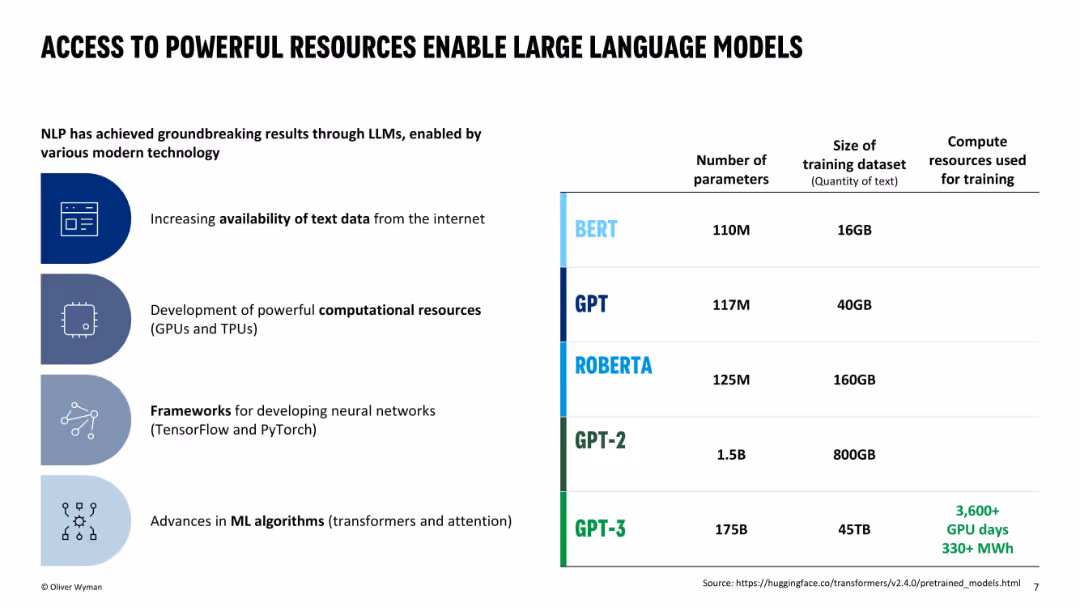
Split design: infographic list on the left and comparison table on the right detailing NLP models (BERT, GPT-3, etc.) by size, training data, and compute power.
Technology and Digital Transformation
Artificial Intelligence
This slide details the technological enablers behind modern NLP success, including data availability, compute power, and frameworks. It compares different language models like BERT, RoBERTa, GPT-2, and GPT-3 in terms of parameters, datasets, and compute needs, emphasizing GPT-3's scale and power.
NLP, GPT-3, compute power, data availability, language models, parameters, training size, transformers
false
Technology and Digital Transformation
Artificial Intelligence
Table
Oliver Wyman
Add to my slides
Remove from favorites
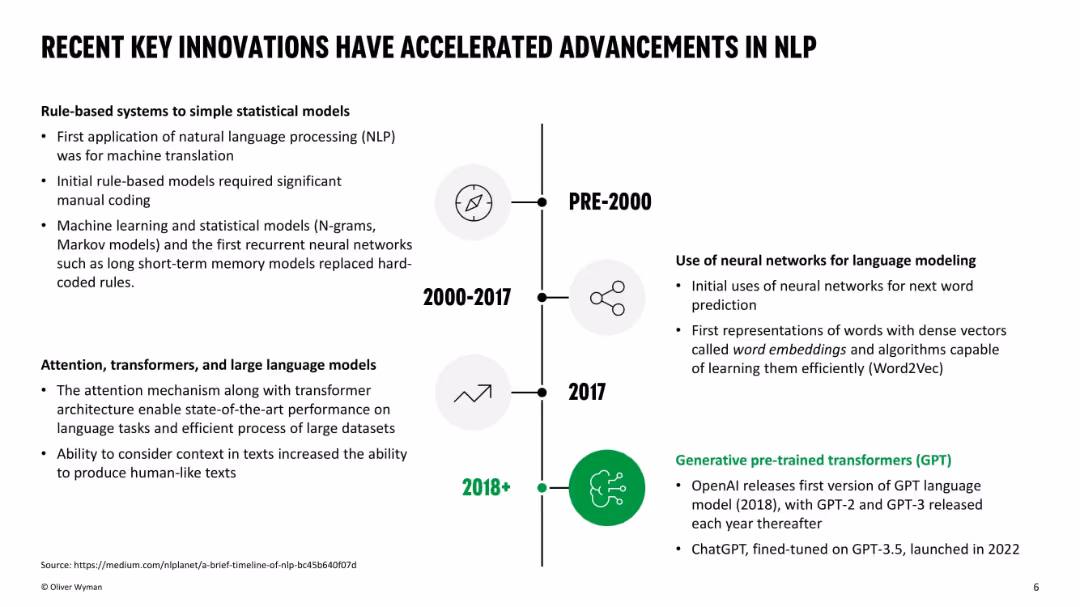
Vertical timeline with milestones and brief summaries from pre-2000 to post-2018, including GPT advancements. Icons and sectioned visual design with bold headings.
Technology and Digital Transformation
Artificial Intelligence
A historical overview of natural language processing (NLP) innovation, progressing from rule-based models to modern large language models like GPT. Highlights key technological transitions: statistical models, neural networks, and transformers, ending with generative pre-trained models starting in 2018.
NLP, GPT, timeline, AI, language models, transformers, embeddings, Word2Vec, innovation
false
Technology and Digital Transformation
Artificial Intelligence
Header Vertical
Oliver Wyman
Add to my slides
Remove from favorites
Column charts displaying the composition of non-core and legacy assets by type and source, along with textual explanations.
Strategic Planning
Financial Services
This slide details the exit strategy for non-core and legacy assets, including governance, risk management, and reduction targets.
non-core, legacy, assets, UBS, Credit Suisse
false
Strategic Planning
Financial Services
Multiple Chart
UBS
Add to my slides
Remove from favorites
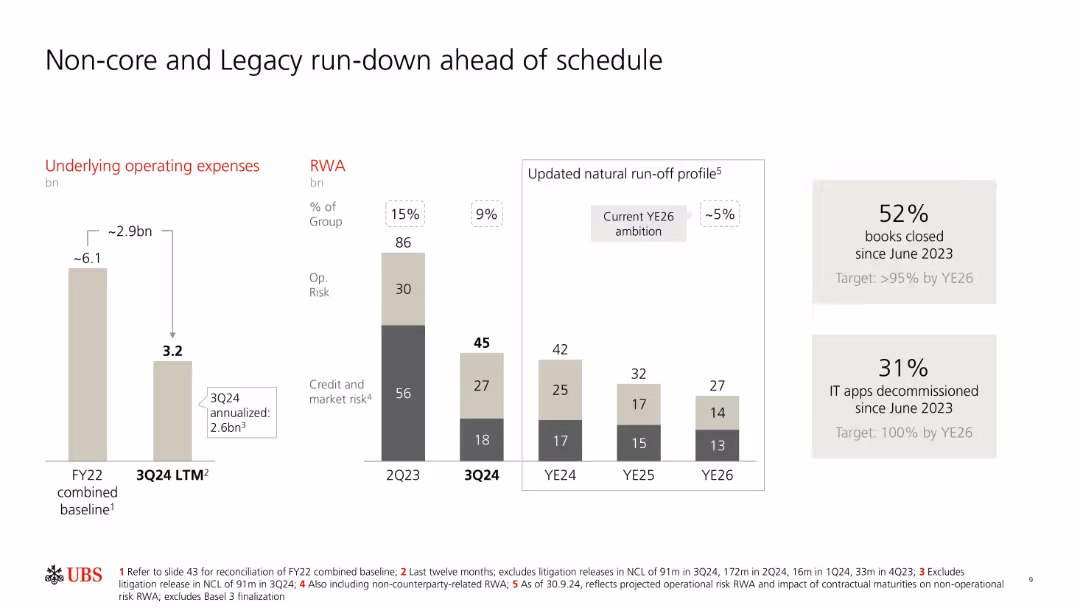
Mixed bar charts comparing FY22 baseline to 3Q24 and future targets for expenses and risk-weighted assets.
Risk Assessment and Management
Financial Services
Details the reduction in non-core and legacy operations, showing major declines in expenses and RWA. It presents run-off profile projections and operational achievements since June 2023 like book closures and IT decommissioning.
non-core, legacy, risk reduction, RWA, operational risk, UBS
false
Risk Assessment and Management
Financial Services
Multiple Chart
UBS
Add to my slides
Remove from favorites
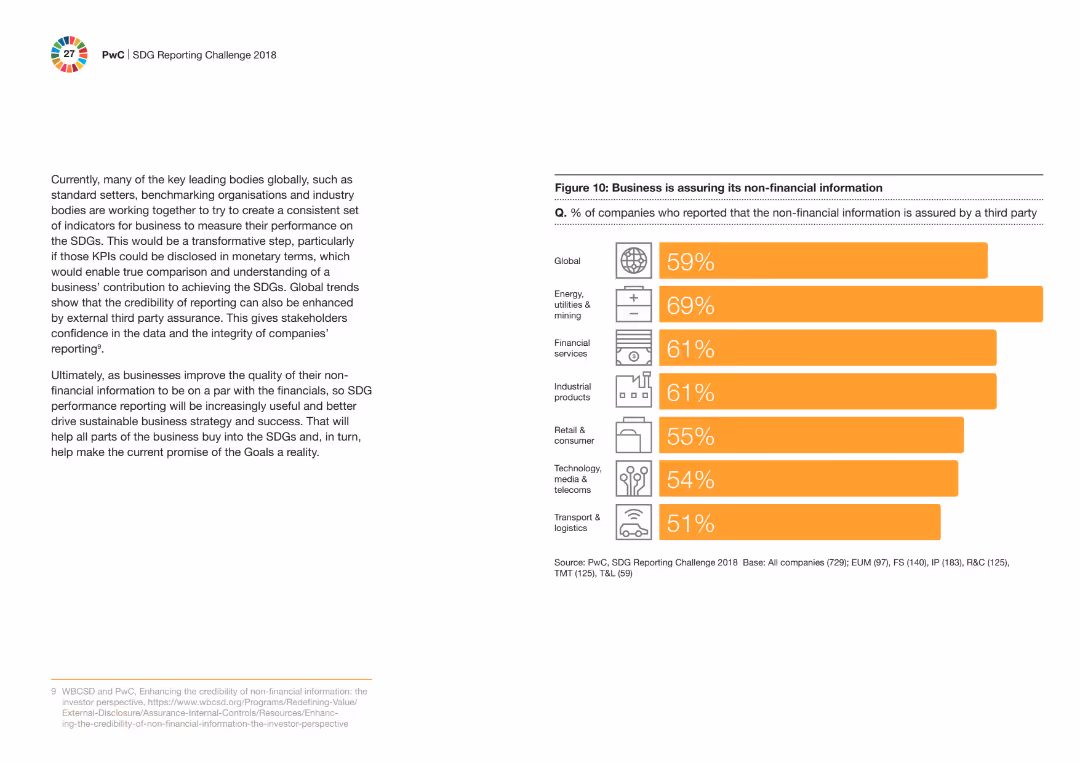
The slide shows a column chart with the percentage of companies ensuring their non-financial information is assured by a third party across different industries. Text explains the importance of non-financial information assurance.
Regulatory and Compliance
Financial Services
It highlights the percentage of companies across various industries that have their non-financial information assured by third parties, emphasizing the growing trend and its importance in achieving SDG goals.
non-financial information, assurance, third party, compliance, financial services, SDGs, column chart, industry percentages
false
Regulatory and Compliance
Financial Services
Mixed Chart
PwC/Strategy&
Add to my slides
Remove from favorites
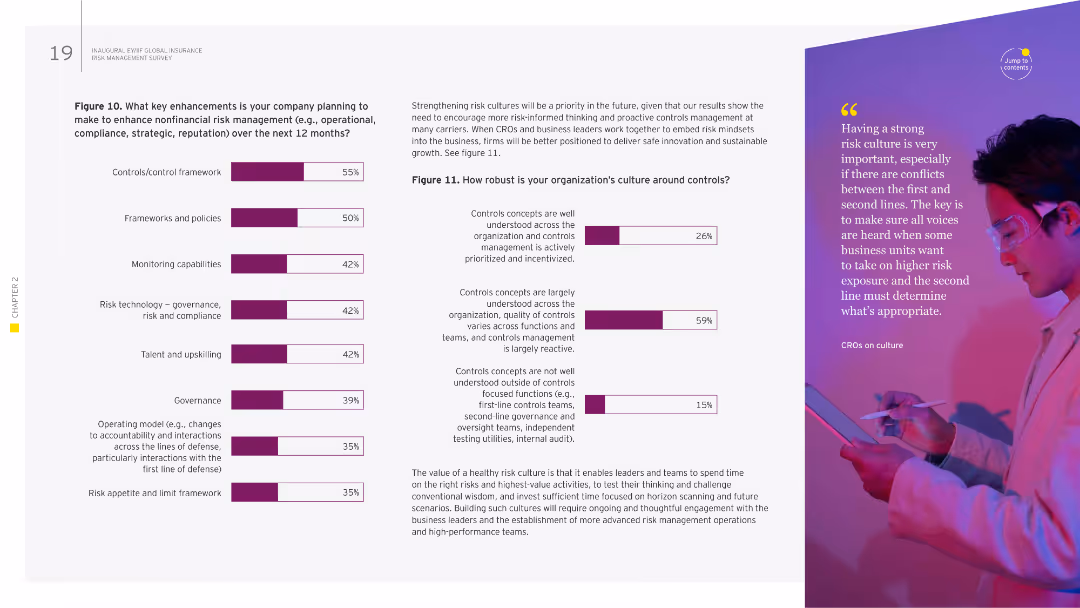
The slide has a two-column layout with a title and text discussing enhancements in nonfinancial risk management, supported by a column chart listing key planned actions.
Risk Assessment and Management
Financial Services
This slide outlines planned enhancements in nonfinancial risk management, focusing on governance, monitoring capabilities, and control frameworks, to ensure comprehensive risk mitigation.
nonfinancial risk management, enhancements, governance, monitoring, control frameworks
false
Risk Assessment and Management
Financial Services
Multiple Chart
EY
Add to my slides
Remove from favorites
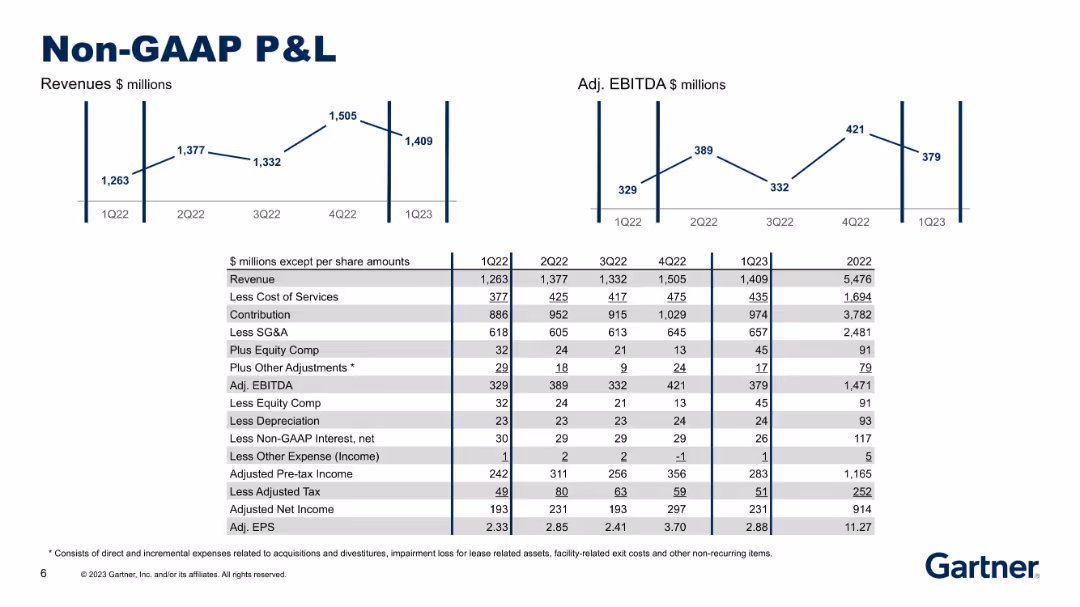
Two simple charts (Revenue, EBITDA) on top, detailed income statement table below showing adjustments to derive Non-GAAP metrics.
Financial Performance
Technology & Software
Illustrates a Non-GAAP profit and loss view with adjustments for SG&A, equity comp, and other items. Breaks down income from revenue to EPS, showing EBITDA as a key metric and providing a bridge to adjusted earnings.
non-GAAP, EBITDA, P&L, revenue, adjusted EPS, SG&A, financials
false
Financial Performance
Technology & Software
Multiple Chart
Gartner
Add to my slides
Remove from favorites
Slide with a table and line charts showing non-GAAP P&L figures, revenue, cost of services, contribution, and adjusted EBITDA over four quarters.
Financial Performance
Professional Services
This slide presents Gartner's non-GAAP profit and loss statement, including revenue, costs, and adjusted EBITDA, with accompanying quarterly trends.
Non-GAAP, P&L, revenue, EBITDA, Gartner
false
Financial Performance
Professional Services
Multiple Chart
Gartner
Add to my slides
Remove from favorites
The slide features a table with non-GAAP financial metrics and a column chart showing revenue and EBITDA for multiple quarters.
Financial Performance
Financial Services
It outlines non-GAAP profit and loss figures, including revenue, cost of services, SG&A expenses, and adjusted EBITDA.
Non-GAAP, Revenue, EBITDA, SG&A, Cost of Services, Adjustments
false
Financial Performance
Financial Services
Multiple Chart
Gartner
Add to my slides
Remove from favorites
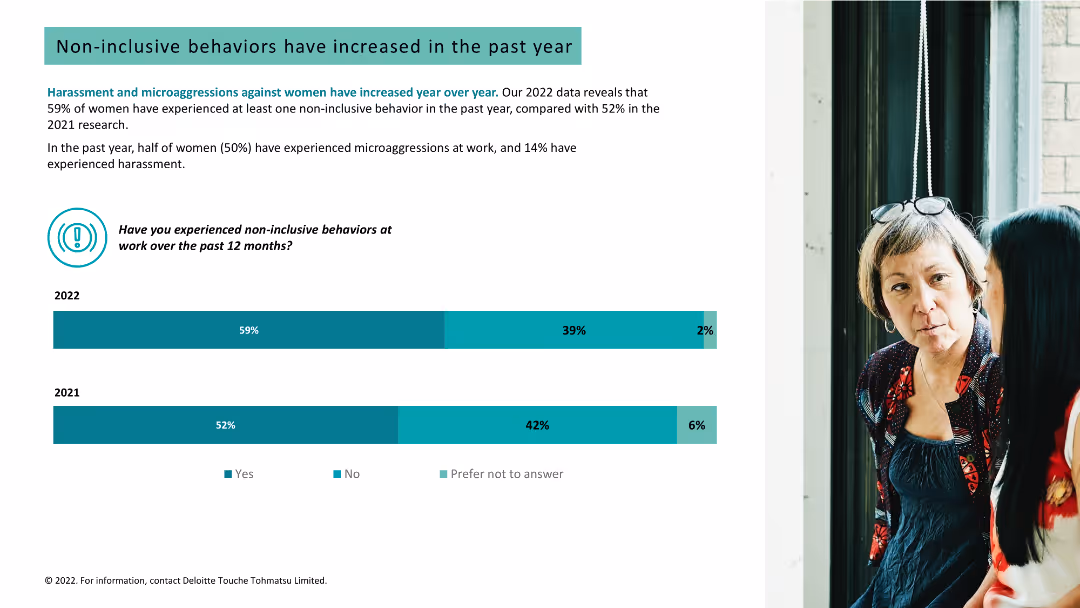
Column chart, text, and image of two women in conversation. Comparison of non-inclusive behaviors experienced by women in 2021 vs. 2022.
Human Resources and Talent Management
Professional Services
Highlights the increase in harassment and microaggressions against women over the past year and the percentage of women experiencing these behaviors.
non-inclusive behaviors, harassment, microaggressions, increase, women, workplace, year comparison, engagement, workplace culture
false
Human Resources and Talent Management
Professional Services
Mixed Chart
Deloitte
Add to my slides
Remove from favorites
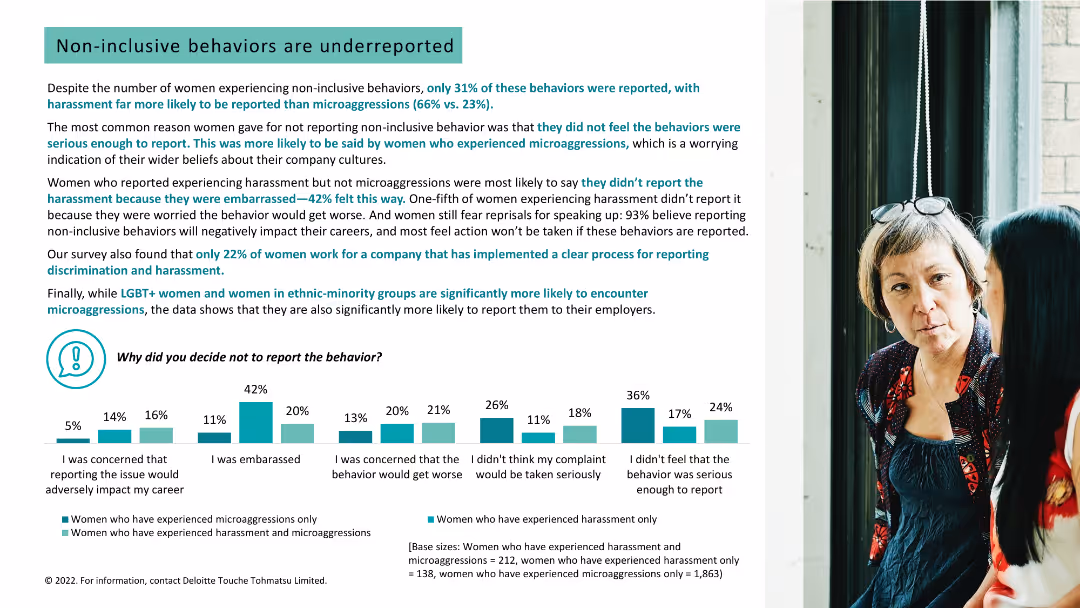
Column charts, text, and image of two women in conversation. Reasons for not reporting non-inclusive behaviors and data on reporting rates.
Human Resources and Talent Management
Professional Services
Discusses the reasons why women do not report non-inclusive behaviors, highlighting the underreporting of harassment and microaggressions.
non-inclusive behaviors, underreporting, harassment, microaggressions, reasons, women, workplace, reporting, engagement
false
Human Resources and Talent Management
Professional Services
Mixed Chart
Deloitte
Add to my slides
Remove from favorites
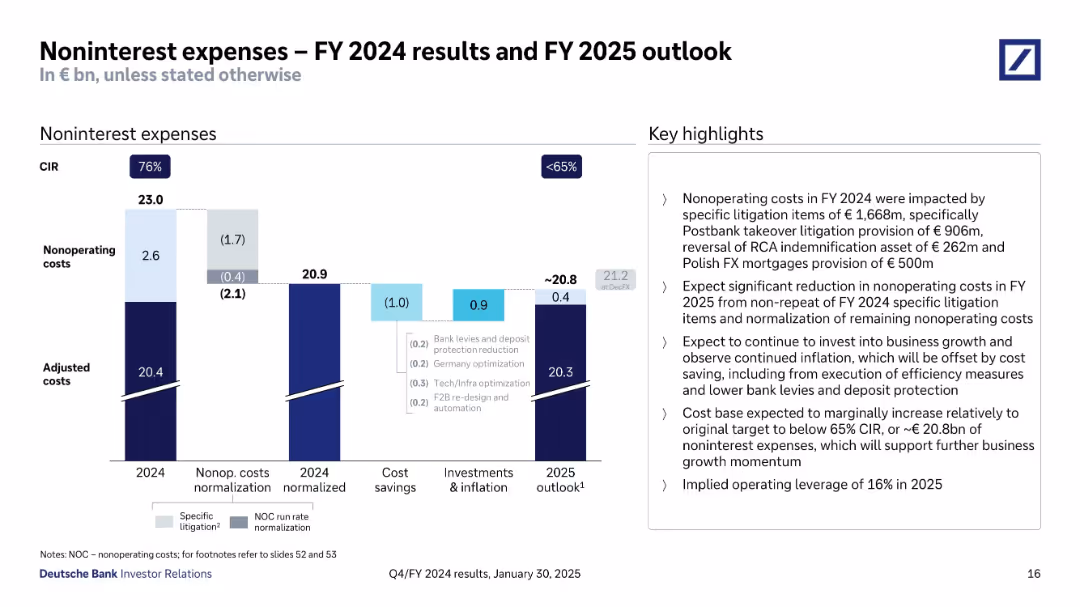
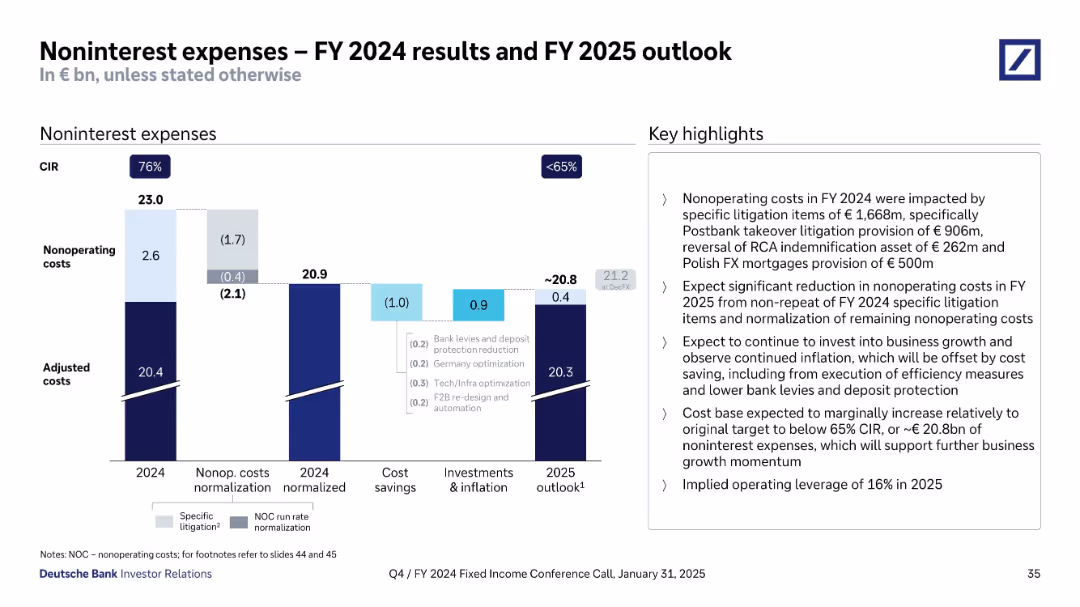
Clustered bar chart visualizing cost breakdown: actual, normalized, cost savings, and outlook. Highlights section explains litigation and cost reduction drivers.
Financial Performance
Financial Services
Breaks down Deutsche Bank’s noninterest expenses in FY 2024 and forecast for FY 2025. Focuses on litigation-related items and normalized cost base. Describes efficiency measures expected to bring CIR below 65% with implied 16% operating leverage in 2025.
noninterest costs, CIR, litigation, 2025 forecast, cost savings
false
Financial Performance
Financial Services
Mixed Chart
Deutsche Bank
Add to my slides
Remove from favorites
The slide includes two large column charts flanking a central area with detailed breakdowns of noninterest expenses, highlighted by various colors and icons to distinguish between categories.
Strategic Planning
Financial Services
Discusses the expected changes in noninterest expenses at JPMorgan Chase & Co. and the strategic implications of these changes for funding investment growth.
noninterest expense, investment growth, structural expenses, JPMorgan, strategy, funding
false
Strategic Planning
Financial Services
Single Chart
JP Morgan
Add to my slides
Remove from favorites
Vertical bar chart detailing 2024 noninterest expenses and forecasted 2025 costs, separating operating and non-operating components; insights listed right.
Strategic Planning
Financial Services
Details 2024 noninterest expenses, highlighting litigation and FX as drivers. Forecasts €20.8bn in 2025 expenses due to cost savings, reinvestments, and inflation. Aims for <65% CIR and continued support for business growth.
noninterest expenses, litigation, FY 2025 outlook, CIR, cost savings
false
Strategic Planning
Financial Services
Mixed Chart
Deutsche Bank
Add to my slides
Remove from favorites
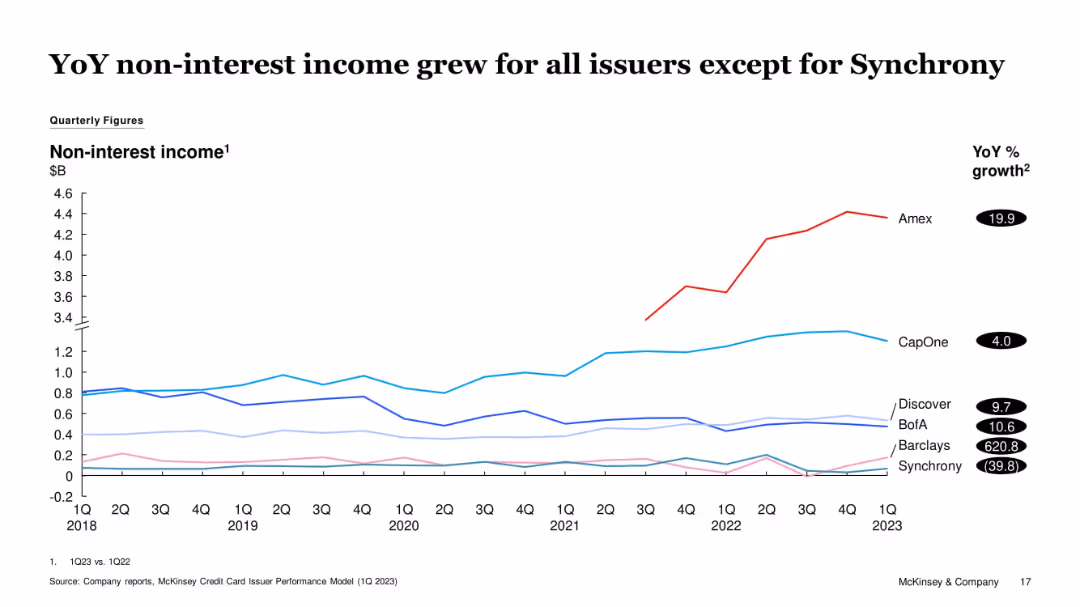
Multi-line graph of issuer-level non-interest income from 1Q18 to 1Q23. Amex stands out with significant growth. Synchrony declined. YoY % growth values listed on right.
Financial Performance
Financial Services
The slide shows YoY growth in non-interest income for most issuers, with Amex leading. Synchrony is the only issuer with a negative trend. The slide indicates strengthening of fee-based revenue for most firms, contributing to financial resilience.
Non-interest Income, Amex, Synchrony, Fee Revenue, Financial Trends, Credit Cards
false
Financial Performance
Financial Services
Single Chart
McKinsey
Add to my slides
Remove from favorites
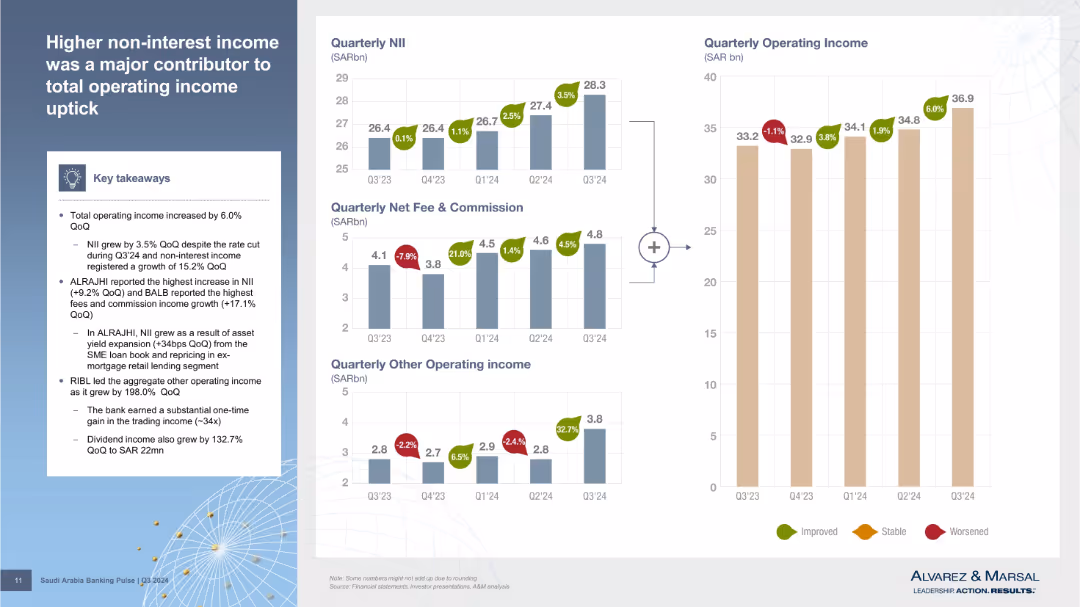
Contains three bar charts: NII, net fee & commission, and other operating income; combined with operating income bar chart. Key takeaways on left.
Financial Performance
Financial Services
Breaks down growth in total operating income driven by NII, fees, and other income. Highlights ALRAJHI and RIBL for standout performance in specific income categories.
non-interest income, fee income, operating income, ALRAJHI, RIBL, Q3’24, SAR, growth drivers, income breakdown
false
Financial Performance
Financial Services
Multiple Chart
Alvarez & Marsal
Add to my slides
Remove from favorites
The slide is divided into two main sections, with a large column chart on the left showing noninterest revenue growth, and a smaller area on the right with textual data and percentage increases.
Financial Performance
Financial Services
Highlights the growth of noninterest revenue at JPMorgan Chase & Co., with a focus on volume-driven revenue components, useful for financial analysis or investor presentations.
noninterest revenue, CAGR, growth, financial, banking, JPMorgan
false
Financial Performance
Financial Services
Multiple Chart
JP Morgan
Add to my slides
Remove from favorites
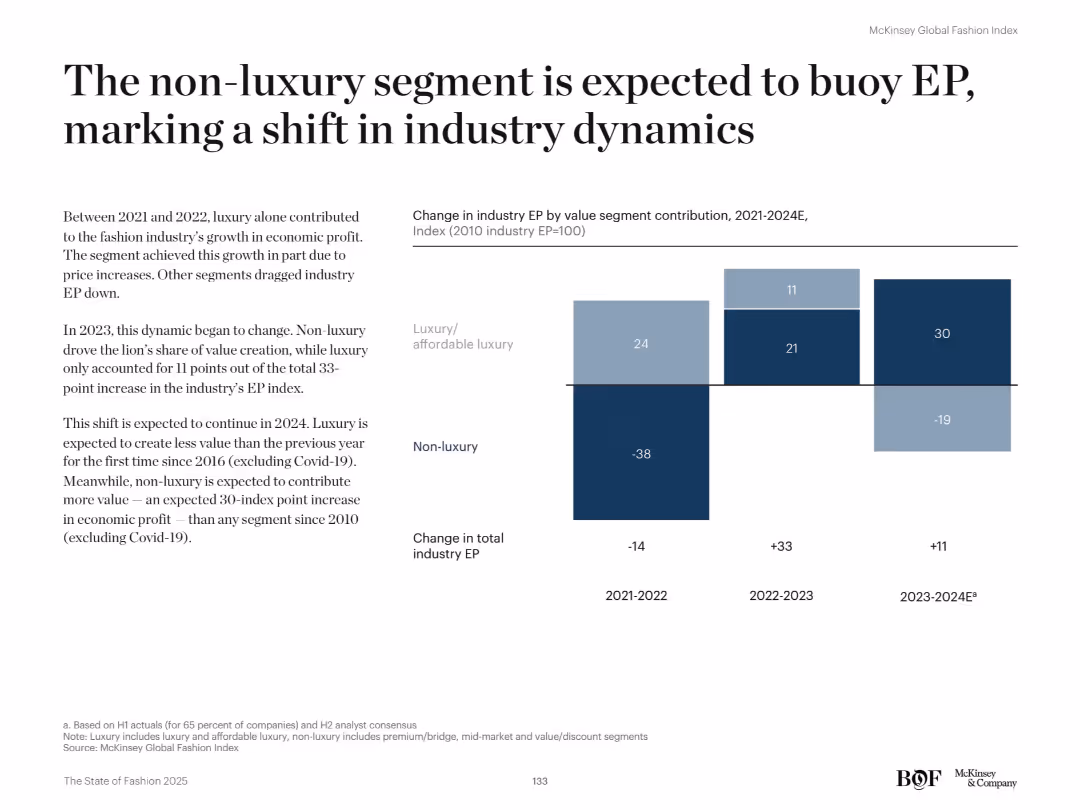
Split bar chart showing EP contribution by luxury and non-luxury segments from 2021 to 2024E. Left-side text explains the shift.
Market Analysis and Trends
Retail & E-commerce
This slide highlights a shift in value creation from luxury to non-luxury segments. From 2023 onward, non-luxury drives the majority of industry EP growth, reversing previous trends where luxury was dominant.
Non-luxury, luxury, EP contribution, market trends, fashion dynamics, economic profit, segment growth, value creation, retail, affordability
false
Market Analysis and Trends
Retail & E-commerce
Mixed Chart
McKinsey
Add to my slides
Remove from favorites
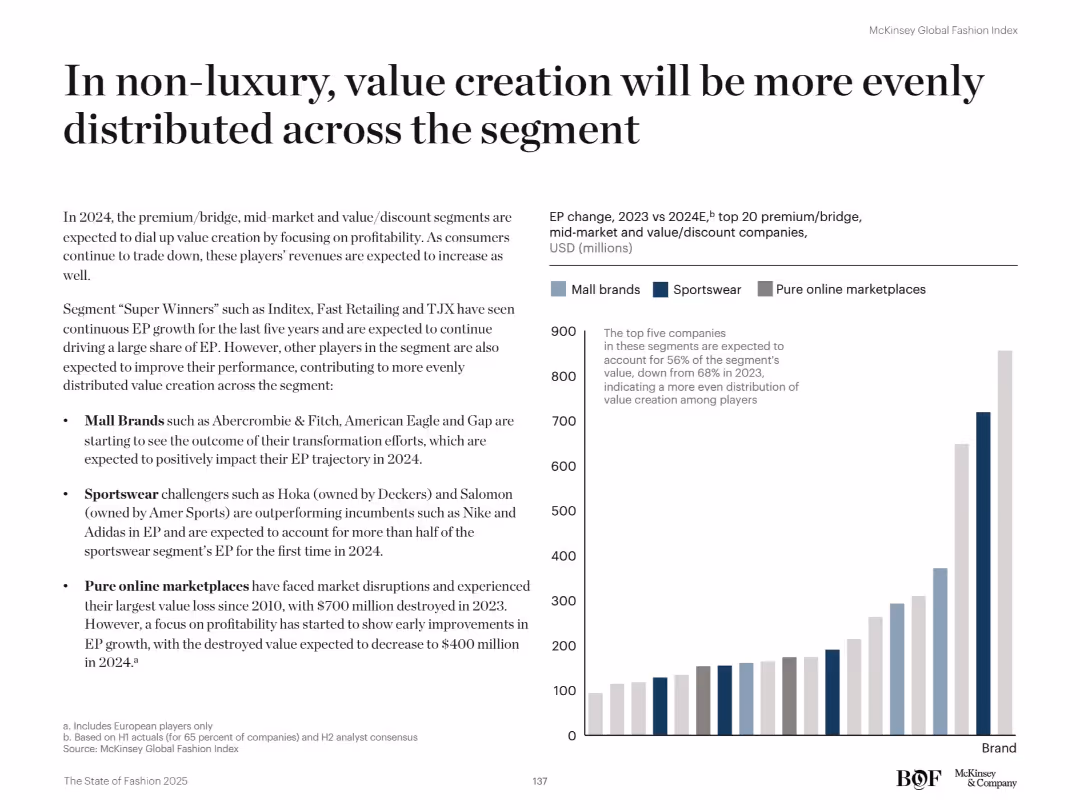
Left text discusses drivers of balanced value creation. Right bar chart categorizes EP growth by brand type (Mall, Sportswear, Online).
Strategic Planning
Retail & E-commerce
The slide shows that in 2024, value creation within non-luxury segments (mall brands, sportswear, online) will be more evenly spread. Growth is no longer driven by a few top performers, indicating broader improvements across brands.
Non-luxury, value creation, EP growth, segment balance, sportswear, online retail, mall brands, fashion strategy, brand performance
false
Strategic Planning
Retail & E-commerce
Mixed Chart
McKinsey
Add to my slides
Remove from favorites
A split bar graph on the right shows the percentage of metro versus non-metro digital consumers. The left side of the slide has a large title and a descriptive text. The top-right corner has the same light blue overlay text as slide 1412.
Market Analysis and Trends
Technology & Software
Highlights the surge in new digital consumers from non-metro areas, providing insights into market segmentation and potential areas for expansion in the internet economy.
non-metro, internet economy, digital consumers, segmentation, market analysis, adoption rates
false
Market Analysis and Trends
Technology & Software
Single Chart
Bain
Add to my slides
Remove from favorites
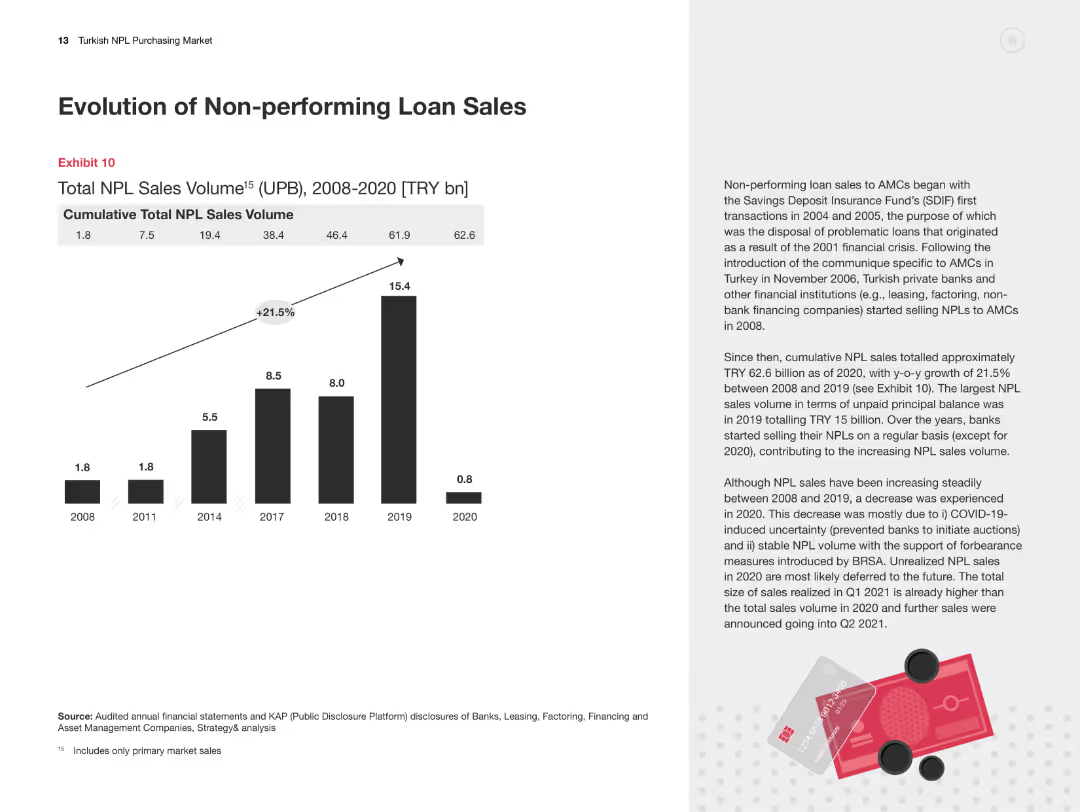
Column chart showing cumulative total NPL sales volume from 2008-2020. Text on the right explains trends and changes.
Market Analysis and Trends
Financial Services
The slide provides data on the cumulative total NPL sales in Turkey from 2008-2020, highlighting growth trends and key factors.
Non-performing loans, NPL sales, financial trends, market analysis, Turkey
false
Market Analysis and Trends
Financial Services
Mixed Chart
PwC/Strategy&
Add to my slides
Remove from favorites
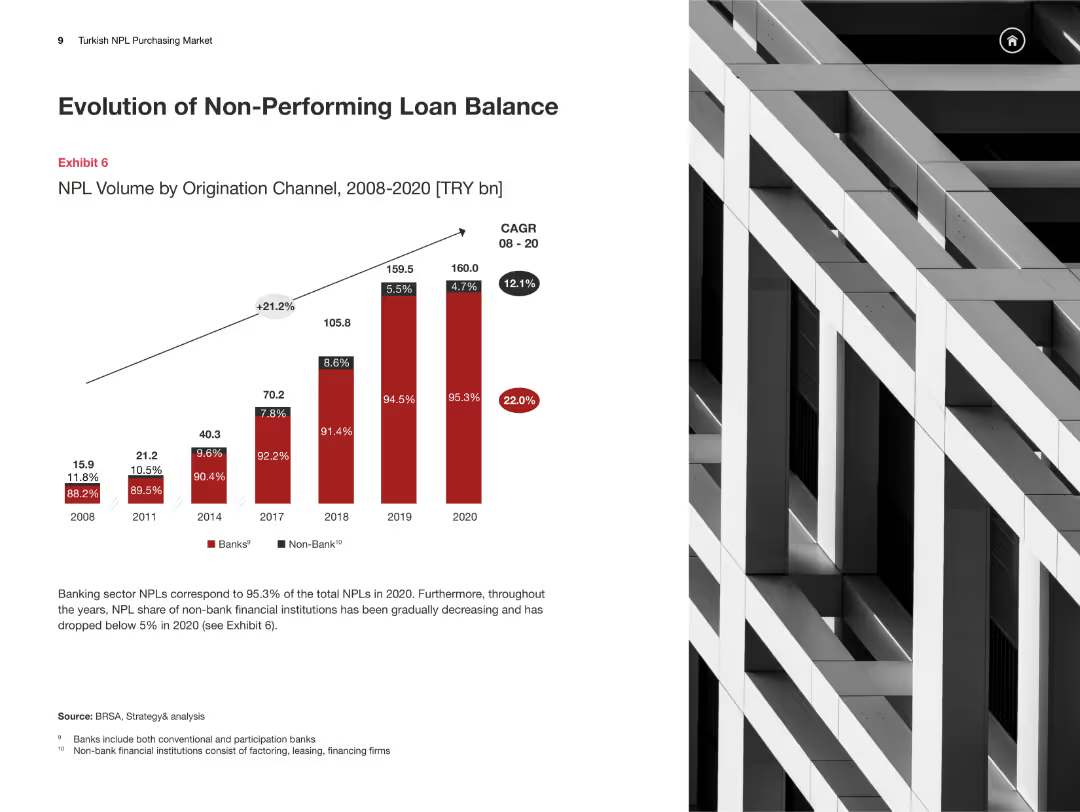
The slide includes a column chart showing the NPL volume by origination channel from 2008 to 2020, with a detailed explanation of the trends and market implications.
Risk Assessment and Management
Financial Services
This slide analyzes the evolution of non-performing loans (NPLs) in the Turkish banking sector, focusing on the changes in NPL volumes by origination channel over time.
Non-Performing Loans, NPL, Turkey, Origination Channel, Risk Assessment
false
Risk Assessment and Management
Financial Services
Mixed Chart
PwC/Strategy&
Add to my slides
Remove from favorites
Dual panel layout with circular charts comparing non-traditional vs traditional care usage on the left and an image on the right.
Market Analysis and Trends
Healthcare & Pharmaceuticals
Analyzes the preference for non-traditional healthcare services over traditional ones for specific needs like cold treatment and mental health.
non-traditional, healthcare, needs, comparison, preference
false
Market Analysis and Trends
Healthcare & Pharmaceuticals
Mixed Chart
Accenture
Add to my slides
Remove from favorites
Dual panel layout with a large image on the left and bar charts on the right showing use of non-traditional healthcare services.
Market Analysis and Trends
Healthcare & Pharmaceuticals
Highlights the growing popularity of non-traditional healthcare services such as virtual care and walk-in clinics among US respondents.
non-traditional, healthcare, services, popularity, virtual care
false
Market Analysis and Trends
Healthcare & Pharmaceuticals
Mixed Chart
Accenture
Add to my slides
Remove from favorites
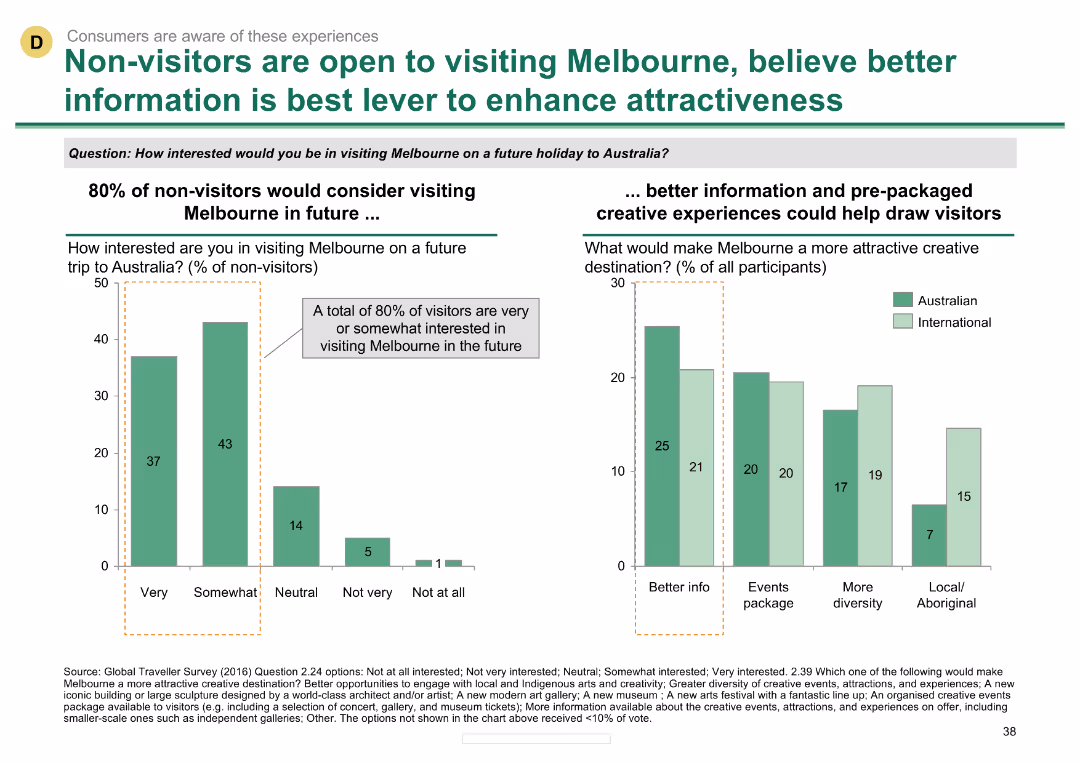
Column chart showing interest in visiting Melbourne among non-visitors and factors enhancing attractiveness
Customer and Market Segmentation
Hospitality & Tourism
Suggests that better information and pre-packaged creative experiences could attract more visitors to Melbourne.
Non-visitors, Melbourne, attractiveness, information, creative experiences
false
Customer and Market Segmentation
Hospitality & Tourism
Multiple Chart
BCG
Add to my slides
Remove from favorites
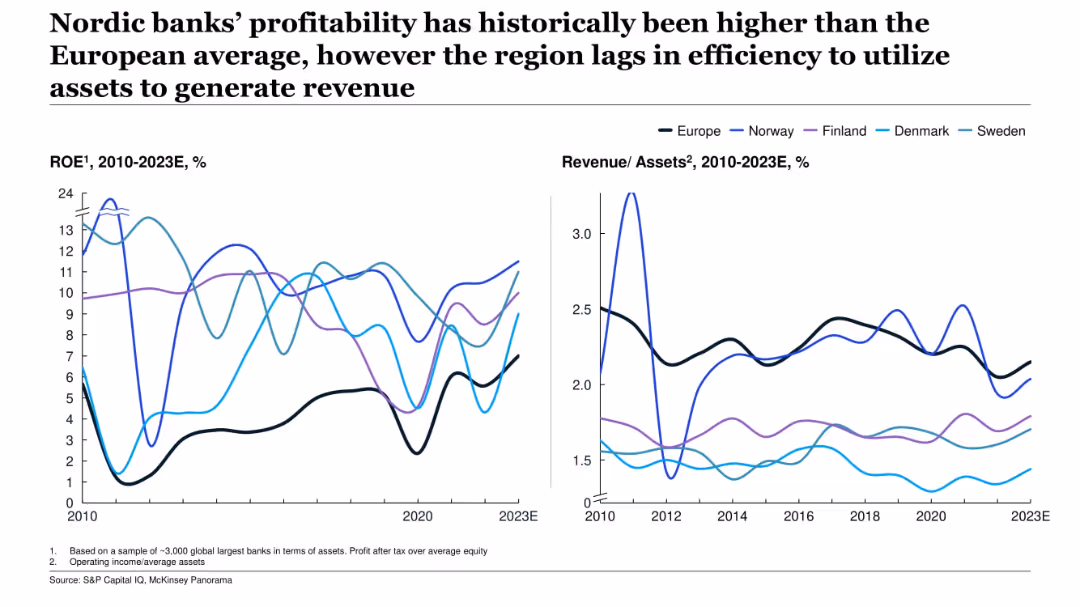
Two line graphs: ROE and revenue/assets over time (2010–2023E); Nordic countries vs. Europe benchmark.
Financial Performance
Financial Services
This slide compares Nordic banks’ historical performance to the European average, showing higher ROE but lower efficiency in asset utilization. It highlights a tradeoff where profitability is strong, yet revenue per asset remains relatively low, indicating efficiency gaps.
Nordic banks, ROE, profitability, revenue/assets, efficiency, finance, Europe, trends
false
Financial Performance
Financial Services
Multiple Chart
McKinsey
Add to my slides
Remove from favorites
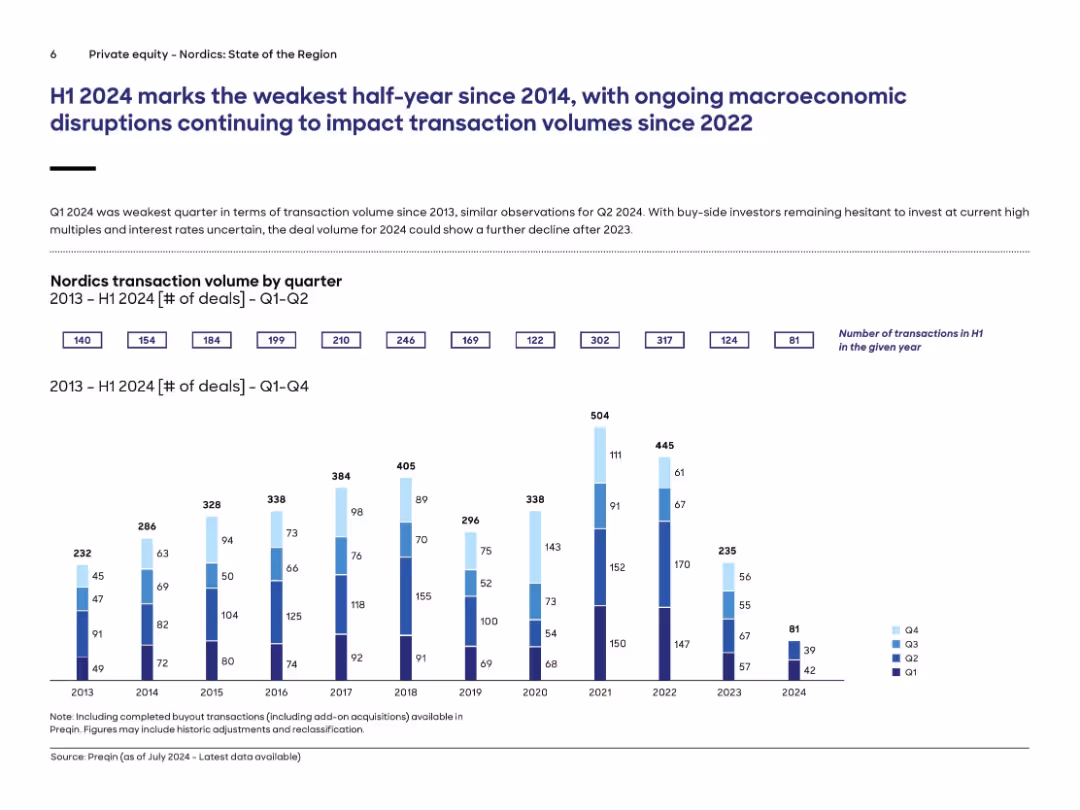
Dual-section layout with a title, subheading, and bar chart. The upper portion includes textual analysis; the lower portion features a multi-year transaction volume bar chart.
Financial Performance
Financial Services
This slide highlights the sharp decline in Nordic private equity transaction volumes, marking H1 2024 as the weakest since 2014. The bar chart shows quarterly deal counts from 2013 to 2024, emphasizing macroeconomic disruptions since 2022.
Nordic deals, private equity, 2024, Q1-Q2, transaction volume, Preqin, macroeconomic impact
false
Financial Performance
Financial Services
Single Chart
Roland Berger
Add to my slides
Remove from favorites
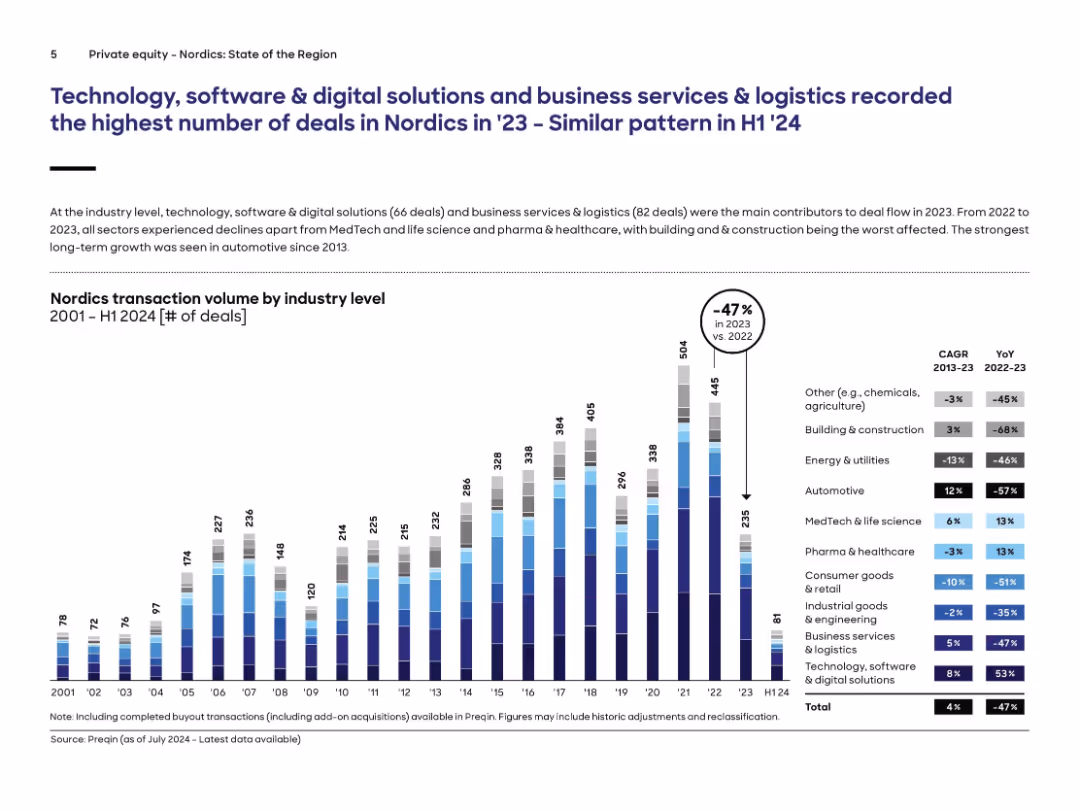
Bar chart focused on Nordics’ deal volumes by industry from 2001–H1 2024; industry segments are color-coded; growth/decline rates shown.
Market Analysis and Trends
Financial Services
Nordics transaction volumes fell by 47% in 2023, driven by declines across most sectors. However, digital solutions and business services remained dominant. The only sectors with YoY growth were MedTech/life sciences and pharma. The long-term growth leader was automotive. The chart segments deal volume by industry, showing trends and relative contributions to overall volume.
Nordics, private equity, industry trend, transactions, decline, MedTech, digital solutions, logistics
false
Market Analysis and Trends
Financial Services
Single Chart
Roland Berger
Add to my slides
Remove from favorites
Slide has an abstract blue background with three pie charts representing statistics about organizational readiness in the Nordics concerning different workplace trends.
Market Analysis and Trends
Professional Services
Focused on the readiness of organizations in the Nordics to adapt to workplace changes, including technology use and navigating job transitions.
Nordics, readiness, technology, workplace trends, organizational readiness, adaptation
false
Market Analysis and Trends
Professional Services
Multiple Chart
Deloitte
Add to my slides
Remove from favorites
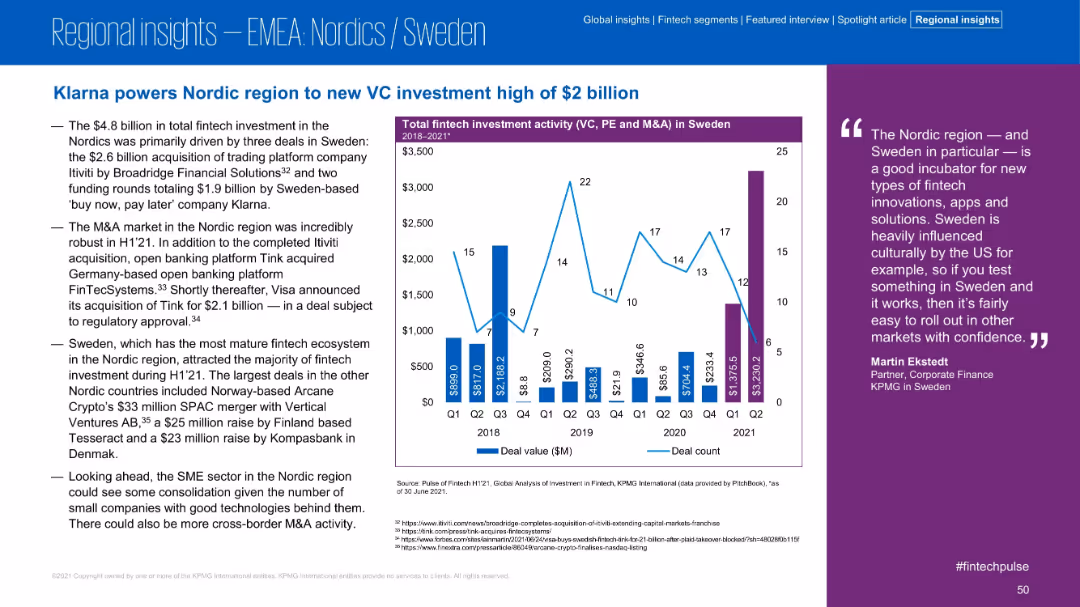
Layout mirrors other regional slides; commentary on the left, bar/line chart in center-right, expert quote far right. Emphasis on Sweden.
Investment Analysis
Financial Services
The Nordic region, led by Sweden, achieved record VC investment levels in H1 2021 due to major deals including Klarna and Itiviti. The slide emphasizes Sweden’s leadership in fintech and its role as a testing ground for innovation.
Nordics, Sweden, Klarna, VC Investment, Fintech, H1 2021, Innovation, Itiviti
false
Investment Analysis
Financial Services
Mixed Chart
KPMG
Add to my slides
Remove from favorites
Abstract blue design with pie charts showing statistics about leveraging worker data and readiness in the Nordics for various workforce strategies.
Organizational Structure and Change
Professional Services
Covers readiness to use worker data for mutual benefits and the readiness of organizations in the Nordics to address workforce ecosystems and worker agency.
Nordics, workforce, worker data, mutual benefits, organizational readiness, relationship
false
Organizational Structure and Change
Professional Services
Multiple Chart
Deloitte
Add to my slides
Remove from favorites
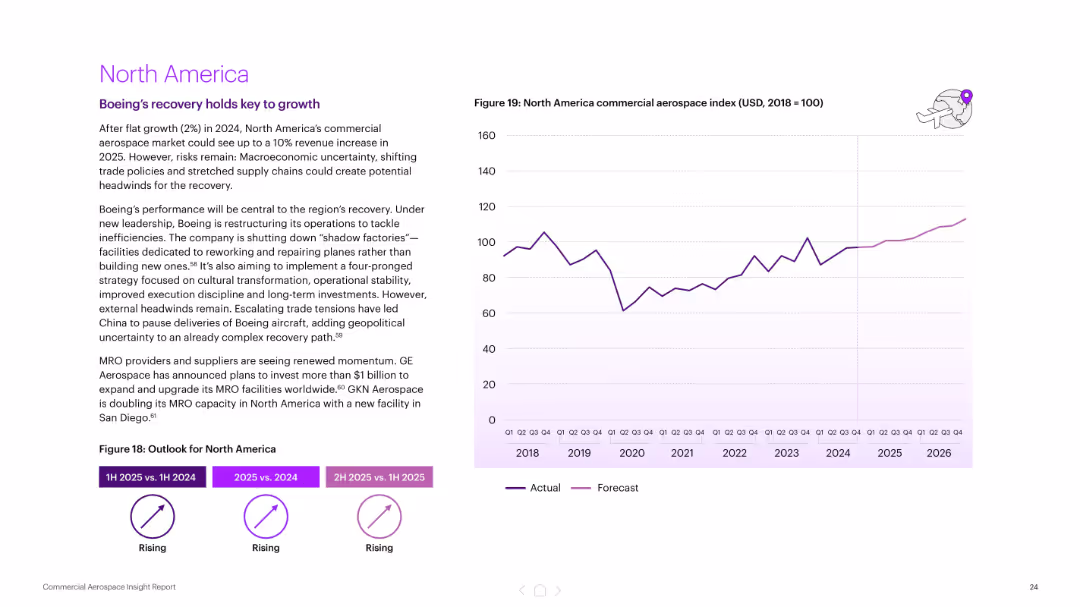
Left text with outlook and summary; right features a line chart (actual and forecast) of commercial aerospace index (2018–2026). Purple highlights.
Market Analysis and Trends
Industrial & Manufacturing
Describes North America’s modest recovery in aerospace, driven by Boeing's restructuring and renewed MRO investment. Notes risks from macroeconomics and trade. Forecasted 10% revenue growth for 2025.
North America, aerospace index, Boeing, recovery, forecast, MRO investment, commercial aviation, trade risks
false
Market Analysis and Trends
Industrial & Manufacturing
Mixed Chart
Accenture
Add to my slides
Remove from favorites
Previous
Next
You don't have any favorites yet.
Please wait loading your favorites slides...
Create a FREE account to continue browsing
Receive Instant Access to 1,000+ slides from companies like McKinsey, Google, and Goldman Sachs
First Name
Last Name
Email
Password
I agree to all
Terms & Privacy Policy
Thank you! Your submission has been received!
Oops! Something went wrong while submitting the form.
Have an account?
Sign in
Upgrade to PRO to Save slides
Advanced Search and Filters
Access to 15,000+ slides
Access to Category Pages
Save/Bookmark Slides
PowerPoint Template Library
Pick a Plan
MONTHLY
$12/month
Billed every month, Cancel anytime.
YEARLY
$9/year
Billed $108 annually, Cancel anytime.
Checkout for $12/month
Checkout for $108/yr
Secured by Stripe | AES-256 bit encryption