My Account
My Slides
Search by Category
Pricing
Templates
View All Templates
Download Template Slides
✦ AI Search
Feedback
Login
Logout
Get Started
Browse all Slides
Browse all Slides
Create a FREE Account
Instant access to 1,000+ real slides from top companies like McKinsey, BCG, Goldman Sachs, Google and many more!
First Name
Last Name
Email
Password
I agree to all
Terms & Privacy Policy
Thank you! Your submission has been received!
Oops! Something went wrong while submitting the form.
Have an account?
Sign in
Saved Slides
Total No. of slides saved
0
↻ Refresh
✖ Clear all
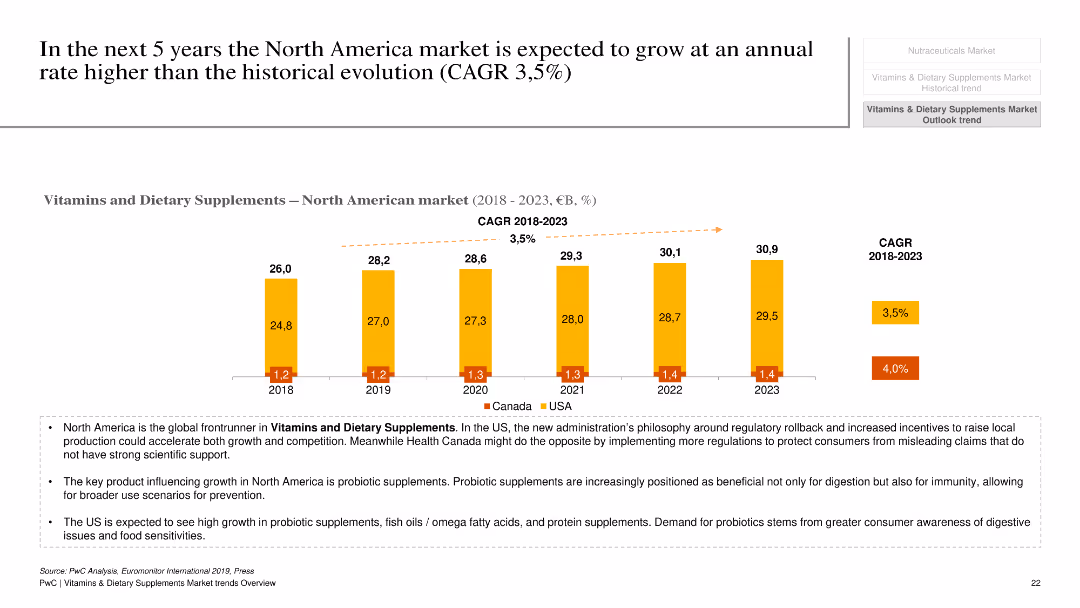
This slide contains a column chart depicting the growth of the North American market for vitamins and dietary supplements from 2018 to 2023, with separate data for the USA and Canada. Additional text provides key drivers and market dynamics.
Market Analysis and Trends
Healthcare & Pharmaceuticals
The slide forecasts the growth of the North American market for vitamins and dietary supplements, with a detailed breakdown for the USA and Canada. It discusses key drivers such as regulatory changes, consumer health awareness, and product trends, projecting a higher growth rate compared to historical trends.
North American market, vitamins, dietary supplements, growth forecast, USA, Canada
false
Market Analysis and Trends
Healthcare & Pharmaceuticals
Mixed Chart
PwC/Strategy&
Add to my slides
Remove from favorites
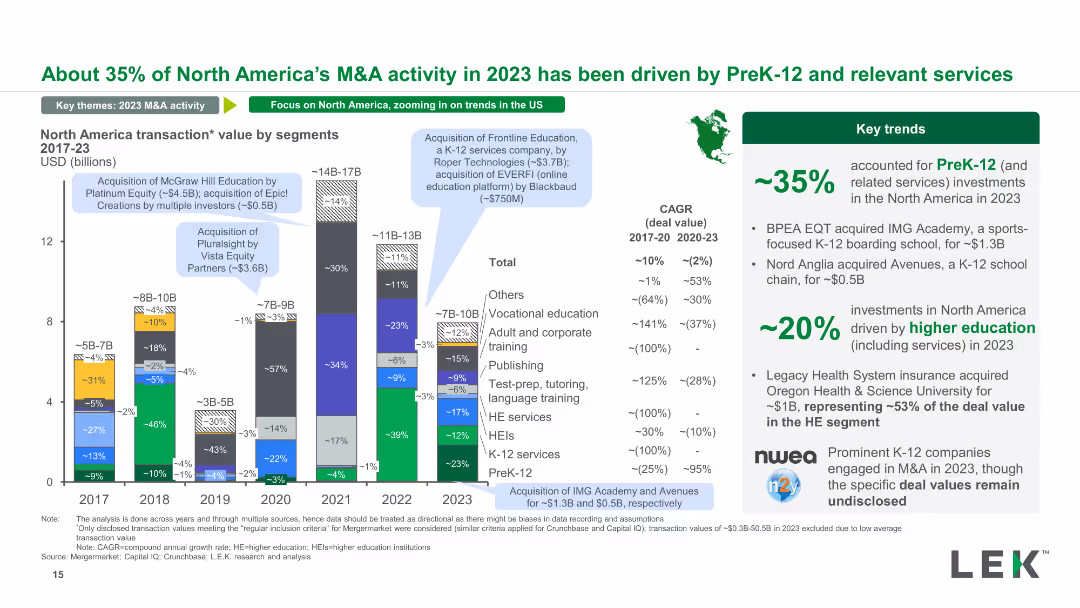
A stacked column chart showing North America's transaction value in education by segments from 2017 to 2023. The chart includes annotations for significant acquisitions and trends in various educational services.
Market Analysis and Trends
Education & Training
This slide provides an overview of North America's transaction values by educational segments, highlighting key transactions and trends within K-12, higher education, and other segments over the years.
North America, transaction value, education segments, major acquisitions, investment trends
false
Market Analysis and Trends
Education & Training
Mixed Chart
LEK
Add to my slides
Remove from favorites
Horizontal bar chart depicting nostalgia levels among different age groups.
Market Analysis and Trends
Government & Public Sector
This slide shows how nostalgia affects various age groups, indicating a high level of nostalgia across all ages.
nostalgia, age groups, sentiment analysis, generational differences, emotional trends
false
Market Analysis and Trends
Government & Public Sector
Mixed Chart
IPSOS
Add to my slides
Remove from favorites
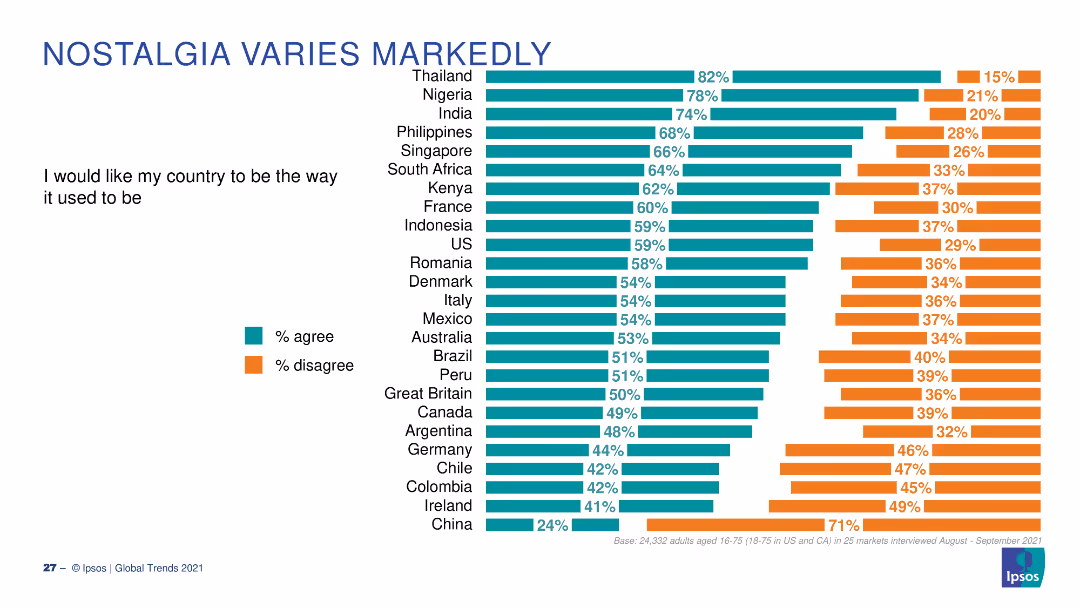
A bar chart showing the percentage of people who agree or disagree with the statement "I would like my country to be the way it used to be" across countries.
Market Analysis and Trends
Healthcare & Pharmaceuticals
The slide compares nostalgia levels across different countries, showing varying percentages of agreement and disagreement.
Nostalgia, Countries, Agreement, Disagreement, Trends
false
Market Analysis and Trends
Healthcare & Pharmaceuticals
Multiple Chart
IPSOS
Add to my slides
Remove from favorites
Column chart showing the percentage of people agreeing or disagreeing with a statement about nostalgia across countries.
Market Analysis and Trends
Government & Public Sector
The slide presents data on nostalgia, showing a high prevalence of nostalgic feelings in Asia and Africa.
nostalgia, regional differences, sentiment analysis, Asia, Africa
false
Market Analysis and Trends
Government & Public Sector
Multiple Chart
IPSOS
Add to my slides
Remove from favorites
This text-heavy slide offers a detailed look at impactful technologies across the software development life cycle. It has a clear structure with headers and bullet points, and uses blue to highlight key terms. Visual complexity is moderate due to the amount of text and information provided.
Operational Efficiency
Technology & Software
The slide details pivotal technologies that enhance developer velocity, targeting a technical audience with interest in improving software development processes. It aims to provide insights into tools that streamline various stages of development, from planning to deployment and maintenance.
Noteworthy, Technologies, Software, Development, Tools, Efficiency, Life Cycle
false
Operational Efficiency
Technology & Software
Linear Flow
McKinsey
Add to my slides
Remove from favorites
Two-column layout with textual content on the left and a table comparing FY20 and FY21 guidance on the right. Shades of gray and blue are used for text and table elements respectively.
Financial Performance
Financial Services
Details fiscal updates, affirms segment profit guidance, and indicates an increase in NPAT guidance. It's a deep dive into financial adjustments, explaining changes in projections with a focus on integration and transition costs.
NPAT, Segment Profit, Guidance, ETR, ROIC
false
Financial Performance
Financial Services
Mixed Chart
Goldman Sachs
Add to my slides
Remove from favorites
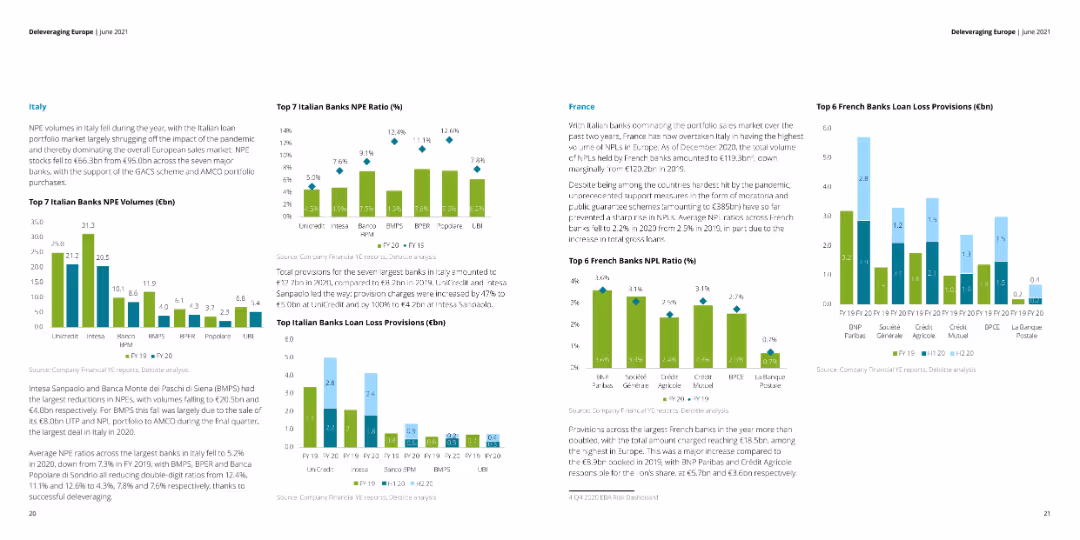
The slide features multiple column charts showing NPE volumes, NPE ratios, and loan loss provisions for top banks in Italy and France. Text sections provide detailed explanations of the charts.
Financial Performance
Financial Services
This slide analyzes the NPE volumes, NPE ratios, and loan loss provisions for the top banks in Italy and France. It discusses the impact of the pandemic and government support schemes on the financial metrics.
NPE volumes, NPE ratios, loan loss, Italy, France
false
Financial Performance
Financial Services
Multiple Chart
Deloitte
Add to my slides
Remove from favorites
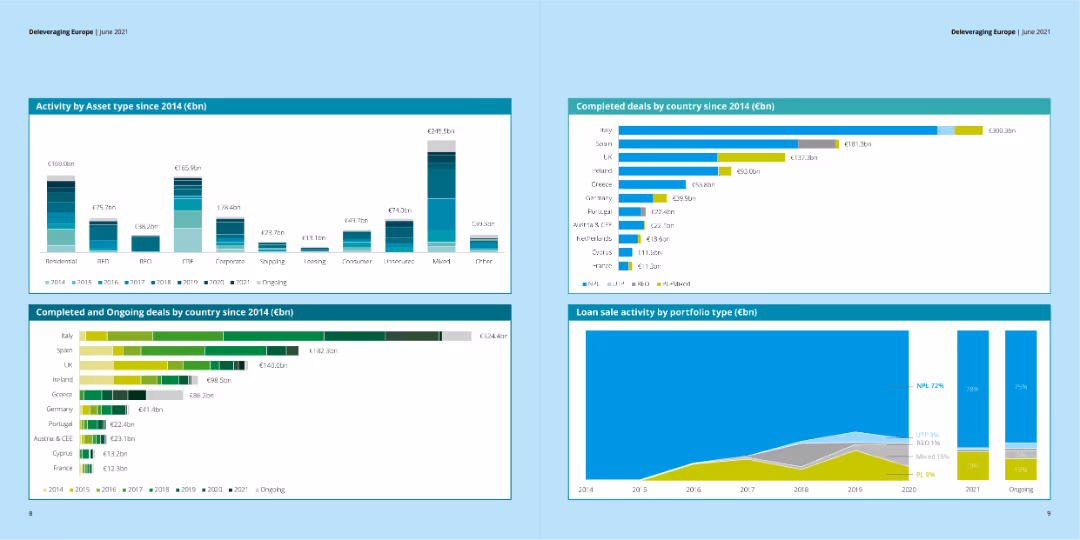
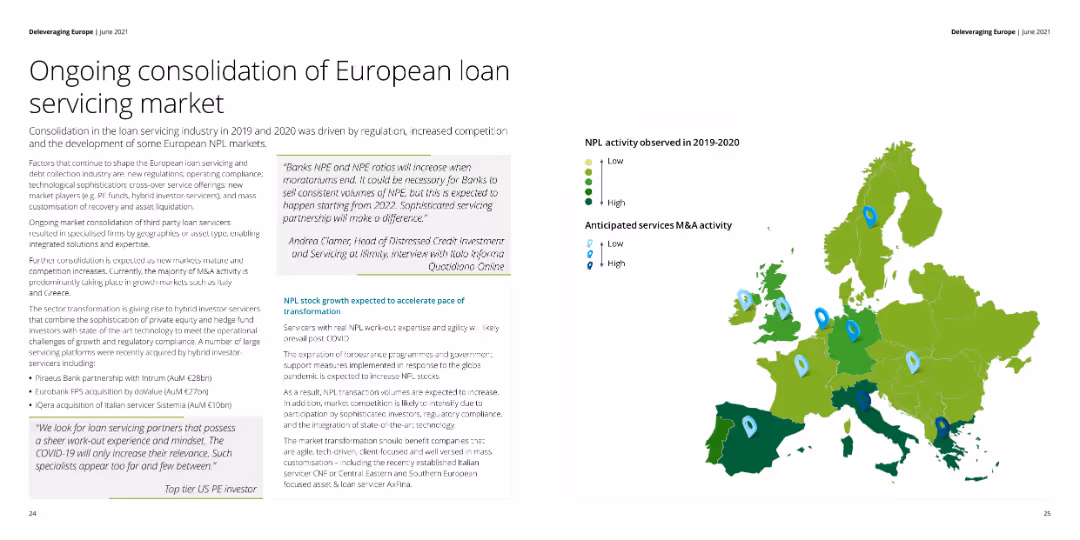
The slide includes a map showing NPL activity across Europe with varying intensities. Text blocks provide insights into market consolidation, regulatory impacts, and quotes from industry experts.
Market Analysis and Trends
Financial Services
This slide discusses the consolidation of the European loan servicing market, driven by regulatory changes and market conditions. It includes a map showing NPL activity levels and anticipates M&A activity.
NPL activity, market consolidation, Europe, M&A
false
Market Analysis and Trends
Financial Services
Graphic
Deloitte
Add to my slides
Remove from favorites
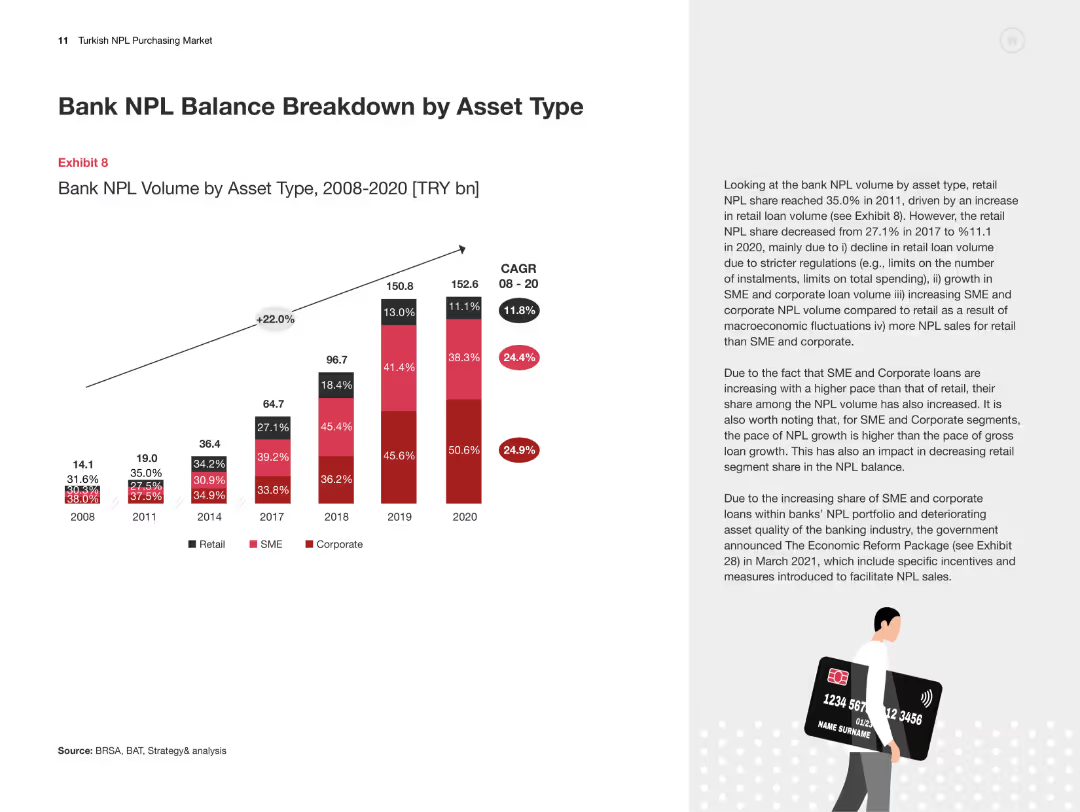
The slide includes a column chart showing the NPL volume by asset type from 2008 to 2020, with detailed text explaining the trends and contributing factors.
Risk Assessment and Management
Financial Services
This slide examines the breakdown of non-performing loan balances by asset type in Turkish banks, highlighting the significant trends and influencing factors over time.
NPL Balance, Asset Type, Turkey, Non-Performing Loans, Risk Factors
false
Risk Assessment and Management
Financial Services
Mixed Chart
PwC/Strategy&
Add to my slides
Remove from favorites
The slide features a bar chart showing coverage ratios of NPLs across CEE countries, along with a text block summarizing the current status and outlook. The left side contains a graph of loan moratoria across CEE.
Risk Assessment and Management
Financial Services
The slide provides a detailed view of NPL coverage ratios across CEE countries, discussing the implications and future outlook, and includes an overview of loan moratoria in the region.
NPL, coverage ratios, loan moratoria, CEE, outlook
false
Risk Assessment and Management
Financial Services
Multiple Chart
Deloitte
Add to my slides
Remove from favorites
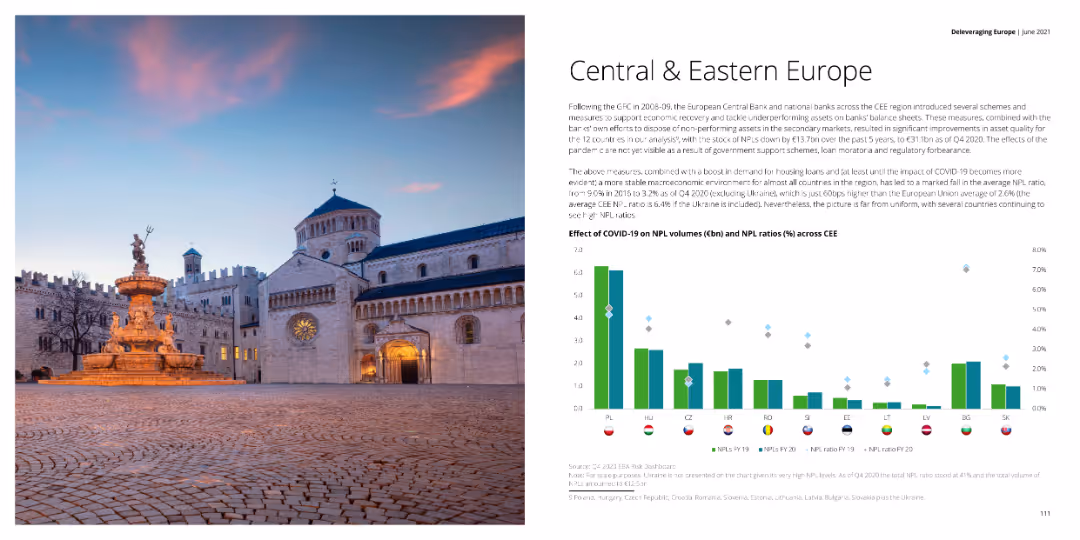
The slide includes a column chart showing the effect of COVID-19 on NPL volumes and ratios across CEE countries, with a text block summarizing the impacts and measures taken by banks. The left side contains an image of a cathedral.
Market Analysis and Trends
Financial Services
The slide analyzes the impact of COVID-19 on NPL volumes and ratios across Central and Eastern Europe, highlighting measures taken by banks and government schemes to support the financial sector.
NPL, COVID-19, financial impact, CEE, measures
false
Market Analysis and Trends
Financial Services
Mixed Chart
Deloitte
Add to my slides
Remove from favorites
This slide features a column chart showing NPL sales volume from 2010 to 2023 with historical and projected values. It uses different colors to represent various growth scenarios.
Market Analysis and Trends
Financial Services
This slide projects the expected growth in NPL sales volumes in Turkey from 2010 to 2023, highlighting historical growth rates and various future scenarios based on economic conditions.
NPL, growth, Turkey, projections, economic scenarios
false
Market Analysis and Trends
Financial Services
Mixed Chart
PwC/Strategy&
Add to my slides
Remove from favorites
Column chart forecasting net NPL inflow volume from 2010-2023, with different macroeconomic scenarios.
Market Analysis and Trends
Financial Services
The slide predicts net NPL inflow volumes in Turkey from 2010-2023, examining various growth scenarios and their impacts.
NPL inflow, growth forecast, economic analysis, financial trends, Turkey
false
Market Analysis and Trends
Financial Services
Mixed Chart
PwC/Strategy&
Add to my slides
Remove from favorites
Column charts on EBA loans under moratoria by country, with detailed textual analysis of trends.
Regulatory and Compliance
Financial Services
Discusses the impact of the pandemic on NPL volumes and loan provisions, focusing on regulatory changes and market responses.
NPL, pandemic, moratoria, regulatory, compliance
false
Regulatory and Compliance
Financial Services
Multiple Chart
Deloitte
Add to my slides
Remove from favorites
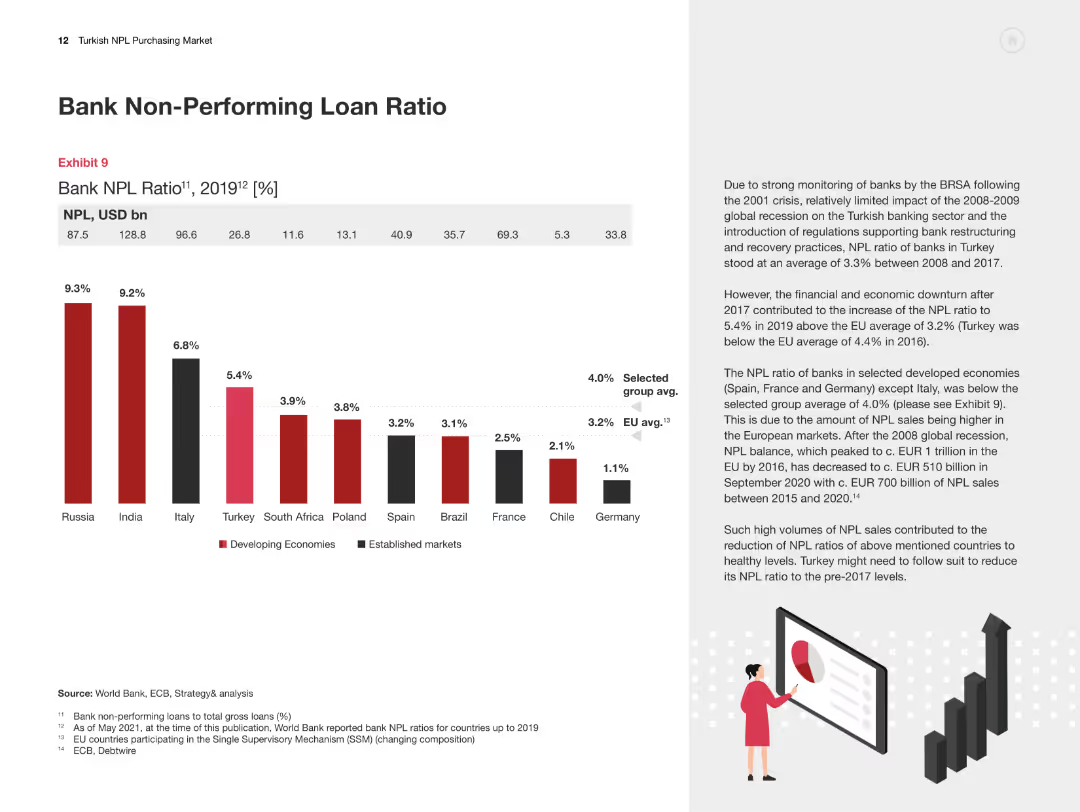
The slide features a column chart comparing the bank NPL ratios across various countries for 2019, with explanatory text on the significance and implications of these ratios.
Risk Assessment and Management
Financial Services
This slide presents a comparative analysis of bank non-performing loan ratios across different countries, emphasizing the significance and implications for the Turkish market.
NPL Ratio, Comparative Analysis, Turkey, International Comparison, Risk Assessment
false
Risk Assessment and Management
Financial Services
Mixed Chart
PwC/Strategy&
Add to my slides
Remove from favorites
This slide displays comparative column charts of NPL ratios and cost of risk, alongside a map visualization to geographically contextualize the data.
Risk Assessment and Management
Financial Services
It assesses the bank's non-performing loan (NPL) ratio and risk costs across regions, demonstrating a cautious risk profile. Ideal for comparing financial stability across markets.
NPL Ratio, Risk Profile, Geographical Analysis, Financial Stability, Cost of Risk, Comparative Data
false
Risk Assessment and Management
Financial Services
Multiple Chart
Morgan Stanley
Add to my slides
Remove from favorites
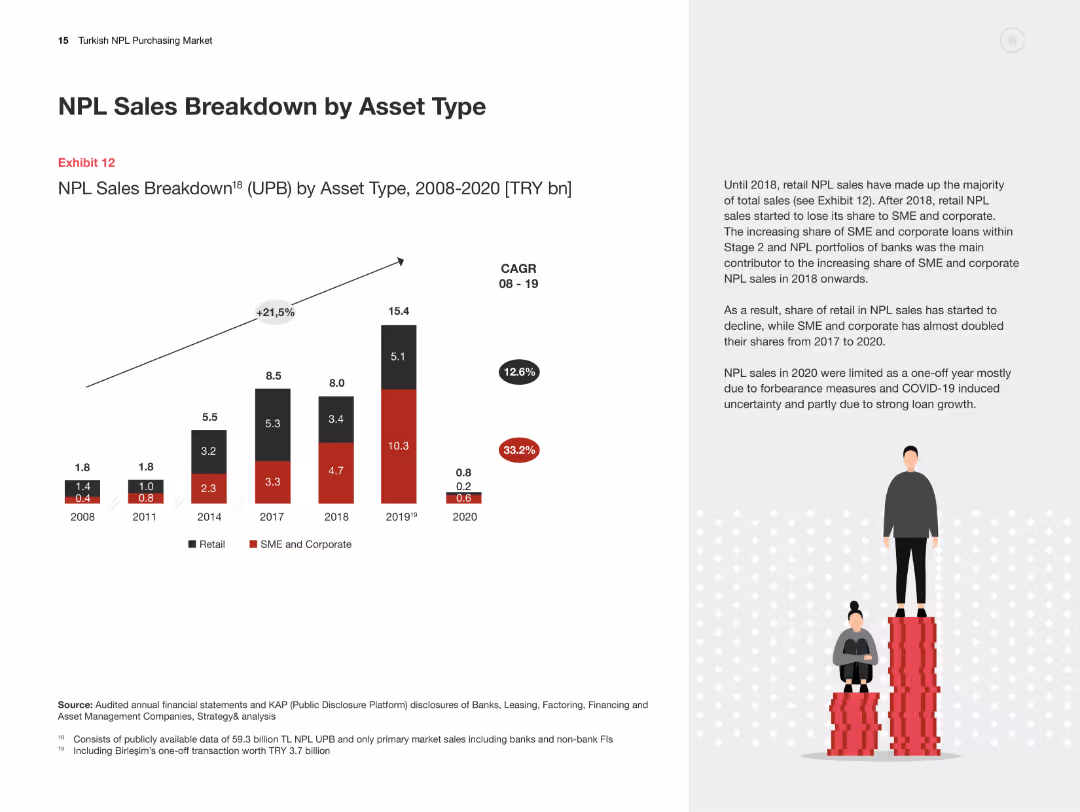
Column chart illustrating NPL sales breakdown by asset type from 2008-2020. Text discusses the shift in asset types.
Market Analysis and Trends
Financial Services
The slide categorizes NPL sales by asset type, showing trends from 2008-2020 and explaining shifts in retail and corporate loans.
NPL sales, asset types, retail loans, corporate loans, financial analysis, Turkey
false
Market Analysis and Trends
Financial Services
Mixed Chart
PwC/Strategy&
Add to my slides
Remove from favorites
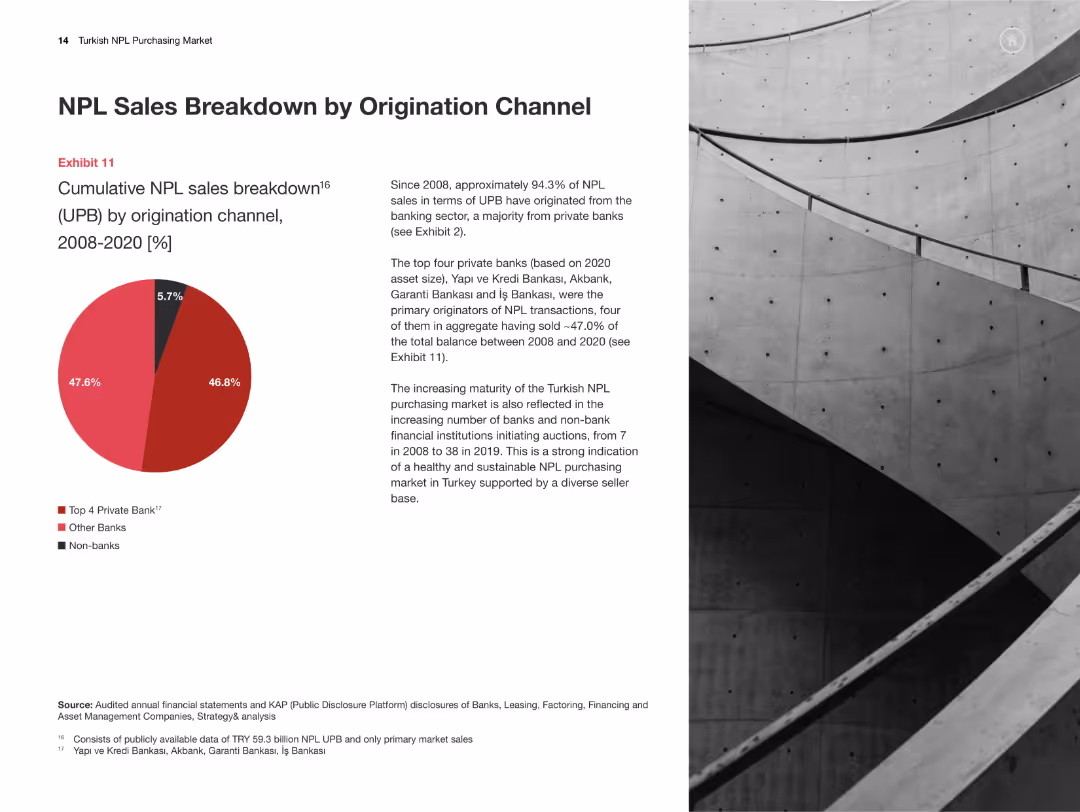
Pie chart showing the breakdown of NPL sales by origination channel (2008-2020). Text details channel contributions.
Market Analysis and Trends
Financial Services
This slide analyzes the breakdown of NPL sales by origination channel, indicating the major contributors and trends over the period.
NPL sales, origination channels, financial breakdown, market trends, Turkey
false
Market Analysis and Trends
Financial Services
Mixed Chart
PwC/Strategy&
Add to my slides
Remove from favorites
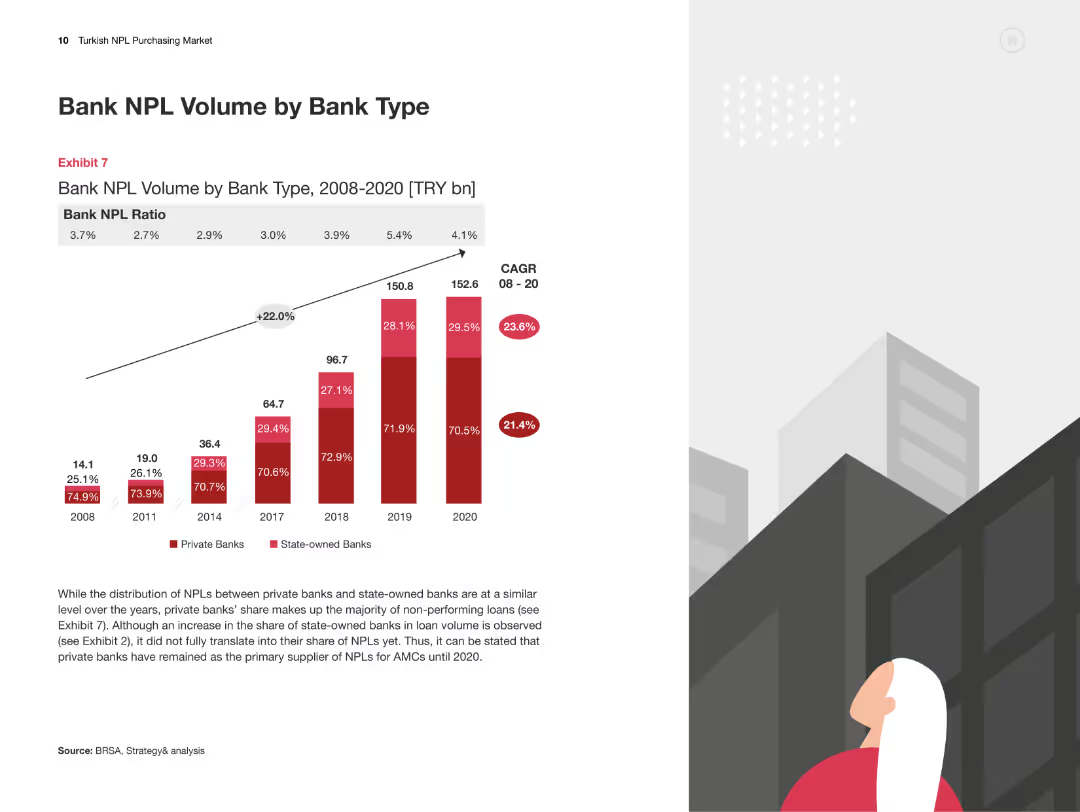
The slide features a column chart detailing the NPL volume by bank type from 2008 to 2020, with explanatory text on the trends and differences between private and state banks.
Risk Assessment and Management
Financial Services
This slide provides an analysis of the non-performing loan volumes in Turkish banks, comparing the trends between private and state-owned banks over a period of time.
NPL Volume, Bank Type, Turkey, Private Banks, State-owned Banks
false
Risk Assessment and Management
Financial Services
Mixed Chart
PwC/Strategy&
Add to my slides
Remove from favorites
The slide displays column charts depicting NPL volumes and NPL ratios for German banks and loans by stage for Portugal. An image of a waterfront cityscape complements the data.
Financial Performance
Financial Services
This slide focuses on the NPL volumes and ratios for German banks and the distribution of loans by stage in Portugal. It highlights the effects of the pandemic on these metrics.
NPL volumes, NPL ratios, Germany, Portugal, loans
false
Financial Performance
Financial Services
Multiple Chart
Deloitte
Add to my slides
Remove from favorites
Split layout; left side has a circular graphic showing NPS score, right side contains text on a blue background explaining reasons for high performance.
Performance Metrics and KPIs
Healthcare & Pharmaceuticals
Highlights a high Net Promoter Score (NPS) of 75 for 2024, classified as "World class". The slide attributes the score to product reliability, customer alignment, data focus, and challenge handling.
NPS, customer satisfaction, 2024, performance, healthcare, product quality, data focus, client alignment
false
Performance Metrics and KPIs
Healthcare & Pharmaceuticals
Mixed Chart
JP Morgan
Add to my slides
Remove from favorites
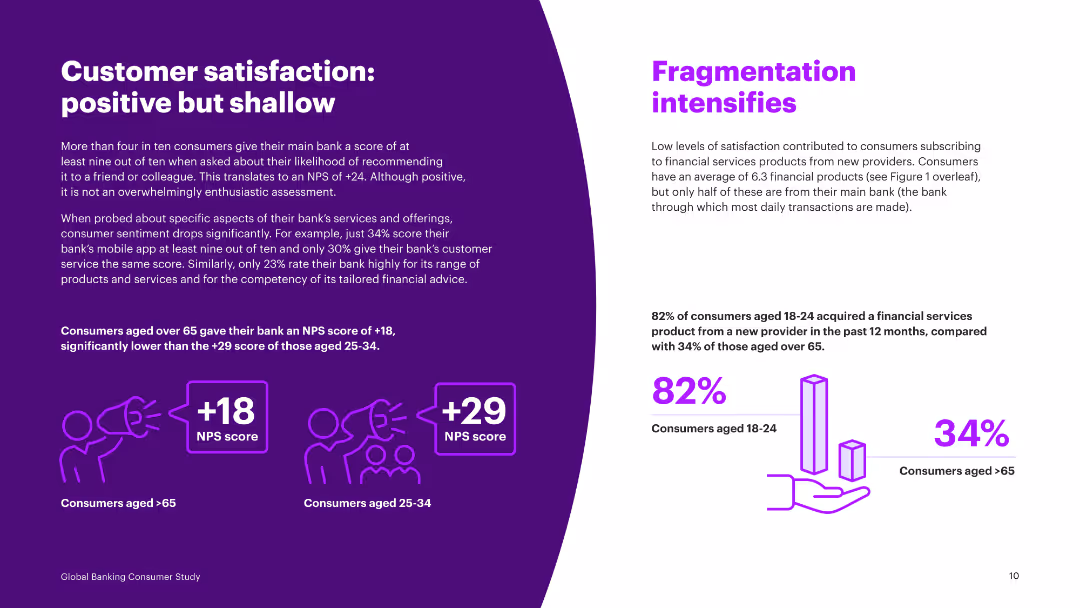
Comparative analysis using NPS scores for different age groups, with textual insights on customer satisfaction levels and service aspects.
Performance Metrics and KPIs
Financial Services
Provides a detailed look at customer satisfaction scores (NPS) by age group and the disparity in satisfaction with different banking services and features.
NPS, customer satisfaction, age groups, banking services, features, comparative, scores, insights, survey
false
Performance Metrics and KPIs
Financial Services
Mixed Chart
Accenture
Add to my slides
Remove from favorites
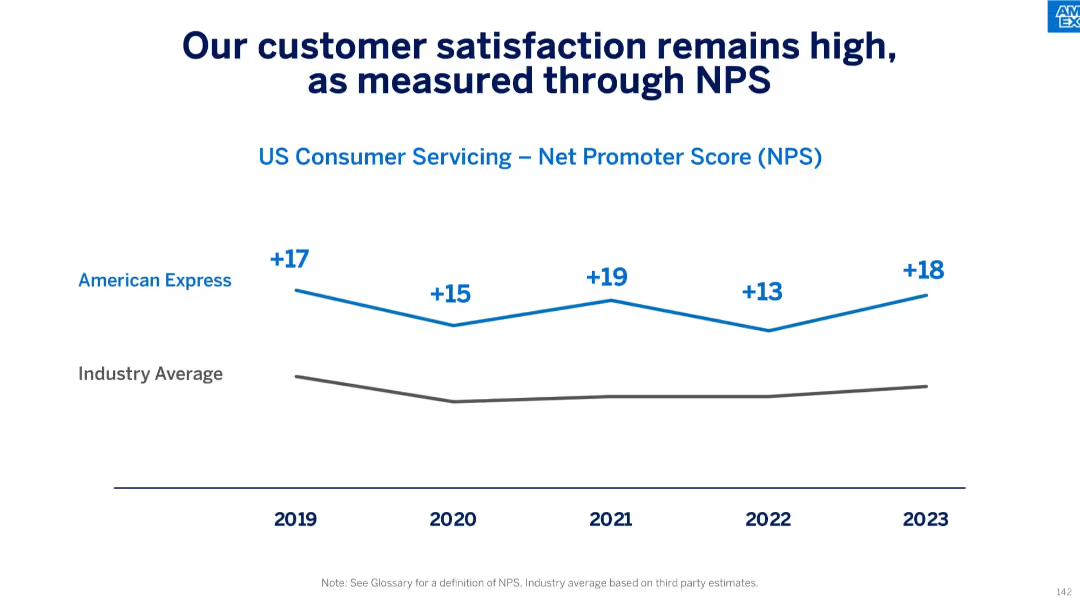
Line graph comparing Net Promoter Score (NPS) of American Express vs industry average from 2019–2023.
Performance Metrics and KPIs
Financial Services
This slide communicates strong customer satisfaction in U.S. consumer servicing, as reflected in American Express’ consistently high NPS, which remained above industry averages from 2019 through 2023, peaking at +19 in 2021 and rebounding to +18 in 2023.
NPS, customer satisfaction, consumer servicing, benchmark, Net Promoter Score, industry average, loyalty, performance
false
Performance Metrics and KPIs
Financial Services
Single Chart
McKinsey
Add to my slides
Remove from favorites
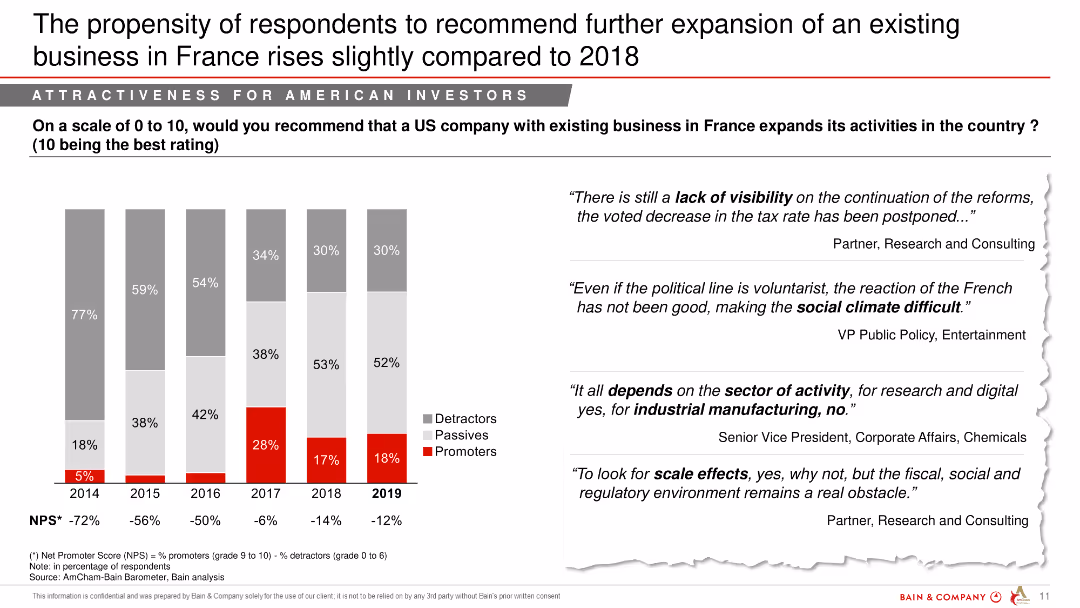
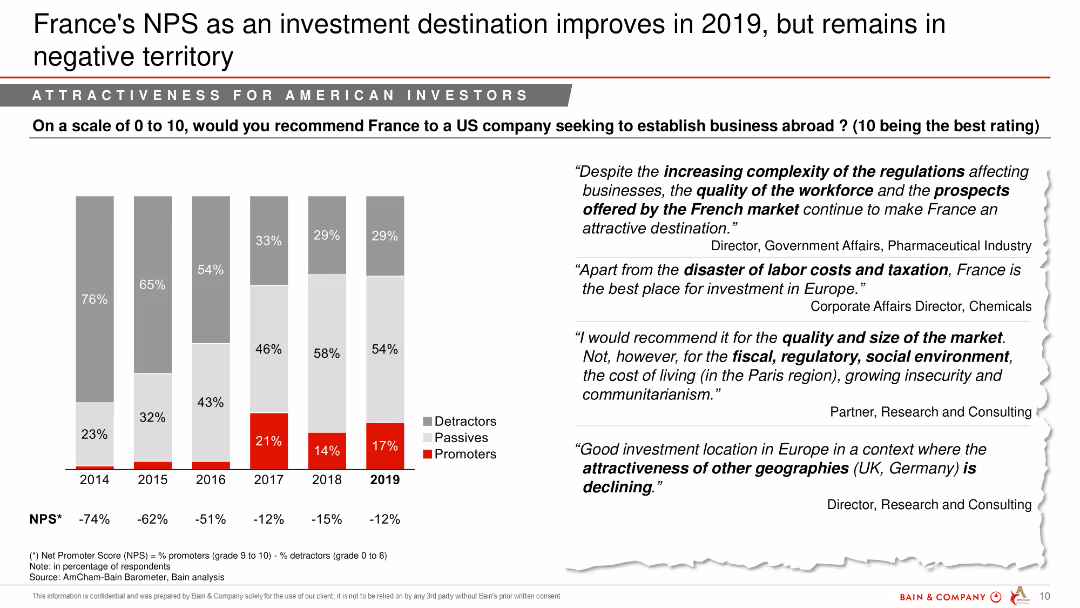
Column chart showing the Net Promoter Score (NPS) from 2014 to 2019, categorized into Detractors, Passives, and Promoters, with comments from respondents.
Market Analysis and Trends
Professional Services
The slide presents the NPS of American investors recommending further business expansion in France, highlighting a slight rise in recommendations from 2018.
NPS, expansion, business, France, investors, trend
false
Market Analysis and Trends
Professional Services
Mixed Chart
Bain
Add to my slides
Remove from favorites
Consists of column charts over five years showing the Net Promoter Score for France as a destination for foreign workers, accompanied by qualitative feedback from various professionals.
Market Analysis and Trends
Professional Services
Evaluates France's appeal as a work destination through yearly Net Promoter Scores, providing insights into the perceptions of foreign employees about working and living in France.
NPS, foreign employees, France, work environment, expatriate
false
Market Analysis and Trends
Professional Services
Mixed Chart
Bain
Add to my slides
Remove from favorites
Displays a column chart of Net Promoter Score (NPS) for France from 2013-2018, highlighting detractors, passives, and promoters, with key business insights.
Corporate Finance and Valuation
Financial Services
Evaluates France's Net Promoter Score (NPS) as an investment destination, detailing the perspectives of various business stakeholders on its market potential.
NPS, France, investment destination, business perspectives, market analysis
false
Corporate Finance and Valuation
Financial Services
Mixed Chart
Bain
Add to my slides
Remove from favorites
This slide features two sections. The left section contains a scatter plot with a trend line showing a positive correlation. The right section contains a column chart showing NPS values.
Market Analysis and Trends
Professional Services
Analyzes the correlation between the number of high value elements a company delivers and its Net Promoter Score (NPS). Intended for strategic business insights and decision making.
NPS, high value elements, correlation, companies, business analysis
false
Market Analysis and Trends
Professional Services
Multiple Chart
Bain
Add to my slides
Remove from favorites
A column chart showing France's Net Promoter Score as an investment destination over several years, with text quotes from experts.
Market Analysis and Trends
Financial Services
This slide evaluates France's Net Promoter Score for investment attractiveness, highlighting opinions and trends over recent years.
NPS, investment destination, France, financial services, market analysis, yearly comparison, opinions
false
Market Analysis and Trends
Financial Services
Mixed Chart
Bain
Add to my slides
Remove from favorites
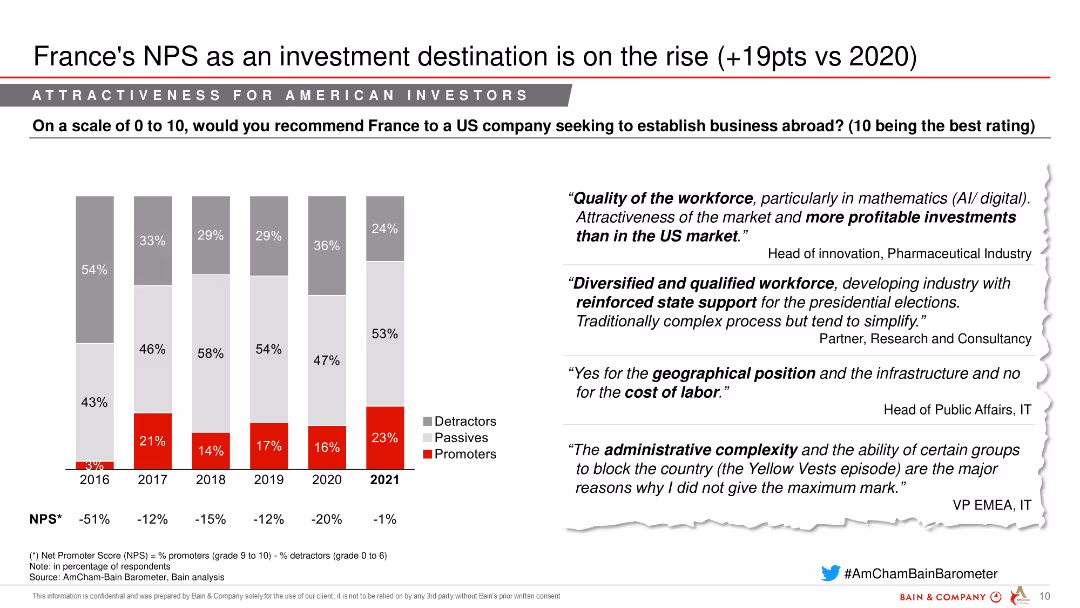
The slide features a column chart displaying the Net Promoter Score (NPS) of France as an investment destination from 2016 to 2021, segmented into detractors, passives, and promoters. Quotes from industry experts are on the right.
Investment Analysis
Healthcare & Pharmaceuticals
This slide indicates an increase in France's attractiveness as an investment destination, with a notable rise in its NPS score in 2021.
NPS, Investment destination, Pharmaceuticals, Market attractiveness, Investment trends
false
Investment Analysis
Healthcare & Pharmaceuticals
Mixed Chart
Bain
Add to my slides
Remove from favorites
Features stacked bar graphs displaying Net Promoter Score by country over three years. The color scheme aids distinction between years, with an explanatory side text.
Customer and Market Segmentation
Retail & E-commerce
Details the decline in consumer satisfaction with online shopping despite increased usage of e-commerce platforms in Southeast Asia.
NPS, satisfaction, e-commerce, SEA
false
Customer and Market Segmentation
Retail & E-commerce
Multiple Chart
Bain
Add to my slides
Remove from favorites
Column chart showing the Net Promoter Score (NPS) for recommending France as a country to settle from 2014 to 2019, with quotes from respondents.
Market Analysis and Trends
Professional Services
The slide presents the decline in NPS for recommending France as a place to settle, despite the positive feedback on quality of life.
NPS, settle, France, quality of life, decline, recommendation
false
Market Analysis and Trends
Professional Services
Mixed Chart
Bain
Add to my slides
Remove from favorites
The slide contains a column chart comparing current NTM P/E ratios for different S&P 500 sectors against their 10-year high, low, and average. Text explanations are included.
Investment Analysis
Financial Services
This slide offers a sector-specific analysis of NTM P/E ratios for the S&P 500, providing valuable information for sector-based investment decisions.
NTM P/E, S&P 500, sectors, valuation, analysis
false
Investment Analysis
Financial Services
Mixed Chart
Morgan Stanley
Add to my slides
Remove from favorites
The slide includes a column chart showing current NTM P/E ratios for various regions and styles compared to their 10-year high, low, and average. Text explanations are provided.
Investment Analysis
Financial Services
This slide compares the current NTM P/E ratios across different regions and styles with their historical values, offering insights for investment analysis.
NTM P/E, valuation, regions, investment, analysis
false
Investment Analysis
Financial Services
Mixed Chart
Morgan Stanley
Add to my slides
Remove from favorites
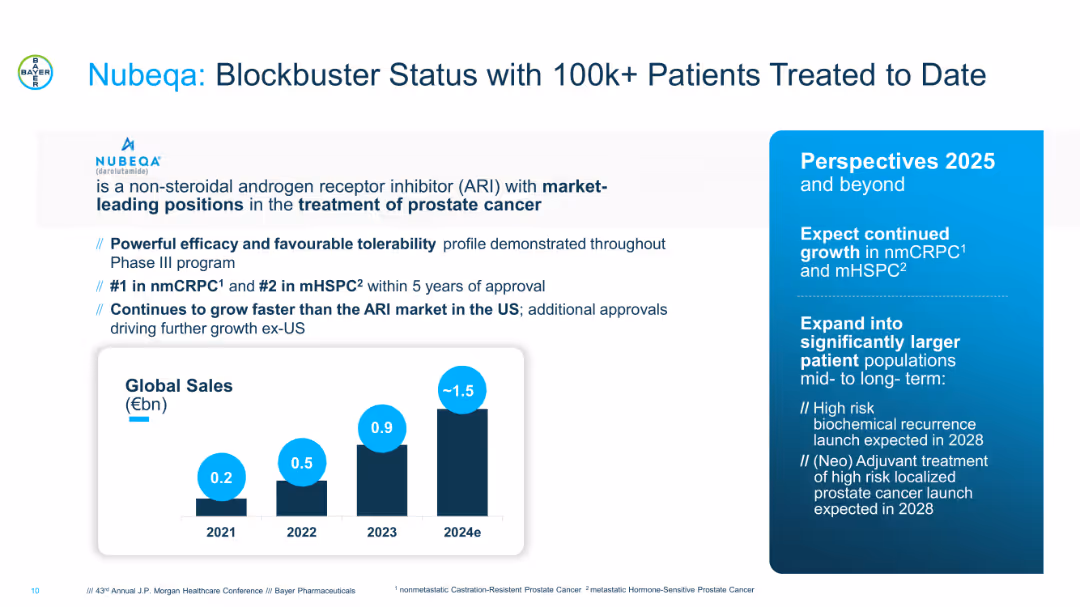
Split layout with product description and future outlook on the right, sales bar graph at bottom. Blue and black colors dominate. Clinical highlights and growth expectations are presented in bullet points.
Product and Service Analysis
Healthcare & Pharmaceuticals
Details the success of Nubeqa (Darolutamide) in prostate cancer treatment, highlighting market leadership, sales trajectory, and growth strategy. Future plans include expansion into larger patient segments with launches expected in 2028 for high-risk prostate cancer treatments.
Nubeqa, prostate cancer, ARI, patient growth, blockbuster drug, oncology, pharma sales
false
Product and Service Analysis
Healthcare & Pharmaceuticals
Mixed Chart
JP Morgan
Add to my slides
Remove from favorites
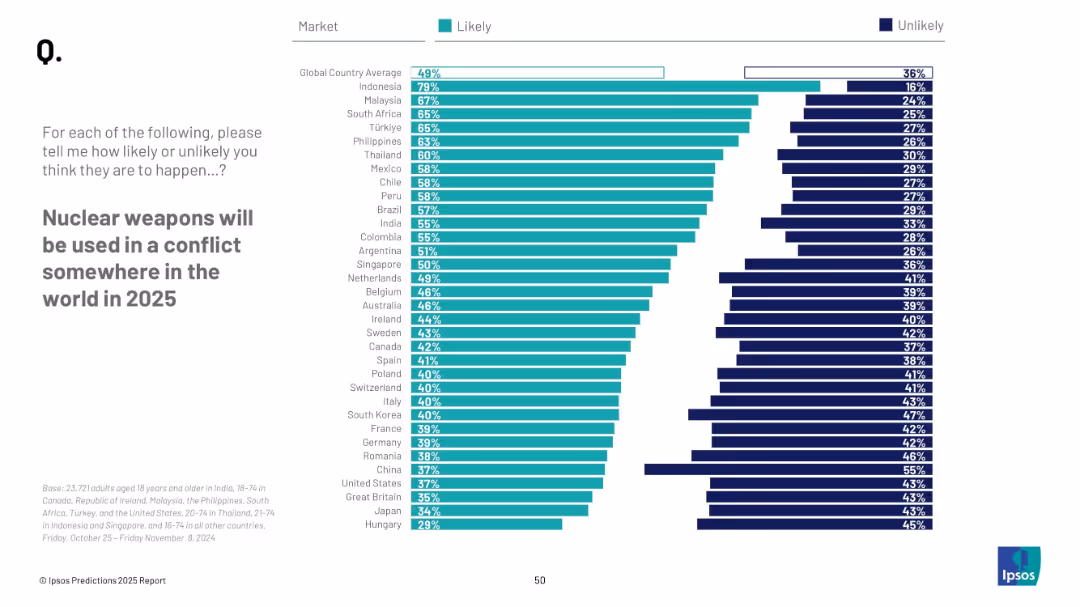
Horizontal bar chart by country; teal = “Likely”, navy = “Unlikely”; global average at top
Risk Assessment and Management
Government & Public Sector
This slide presents public opinion on the likelihood of nuclear weapon use in conflict by 2025. Indonesia and Malaysia show highest concern, with a global average of 49% expecting it likely.
nuclear weapons, conflict, world risk, public opinion, prediction, Ipsos, global security, 2025
false
Risk Assessment and Management
Government & Public Sector
Mixed Chart
IPSOS
Add to my slides
Remove from favorites
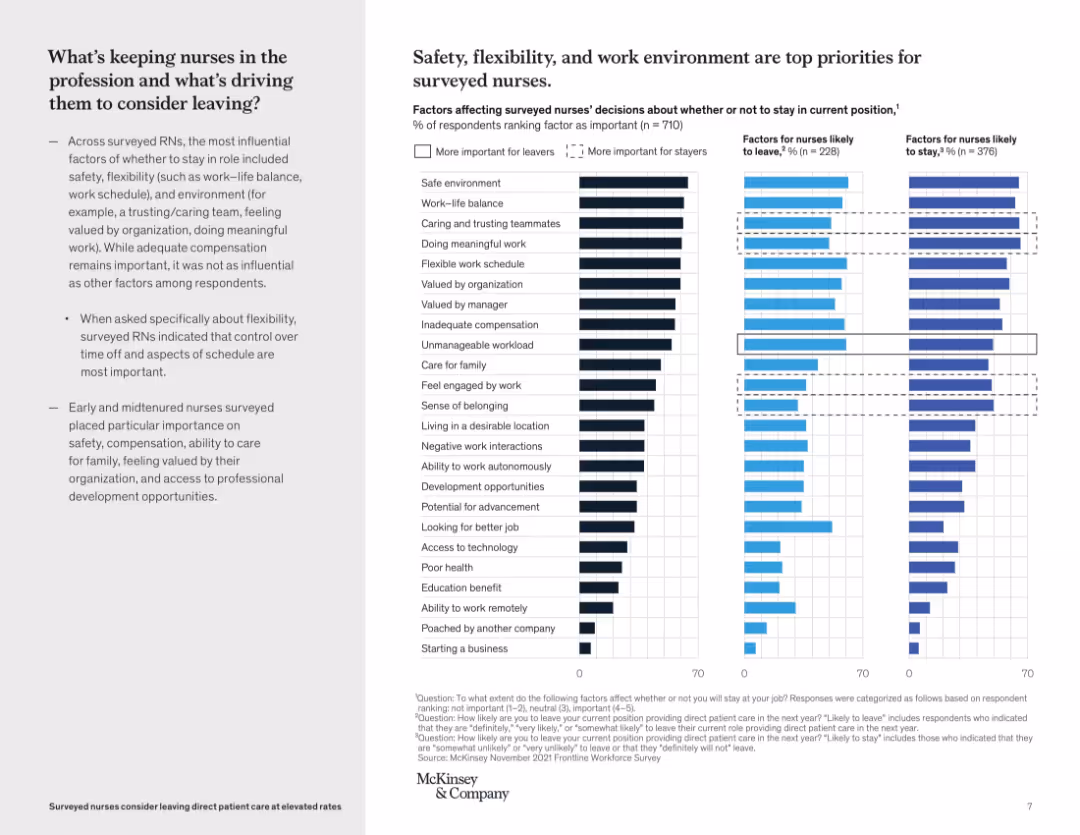
Left-aligned text summary with right-side bar graphs showing factors more important to leavers or stayers; striped comparison bars
Human Resources and Talent Management
Healthcare & Pharmaceuticals
This slide analyzes the drivers of nurse retention and departure. Factors like safe environments, work-life balance, and caring teams matter to both groups. However, inadequate compensation and unmanageable workloads rank higher among those likely to leave, while feeling valued and engaged are more important to those staying.
nurse motivation, workforce retention, job satisfaction, HR factors, compensation, work environment, survey insights
false
Human Resources and Talent Management
Healthcare & Pharmaceuticals
Mixed Chart
McKinsey
Add to my slides
Remove from favorites
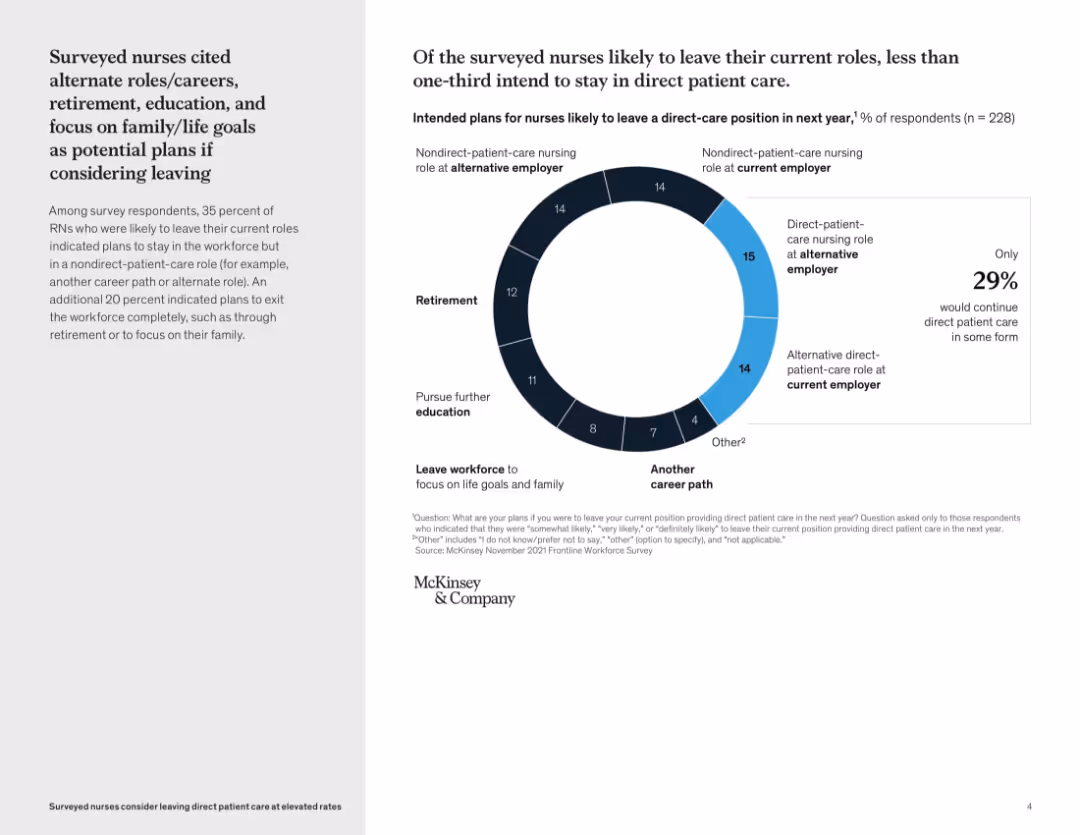
Split layout: left side contains text summary, right side features a donut chart with percentages and categories of career transitions; light background with blue accent
Human Resources and Talent Management
Healthcare & Pharmaceuticals
This slide explores nurses’ potential career moves if they leave direct patient care. It shows that only 29% intend to remain in direct patient care roles, with others planning retirement, education, alternate roles, or leaving the workforce. The visual emphasizes a workforce shift and highlights the need for retention strategies.
nurse retention, career transitions, patient care, workforce trends, survey data, McKinsey, alternate roles, retirement, education, family goals
false
Human Resources and Talent Management
Healthcare & Pharmaceuticals
Mixed Chart
McKinsey
Add to my slides
Remove from favorites
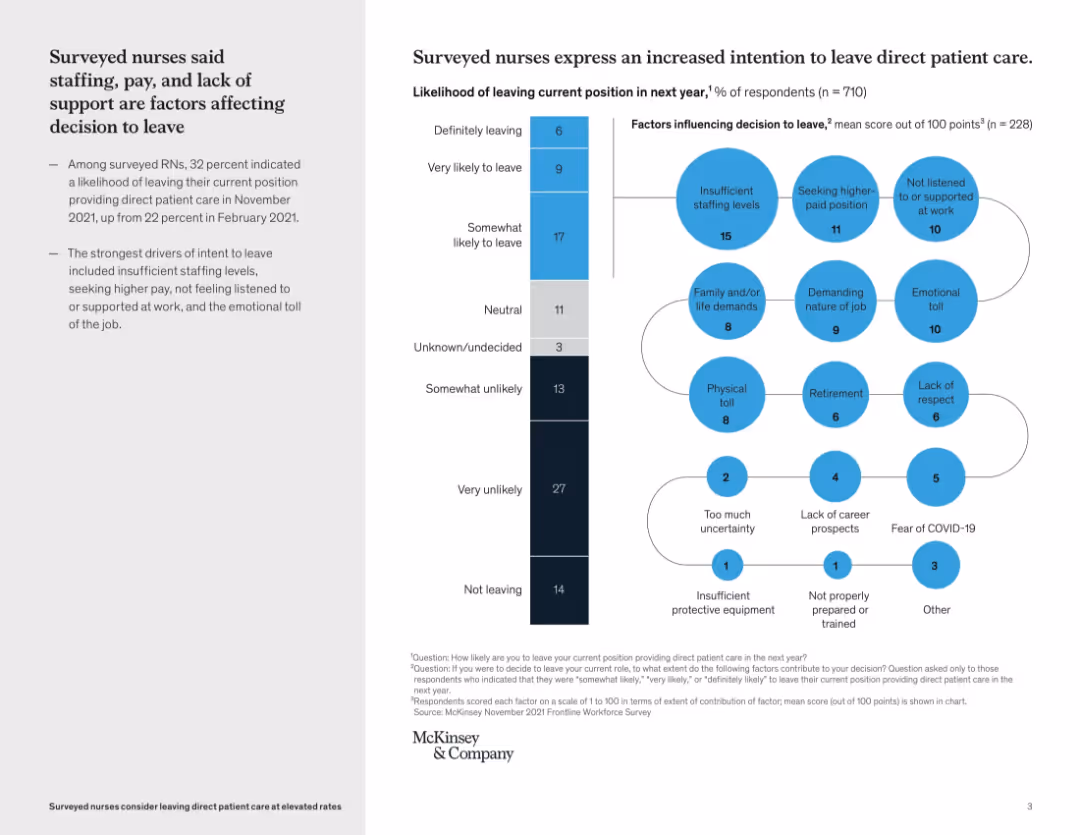
Two-part layout: left side with key findings, right with stacked bar chart and bubble chart of influencing factors
Human Resources and Talent Management
Healthcare & Pharmaceuticals
This slide presents survey data from nurses showing an increased intent to leave direct patient care. The main drivers include insufficient staffing, pay, and lack of support. Charts visualize likelihood to leave and key influencing factors.
nurse retention, staffing, healthcare HR, burnout, survey data, emotional toll, workplace support
false
Human Resources and Talent Management
Healthcare & Pharmaceuticals
Mixed Chart
McKinsey
Add to my slides
Remove from favorites
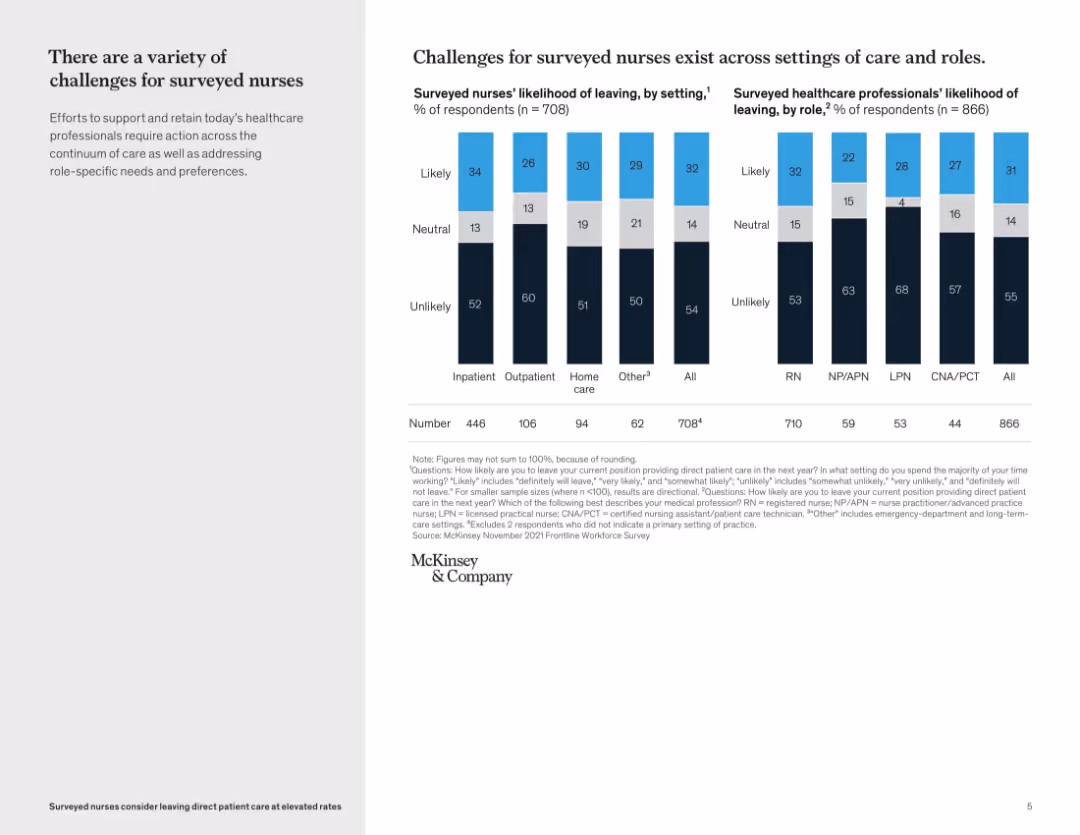
Two bar graphs comparing likelihood of leaving by care setting and by healthcare role; black, blue, and gray color scheme with callout boxes
Risk Assessment and Management
Healthcare & Pharmaceuticals
This slide details how nurse retention challenges vary by care setting and professional role. It shows outpatient nurses and LPNs have the highest likelihood of leaving, whereas CNA/PCTs and those in inpatient care are more likely to stay. The analysis suggests tailored retention strategies may be needed across roles and settings.
nurse roles, retention risk, care setting, survey results, workforce analysis, likelihood to leave, healthcare staffing
false
Risk Assessment and Management
Healthcare & Pharmaceuticals
Mixed Chart
McKinsey
Add to my slides
Remove from favorites
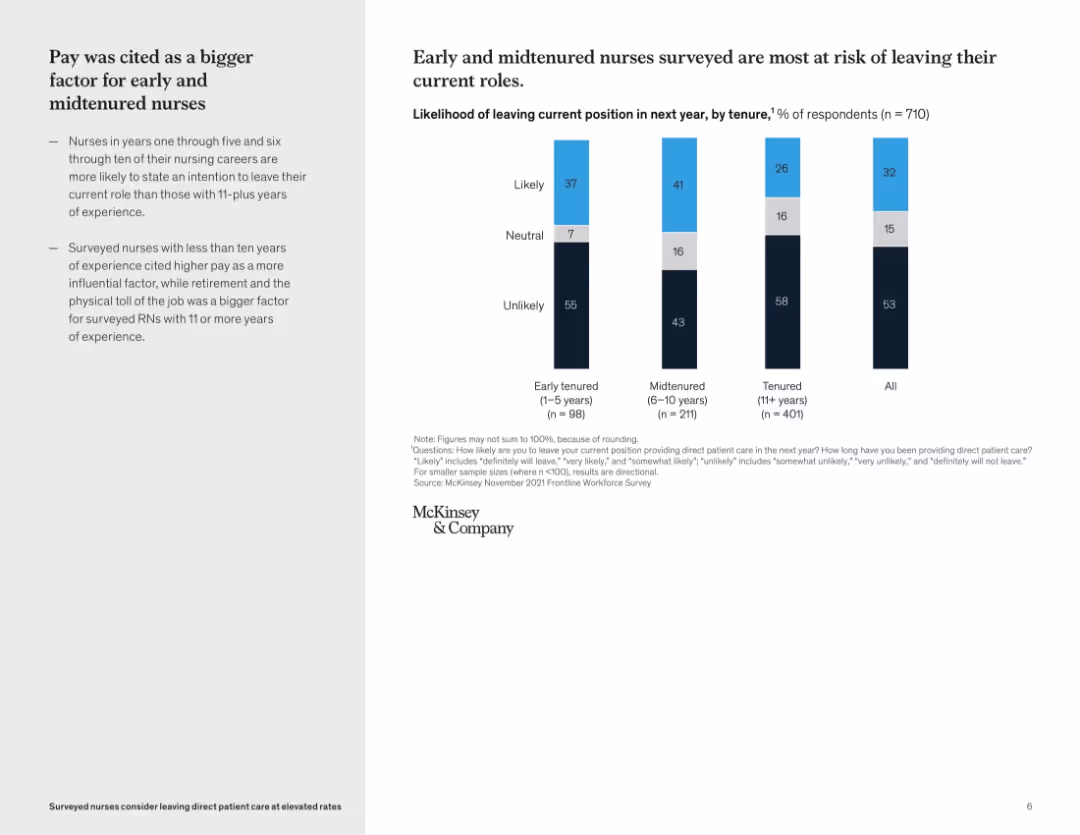
Bar graph with grouped data based on nurse experience levels and likelihood to leave; text summary on left
Human Resources and Talent Management
Healthcare & Pharmaceuticals
This slide outlines how pay influences the likelihood of nurses leaving based on their tenure. Early and midtenured nurses are more likely to consider leaving, with compensation being a more significant driver than for tenured nurses, who are influenced more by retirement or job demands.
nurse tenure, pay impact, workforce retention, nurse experience, employment risk, career stage, healthcare HR
false
Human Resources and Talent Management
Healthcare & Pharmaceuticals
Mixed Chart
McKinsey
Add to my slides
Remove from favorites
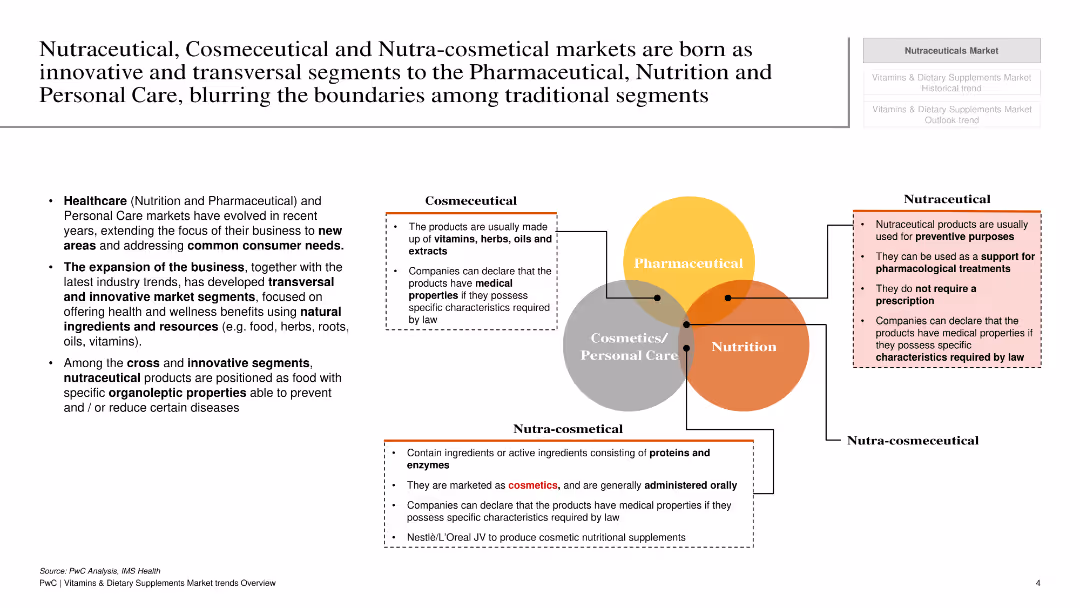
The slide has a white background with various text boxes and a Venn diagram to illustrate the overlap between nutraceutical, cosmeceutical, and nutra-cosmetical markets.
Market Analysis and Trends
Healthcare & Pharmaceuticals
This slide describes the nutraceutical, cosmeceutical, and nutra-cosmetical markets, highlighting their overlap with pharmaceutical, nutrition, and personal care markets.
Nutraceutical, cosmeceutical, markets, healthcare, pharmaceuticals, nutrition, personal care, overlap, segments
false
Market Analysis and Trends
Healthcare & Pharmaceuticals
Diagram
PwC/Strategy&
Add to my slides
Remove from favorites
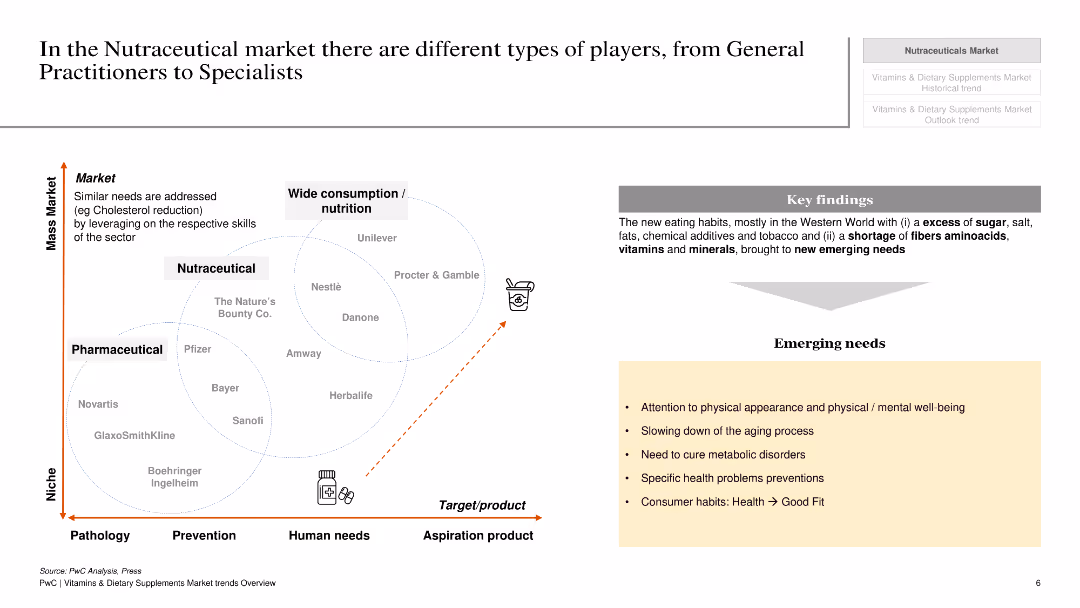
The slide features a white background with a scatter plot showing different players in the nutraceutical market and their respective positions.
Competitive Landscape
Healthcare & Pharmaceuticals
This slide categorizes different types of players in the nutraceutical market, from general practitioners to specialists, and their market strategies and positions.
Nutraceutical, market, players, strategies, positions, healthcare, pharmaceuticals, specialists, general practitioners
false
Competitive Landscape
Healthcare & Pharmaceuticals
Diagram
PwC/Strategy&
Add to my slides
Remove from favorites
Slide presents bar charts showing the usage rates of various nutritional products over the last 12 months in 2020 and 2022. Products include subscription food services, diet tracking apps, and more. Accompanied by future spend intent percentages.
Product and Service Analysis
Healthcare & Pharmaceuticals
Discusses the increased consumption of nutritional products influenced by the COVID-19 pandemic. Shows the correlation between health prioritization and investment in nutritional and fitness products. Useful for market analysis in nutrition-focused health products.
Nutritional products, consumer trends, health prioritization, market analysis, COVID-19 impact
false
Product and Service Analysis
Healthcare & Pharmaceuticals
Mixed Chart
McKinsey
Add to my slides
Remove from favorites
Multiple column charts displaying Unilever Nutrition's sales growth, market share, and operational profitability. Blue charts with clear labels.
Product and Service Analysis
Consumer Goods
Discusses Unilever Nutrition's market position and financial performance, emphasizing its growth in sales and profitability. Describes its leadership in sustainability within the food industry.
Nutrition, Sales Growth, Market Leadership, Profitability, Sustainability
false
Product and Service Analysis
Consumer Goods
Multiple Chart
Deutsche Bank
Add to my slides
Remove from favorites
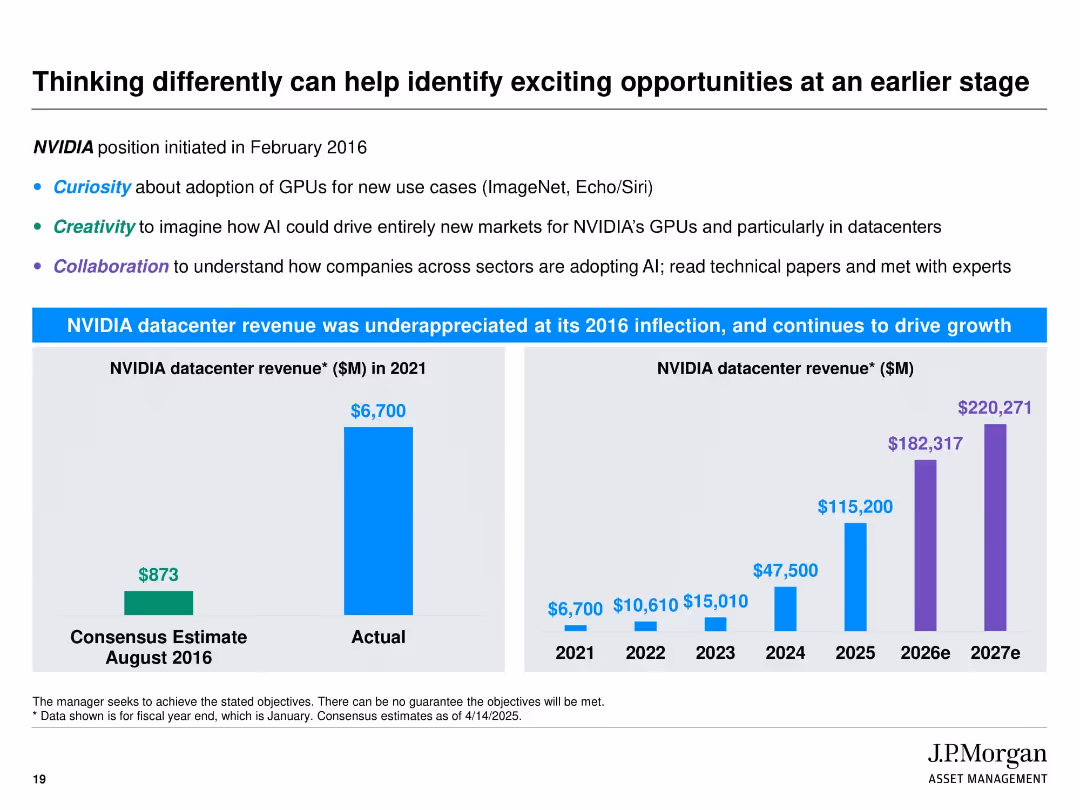
Split into two horizontal sections. Top section has bullet text with keywords in blue, green, and purple. Bottom section features two bar charts comparing consensus vs. actual and projected NVIDIA datacenter revenues. Uses bright blue and purple for visual impact.
Market Analysis and Trends
Technology & Software
This slide highlights the strategic foresight in identifying NVIDIA’s datacenter opportunity since 2016. It emphasizes attributes like curiosity, creativity, and collaboration. A dramatic gap between consensus and actual revenue is shown, followed by projections demonstrating continued strong growth, reinforcing J.P. Morgan’s proactive investment strategy.
NVIDIA, GPUs, AI, datacenter, creativity, revenue forecast, investment foresight, J.P. Morgan, early-stage opportunity
false
Market Analysis and Trends
Technology & Software
Multiple Chart
JP Morgan
Add to my slides
Remove from favorites
This slide provides a timeline of NVIDIA's market capitalization, paired with text descriptions on a white and purple background. Icons are used to depict various sectors like autonomous vehicles, smart city solutions, and intelligent stores.
Market Analysis and Trends
Technology & Software
Highlighting NVIDIA's evolution, the slide outlines the company's growth from a graphics chip company to a comprehensive industry solution provider. It showcases various end-to-end hardware, software, and service solutions that NVIDIA has developed.
NVIDIA, market cap, E2E industry solutions, autonomous vehicles, smart city, intelligent stores, smart hospitals, graphic chips, tech evolution, industry activator
true
Market Analysis and Trends
Technology & Software
Boxed
Accenture
Add to my slides
Remove from favorites
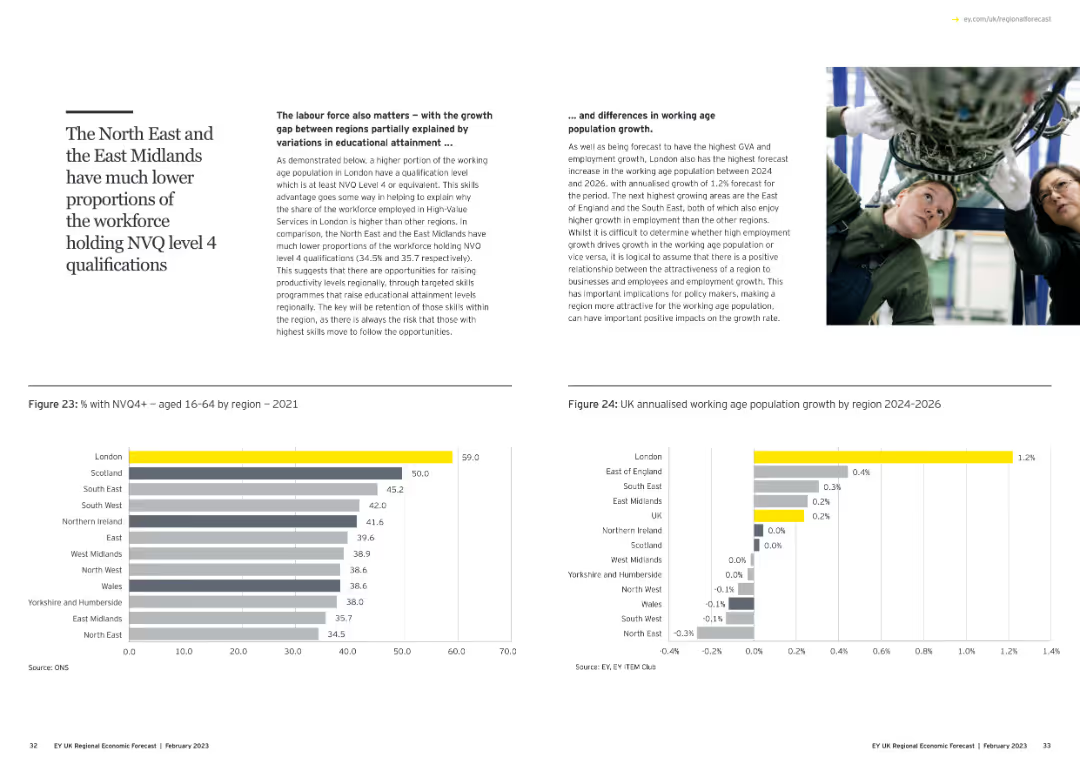
This slide includes a text box on the left with explanations about NVQ level 4 qualifications. Below, there is a column chart showing the percentage of workforce with NVQ4+ by region, and a bar chart forecasting working-age population growth.
Human Resources and Talent Management
Education & Training
The slide discusses regional disparities in educational attainment, specifically NVQ level 4 qualifications, and its impact on workforce proportions and future population growth across various regions.
NVQ level 4, workforce, education, regional disparities, population growth
false
Human Resources and Talent Management
Education & Training
Multiple Chart
EY
Add to my slides
Remove from favorites
This slide utilizes a complex array of column charts detailing the 2019 GDP contributions and unemployment claims across various sectors in NY, segmented by industry and visualized with distinct colors.
Market Analysis and Trends
Financial Services
Offers a comprehensive snapshot of the New York economy, detailing each industry's contribution to the state's GDP and its unemployment figures in early 2020, reflecting the pandemic's impact.
NY economy, 2019 GDP, unemployment claims, industry analysis, pandemic, bar charts
false
Market Analysis and Trends
Financial Services
Single Chart
BCG
Add to my slides
Remove from favorites
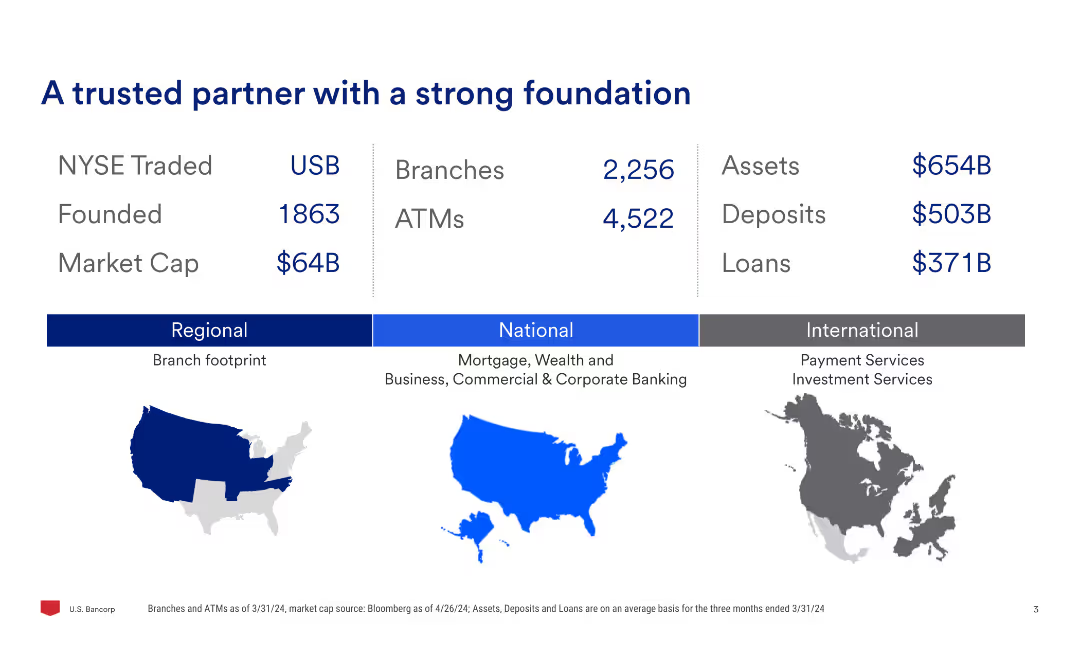
This slide features a minimal design with a three-column layout. The left column contains financial metrics, the center column shows branches and ATMs, and the right column shows assets, deposits, and loans. There are also regional, national, and international maps.
Financial Performance
Financial Services
Provides an overview of the company's key financial metrics, including NYSE trading symbol, founding year, market cap, branches, ATMs, assets, deposits, and loans. It also outlines the company's regional, national, and international presence.
NYSE, trading, branches, assets, deposits, loans, financial metrics, market cap, regional, national
false
Financial Performance
Financial Services
Graphic
Barclays
Add to my slides
Remove from favorites
The slide presents three bar charts, showing the share of NY employees, payroll, and small businesses across six key industries, each represented with its respective color and percentage.
Market Analysis and Trends
Financial Services
This slide provides an overview of six major industries in New York State, showing their share in terms of employees, payroll, and small business ownership, illustrating the sectors' sizes and economic weight.
NY State, industries, employees, payroll, small businesses, economic overview, column chart
false
Market Analysis and Trends
Financial Services
Multiple Chart
BCG
Add to my slides
Remove from favorites
Three-part layout: bar charts (top), bullet text (right), horizontal bar chart (bottom); magenta and blue hues
Market Analysis and Trends
Healthcare & Pharmaceuticals
The slide presents key statistics on obesity, diabetes, and mental health. It notes a sharp rise in overweight populations and diabetes by 2050 and highlights the large numbers living with anxiety and depression. The data underscores the growing burden of lifestyle and psychological health issues.
Obesity, Diabetes, Mental Health, Anxiety, Depression, Global Health
false
Market Analysis and Trends
Healthcare & Pharmaceuticals
Multiple Chart
Roland Berger
Add to my slides
Remove from favorites
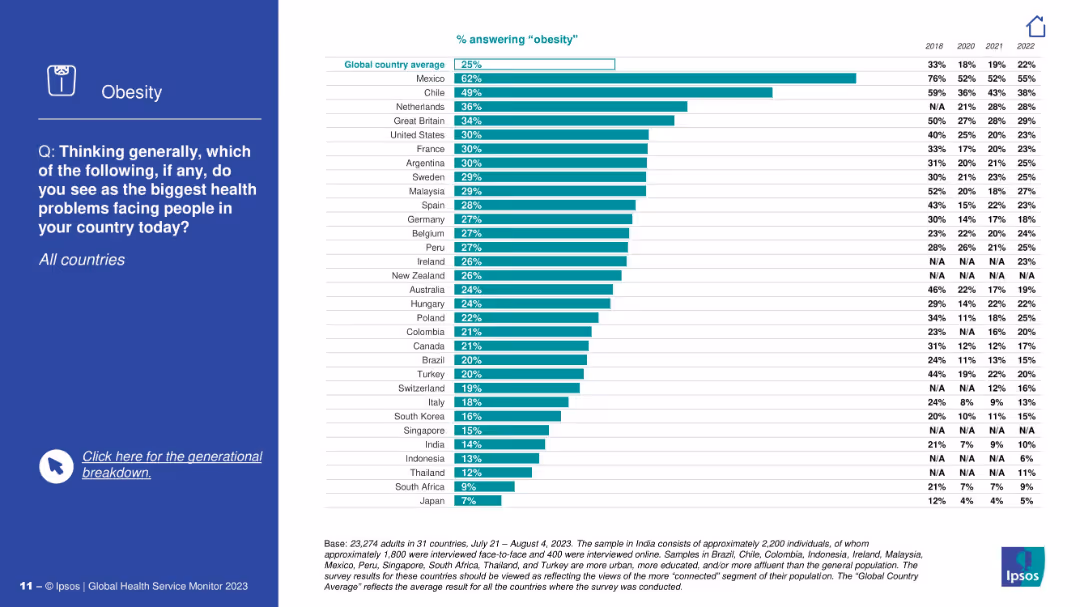
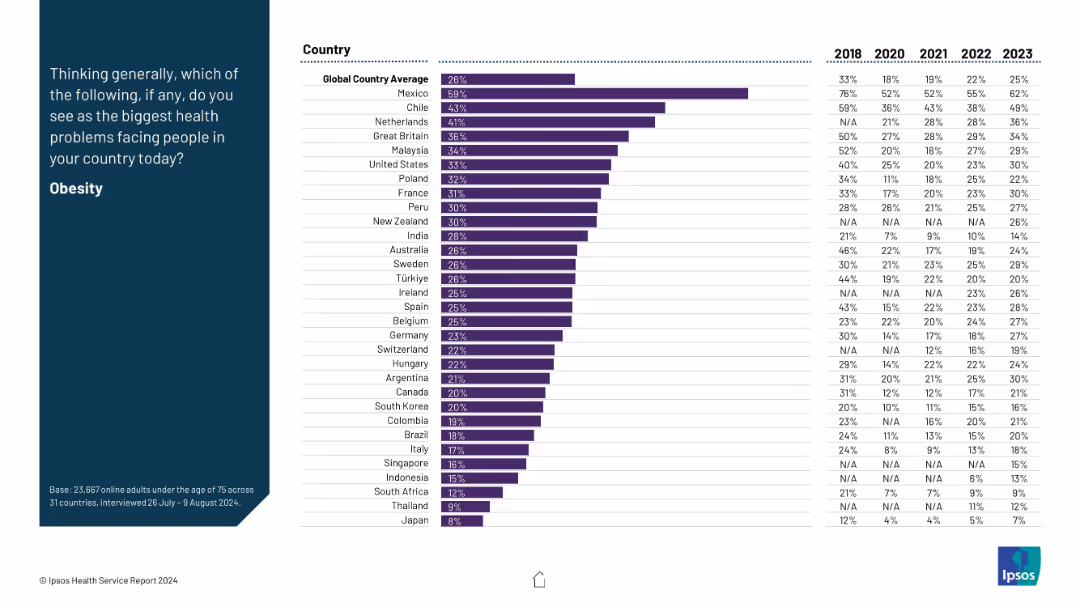
Split layout: Left side has a blue background with a question and icon; right side contains a horizontal bar chart with data by country.
Market Analysis and Trends
Healthcare & Pharmaceuticals
The slide displays a global survey identifying obesity as a major health concern. It shows the percentage of people in various countries who consider obesity a top health issue, with Mexico and Chile ranking highest.
obesity, global health, survey, Ipsos, health concerns, country comparison, bar chart, Mexico, Chile, awareness
false
Market Analysis and Trends
Healthcare & Pharmaceuticals
Mixed Chart
IPSOS
Add to my slides
Remove from favorites
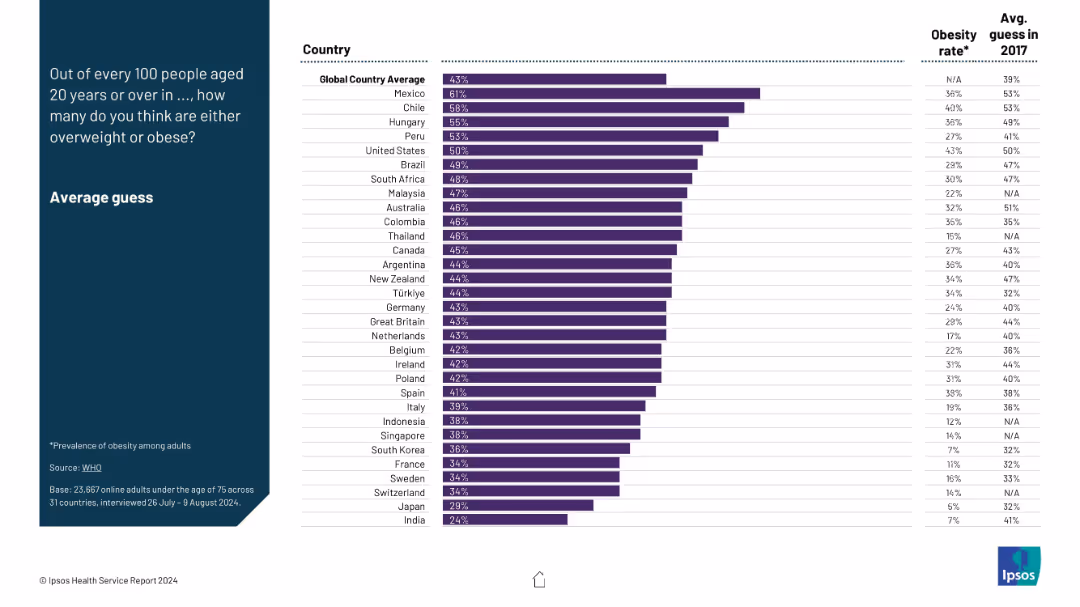
Ranked bar chart per country showing average guess of obesity prevalence; includes obesity rate and 2017 guess for context.
Performance Metrics and KPIs
Healthcare & Pharmaceuticals
The slide compares perceived vs actual obesity rates across nations, highlighting public health awareness and changes since 2017. It identifies discrepancies and improvements in perception accuracy over time.
obesity guess, overweight rate, perception vs reality, health trends, KPI, obesity stats
false
Performance Metrics and KPIs
Healthcare & Pharmaceuticals
Mixed Chart
IPSOS
Add to my slides
Remove from favorites
Same format as others: left-side question and right-side horizontal bar chart with six-year data trend.
Market Analysis and Trends
Healthcare & Pharmaceuticals
Obesity is presented as a major health concern, with Mexico leading by a wide margin. The data show historical shifts (2018–2023) with consistent rises in many countries. The global average sits at 26%, reflecting growing awareness of obesity as a health crisis.
obesity, lifestyle diseases, health trends, global health, survey
false
Market Analysis and Trends
Healthcare & Pharmaceuticals
Mixed Chart
IPSOS
Add to my slides
Remove from favorites
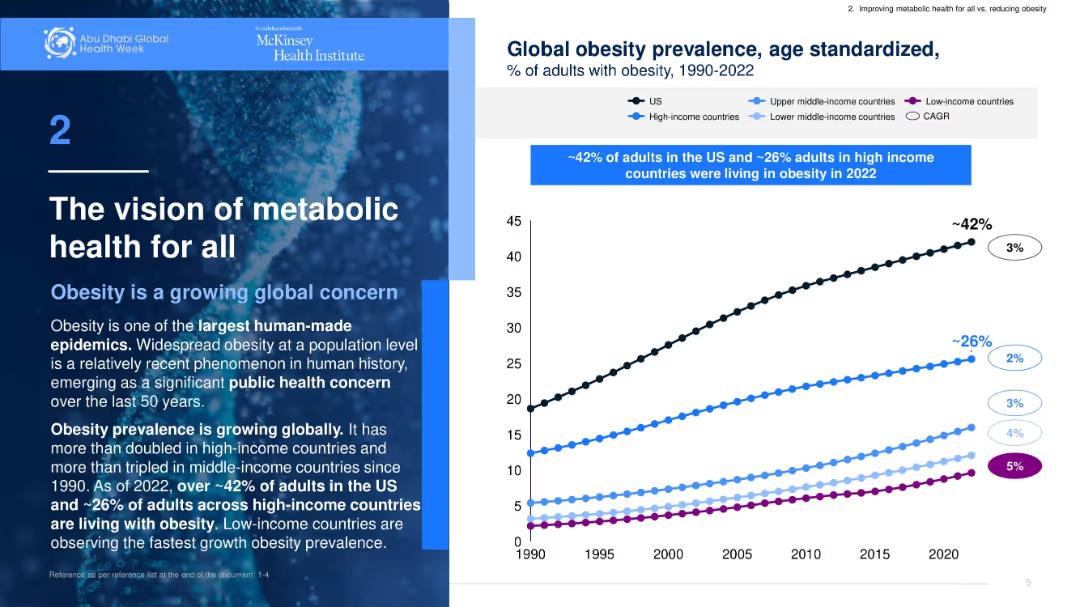
Split layout with text on left and line graph on right. Blue color theme with clear sectioning.
Industry Overview
Healthcare & Pharmaceuticals
Discusses global obesity trends and how obesity has become a significant public health concern. Provides statistical data showing rising prevalence across income groups, especially in the US and high-income countries.
obesity, public health, global trends, metabolic health, statistics
false
Industry Overview
Healthcare & Pharmaceuticals
Mixed Chart
McKinsey
Add to my slides
Remove from favorites
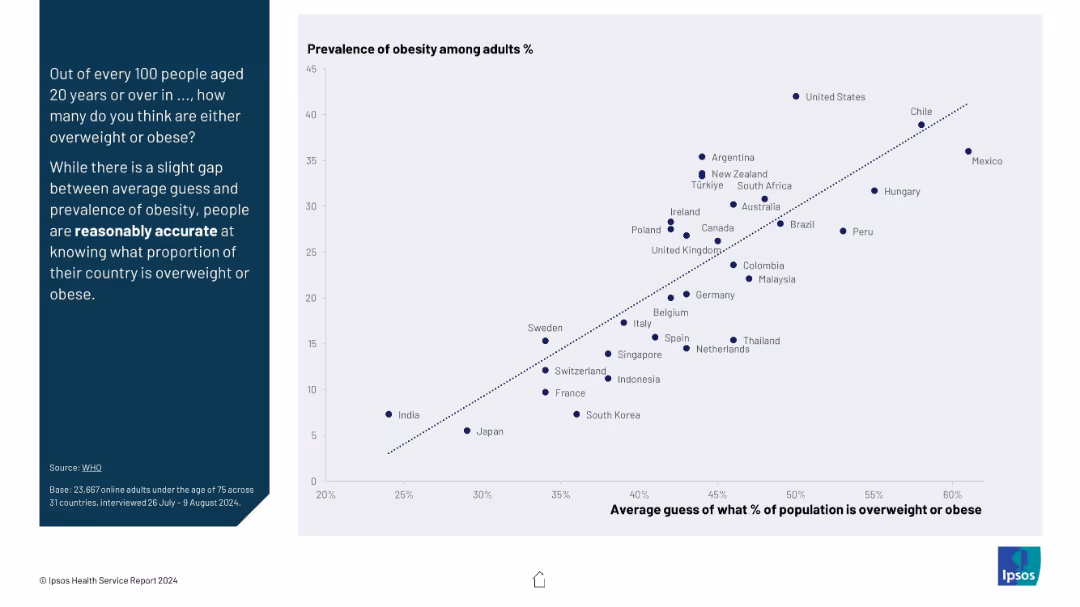
Scatter plot comparing average public guesses vs actual obesity prevalence; includes diagonal trend line for accuracy.
Market Analysis and Trends
Healthcare & Pharmaceuticals
The slide shows a correlation between the actual obesity rates and public estimates across countries. Despite minor gaps, it suggests people are reasonably accurate in estimating national obesity rates, indicating awareness of public health issues.
obesity, public perception, health awareness, statistical comparison, accuracy, health trend, overweight population
false
Market Analysis and Trends
Healthcare & Pharmaceuticals
Mixed Chart
IPSOS
Add to my slides
Remove from favorites
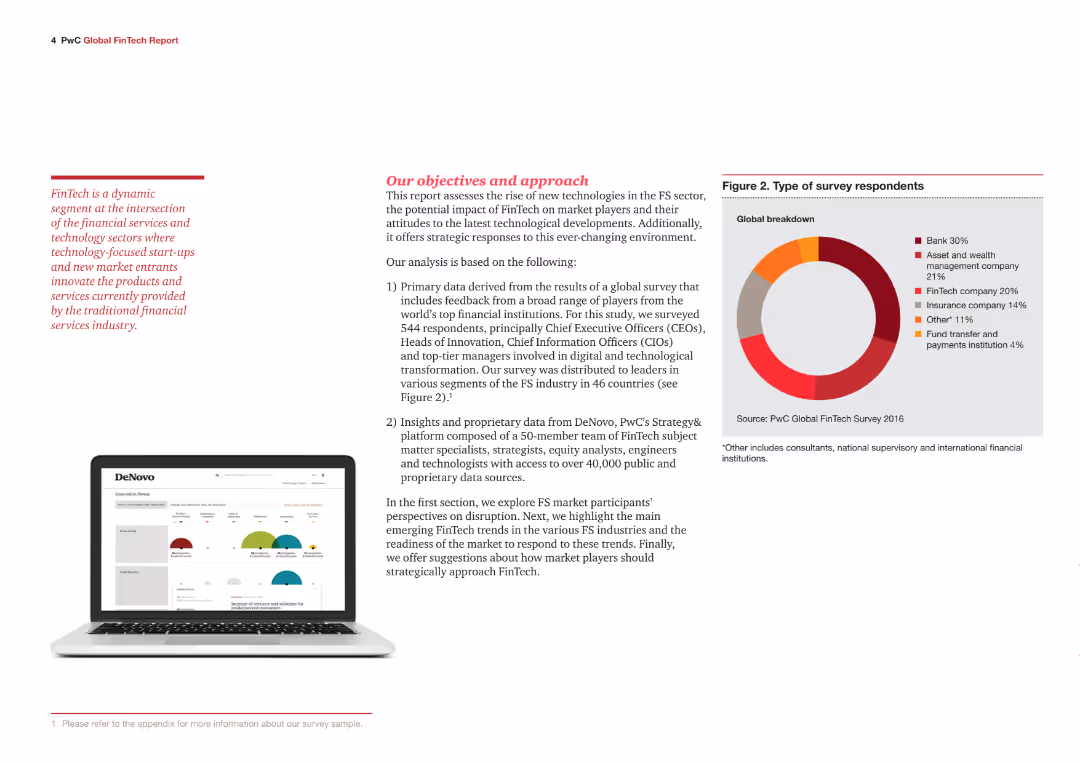
An agenda slide outlining the key points of the report, including survey methodology and objectives. Contains a pie chart showing the breakdown of survey respondents by sector (banks, FinTech companies, insurance companies, etc.).
Strategic Planning
Financial Services
This slide outlines the objectives and approach of the FinTech report, detailing the survey methodology, respondent demographics, and the analytical framework. It sets expectations for the report's content, ensuring readers understand the scope and purpose of the analysis.
Objectives, approach, survey methodology, FinTech report, respondent demographics, agenda
false
Strategic Planning
Financial Services
Mixed Chart
PwC/Strategy&
Add to my slides
Remove from favorites
A column chart showing the top marketing objectives for the next year, ranked by importance. The chart uses circles of varying sizes to represent different objectives like brand awareness, customer retention, and advocacy.
Market Analysis and Trends
Media & Entertainment
This slide identifies the top marketing objectives for the next year, with brand awareness being the most important. It highlights the relative importance of other objectives like customer retention and advocacy in different regions.
Objectives, Marketing, Awareness, Retention, Advocacy
false
Market Analysis and Trends
Media & Entertainment
Mixed Chart
Nielsen
Add to my slides
Remove from favorites
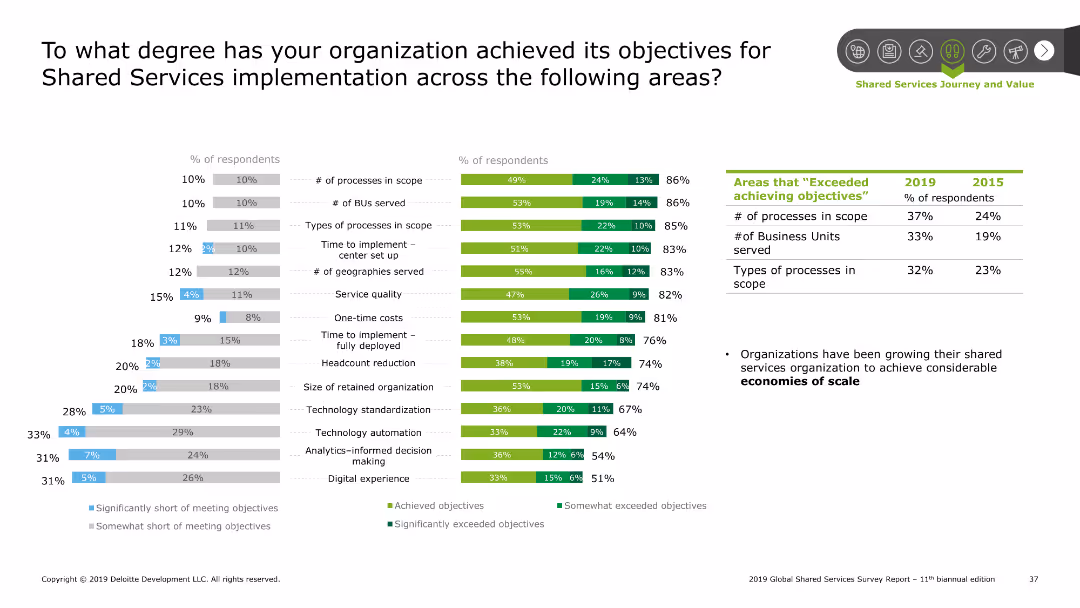
The slide features column charts showing the extent to which organizations have met their objectives in various aspects of shared services implementation.
Performance Metrics and KPIs
Professional Services
This slide measures the achievement of objectives in shared services implementation across different metrics such as processes, BUs served, and cost management.
Objectives, shared services, implementation, performance, metrics
false
Performance Metrics and KPIs
Professional Services
Multiple Chart
Deloitte
Add to my slides
Remove from favorites
The left side features a text box setting a target for combined lost time injury frequency (LTIF), with a contrasting red backdrop. Adjacent to this is a grey-scale line graph with trends over the years and a target level indicated by a dashed line. On the right, a large image shows a smiling worker wearing a safety helmet. This personal touch adds a human element to the data-driven slide. The bottom contains a logo and footer text indicating the source and event.
Operational Efficiency
Government & Public Sector
Focuses on the importance of occupational safety, setting a specific LTIF target and using a graph to track performance, suitable for discussions on safety protocols and performance metrics.
occupational safety, supply chain, LTIF, performance tracking, industrial safety, worker well-being, safety protocols, safety metrics
false
Operational Efficiency
Government & Public Sector
Mixed Chart
Goldman Sachs
Add to my slides
Remove from favorites
Column chart with shades of gray showing the percentage of occupations that could be fully automated or partially automated, listing specific job roles as examples at various automation levels.
Operational Efficiency
Industrial & Manufacturing
Shows the automation potential across different occupations, illustrating how many roles could see a significant portion of their tasks automated and identifying specific occupations like travel agents and web developers.
Occupations, Automation, Job Roles, Potential, Tasks
false
Operational Efficiency
Industrial & Manufacturing
Single Chart
McKinsey
Add to my slides
Remove from favorites
The slide includes a column chart showing the number of CCUS projects by region and status (operational, in development, completed, cancelled).
Market Analysis and Trends
Energy & Utilities
Analyzes the status of global CCUS projects by region, focusing on OECD countries and noting a high number of project cancellations and terminations.
OECD, CCUS, project status, regional analysis, cancellations, development, operational, terminated, trends
false
Market Analysis and Trends
Energy & Utilities
Mixed Chart
Kearney
Add to my slides
Remove from favorites
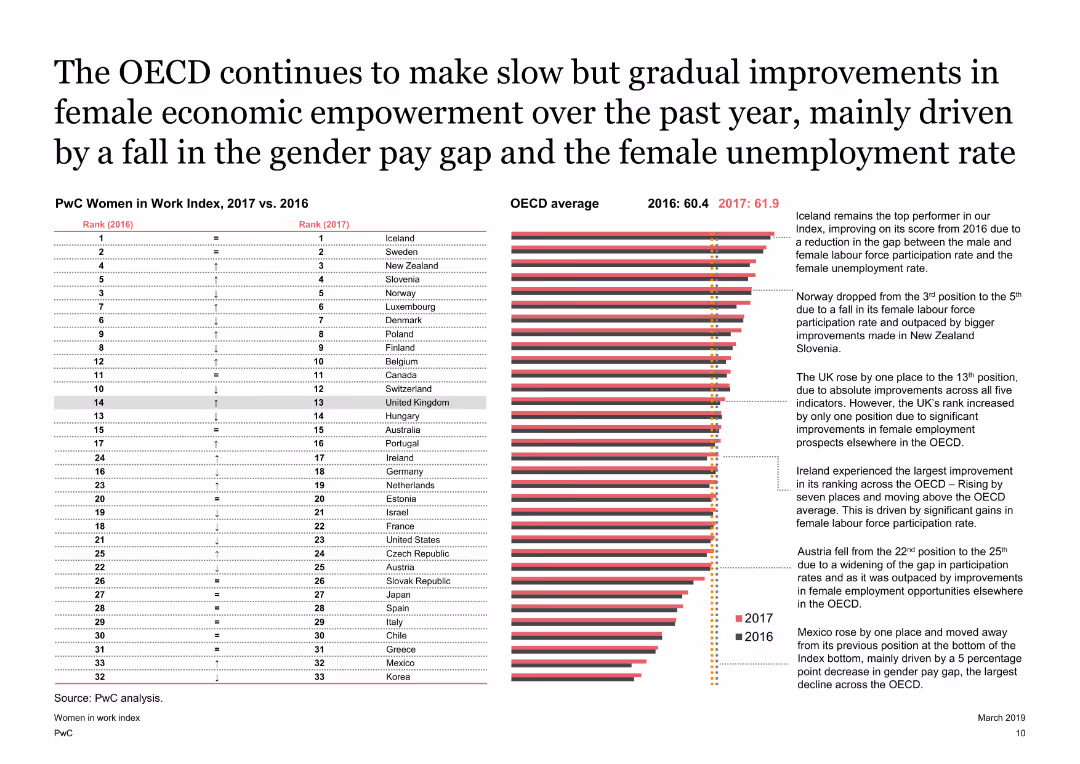
The slide includes a text summary and a column chart comparing the Women in Work Index rankings for 2016 and 2017 across OECD countries. It highlights countries with significant changes in ranking.
Market Analysis and Trends
Financial Services
It discusses the gradual improvements in female economic empowerment across OECD countries, focusing on changes in the Women in Work Index and factors driving these improvements.
OECD, Improvements, Gender, Index, Empowerment
false
Market Analysis and Trends
Financial Services
Mixed Chart
PwC/Strategy&
Add to my slides
Remove from favorites
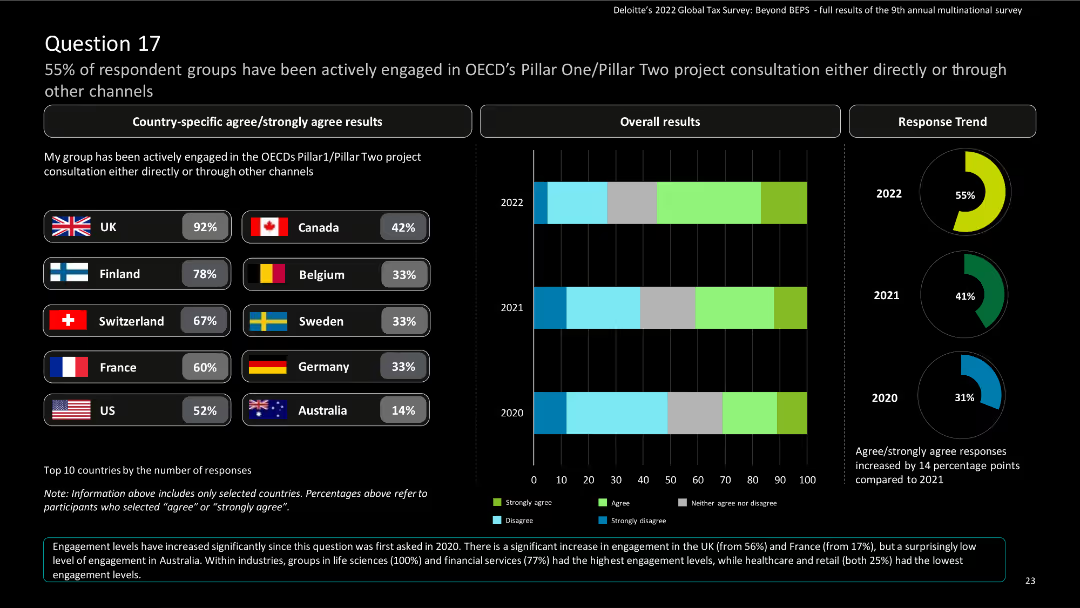
The slide contains bar charts for country-specific results and a column chart for overall results, with a donut chart for response trends.
Risk Assessment and Management
Financial Services
The slide displays survey findings on engagement in OECD’s Pillar One/Pillar Two project consultations. It includes country-specific and overall responses, highlighting trends from 2020 to 2022.
OECD, Pillar One, Pillar Two, engagement, survey
false
Risk Assessment and Management
Financial Services
Multiple Chart
Deloitte
Add to my slides
Remove from favorites
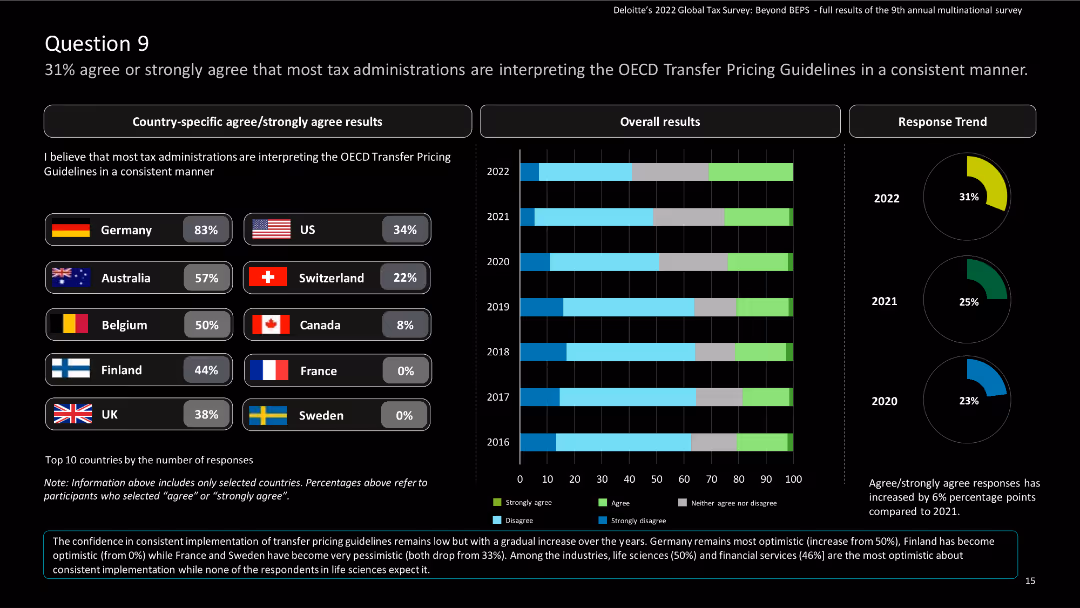
The slide features country-specific results and a column chart showing overall and response trend results over the years.
Regulatory and Compliance
Financial Services
The slide discusses the interpretation consistency of the OECD Transfer Pricing Guidelines among tax administrations.
OECD Transfer Pricing, tax administration, consistency, global tax, Deloitte, agree, strongly agree, survey, multinational
false
Regulatory and Compliance
Financial Services
Multiple Chart
Deloitte
Add to my slides
Remove from favorites
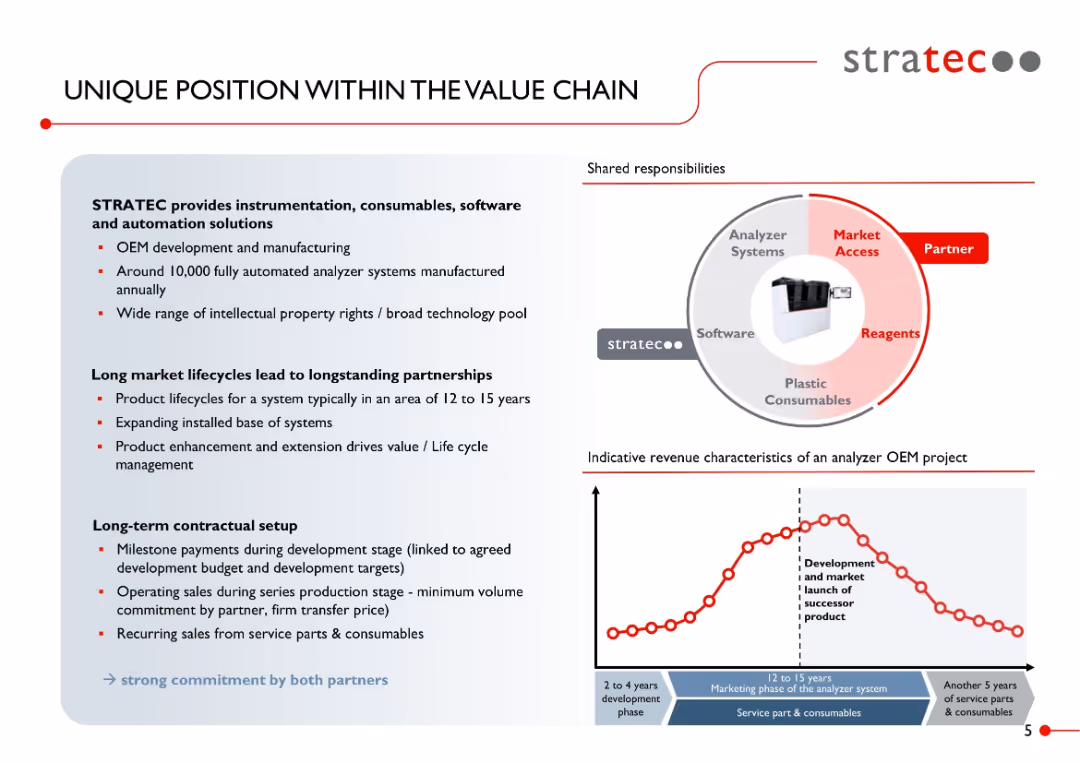
Left-aligned text box with bullet points; right-side diagram with circular flow and lifecycle chart; light blue tone
Product and Service Analysis
Healthcare & Pharmaceuticals
STRATEC positions itself as a key OEM provider of analyzer systems with long product lifecycles and recurring revenue from consumables and services. Slide shows revenue profile across product phases and emphasizes joint value creation.
OEM, analyzer systems, STRATEC, lifecycle, recurring revenue, automation, consumables, healthcare technology
false
Product and Service Analysis
Healthcare & Pharmaceuticals
Mixed Chart
Goldman Sachs
Add to my slides
Remove from favorites
Descriptive graphs showing six OEM archetypes with details on BEV starting points, market shares, and primary markets. Each archetype is color-coded and has comparative bars.
Competitive Landscape
Transportation & Logistics
Details various OEM archetypes and their initial market positions in the electric vehicle sector, focusing on differences in strategy and market share from 2022 to 2030.
OEM, archetypes, BEV, market position, strategy
false
Competitive Landscape
Transportation & Logistics
Multiple Chart
BCG
Add to my slides
Remove from favorites
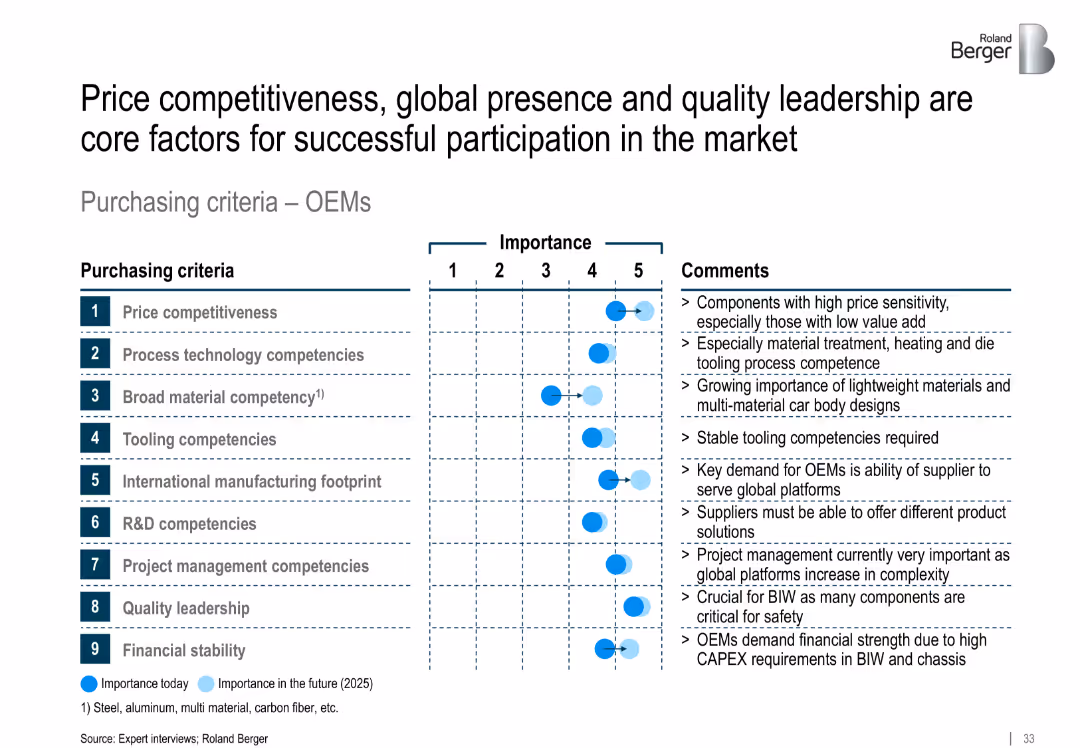
Grid matrix showing importance of nine purchasing criteria (e.g., price, tooling) ranked 1–5 with present and future indicators. Comments appear alongside.
Strategic Planning
Industrial & Manufacturing
This slide outlines what OEMs value in suppliers: price competitiveness, tooling, and global presence are ranked highest. It highlights the growing need for advanced R&D and material capabilities.
OEM criteria, purchasing, pricing, tooling, global footprint, competitiveness, Roland Berger
false
Strategic Planning
Industrial & Manufacturing
Mixed Chart
Roland Berger
Add to my slides
Remove from favorites
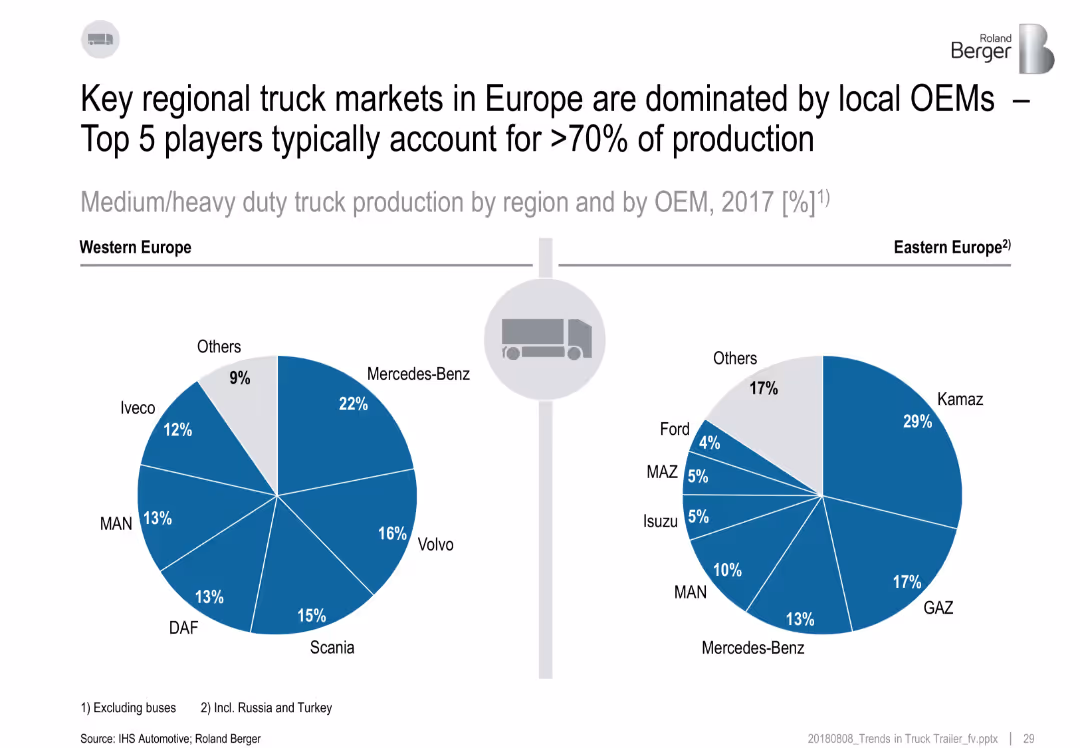
Two pie charts comparing market shares of OEMs in Western and Eastern Europe.
Competitive Landscape
Transportation & Logistics
The slide presents the OEM landscape for heavy-duty truck production in Europe. Western Europe is dominated by Mercedes-Benz, Volvo, and Scania, while Eastern Europe sees Kamaz, GAZ, and Mercedes-Benz leading. Top 5 OEMs hold over 70% share.
OEM, Europe, market share, trucks, production, Mercedes-Benz, Kamaz
false
Competitive Landscape
Transportation & Logistics
Multiple Chart
Roland Berger
Add to my slides
Remove from favorites
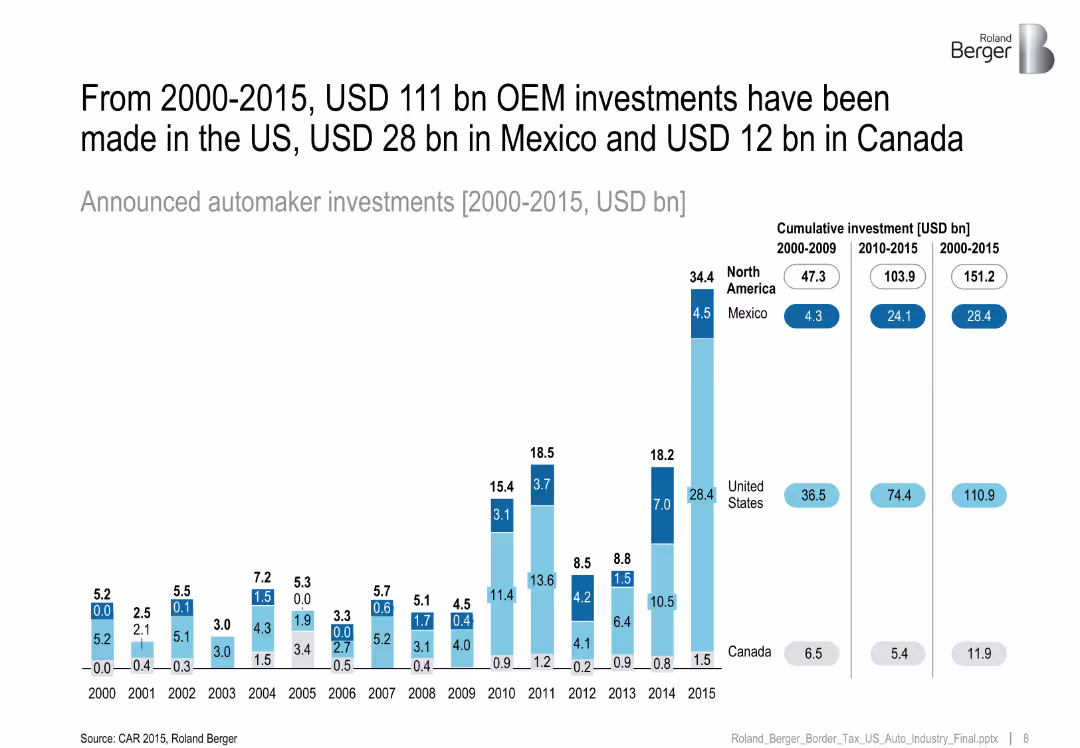
Bar chart of OEM investments per year with cumulative investments by country shown on right.
Investment Analysis
Industrial & Manufacturing
Tracks OEM investment trends across North America, revealing the majority of auto investments occurred in the US, with Mexico seeing a sharp rise post-2010.
OEM investment, North America, Mexico auto, cumulative investment, trend
false
Investment Analysis
Industrial & Manufacturing
Single Chart
Roland Berger
Add to my slides
Remove from favorites
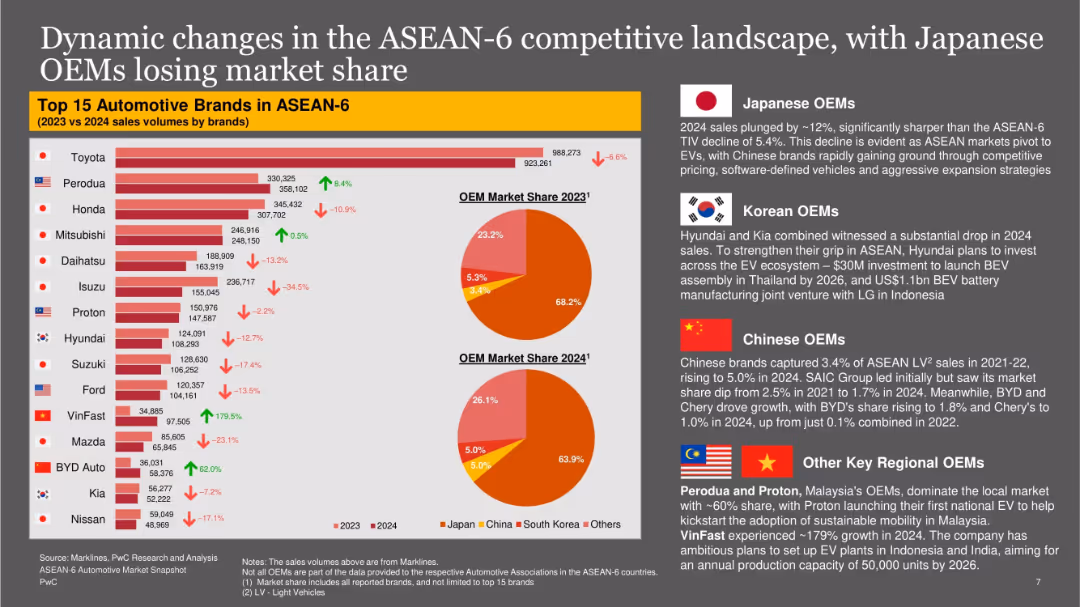
Left bar chart with OEM logos and sales volumes, center pie charts showing market share by region, and right-hand text boxes on Japanese, Korean, Chinese, and regional OEMs.
Competitive Landscape
Industrial & Manufacturing
Analyzes top 15 automotive brands in ASEAN-6 by sales, showing year-over-year changes. Japanese OEMs are losing market share to Chinese and regional players. Includes insights into strategy shifts, investment trends, and technology adoption by OEM groups.
OEM, market share, Toyota, Perodua, Japanese OEMs, Chinese OEMs, ASEAN-6, automotive brands
false
Competitive Landscape
Industrial & Manufacturing
Multiple Chart
PwC/Strategy&
Add to my slides
Remove from favorites
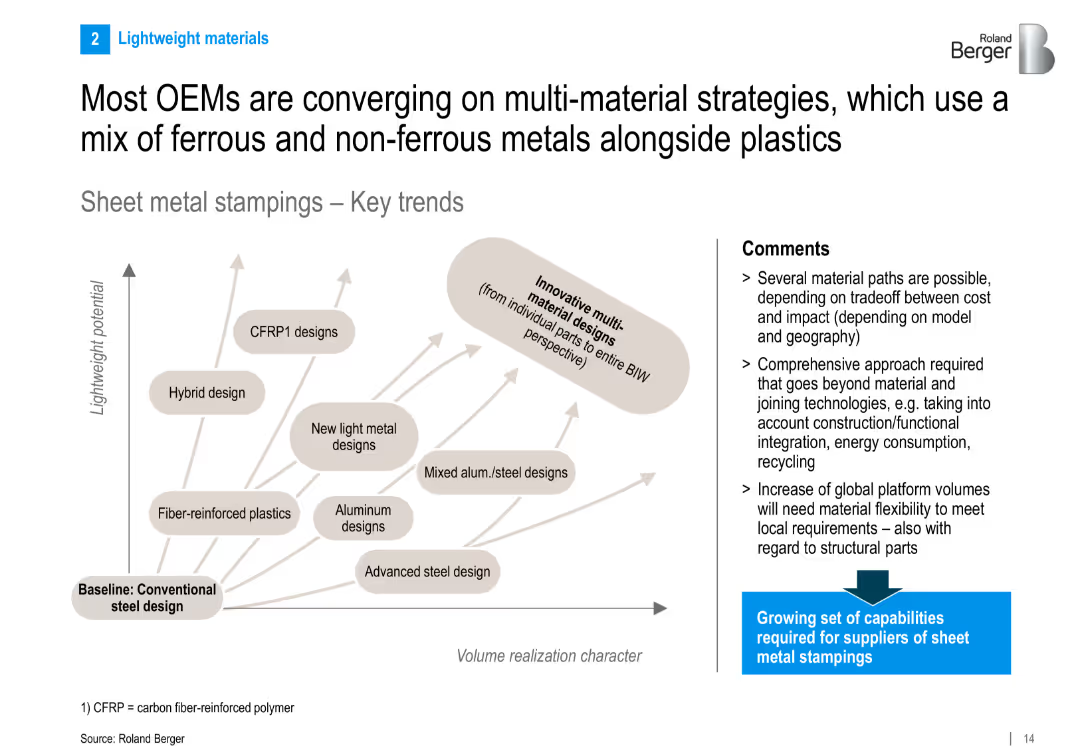
Split layout: left side has a 2D graph plotting material types (e.g., CFRP, aluminum) by lightweight potential and volume realization; right side includes bullet-point comments; overall clean, minimalistic design
Strategic Planning
Industrial & Manufacturing
Highlights the trend among OEMs toward using multi-material designs, mixing ferrous, non-ferrous metals and plastics to optimize cost, weight, and performance. Emphasizes the need for suppliers to broaden their capabilities in sheet metal stamping.
OEMs, CFRP, material mix, sheet metal, lightweight, stamping, aluminum, steel, BIW, trends
false
Strategic Planning
Industrial & Manufacturing
Diagram
Roland Berger
Add to my slides
Remove from favorites
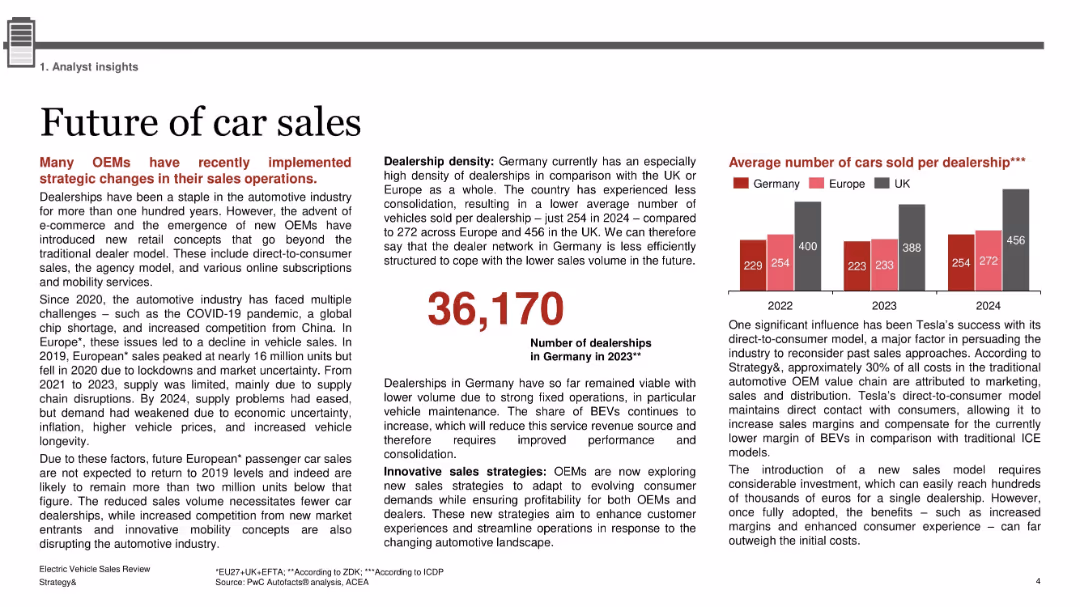
Text-heavy layout with two main columns; bold red headings; bar chart to the right and large numeric callout in center; minimal icons; dense analytical formatting
Strategic Planning
Industrial & Manufacturing
The slide explores shifts in car sales models, highlighting how OEMs are adopting direct-to-consumer models, online subscriptions, and innovative retail strategies. It also discusses dealership density in Germany, with insights into sales volume per dealership. Tesla’s influence and cost structures are also noted.
OEMs, dealership density, Tesla, direct-to-consumer, BEV, ICE, agency model, car sales, Germany, automotive retail
false
Strategic Planning
Industrial & Manufacturing
Mixed Chart
PwC/Strategy&
Add to my slides
Remove from favorites
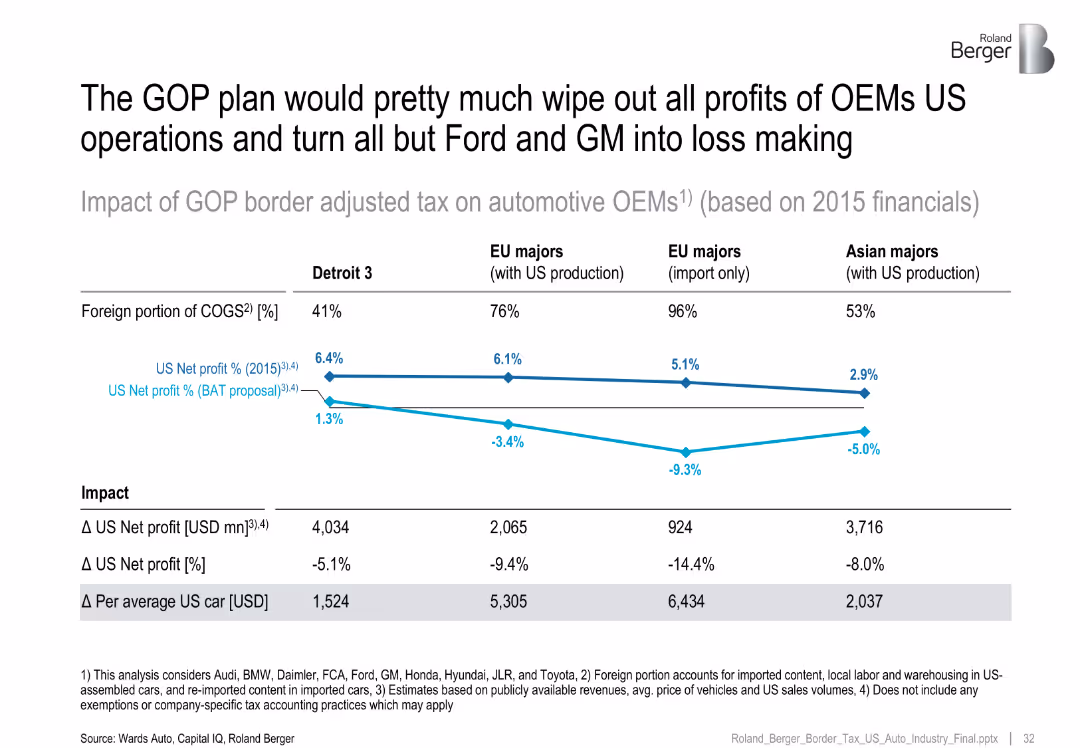
Line chart and table illustrating the impact of GOP border tax on OEM net profits and per car profitability
Financial Performance
Industrial & Manufacturing
Highlights drastic profit reductions for major automotive OEMs under the GOP border tax plan, especially for EU and Asian manufacturers. Includes estimates of net profit changes and per vehicle impact.
OEMs, GOP plan, profit loss, border tax, auto industry, net margin, cost of goods sold, financial stress
false
Financial Performance
Industrial & Manufacturing
Single Chart
Roland Berger
Add to my slides
Remove from favorites
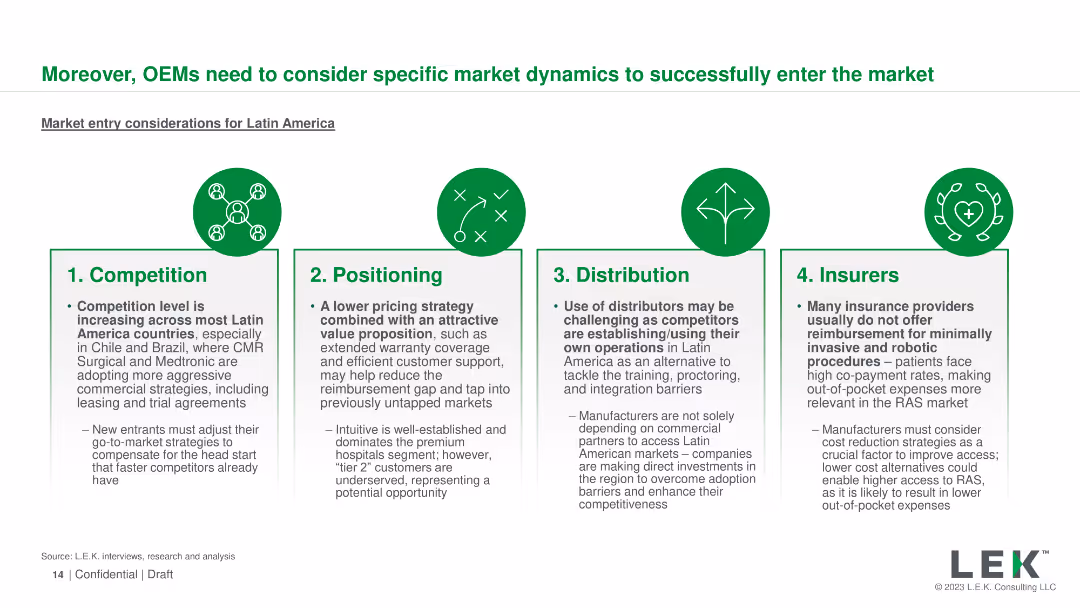
Four sections with icons detailing competition, positioning, distribution, and insurers
Market Analysis and Trends
Healthcare & Pharmaceuticals
Outlines key market entry considerations for OEMs in Latin America, including competition, positioning, and insurance coverage
OEMs, market entry, Latin America, competition, positioning
false
Market Analysis and Trends
Healthcare & Pharmaceuticals
Pillar
LEK
Add to my slides
Remove from favorites
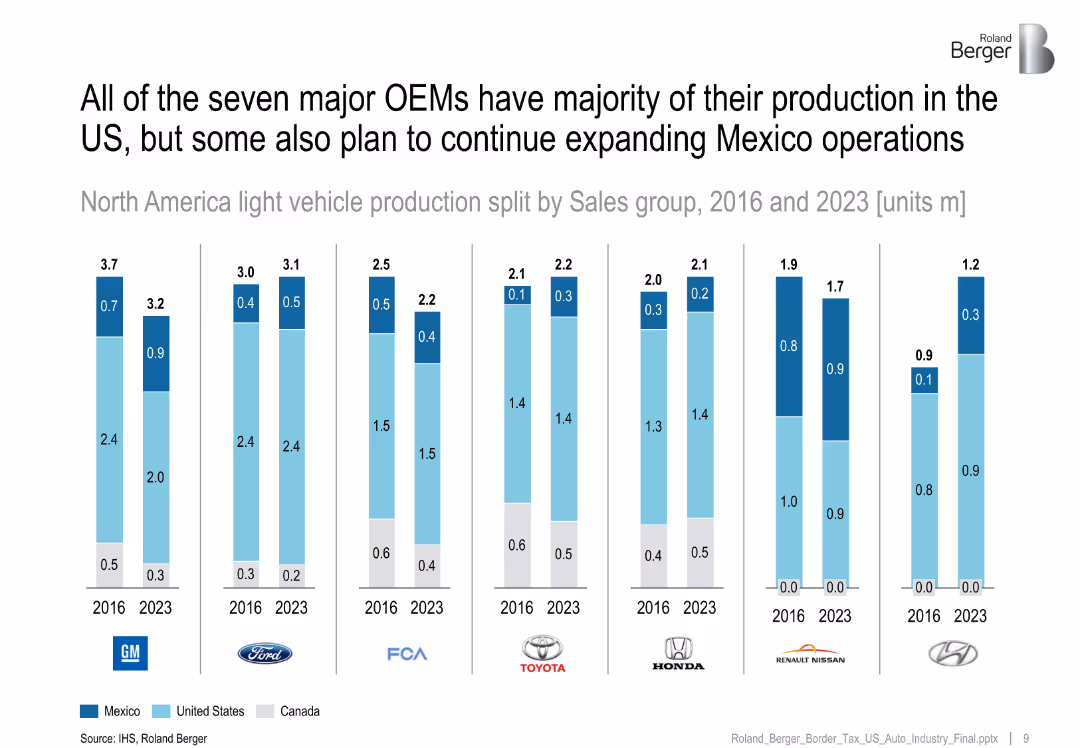
Multiple stacked bar charts per OEM (GM, Ford, etc.) showing vehicle production split (2016 vs 2023).
Strategic Planning
Industrial & Manufacturing
Compares North American production plans of major OEMs, showing most intend to keep majority production in the US, though Mexico's share is projected to grow for some brands.
OEMs, Mexico production, 2023 forecast, US dominance, vehicle production
false
Strategic Planning
Industrial & Manufacturing
Single Chart
Roland Berger
Add to my slides
Remove from favorites
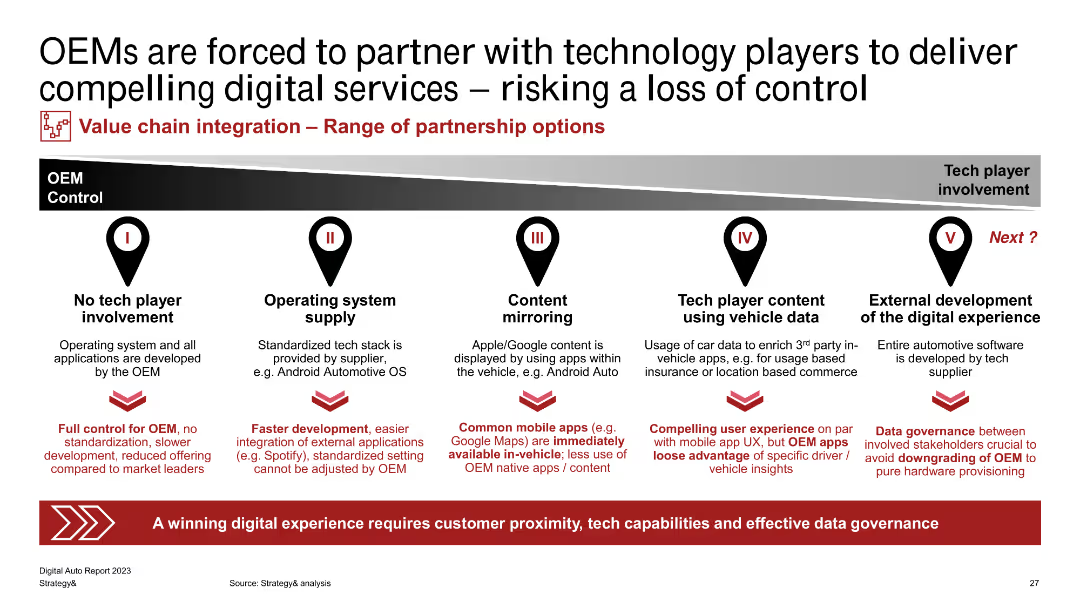
A flowchart showing the range of partnership options between OEMs and tech players, highlighting levels of control and involvement.
Strategic Planning
Transportation & Logistics
Analyzes the necessity for OEMs to partner with technology players to deliver digital services, discussing different levels of control and partnership.
OEMs, technology partnership, digital services, control, involvement
false
Strategic Planning
Transportation & Logistics
Linear Flow
PwC/Strategy&
Add to my slides
Remove from favorites
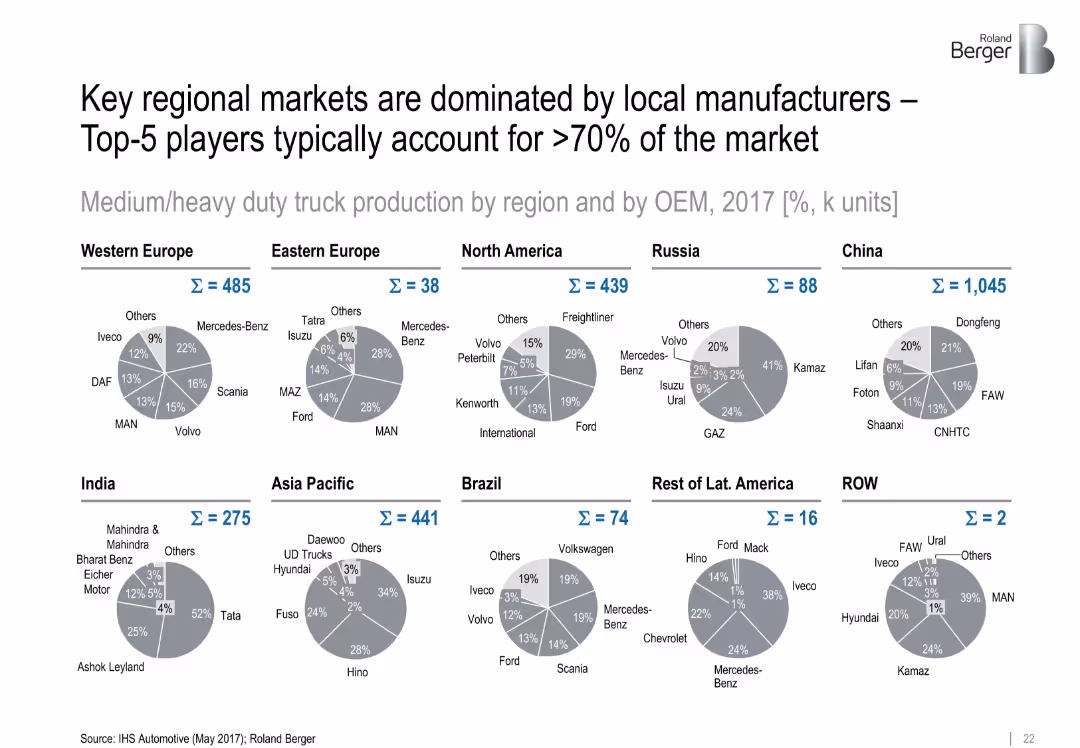
Pie charts showing OEM market shares for medium/heavy duty truck production by region
Competitive Landscape
Industrial & Manufacturing
The slide illustrates that truck production in key regions is heavily localized, with the top five OEMs covering the majority of the market. Pie charts for 10 global regions detail regional leaders, such as Tata in India and Freightliner in North America.
OEM, truck production, regional dominance, market share, Tata, Freightliner, localization
false
Competitive Landscape
Industrial & Manufacturing
Single Chart
Roland Berger
Add to my slides
Remove from favorites
The slide contrasts offensive and defensive M&A strategies with bar charts showing how different industries prioritize various tactics, such as focusing on liquidity and acquiring capabilities.
Strategic Planning
Financial Services
Compares how different industries prioritize offensive and defensive M&A strategies, focusing on key tactics like liquidity management and acquiring new capabilities, supported by survey data.
offensive M&A, defensive M&A, industry comparison, survey data, strategies
false
Strategic Planning
Financial Services
Multiple Chart
Deloitte
Add to my slides
Remove from favorites
The slide uses stacked column charts to illustrate the growth in sales volume of Off-Grid Solar (OGS) products from 2018 to 2020, split by cash and PAYGo sales. Annotations highlight the percentage increase and CAGR, providing a clear visualization of market trends.
Market Analysis and Trends
Energy & Utilities
Details the increase in sales of off-grid solar products under different payment models, emphasizing the rising consumer acceptance and market expansion for solar products in less accessible regions.
off-grid, solar products, sales growth, PAYGo, market expansion
false
Market Analysis and Trends
Energy & Utilities
Single Chart
BCG
Add to my slides
Remove from favorites
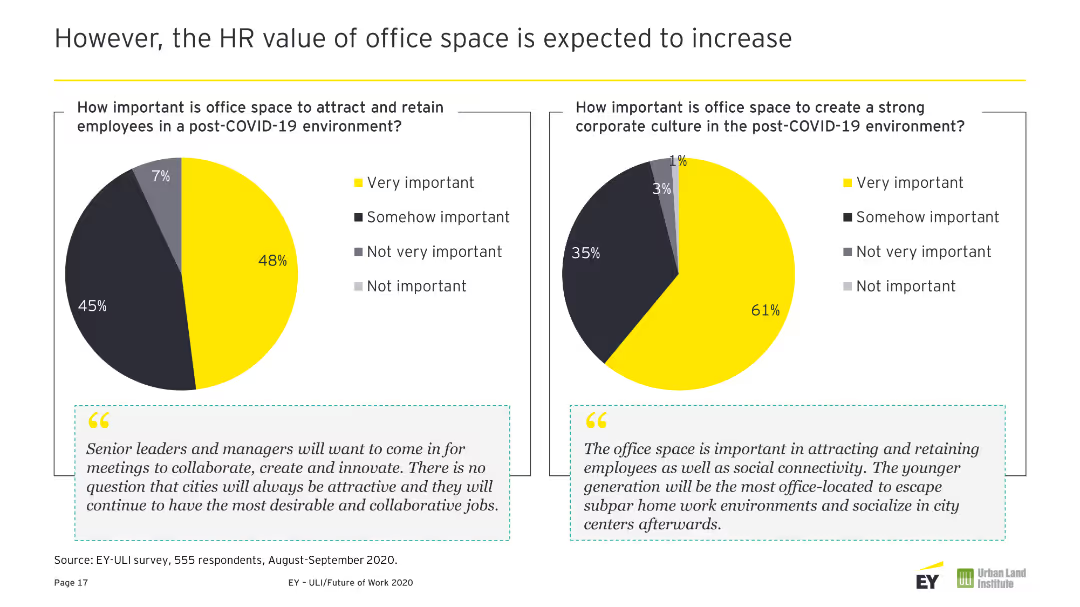
The slide illustrates company approaches to office attendance with three different sized circles, each representing a percentage of companies. The color coding matches the legend, making it clear and easy to understand. The minimalist design focuses on the data, free from any distracting visual elements.
Human Resources and Talent Management
Professional Services
This slide provides an overview of strategies employed by companies to encourage office collaboration. It depicts the percentage of companies allowing employee flexibility, those structuring specific in-office days, and others, helping to guide discussion on balancing autonomy with collaborative needs.
Office Collaboration, Employee Autonomy, Work Strategy, Company Culture, Flexibility
false
Human Resources and Talent Management
Professional Services
Single Chart
EY
Add to my slides
Remove from favorites
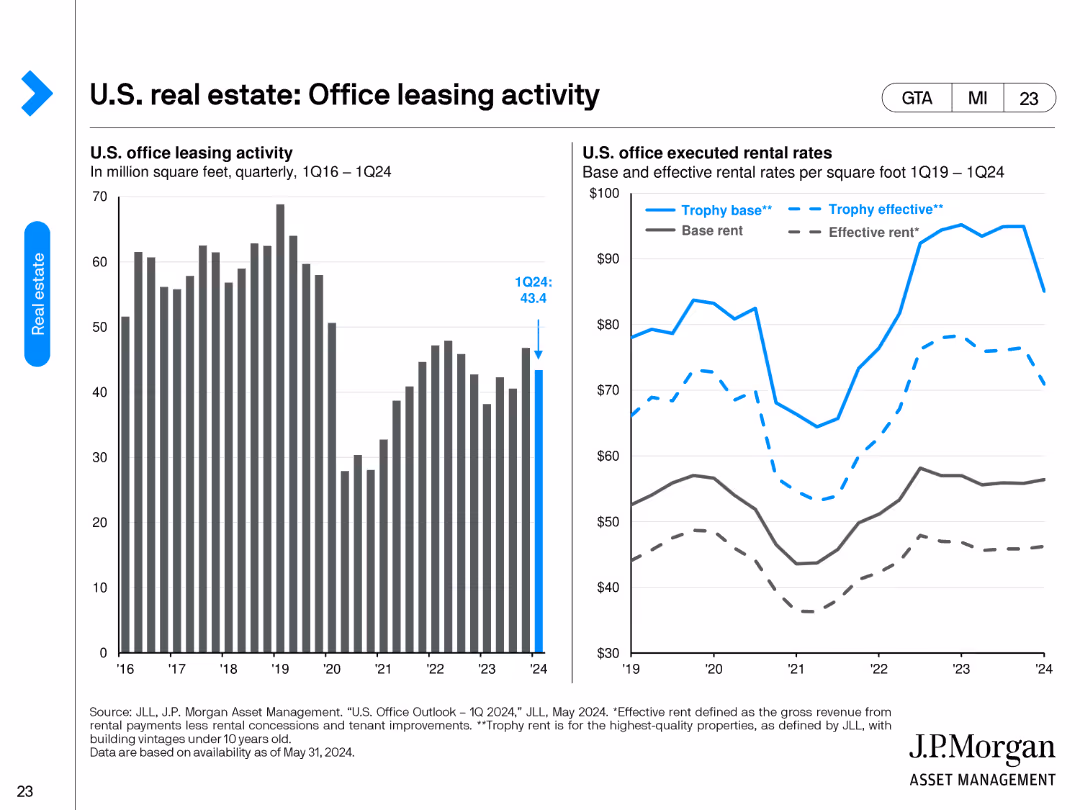
The slide contains two column charts. The left chart shows U.S. office leasing activity in million square feet from 1Q16 to 1Q24. The right chart compares base and effective rental rates per square foot from 1Q19 to 1Q24.
Market Analysis and Trends
Real Estate & Construction
This slide tracks U.S. office leasing activity and rental rates over time, providing insights into office space demand and rent dynamics. It's useful for understanding the office market's performance and trends in leasing and rental rates.
office leasing, rental rates, market performance, leasing activity, office space demand
false
Market Analysis and Trends
Real Estate & Construction
Multiple Chart
JP Morgan
Add to my slides
Remove from favorites
The slide has column and line charts, and smaller column charts. The primary chart shows quarterly take-up and vacancy rates, with blue bars and a yellow line. On the right, two column charts display Grade A office vacancy in key markets and vacancy in weaker markets, distinguished by color gradations of blue and grey.
Operational Efficiency
Real Estate & Construction
This slide outlines improvements in office market occupancy, contrasting Grade A office vacancy against all office grades. It includes specific vacancy rates in weaker office markets. Real estate professionals can use this to assess market health or investment potentials in various office grades, especially when considering strategic property upgrades or marketing to reduce vacancy rates.
office market, occupancy, vacancy rates, Grade A, market comparison
false
Operational Efficiency
Real Estate & Construction
Multiple Chart
Morgan Stanley
Add to my slides
Remove from favorites
This slide contains a multi-line graph showing office portfolio occupancy trends across several countries, alongside a bar chart representing portfolio weighting by country. It uses a white background with lines in various shades of blue and a yellow highlight for one country’s trend.
Performance Metrics and KPIs
Real Estate & Construction
The slide provides an analysis of office portfolio occupancy rates, close to 90%, across different countries, and shows the portfolio weighting by country. It is crucial for real estate managers tracking occupancy trends or investors evaluating market performance and investment distribution across a global portfolio.
office occupancy, portfolio management, country trends, real estate investment
false
Performance Metrics and KPIs
Real Estate & Construction
Multiple Chart
Morgan Stanley
Add to my slides
Remove from favorites
This slide displays column chart and line graph with a blue and green color scheme. The column chart shows the rent reversion percentage over time, with a prominent label of a recent increase. A line graph depicts occupancy trends, correlating with the bar graph data.
Financial Performance
Real Estate & Construction
The slide communicates the reversion of office rent, with a focus on the recent 8.1% increase, and the related office portfolio occupancy rates. It mentions specifics like portfolio NLA re-leased and the tenant retention rate. This slide could be used by real estate professionals to analyze portfolio performance or by investors reviewing rent trends for decision-making.
office rent, reversion, occupancy, NLA, tenant retention
false
Financial Performance
Real Estate & Construction
Single Chart
Morgan Stanley
Add to my slides
Remove from favorites
Column chart predicting changes in office space usage over the next three-to-five years. Contains three text quotes on the left side in gray boxes. Dominated by yellow and gray colors.
Market Analysis and Trends
Real Estate & Construction
Forecasts a decrease in office space demand due to new work patterns, with detailed reasons including cost management and adaptation to less space.
Office Space, Decrease, Work Patterns, Forecast, Demand, Cost Management, Adaptation, Trends, Space Usage
false
Market Analysis and Trends
Real Estate & Construction
Multiple Chart
EY
Add to my slides
Remove from favorites
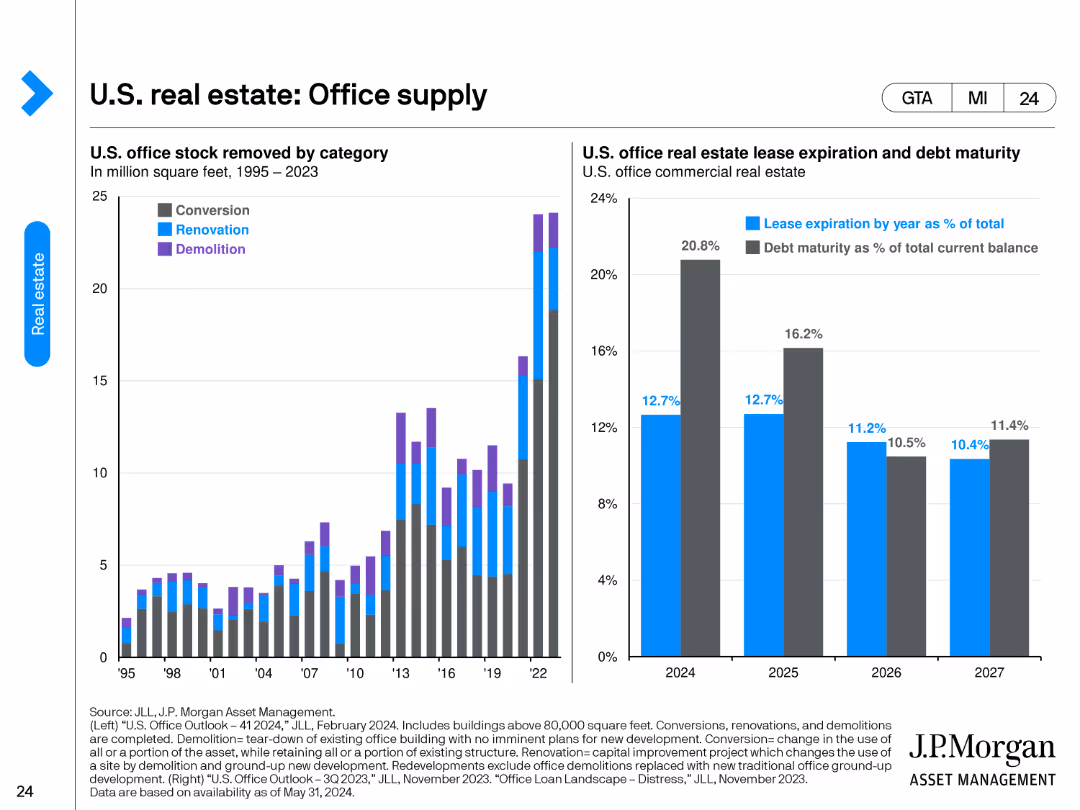
The slide features two charts. The left chart categorizes U.S. office stock removed by conversion, renovation, and demolition from 1995 to 2023. The right chart presents U.S. office real estate lease expiration and debt maturity as percentages of total current balance from 2024 to 2027.
Market Analysis and Trends
Real Estate & Construction
The slide provides an overview of the changes in U.S. office supply through different removal methods and outlines the lease expiration and debt maturity schedules for office real estate. It's useful for understanding supply dynamics and future lease/debt obligations.
office supply, lease expiration, debt maturity, conversion, renovation, demolition
false
Market Analysis and Trends
Real Estate & Construction
Multiple Chart
JP Morgan
Add to my slides
Remove from favorites
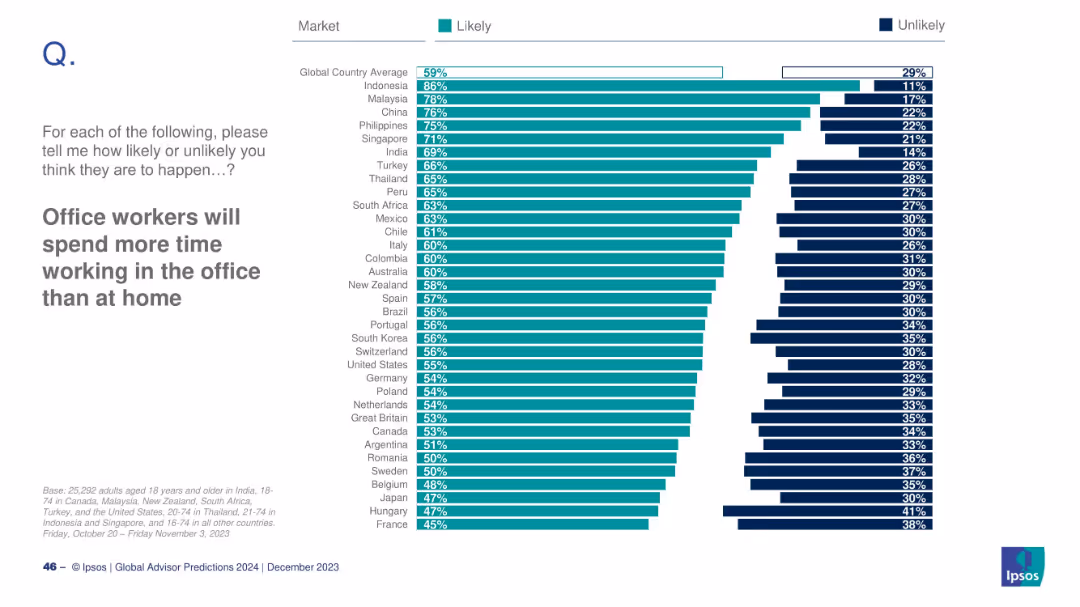
Horizontal bar chart; country-level Likely/Unlikely perceptions shown with teal and dark blue bars; global avg displayed at top.
Human Resources and Talent Management
Professional Services
This slide assesses global expectations around workplace behavior. A majority in Indonesia (86%) think office work will dominate, while France (45%) ranks lowest. The global average stands at 59%, reflecting post-pandemic workforce adaptations.
office work, remote work, workplace trends, human resources, Ipsos, 2024, professional behavior, global sentiment, hybrid model, future of work
false
Human Resources and Talent Management
Professional Services
Mixed Chart
IPSOS
Add to my slides
Remove from favorites
Pie chart showing percentage of internet-using buyers, with bar graphs for younger and older offline investors.
Investment Analysis
Financial Services
Explores the investment behavior of offline vs. online investors, highlighting the preference for agents and ease of understanding.
Offline Investors, Agents, Simplicity, Financial Information, Online Options, Investment Behavior
false
Investment Analysis
Financial Services
Mixed Chart
BCG
Add to my slides
Remove from favorites
Two columns of text with graphics, image of shopping experience on the side.
Customer and Market Segmentation
Retail & E-commerce
Insights into the top reasons for consumers shifting to offline channels, like 'look and feel' and easing of restrictions.
offline shopping, consumer behavior, market trends, retail, shopping
false
Customer and Market Segmentation
Retail & E-commerce
Boxed
Bain
Add to my slides
Remove from favorites
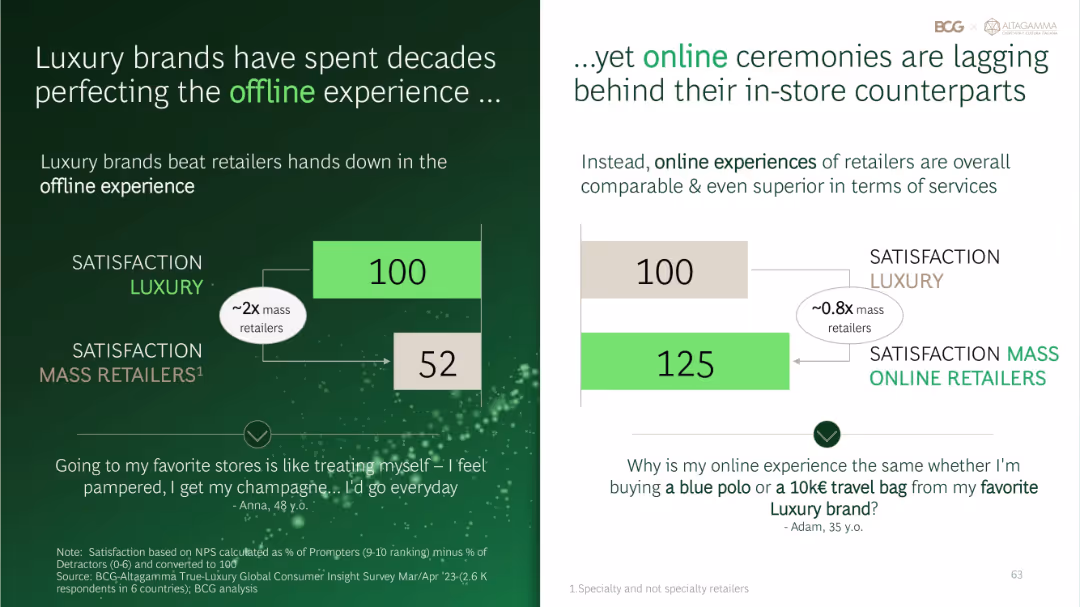
Two-panel layout comparing satisfaction scores for offline (left) and online (right) luxury vs. mass retailers using simplified bar graphics.
Performance Metrics and KPIs
Retail & E-commerce
Contrasts luxury vs. mass retailer satisfaction across offline and online experiences. Offline luxury retail scores very high, but online luxury satisfaction lags behind mass online retailers, suggesting a digital experience gap.
offline vs online, luxury retail, mass retailers, satisfaction gap, NPS
false
Performance Metrics and KPIs
Retail & E-commerce
Multiple Chart
BCG
Add to my slides
Remove from favorites
Column charts, text annotations.
Market Analysis and Trends
Retail & E-commerce
Analyzes trends in discount luxury retail channels.
off-price, luxury, Asia, Americas, Europe
false
Market Analysis and Trends
Retail & E-commerce
Mixed Chart
Bain
Add to my slides
Remove from favorites
Includes three separate column charts showing forecasts for subsea equipment, services, and SURF from 2014 to 2023, with projected growth trends indicated by arrows.
Market Analysis and Trends
Energy & Utilities
Analyzes trends in offshore oil and gas investments, focusing on equipment, services, and SURF sectors, with forecasts showing growth, which could inform strategic decisions in these areas.
offshore, oil and gas, forecast, trends, investments
false
Market Analysis and Trends
Energy & Utilities
Multiple Chart
Barclays
Add to my slides
Remove from favorites
The slide is divided into three sections, each with a header, a descriptive text block, and an accompanying image. It features images of offshore platforms and vessels, emphasizing Seatruim’s capabilities.
Operational Efficiency
Energy & Utilities
Showcases Seatruim’s achievements and capabilities in offshore platform design and construction, emphasizing their market leadership and commitment to quality and innovation. Suitable for discussions on company accomplishments and industry standing.
Offshore Platforms, FPSOs, Leadership, Achievements
false
Operational Efficiency
Energy & Utilities
Header Vertical
Morgan Stanley
Add to my slides
Remove from favorites
The slide features a combination of images and bulleted lists. Four images represent key pillars, and a detailed list of industry trends and opportunities follows each image.
Market Analysis and Trends
Energy & Utilities
Discusses the growth drivers in the renewable energy sector, emphasizing Seatruim’s strategic areas of development. Useful for presenting the market outlook and potential growth areas in offshore energy and decarbonization initiatives.
Offshore Wind, Decarbonization, New Energies, Growth
false
Market Analysis and Trends
Energy & Utilities
Header Vertical
Morgan Stanley
Add to my slides
Remove from favorites
Map of Europe with icons marking wind projects, alongside a column showing investment figures.
Investment Analysis
Energy & Utilities
Discusses offshore wind power projects, investment details, and developmental status across Europe.
offshore, wind power, investment, Europe, development
false
Investment Analysis
Energy & Utilities
Mixed Chart
Barclays
Add to my slides
Remove from favorites
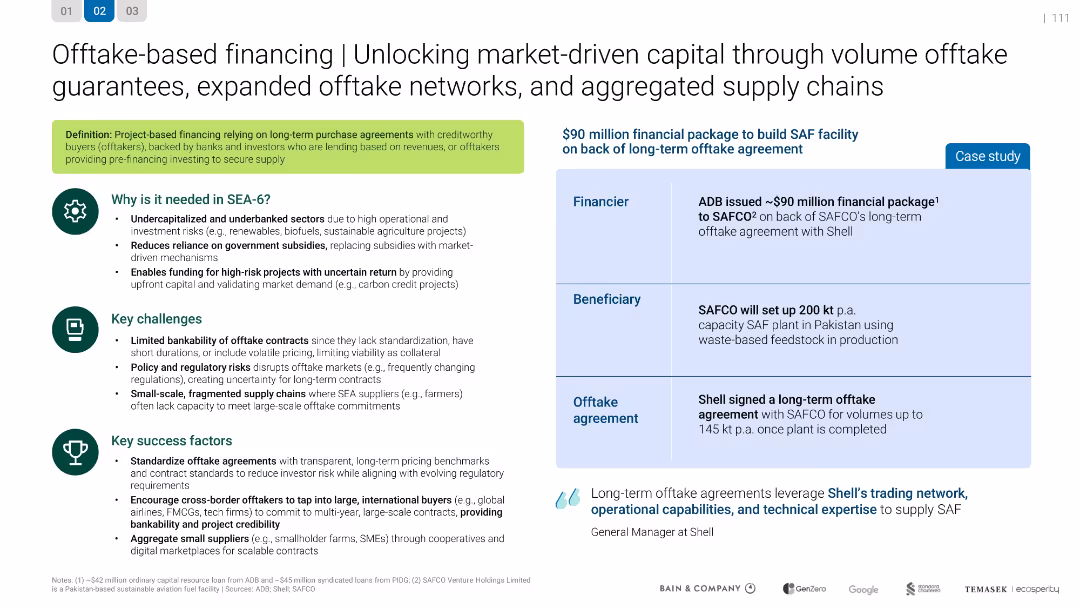
3-column layout: definition and rationale on left, case study in center, challenges/success factors on right; structured with icons and color accents.
Technology and Digital Transformation
Energy & Utilities
Explains offtake-based financing, where long-term contracts back high-risk clean energy projects. Describes SEA challenges like weak offtake structures and success factors such as standardization and supply aggregation. Features a real case study.
offtake, financing, ADB, SAFCO, Shell, energy, SEA
false
Technology and Digital Transformation
Energy & Utilities
Table
Bain
Add to my slides
Remove from favorites
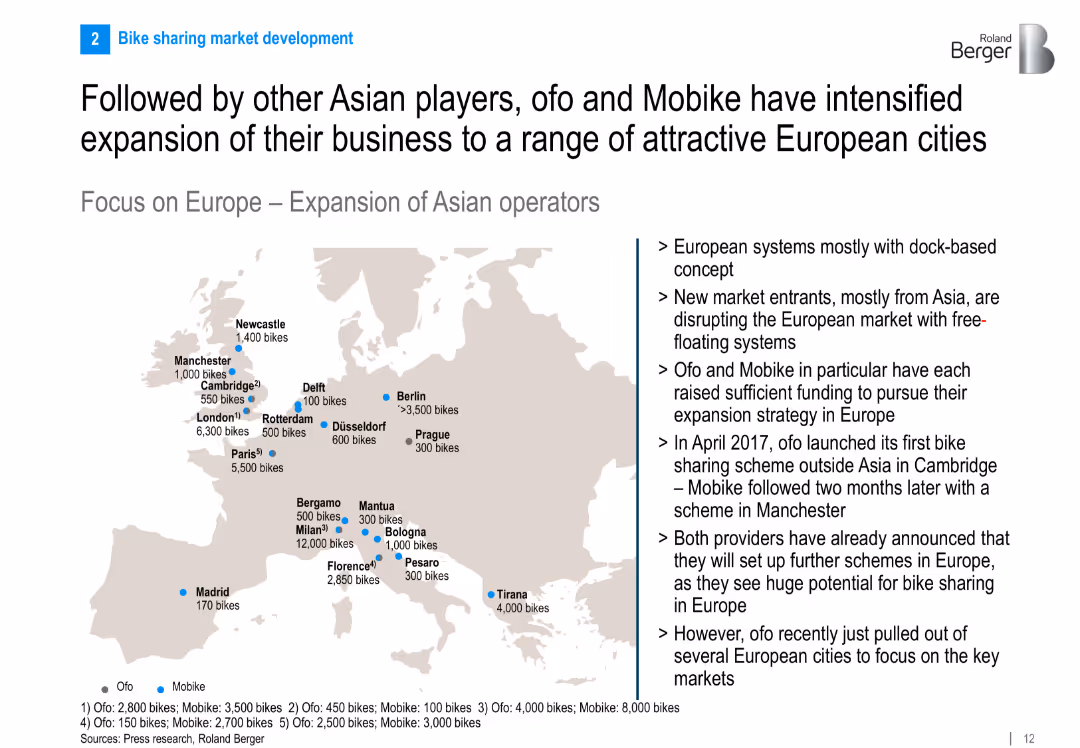
Map of Europe showing cities where Ofo and Mobike operate, with accompanying text on strategy and timeline of market entry.
Sales and Business Development
Transportation & Logistics
The slide outlines the expansion of major Asian bike sharing players into Europe. It maps out cities with Ofo and Mobike operations and discusses how these companies disrupted existing systems with dockless models and rapid scaling.
Ofo, Mobike, bike sharing, expansion, Europe, dockless, market entry, urban transport
false
Sales and Business Development
Transportation & Logistics
Graphic
Roland Berger
Add to my slides
Remove from favorites
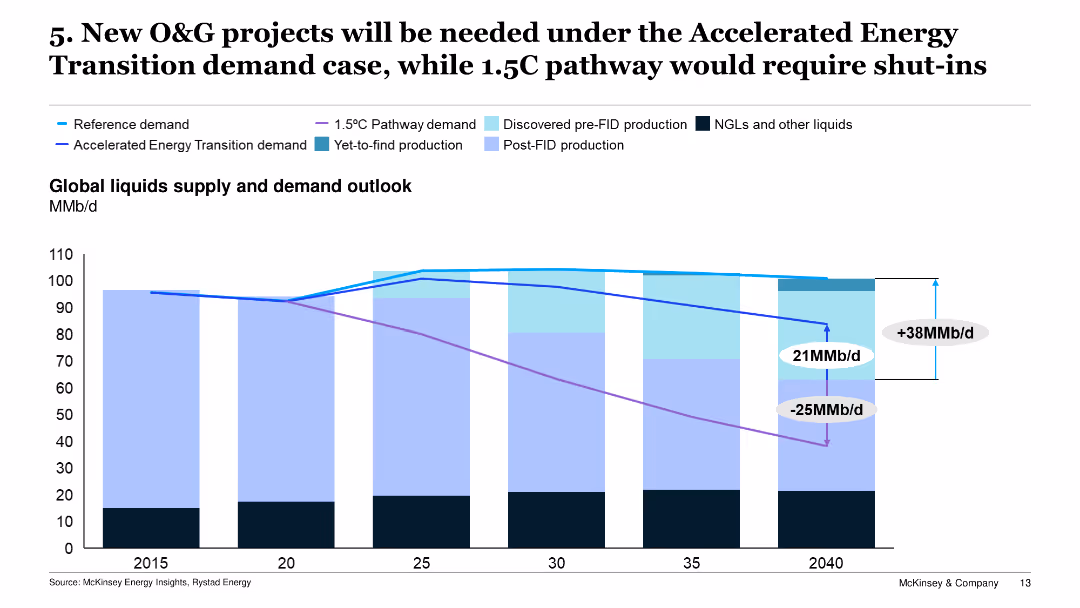
Displays a line chart projecting global liquids supply and demand outlooks under various scenarios, including the 1.5°C Pathway and Accelerated Energy Transition.
Risk Assessment and Management
Energy & Utilities
The slide examines the projected global supply and demand for oil and gas, stressing the need for new projects under the Accelerated Energy Transition scenario to meet future demands.
O&G projects, energy transition, demand, supply outlook, new projects
false
Risk Assessment and Management
Energy & Utilities
Single Chart
McKinsey
Add to my slides
Remove from favorites
Previous
Next
You don't have any favorites yet.
Please wait loading your favorites slides...
Create a FREE account to continue browsing
Receive Instant Access to 1,000+ slides from companies like McKinsey, Google, and Goldman Sachs
First Name
Last Name
Email
Password
I agree to all
Terms & Privacy Policy
Thank you! Your submission has been received!
Oops! Something went wrong while submitting the form.
Have an account?
Sign in
Upgrade to PRO to Save slides
Advanced Search and Filters
Access to 15,000+ slides
Access to Category Pages
Save/Bookmark Slides
PowerPoint Template Library
Pick a Plan
MONTHLY
$12/month
Billed every month, Cancel anytime.
YEARLY
$9/year
Billed $108 annually, Cancel anytime.
Checkout for $12/month
Checkout for $108/yr
Secured by Stripe | AES-256 bit encryption


![Exhibit 22 NPL Sales Total Volume Expected Growth [TRY bn, 2010-23]](https://cdn.prod.website-files.com/654e70fb59937215cac87b19/6877e212f9a180cbc7298040_L52_Oa3wTN6SGsqWKzp8NZrmC8r3tL5qZ_X5VbS8Ai0.avif)
![Exhibit 19 Net NPL Inflow Total Volume Expected Growth [TRY bn, 2010-23]](https://cdn.prod.website-files.com/654e70fb59937215cac87b19/6877e20855d85025a974ff4f_ofN2ANWw3JoDVnhaHR8_7Dyz6-HsTTy8qicHH5chkcM.avif)