My Account
My Slides
Search by Category
Pricing
Templates
View All Templates
Download Template Slides
✦ AI Search
Feedback
Login
Logout
Get Started
Browse all Slides
Browse all Slides
Create a FREE Account
Instant access to 1,000+ real slides from top companies like McKinsey, BCG, Goldman Sachs, Google and many more!
First Name
Last Name
Email
Password
I agree to all
Terms & Privacy Policy
Thank you! Your submission has been received!
Oops! Something went wrong while submitting the form.
Have an account?
Sign in
Saved Slides
Total No. of slides saved
0
↻ Refresh
✖ Clear all
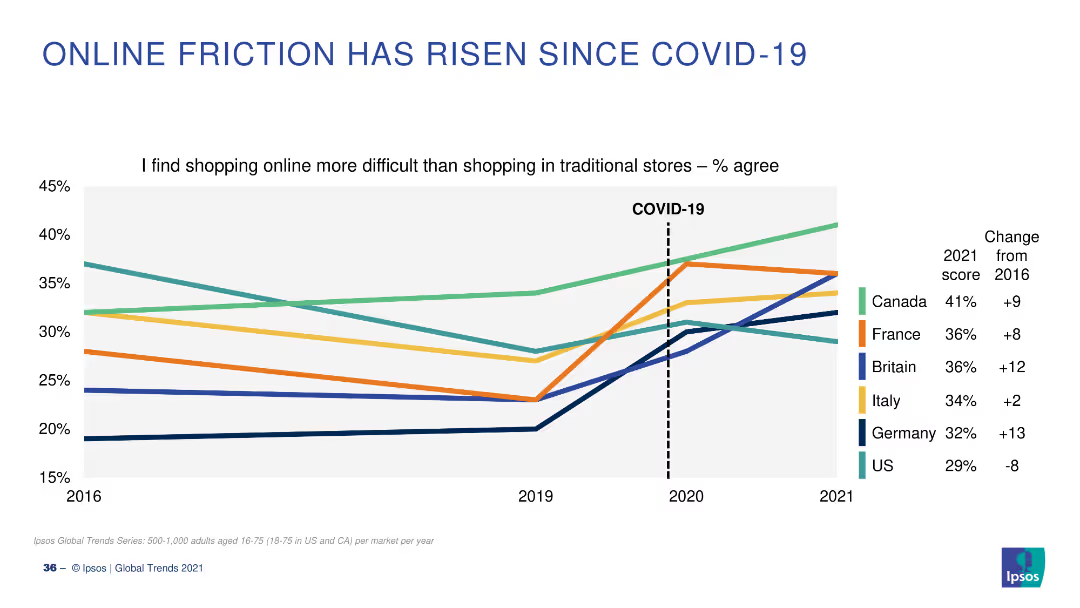
A line chart showing changes over time in the percentage of people who find online shopping more difficult than traditional shopping, with a significant rise post-COVID-19.
Market Analysis and Trends
Retail & E-commerce
The slide illustrates the increase in online shopping difficulties post-COVID-19, comparing 2016 to 2021 data for different countries, highlighting the impact of the pandemic.
online shopping, difficulties, COVID-19, trends, survey
false
Market Analysis and Trends
Retail & E-commerce
Single Chart
IPSOS
Add to my slides
Remove from favorites
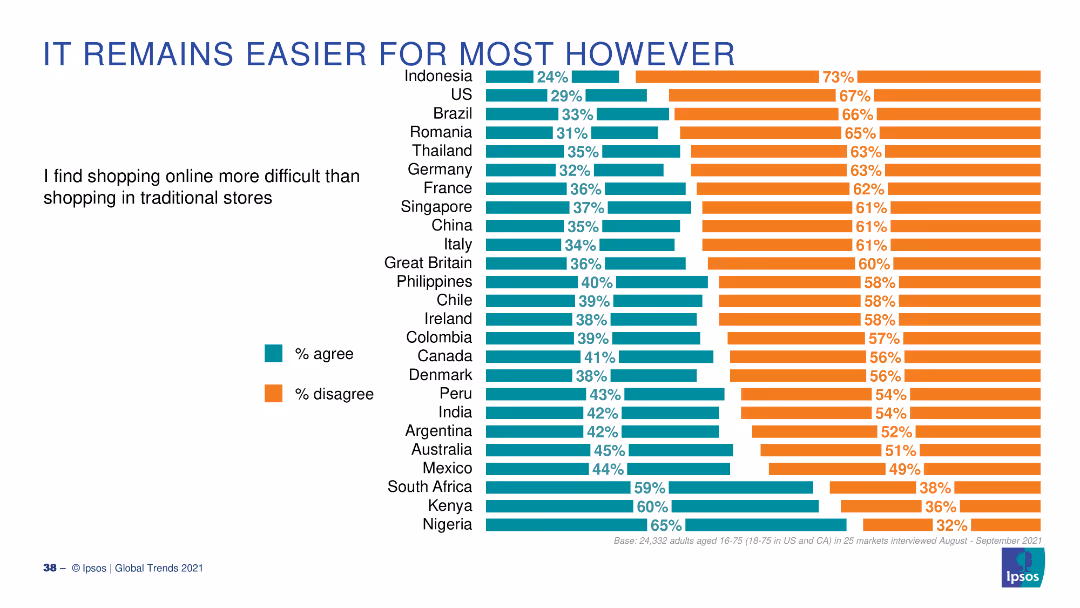
A bar chart with horizontal bars displaying the percentage of people who agree or disagree that online shopping is more difficult than traditional shopping across various countries.
Market Analysis and Trends
Retail & E-commerce
The slide shows survey data on the ease of online shopping compared to traditional shopping, with a global perspective, highlighting different country responses.
online shopping, ease, global, survey, countries
false
Market Analysis and Trends
Retail & E-commerce
Multiple Chart
IPSOS
Add to my slides
Remove from favorites
Features a vertical bar chart detailing the investment priorities related to in-store/omnichannel and e-commerce technologies.
Technology and Digital Transformation
Retail & E-commerce
Discusses the increase in investment towards enhancing in-store and online shopping experiences, driven by consumer behavior changes during the pandemic.
online shopping, e-commerce, investment, in-store, omnichannel, pandemic, consumer behavior, technology
false
Technology and Digital Transformation
Retail & E-commerce
Single Chart
Deloitte
Add to my slides
Remove from favorites
Features percentage data with bar charts and icons to emphasize the increase in online shopping for essentials, particularly groceries, in Southeast Asia.
Market Analysis and Trends
Retail & E-commerce
Highlights the mainstream adoption of online shopping for essential goods, such as groceries, in Southeast Asia, underscoring the impact of digital adoption on consumer habits.
Online shopping, essentials, groceries, mainstream, Southeast Asia
false
Market Analysis and Trends
Retail & E-commerce
Single Chart
Bain
Add to my slides
Remove from favorites
Slide features a mix of text and bar graphs, with a focus on the increase in consumers purchasing groceries online across different markets. Clear presentation of data trends with the right amount of textual explanation for context.
Customer and Market Segmentation
Retail & E-commerce
The slide highlights the growth of online grocery shopping across Southeast Asian markets, indicating a significant shift in consumer behavior and the success of omnichannel retail strategies.
online shopping, grocery market, consumer trends, Southeast Asia, omnichannel retail, market growth, digital transformation
false
Customer and Market Segmentation
Retail & E-commerce
Multiple Chart
Bain
Add to my slides
Remove from favorites
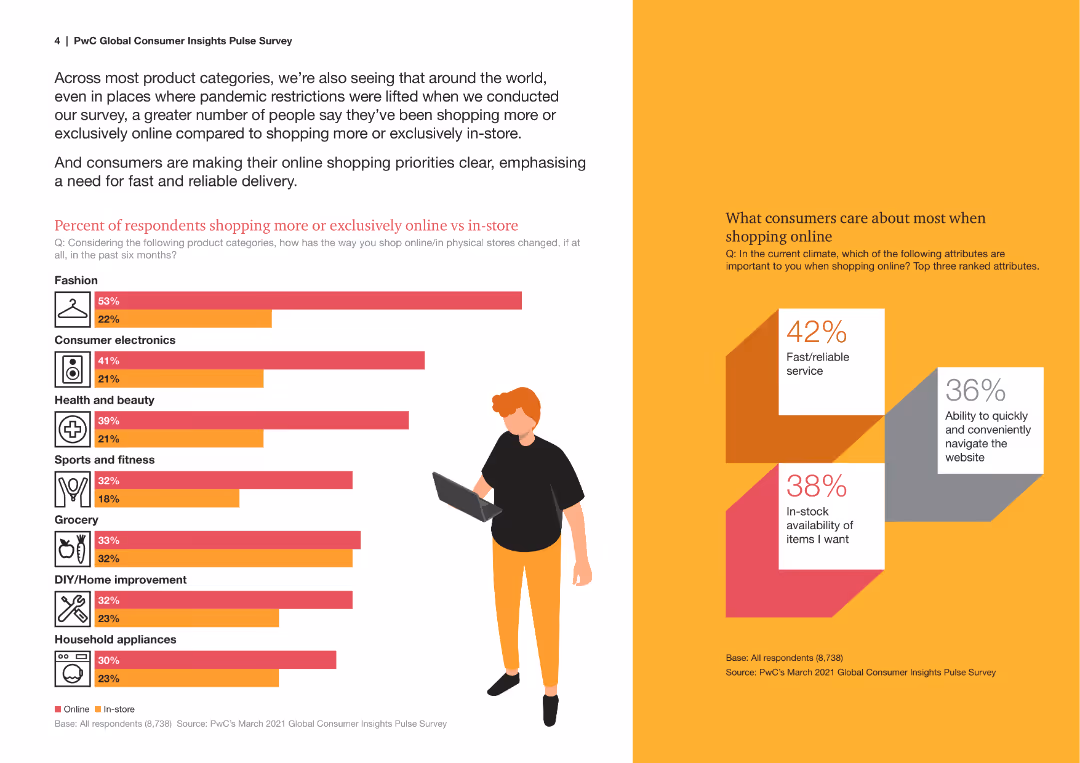
Column chart showing online vs in-store shopping preferences across various product categories.
Market Analysis and Trends
Retail & E-commerce
The slide details the change in consumer shopping behavior, highlighting the increase in online shopping across different categories.
online shopping, in-store, preferences, product categories, consumer behavior, trends
false
Market Analysis and Trends
Retail & E-commerce
Mixed Chart
PwC/Strategy&
Add to my slides
Remove from favorites
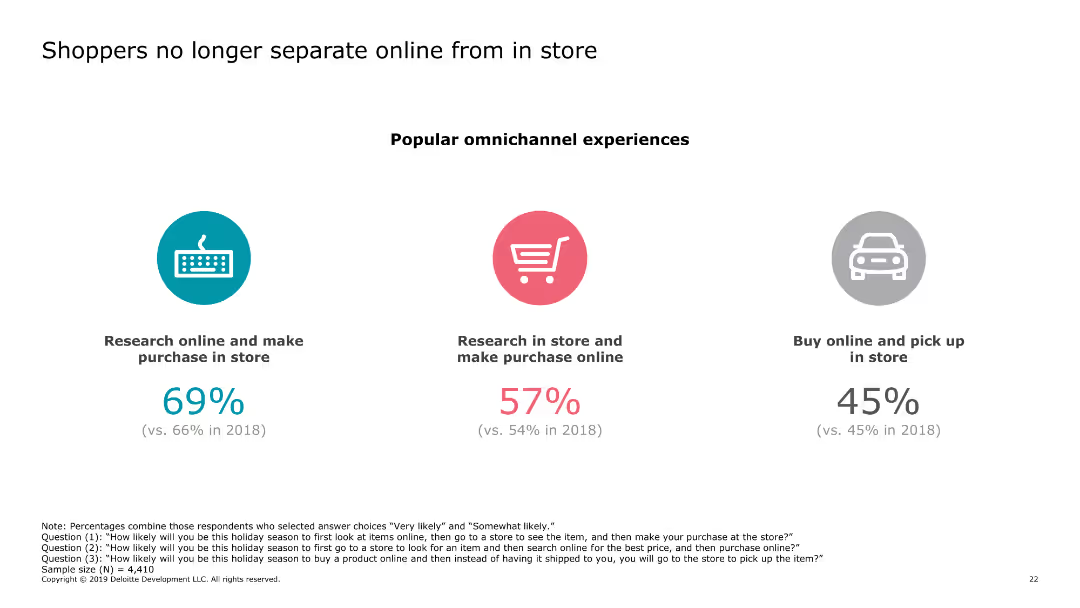
The slide contains three circular icons, each representing a different shopping behavior (research online and make purchase in store, research in store and make purchase online, buy online and pick up in store). Each icon has a corresponding percentage below it.
Market Analysis and Trends
Retail & E-commerce
The slide highlights the trend of shoppers blending online and in-store experiences, showing the percentages of different omnichannel shopping behaviors. This indicates growing integration between online and offline shopping.
online shopping, in-store shopping, omnichannel, consumer behavior, retail trends
false
Market Analysis and Trends
Retail & E-commerce
Pillar
Deloitte
Add to my slides
Remove from favorites
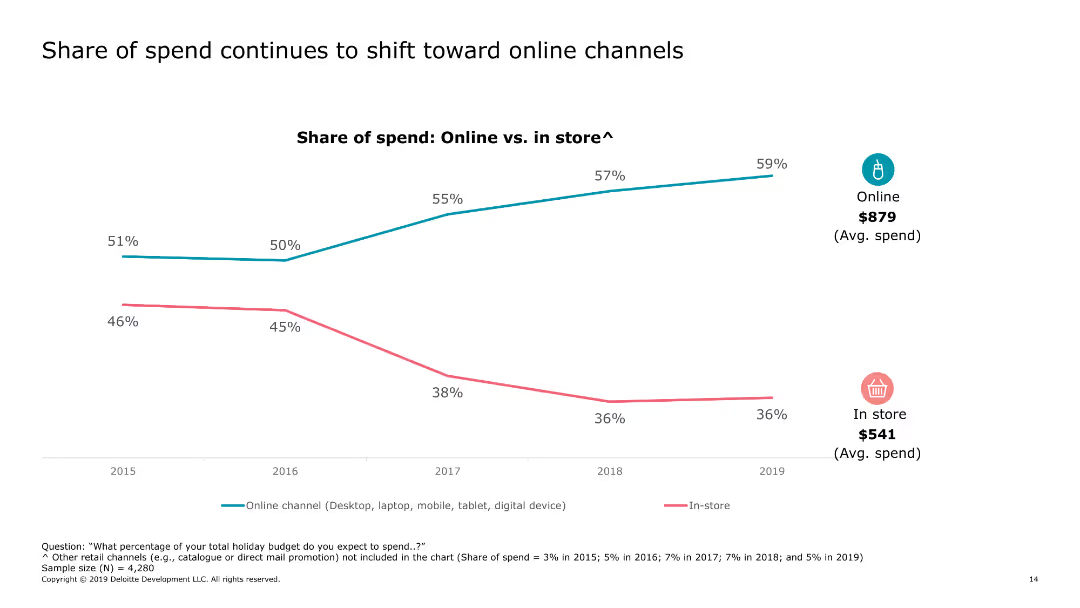
The slide shows a line chart comparing the share of spending online versus in-store from 2015 to 2019. It includes average spend values for both channels.
Market Analysis and Trends
Retail & E-commerce
The slide tracks the shift in consumer spending from in-store to online over several years, highlighting the growth of online shopping.
online shopping, in-store shopping, spending trends, consumer behavior, retail, e-commerce, holiday shopping, 2019, average spend
false
Market Analysis and Trends
Retail & E-commerce
Single Chart
Deloitte
Add to my slides
Remove from favorites
Contains multiple column charts comparing the market share of different retail channels for luxury goods from 2014 to 2025, with an emphasis on the growth of online sales.
Technology and Digital Transformation
Retail & E-commerce
Analyzes the trend towards online shopping for luxury goods, projecting significant growth and integration with physical retail channels by 2025. Discusses how technology will enhance shopping experiences.
Online Shopping, Luxury Goods, Market Trends, Growth
false
Technology and Digital Transformation
Retail & E-commerce
Mixed Chart
Bain
Add to my slides
Remove from favorites
Bold title with a line graph below showing the rise in online shopping hashtags, and a quote on the right side.
Market Analysis and Trends
Retail & E-commerce
Explores the sustained online shopping patterns despite the reopening of physical retail spaces, indicating lasting changes in consumer behavior.
online shopping, retail trends, market stabilization, consumer habits, social media analysis, testimonial
false
Market Analysis and Trends
Retail & E-commerce
Single Chart
Accenture
Add to my slides
Remove from favorites
Features a large bar graph with color-coding to denote the digital consumer population growth across Southeast Asian countries, contrasting 2019 and 2020 data.
Market Analysis and Trends
Retail & E-commerce
Discusses the migration of offline shoppers to online platforms in Southeast Asia with Indonesia seeing the highest increase in digital consumers.
Online shopping, Southeast Asia, digital consumers, Indonesia, graph
false
Market Analysis and Trends
Retail & E-commerce
Single Chart
Bain
Add to my slides
Remove from favorites
Contains multiple bar graphs comparing platform usage over two years across different Southeast Asian countries, with a clear legend and annotations.
Customer and Market Segmentation
Retail & E-commerce
Shows the increase in the average number of online platforms used per person in Southeast Asia from 2021 to 2022.
Online shopping, user data, SEA
false
Customer and Market Segmentation
Retail & E-commerce
Boxed
Bain
Add to my slides
Remove from favorites
This slide features a pie chart and a series of color-coded bars, showcasing the distribution and average online spending of different types of online spenders along with the categories they spend on.
Customer and Market Segmentation
Retail & E-commerce
It profiles online spenders by their spending habits, categorizing them as low, medium, or high. It also identifies the proportion of their total spendings online and the types of categories they are likely to purchase from.
Online spending, consumer behavior, e-commerce
false
Customer and Market Segmentation
Retail & E-commerce
Single Chart
BCG
Add to my slides
Remove from favorites
A slide with a dual focus on textual explanation and bar charts, predicting the future online spending in Southeast Asia and comparing it with past forecasts.
Financial Performance
Retail & E-commerce
Forecasts a dramatic increase in online spending within Southeast Asia by 2025, with detailed expectations of consumer spending growth.
Online spending, forecast, Southeast Asia, consumer behavior, bar chart
false
Financial Performance
Retail & E-commerce
Multiple Chart
Bain
Add to my slides
Remove from favorites
Featuring horizontal bars, this slide contrasts the user base numbers in 2017 with the estimated figures for 2020E across multiple sectors, highlighting the expected growth.
Market Analysis and Trends
Retail & E-commerce
The slide indicates the projected increase in the online spender base across various sectors, with estimated growth rates suggesting a 2-3x increase, thus providing insights into consumer behavior trends.
Online spending, user base growth, sector comparison
false
Market Analysis and Trends
Retail & E-commerce
Single Chart
BCG
Add to my slides
Remove from favorites
An informative slide with numerical data displayed in a tabular form on the left and a large blue textbox on the right. The slide is visually balanced, contrasting the factual data with a persuasive textual message.
Market Analysis and Trends
Retail & E-commerce
Focuses on the factors that inspire consumer interest in new online stores, specifically the allure of unique products and good deals, as demonstrated by customer response data in various Southeast Asian countries.
online stores, consumer interest, unique products, good deals, market trends, Southeast Asia, customer data, new brands
false
Market Analysis and Trends
Retail & E-commerce
Boxed
Bain
Add to my slides
Remove from favorites
The slide is a vibrant mix of textual content and complementary visuals, including bar graphs and stylized illustrations. It's divided into segments showing statistics and user activities.
Customer and Market Segmentation
Technology & Software
It details the value derived by Australian households from conducting essential tasks and engaging in enrichment activities online, highlighting the nbn™ network's impact on their lives.
Online Tasks, Entertainment, Socializing, nbn, Value, Connectivity, Remote Work, Market Segmentation
false
Customer and Market Segmentation
Technology & Software
Mixed Chart
Accenture
Add to my slides
Remove from favorites
Features several bar graphs, a large numeric callout, and additional textual explanations. The slide is data-intensive with a focus on specific metrics.
Market Analysis and Trends
Technology & Software
Analyzes factors contributing to the increase in the number of online transactions in the SEA ecommerce market, such as internet penetration and consumer sentiment, and the impact on the ecommerce market size.
Online transactions, growth drivers, SEA, ecommerce market, bar graphs
false
Market Analysis and Trends
Technology & Software
Multiple Chart
Bain
Add to my slides
Remove from favorites
Bar chart on the left, depicting online travel GMV (Gross Merchandise Value) across three segments with forecast for 2025. Right side text describing the online travel trends, recovery signs, and the growth of online penetration.
Market Analysis and Trends
Technology & Software
Details the financial impact of COVID-19 on the online travel industry and projects future growth. Useful for investors and businesses within the online travel sector for strategic planning and understanding the pace of market recovery.
Online travel, COVID-19 impact, Market recovery, Growth projection, GMV
false
Market Analysis and Trends
Technology & Software
Mixed Chart
Bain
Add to my slides
Remove from favorites
Comprises of column charts with future projections for online travel subcategories, and bullet points explaining the data.
Market Analysis and Trends
Hospitality & Tourism
Provides a detailed outlook on the online travel industry, including expectations for recovery and growth post-pandemic. This slide is pertinent for travel industry professionals and investors for planning and strategizing around the anticipated market changes.
Online Travel, Forecast, Pandemic
false
Market Analysis and Trends
Hospitality & Tourism
Mixed Chart
Bain
Add to my slides
Remove from favorites
A column chart exhibits the SEA travel GMV ($B) across airlines, hotels, and vacation rentals. It includes growth percentages and CAGR data. The slide's blue and white theme aids in data clarity.
Market Analysis and Trends
Hospitality & Tourism
This slide offers insights into the SEA online travel industry's post-pandemic recovery, comparing segments like airlines, hotels, and vacation rentals, with predictions on future trends.
online travel, SEA, pandemic recovery, airlines, hotels, vacation rentals, CAGR, market trends
false
Market Analysis and Trends
Hospitality & Tourism
Mixed Chart
Bain
Add to my slides
Remove from favorites
The slide shows a comparison of subscriber growth between two consecutive years with a large blue circle indicating a substantial increase. Key points about market penetration, local content, and pricing innovations are provided to give insights into the strategy for SVOD services' expansion.
Market Analysis and Trends
Media & Entertainment
This slide argues that the online video sector is just beginning its growth phase, with significant potential for further expansion, particularly through deeper market penetration, a focus on local content, and innovative subscription models aimed at attracting a broader user base, including in non-metro areas.
online video, SVOD, market growth, local content, pricing innovation, subscription services, market penetration, digital strategy
false
Market Analysis and Trends
Media & Entertainment
Mixed Chart
Bain
Add to my slides
Remove from favorites
A bubble chart showing the growth and CARG (2020-2025) of different IT services, categorized by 'Run,' 'Build,' and 'Design.' Each bubble represents a service category with varying sizes indicating their market impact.
Technology and Digital Transformation
Technology & Software
This slide illustrates the transition from on-premise to cloud services, highlighting the growth rates and market sizes of different IT service categories, aiding in strategic planning for digital transformation.
On-Prem to Cloud, IT Services, Growth, Digital Transformation, Market Impact
false
Technology and Digital Transformation
Technology & Software
Single Chart
Gartner
Add to my slides
Remove from favorites
The slide includes two donut charts showing how organizations are operating (on-site vs. hybrid) and plans to restructure work locations. The design is moderately dense.
Human Resources and Talent Management
Professional Services
Explains how organizations are currently operating and their plans regarding employee work locations in 2023.
on-site, hybrid, work location, restructuring, 2023, employees
false
Human Resources and Talent Management
Professional Services
Multiple Chart
Accenture
Add to my slides
Remove from favorites
Features stacked column charts comparing the revenue of digital and physical OOH advertising from 2019 to 2025.
Market Analysis and Trends
Media & Entertainment
Analyzes the shift and growth in out-of-home advertising, emphasizing the faster recovery of digital formats.
OOH advertising, digital, physical, revenue, trends
false
Market Analysis and Trends
Media & Entertainment
Mixed Chart
PwC/Strategy&
Add to my slides
Remove from favorites
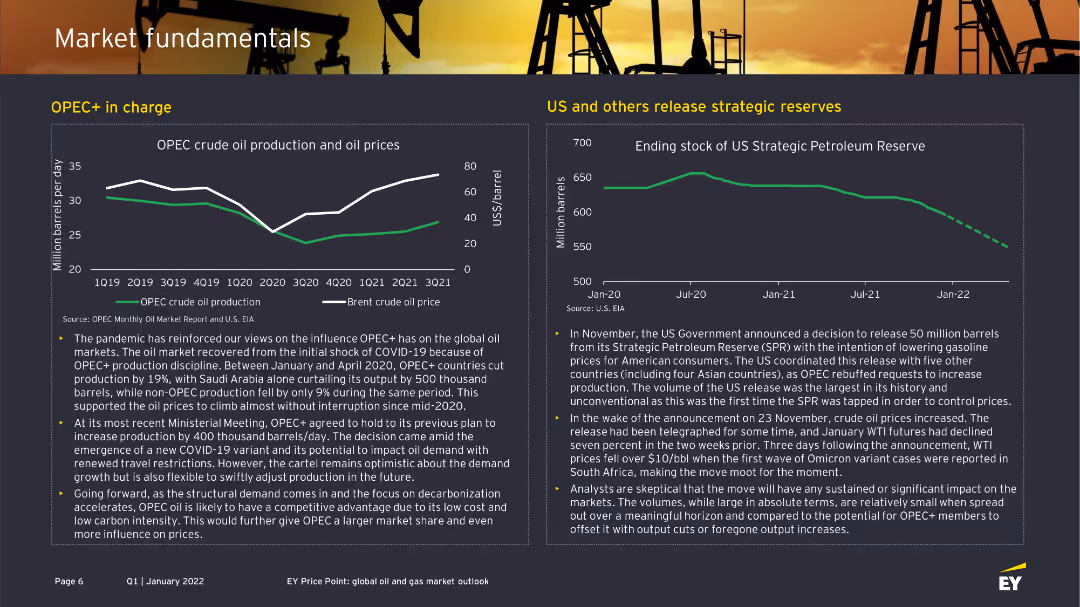
The slide is split into two main sections: one with a line chart showing OPEC crude oil production and oil prices, and the other with a line chart showing the US Strategic Petroleum Reserve. Descriptive text supports each chart.
Market Analysis and Trends
Energy & Utilities
This slide explores the influence of OPEC+ on global oil production and prices, and the US's release of its Strategic Petroleum Reserve. It discusses production cuts and the strategic reserve's impact on the market.
OPEC+, oil production, strategic reserve, US, prices
false
Market Analysis and Trends
Energy & Utilities
Multiple Chart
EY
Add to my slides
Remove from favorites
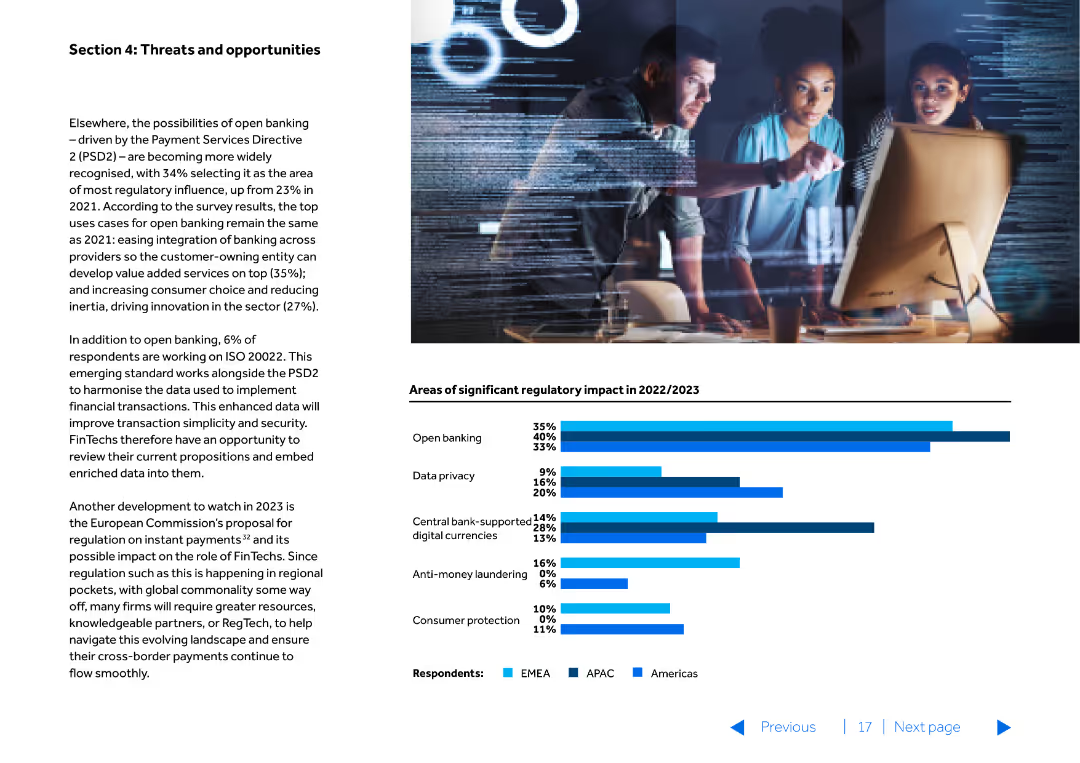
The slide has a combination of text and a bar chart at the bottom. It outlines regulatory impacts and opportunities within the financial sector, particularly focusing on open banking and data privacy.
Risk Assessment and Management
Financial Services
Identifies regulatory impacts and opportunities in the financial sector, emphasizing areas like open banking, data privacy, and central bank digital currencies.
open banking, regulatory impact, data privacy, CBDCs, opportunities
false
Risk Assessment and Management
Financial Services
Mixed Chart
Barclays
Add to my slides
Remove from favorites
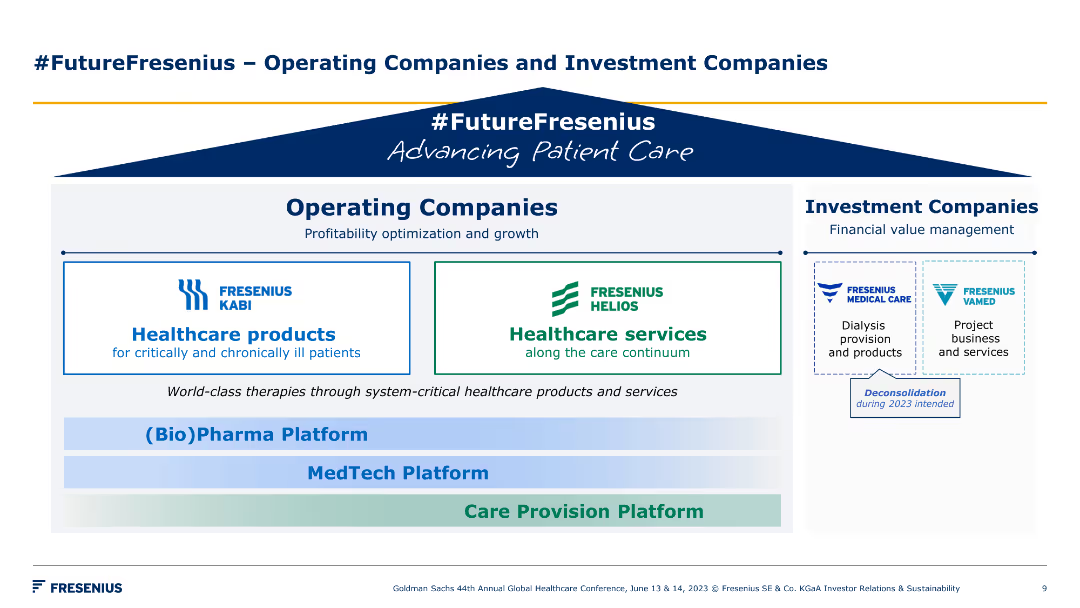
A structured diagram outlining Fresenius' operating companies and investment companies. Simple color coding distinguishes different business units and platforms.
Strategic Planning
Healthcare & Pharmaceuticals
This slide outlines the organizational structure of Fresenius, detailing the operating companies and investment platforms focused on patient care and financial management.
operating companies, investment, strategy, patient care, organizational structure, healthcare, Fresenius, platforms, growth, future
false
Strategic Planning
Healthcare & Pharmaceuticals
Diagram
Goldman Sachs
Add to my slides
Remove from favorites
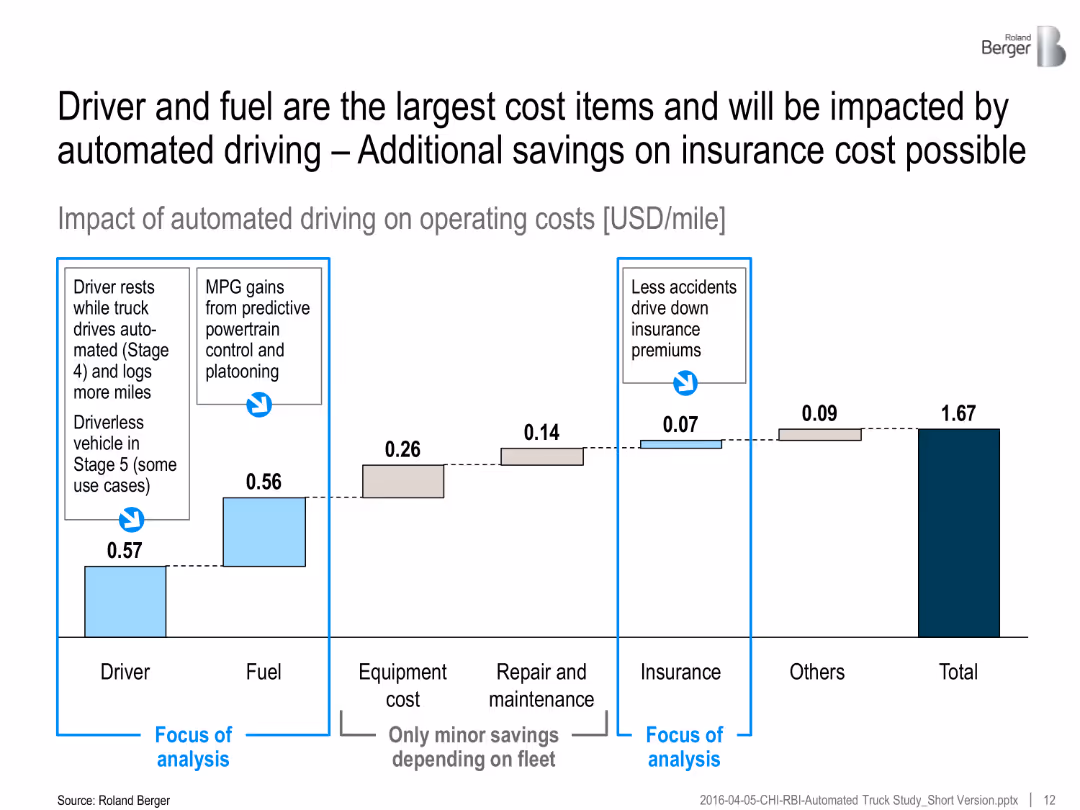
Bar chart shows operating cost savings per mile due to automation. Highlights major savings in driver and fuel costs.
Operational Efficiency
Transportation & Logistics
Automation offers significant savings in driver wages and fuel costs, with minor savings in insurance and maintenance. Total savings exceed $1.67 per mile.
operating cost, driver savings, fuel efficiency, truck automation, cost impact, insurance savings, transport economics
false
Operational Efficiency
Transportation & Logistics
Single Chart
Roland Berger
Add to my slides
Remove from favorites
Composed of multiple column charts and key financial metrics, this slide illustrates changes in operating expenses and the cost structure over several quarters and fiscal years.
Operational Efficiency
Financial Services
Discusses the management of operating costs in various business units within a financial institution, against the backdrop of inflation, highlighting effective financial control.
operating costs, expenses, inflation, FY22, FY23, financial control, Barclays, structural costs, banking
false
Operational Efficiency
Financial Services
Mixed Chart
Barclays
Add to my slides
Remove from favorites
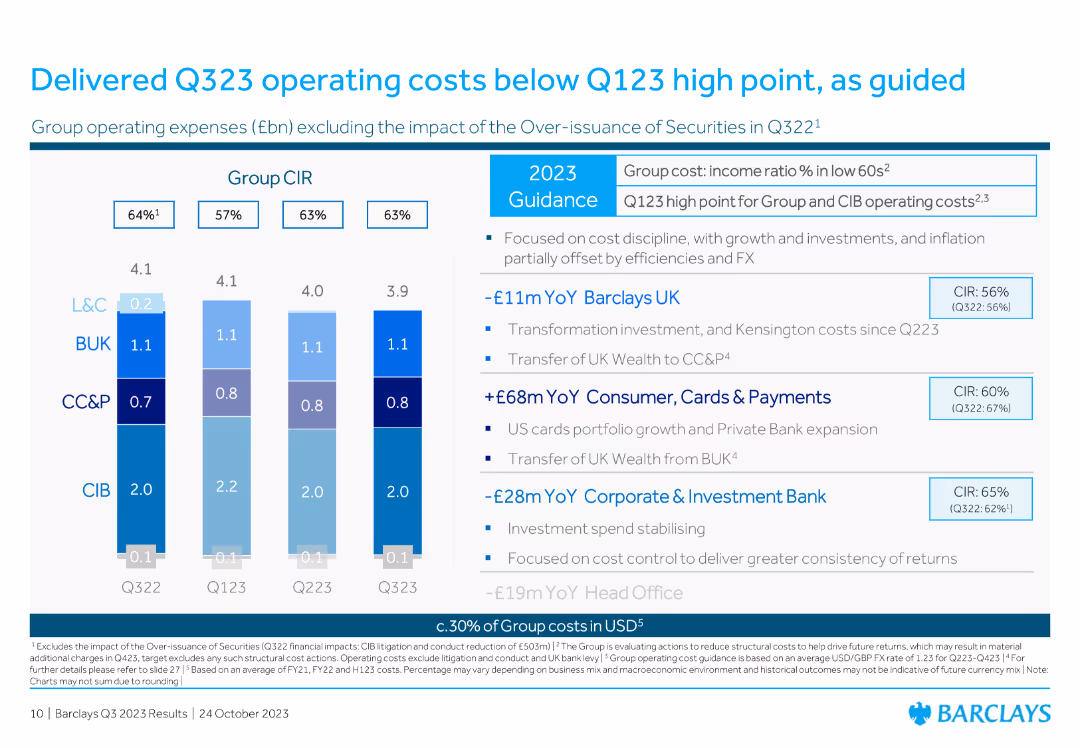
The slide contains a column chart depicting group operating expenses (£bn) excluding the impact of over-issuance of securities from Q322 to Q323. It includes details on cost reductions and operating expenses for different divisions.
Operational Efficiency
Financial Services
The slide reports that Barclays' operating costs for Q323 were below the Q123 high point, with a focus on cost discipline and detailed reductions for divisions like Barclays UK, CC&P, and Corporate & Investment Bank.
operating costs, Q323, cost discipline, reductions, divisions
false
Operational Efficiency
Financial Services
Mixed Chart
Barclays
Add to my slides
Remove from favorites
This slide comprises column chart comparing efficiency ratios, a detailed table of financial results, and a list of highlights. It has a moderate level of visual complexity with a structured layout.
Operational Efficiency
Financial Services
Discusses the company’s expenses in various categories and highlights efficiency ratios. This type of slide is valuable in operational reviews, financial planning, or stakeholder meetings for insight into cost management and identifying areas for efficiency improvements.
Operating Expenses, Compensation, Efficiency Ratio, Tax Rate
false
Operational Efficiency
Financial Services
Mixed Chart
Goldman Sachs
Add to my slides
Remove from favorites
The slide shows a column chart illustrating operating expenses progression in USD mn from 3Q16 to 2019 targets, with simple color coding.
Operational Efficiency
Financial Services
The slide highlights the track to reduce quarterly expenses to approximately USD 110 mn by 4Q19, showing the ambition levels for 2018 and 2019.
operating expenses, cost reduction, expense progression, financial targets, operational efficiency
false
Operational Efficiency
Financial Services
Single Chart
Credit Suisse
Add to my slides
Remove from favorites
The slide features a vertical column chart showing operating expenses for 3Q23, highlighting a reduction.
Operational Efficiency
Financial Services
This slide details the operating expenses for Q3 2023, emphasizing a decrease compared to previous quarters.
operating expenses, cost reduction, financial performance, Q3 2023, efficiency
false
Operational Efficiency
Financial Services
Mixed Chart
UBS
Add to my slides
Remove from favorites
A column chart illustrating the reduction in operating expenses in millions, with percentage changes and explanatory side notes.
Operational Efficiency
Financial Services
The slide discusses the execution of cost-reduction strategies, resulting in a 5% decrease in underlying operating expenses quarter-over-quarter.
operating expenses, cost reduction, QoQ, efficiency, financial strategy
false
Operational Efficiency
Financial Services
Mixed Chart
UBS
Add to my slides
Remove from favorites
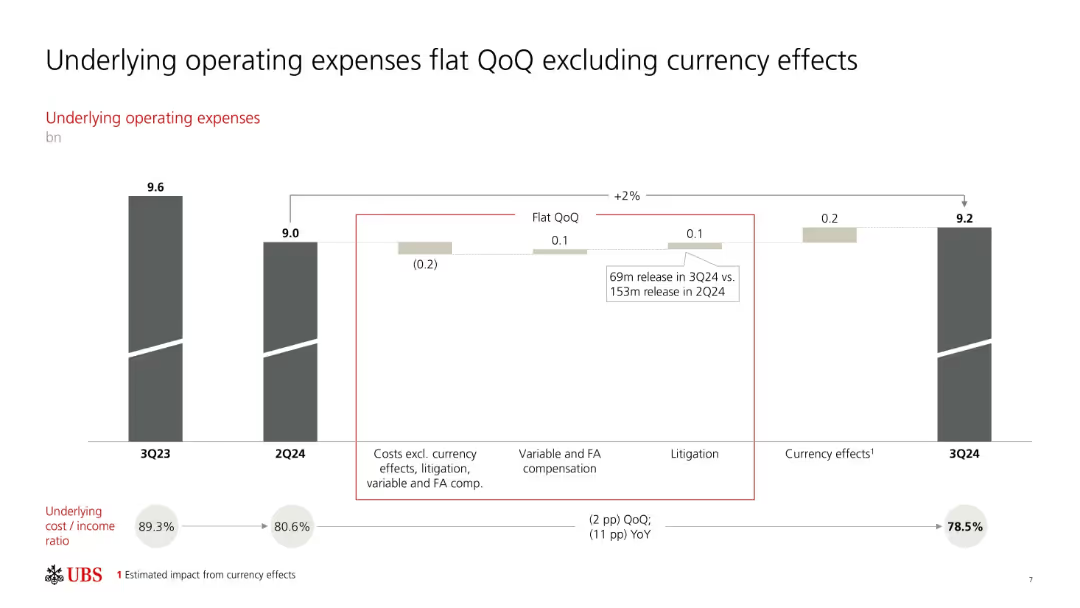
Waterfall chart showing changes in underlying operating expenses with callouts; cost/income ratio noted.
Operational Efficiency
Financial Services
Illustrates that operating expenses remained flat quarter-over-quarter, with a slight increase due to currency effects. Components like litigation and compensation are broken down. Cost/income ratio improved significantly.
operating expenses, currency effects, cost/income ratio, litigation, UBS
false
Operational Efficiency
Financial Services
Single Chart
UBS
Add to my slides
Remove from favorites
Column charts depicting operating expenses over three years, alongside metrics on digital transformation and branch closures.
Operational Efficiency
Financial Services
Details the reduction in operating expenses and highlights initiatives in digital transformation and efficiency improvements.
Operating expenses, digital transformation, efficiency, branch closures, expenses reduction
false
Operational Efficiency
Financial Services
Multiple Chart
Credit Suisse
Add to my slides
Remove from favorites
Column chart showing changes in operating expenses from 9M21 to 9M22 with text explanations of cost factors.
Financial Performance
Financial Services
Highlights the operating expenses over a period, detailing components like FX, litigation, and variable compensation.
Operating expenses, FX, litigation, variable compensation, 9M22, cost strategy, financial performance, UBS
false
Financial Performance
Financial Services
Mixed Chart
UBS
Add to my slides
Remove from favorites
The slide features three column charts showing adjusted revenues, operating expenses, and pre-tax loss progression over several quarters. Text details the strategies and outcomes related to operating expense reductions and portfolio valuation risks.
Financial Performance
Financial Services
Explains the improvement in adjusted pre-tax loss through the reduction of operating expenses and portfolio valuation risks. The column charts show the financial progression across quarters, supported by text that details the specific strategies implemented and their impact on financial performance.
Operating Expenses, Portfolio, Risk, Financial Performance, Reduction
false
Financial Performance
Financial Services
Multiple Chart
Credit Suisse
Add to my slides
Remove from favorites
Slide with a column chart depicting underlying operating expenses for 4Q23, including annotations on specific expense categories.
Financial Performance
Financial Services
The slide outlines UBS's underlying operating expenses for 4Q23, showing a 1% increase quarter-on-quarter and detailing major expenses.
operating expenses, quarterly increase, expense categories, UBS cost management
false
Financial Performance
Financial Services
Mixed Chart
UBS
Add to my slides
Remove from favorites
A column chart representing income statements for various operating groups, paired with a text block describing key drivers. The layout is clean with contrasting colors for easy differentiation.
Financial Performance
Financial Services
Evaluates financial performance by operating group, highlighting contributions and key factors driving results. It is used to understand divisional performance within the overall corporate structure.
Operating Groups, Financial Performance, Net Profit Contribution, Key Drivers, Analysis
false
Financial Performance
Financial Services
Mixed Chart
Goldman Sachs
Add to my slides
Remove from favorites
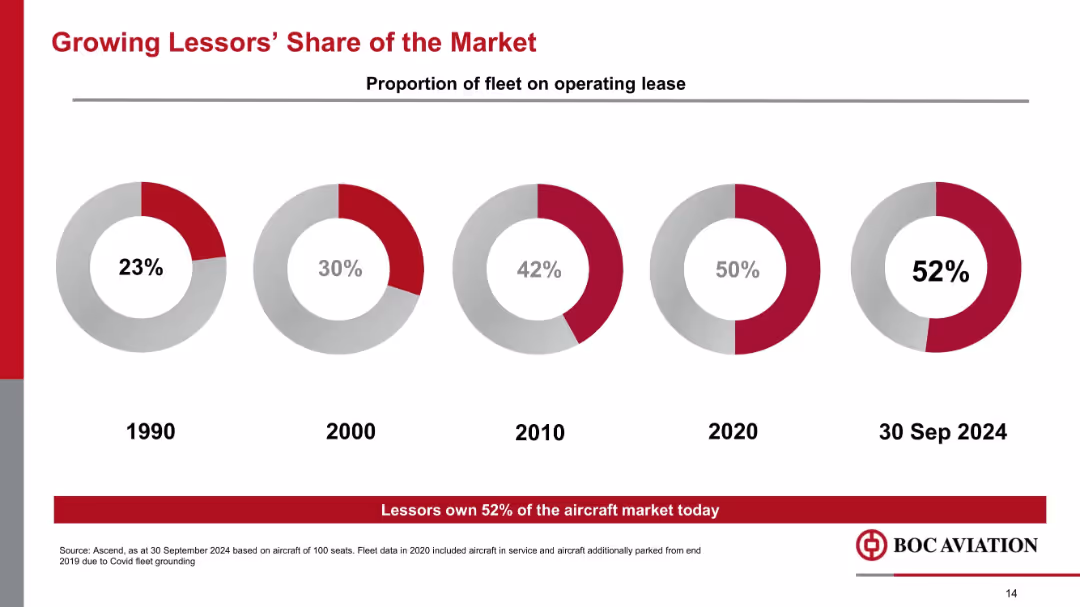
Donut chart progression showing operating lease share from 1990 to Sep 2024, with 52% share noted for 2024.
Market Analysis and Trends
Transportation & Logistics
The slide tracks the increasing dominance of aircraft lessors, whose market share of operating leases has risen from 23% in 1990 to 52% in 2024. It signals structural changes in how airlines manage fleet financing.
operating lease, lessors, fleet management, market share, leasing trend, aviation finance
false
Market Analysis and Trends
Transportation & Logistics
Mixed Chart
Goldman Sachs
Add to my slides
Remove from favorites
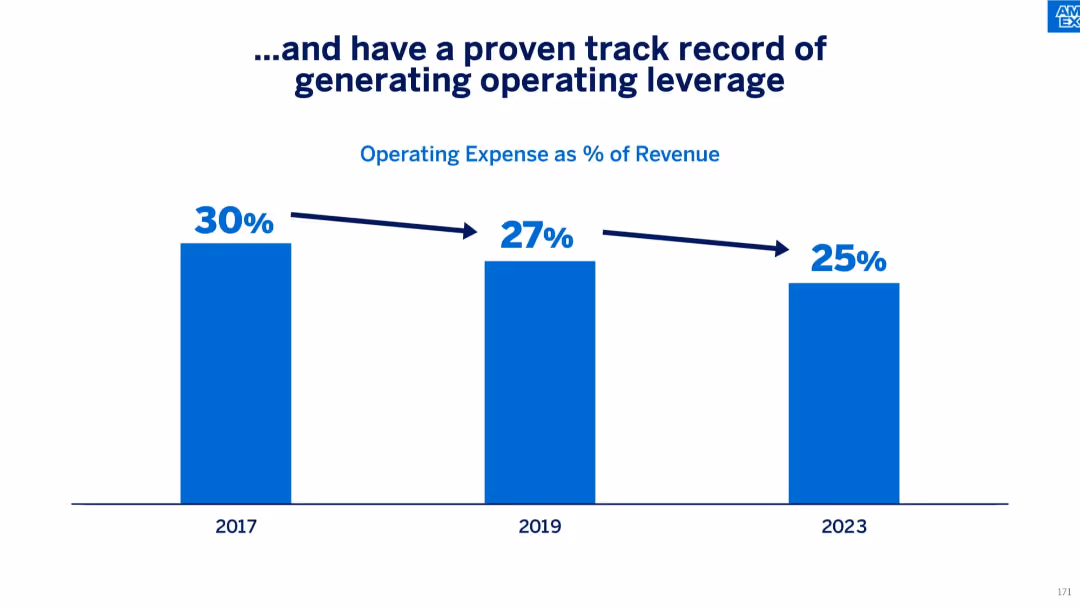
Bar chart showing operating expense as % of revenue in 2017, 2019, and 2023
Operational Efficiency
Financial Services
Highlights a declining trend in operating expenses as a percentage of revenue, dropping from 30% in 2017 to 25% in 2023. Indicates improved operational efficiency and cost discipline over time.
operating leverage, cost efficiency, expense management, revenue optimization, trend analysis
false
Operational Efficiency
Financial Services
Single Chart
McKinsey
Add to my slides
Remove from favorites
Features two sets of column charts, one showing the reduction in total expenses per account and the other showing productivity across business segments. The slide includes iconographic elements for context.
Operational Efficiency
Financial Services
Showcasing JP Morgan Chase & Co.'s operational efficiencies and cost management, this slide visualizes reductions in expenses and improvements in productivity, likely used in operational reviews and strategy discussions.
operating leverage, cost management, productivity improvements, operational efficiency, JP Morgan Chase, strategy discussions
false
Operational Efficiency
Financial Services
Multiple Chart
JP Morgan
Add to my slides
Remove from favorites
A line graph correlating TCE increases with EBITDA gains, alongside a column chart of yearly EBITDA, illustrating financial leverage across a fleet.
Operational Efficiency
Transportation & Logistics
Demonstrates how adjustments in freight charge rates substantially affect annual earnings, providing insights into strategic financial management.
operating leverage, EBITDA, financial management, freight rates, strategic planning
false
Operational Efficiency
Transportation & Logistics
Multiple Chart
Deutsche Bank
Add to my slides
Remove from favorites
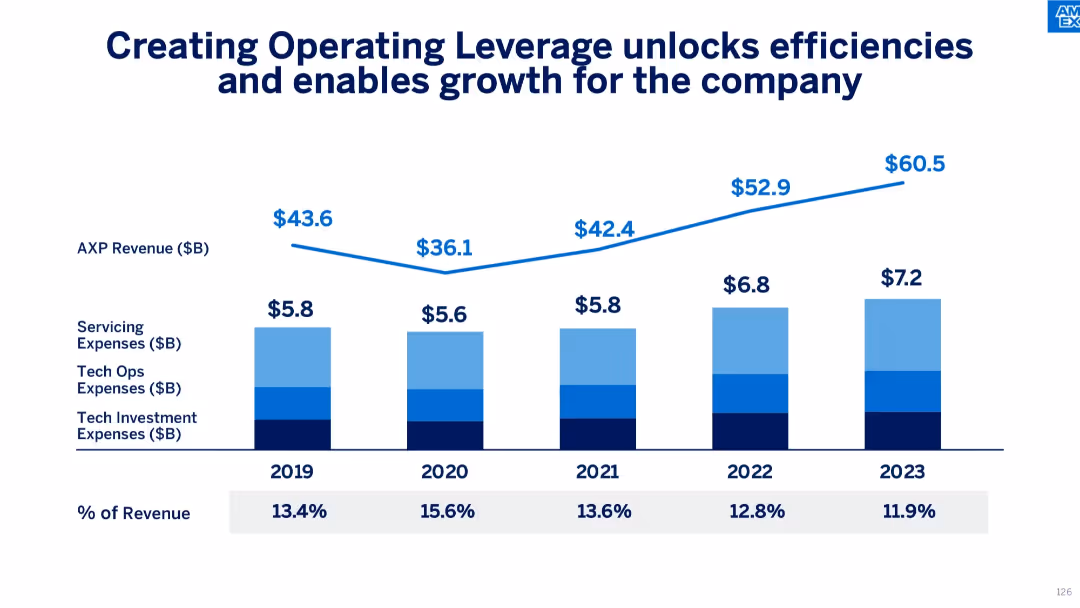
Vertical bar chart over five years showing revenue and expenses with percentage of revenue annotated.
Operational Efficiency
Financial Services
This slide highlights how operating leverage is improving efficiency at Amex. Despite increasing tech and servicing expenses, the percentage of revenue spent has declined, showcasing better cost management and scalable growth.
operating leverage, expenses, revenue, tech investment, financial efficiency, Amex performance, cost control
false
Operational Efficiency
Financial Services
Single Chart
McKinsey
Add to my slides
Remove from favorites
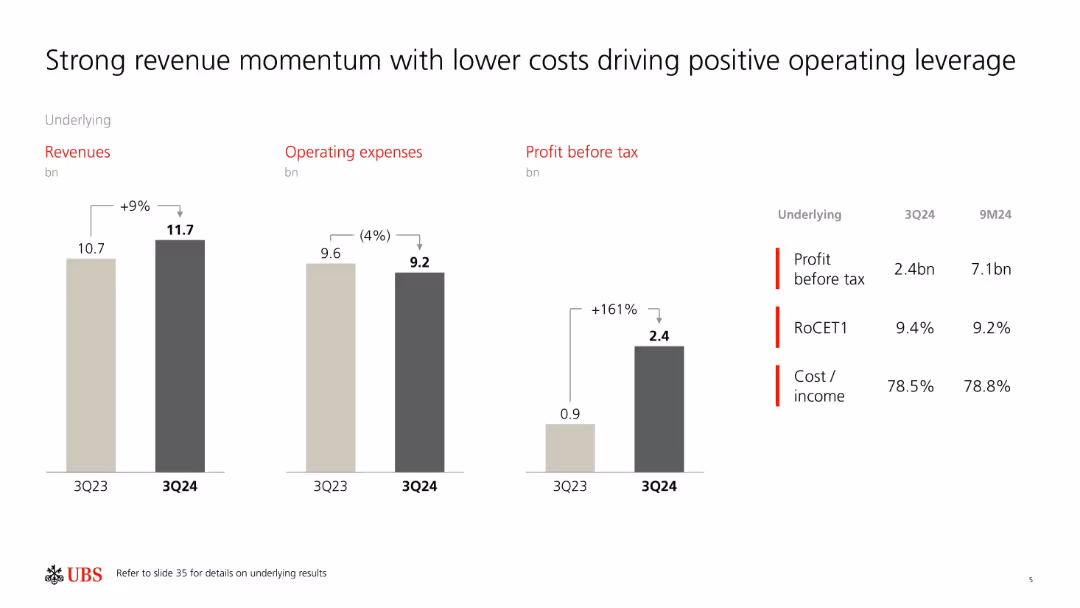
Three-bar clusters showing YoY changes in revenue, expenses, and profit; supporting KPIs listed on right.
Performance Metrics and KPIs
Financial Services
This slide illustrates UBS’s performance in 3Q24 with strong revenue growth (+9%), cost reduction (-4%), and a 161% increase in profit before tax. Key metrics like RoCET1 and cost/income ratio underscore the bank’s improved efficiency and profitability.
operating leverage, profit growth, RoCET1, UBS, revenue, cost management, KPIs, financial performance
false
Performance Metrics and KPIs
Financial Services
Single Chart
UBS
Add to my slides
Remove from favorites
Slide includes a table with different metrics like 'Revenue' and 'Expense' plotted over three years, supplemented with trend arrows and brief annotations.
Operational Efficiency
Financial Services
JP Morgan's improvement in operating leverage over time is conveyed, highlighting investment, expense, and headcount trends. It's designed for financial analysis and illustrating efficiency improvements to investors or analysts.
Operating Leverage, Revenue, Expense, Efficiency, Investment
false
Operational Efficiency
Financial Services
Table
JP Morgan
Add to my slides
Remove from favorites
Bar chart detailing the changes in operating margin from FY 2021 to FY 2022, with factors such as COVID-19 impact, gross margin, payroll, and overheads contributing to the changes.
Financial Performance
Financial Services
The slide analyzes the change in operating margin over a year, breaking down the contributing factors and showing net gains and losses from various impacts like COVID-19 and payroll adjustments.
operating margin, financial analysis, COVID-19 impact, payroll, overheads
false
Financial Performance
Financial Services
Multiple Chart
IPSOS
Add to my slides
Remove from favorites
The slide features a column chart showing the growth in operating margin over several years, depicted in varying shades of pink, with the year marked below each column.
Financial Performance
Consumer Goods
This slide illustrates L'Oréal's increasing operating margin over the years, demonstrating their consistent financial growth and successful business model.
operating margin, financial growth, L'Oréal, business model
false
Financial Performance
Consumer Goods
Single Chart
Deutsche Bank
Add to my slides
Remove from favorites
Two-column layout with a column chart on the left showing half-year operating margins and a comparison with full-year margins on the right. Uses callouts for emphasis.
Financial Performance
Financial Services
Compares half-year and full-year operating margins from 2017 to 2023, showing a return to historical performance patterns with stronger H2 results.
operating margin, historical pattern, financials, H1, H2
false
Financial Performance
Financial Services
Multiple Chart
IPSOS
Add to my slides
Remove from favorites
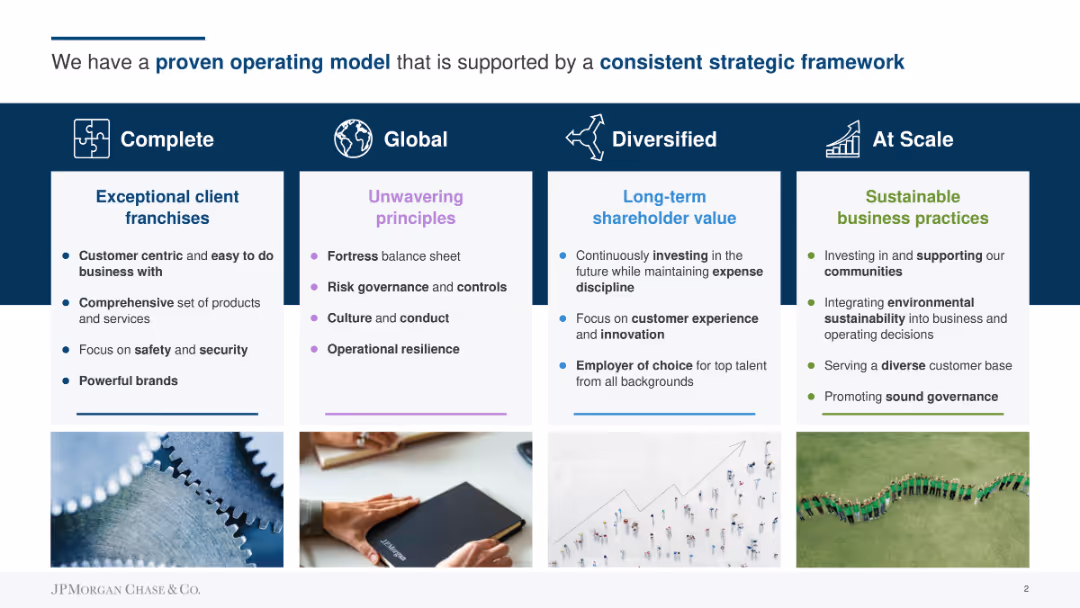
Four columns with text and icons, highlighting key aspects of the operating model: Complete, Global, Diversified, At Scale.
Strategic Planning
Professional Services
Describes the company's strategic framework focusing on exceptional client franchises, unwavering principles, long-term shareholder value, and sustainable practices.
operating model, strategy, client franchises, principles, shareholder value, sustainability
false
Strategic Planning
Professional Services
Pillar
JP Morgan
Add to my slides
Remove from favorites
Includes a table comparing medium-term trends across different financial sectors, with icons indicating trend directions and notes on the side.
Market Analysis and Trends
Financial Services
Used to compare medium-term revenue trends and market forecasts for strategic planning or investment guidance.
Operating Outlook, Organic Revenue, Margin Trend, ROIC, Financial Sectors, Forecasting
false
Market Analysis and Trends
Financial Services
Table
Goldman Sachs
Add to my slides
Remove from favorites
This slide presents a three-pillar plan with icons and text in a horizontal layout. Each pillar has a different icon—chart, gear, and mobile phone—representing operating performance, capital allocation, and digitalisation respectively. The slide is visually simple, with a grey and blue color palette and uses the Santander logo at the top. The slide footer includes a confidentiality notice and a slide number.
Strategic Planning
Financial Services
The slide outlines Santander's strategic approach for growth, focusing on operational efficiency, optimal capital distribution, and accelerating digital transformation. This would be relevant in strategic planning meetings or stakeholder briefings to discuss future directions and priorities.
Operating Performance, Capital Allocation, Digitalisation, Santander, Strategic Growth, Profitability, Banking Strategy, Financial Services
false
Strategic Planning
Financial Services
Pillar
Morgan Stanley
Add to my slides
Remove from favorites
Contains two column charts comparing operating profit by region, by division, and over time with annotations for specific changes in percentages.
Financial Performance
Consumer Goods
Analyzes L'Oréal's operating profit across different regions and divisions, highlighting areas of strength and improvement in profitability.
operating profit, profitability analysis, L'Oréal, financial analysis
false
Financial Performance
Consumer Goods
Multiple Chart
Deutsche Bank
Add to my slides
Remove from favorites
Contains bar charts comparing practices of high- vs. low-outcome organizations. Uses shades of green.
Operational Efficiency
Technology & Software
Focuses on AI operational best practices and their impact on organizational outcomes, detailing specific strategies like ROI tracking and AI model lifecycle strategies.
operational, AI, practices, outcomes, strategies
false
Operational Efficiency
Technology & Software
Mixed Chart
Deloitte
Add to my slides
Remove from favorites
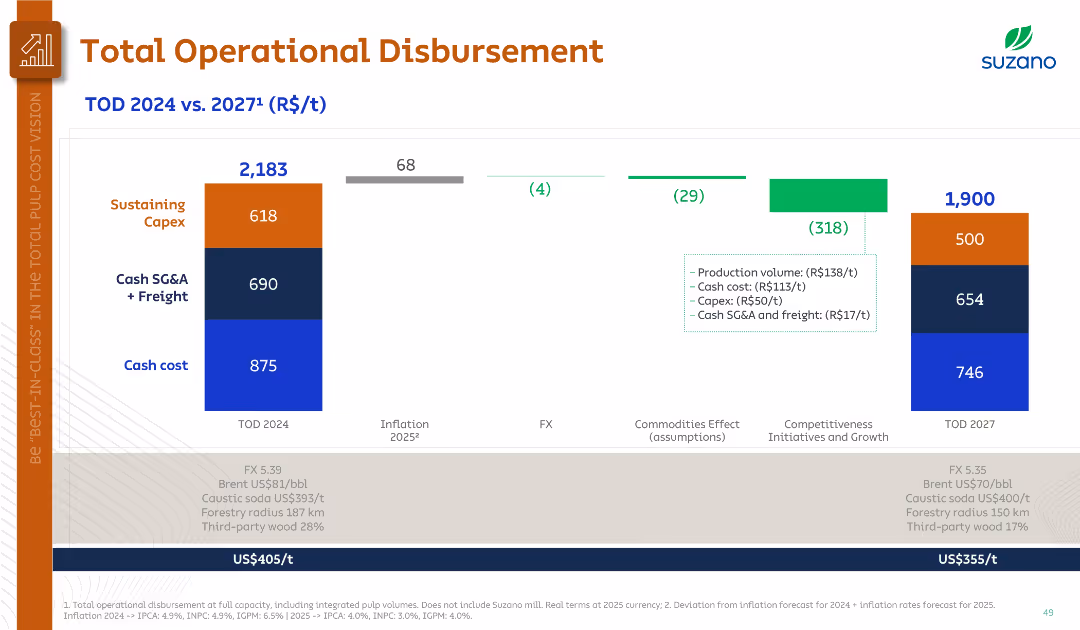
Stacked bar chart with R$/t cost components for 2024 and 2027, including effect categories (FX, inflation, etc.).
Financial Performance
Industrial & Manufacturing
Breaks down total operational disbursement per ton from 2024 to 2027, showing cost reductions across capex, SG&A, and cash costs. Highlights gains from competitiveness initiatives and market assumptions like FX and commodity pricing.
operational cost, capex, SG&A, cost reduction, pulp, Suzano
false
Financial Performance
Industrial & Manufacturing
Single Chart
Goldman Sachs
Add to my slides
Remove from favorites
This slide features a line chart showing operational demand data across different scenarios, with a simple white background and minimal text explanations.
Market Analysis and Trends
Energy & Utilities
Presents data on operational demand scenarios for the NEM from AEMO’s 2019 Input, highlighting the model's approach and predictions over various timelines.
operational demand, NEM, AEMO, scenarios, energy, utilities, line chart
false
Market Analysis and Trends
Energy & Utilities
Mixed Chart
EY
Add to my slides
Remove from favorites
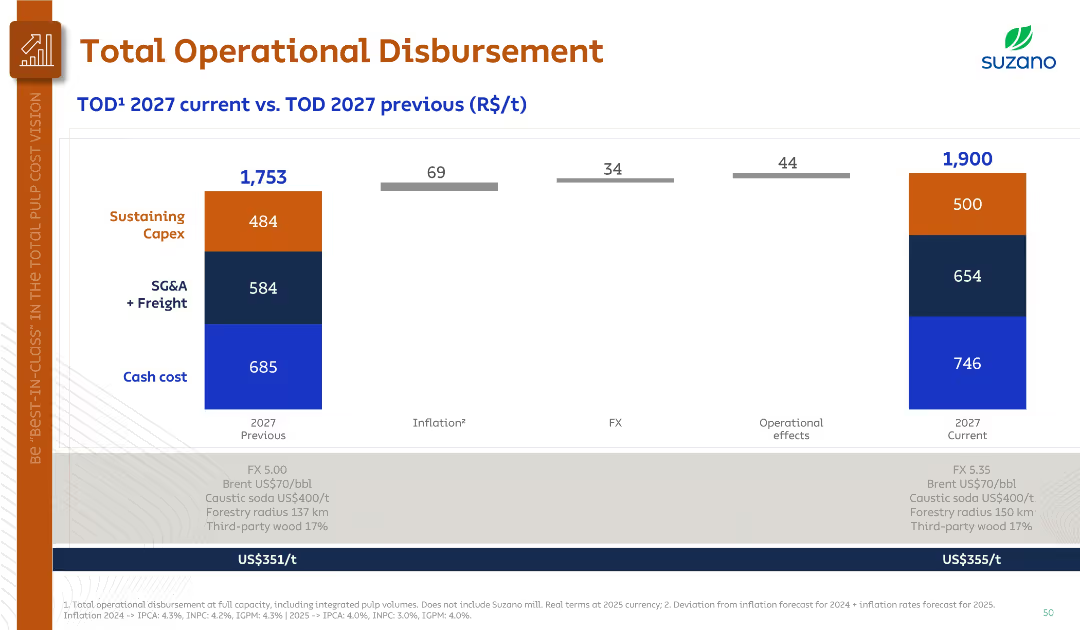
Bar chart comparison of 2027 previous vs. current estimates, with inflation, FX, and operational effects marked.
Financial Performance
Industrial & Manufacturing
Compares prior and current 2027 operational disbursement forecasts, showing increased cost due to inflation and FX despite prior lower projections. Updated inputs like FX 5.35 and adjusted Brent and caustic soda prices are noted.
operational disbursement, 2027 forecast, inflation, FX, cost comparison
false
Financial Performance
Industrial & Manufacturing
Single Chart
Goldman Sachs
Add to my slides
Remove from favorites
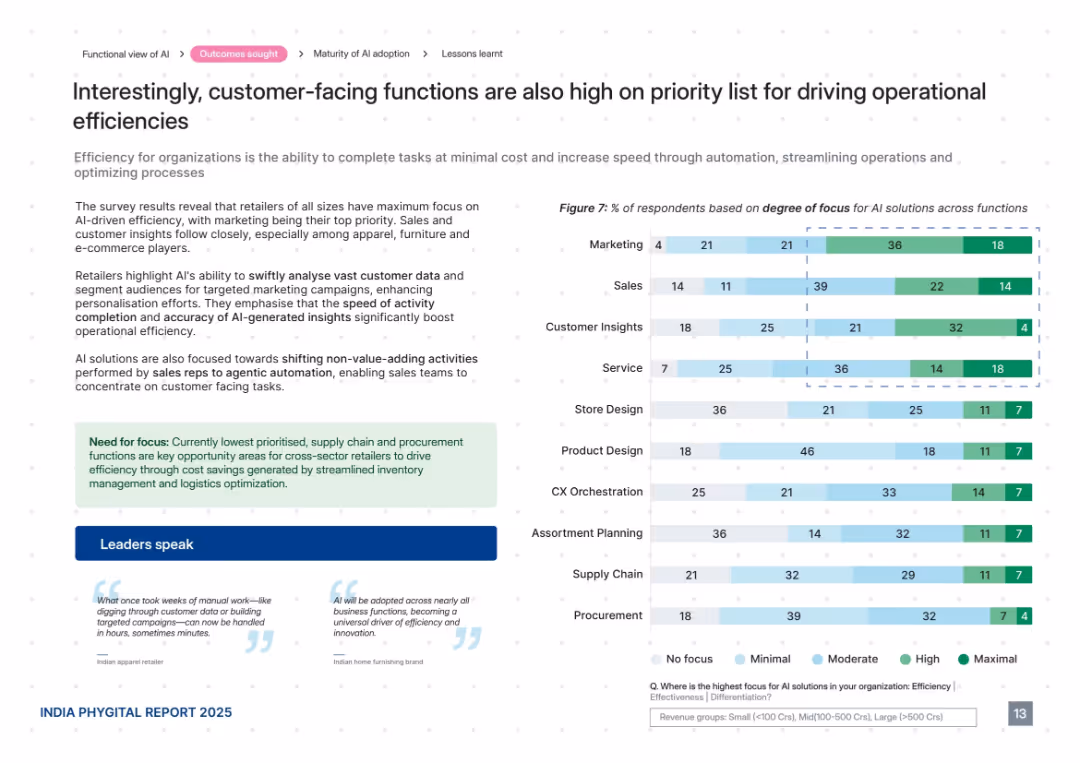
Similar structure to previous slide. Includes a bar graph with stacked categories, explanatory text, and leader quotes. Green-highlighted callout box on left.
Operational Efficiency
Retail & E-commerce
This slide emphasizes that AI in retail is being used to drive operational efficiency through marketing, sales, and customer insights. It underscores the ability of AI to automate tasks, streamline operations, and optimize customer targeting. Functions like procurement and supply chain are noted as untapped efficiency opportunities.
operational efficiency, AI, retail, automation, supply chain, marketing, sales, cost savings, segmentation
false
Operational Efficiency
Retail & E-commerce
Mixed Chart
PwC/Strategy&
Add to my slides
Remove from favorites
Diagram listing the top 10 levers for operational efficiency, including product portfolio, R&D, procurement, production, logistics, sales & marketing, and service & after-sales.
Strategic Planning
Financial Services
The slide presents the top 10 operational efficiency levers for 2019, focusing on key areas such as cost improvement in the product portfolio, material cost reduction, and production efficiency. It highlights the strategic initiatives that companies are prioritizing to enhance their competitiveness and operational performance.
Operational Efficiency, Cost Improvement, 2019
false
Strategic Planning
Financial Services
Table
Roland Berger
Add to my slides
Remove from favorites
Bar and column charts, text breakdown, three-column layout.
Operational Efficiency
Financial Services
Operational cost breakdown and efficiency for 2021 and 2022, with outlook for 2023.
Operational, efficiency, cost, investments, overhead, revenue, structure, banking
false
Operational Efficiency
Financial Services
Single Chart
JP Morgan
Add to my slides
Remove from favorites
Bar and column charts comparing current costs and future goals with benchmarks.
Operational Efficiency
Financial Services
Compares current operational costs to future goals and industry benchmarks.
operational efficiency, costs, benchmarks, future goals
false
Operational Efficiency
Financial Services
Mixed Chart
Barclays
Add to my slides
Remove from favorites
This slide includes column charts comparing operational costs and volumes in various financial services from 2017 to 2022.
Operational Efficiency
Financial Services
Highlights JP Morgan's operational efficiency gains in key areas like cash payments, equities trading, and fund services over five years. It showcases how strategic operational management has enabled them to handle significant volume growth without proportionate increases in costs.
operational, efficiency, cost, volume
false
Operational Efficiency
Financial Services
Mixed Chart
JP Morgan
Add to my slides
Remove from favorites
This slide contains column charts and infographics depicting the operational efficiencies achieved by investing in digitization and automation. The design is clean, with icons that help explain the concepts discussed, such as AI digital assistants and modernized operations platforms.
Operational Efficiency
Financial Services
Illustrates Barclays' efforts to improve operational efficiency through digital transformation and automation, detailing the impact on cost reduction and enhanced customer service.
operational efficiency, digitization, automation, cost reduction
false
Operational Efficiency
Financial Services
Multiple Chart
Barclays
Add to my slides
Remove from favorites
This slide includes multiple triangular diagrams illustrating the impact of technology, process, data, and talent on operational maturity. The visuals are effectively used to compare the influence of each factor.
Strategic Planning
Professional Services
Highlights how different operational levers affect the maturity and efficiency of business operations. Essential for strategic decision-making and resource allocation in organizational development.
Operational Efficiency, Maturity Levels, Strategy
false
Strategic Planning
Professional Services
Mixed Chart
Accenture
Add to my slides
Remove from favorites
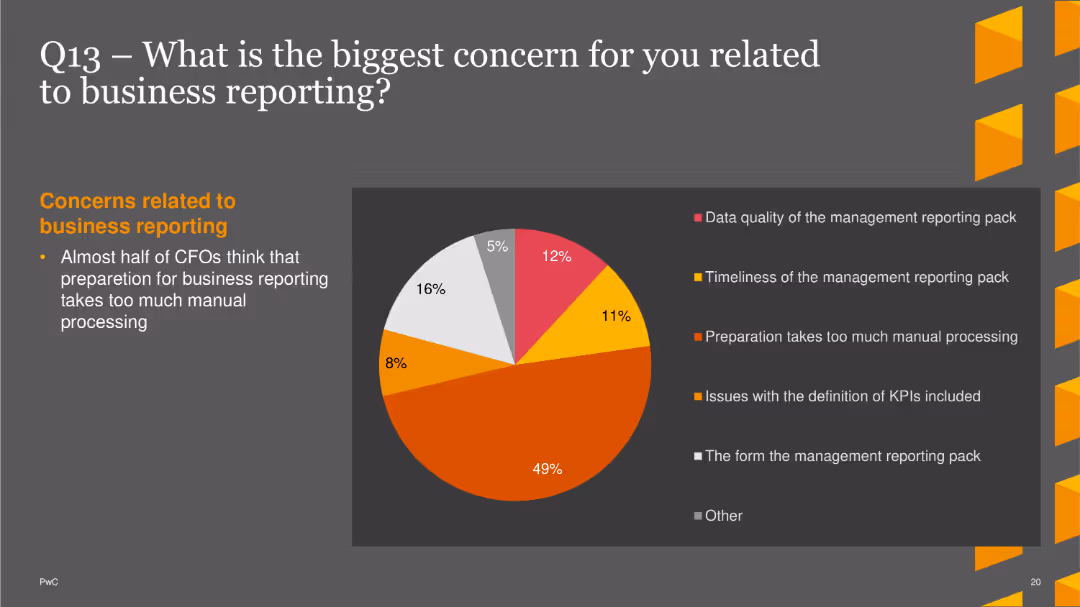
A pie chart showing the percentage of resources that could be saved by improving closing procedures. Segments represent different levels of potential savings
Operational Efficiency
Financial Services
This slide explores CFO opinions on the potential resource savings from more effective closing procedures, with different percentages of potential savings.
operational efficiency, resource savings, closing procedures, CFO opinions, effectiveness
false
Operational Efficiency
Financial Services
Single Chart
PwC/Strategy&
Add to my slides
Remove from favorites
Bar chart showing various categories of government operational expenditures, including personnel, services, and interest payments. The values are provided alongside each bar.
Financial Performance
Government & Public Sector
Slide breaks down the operational expenditure of the government, useful for understanding where funds are allocated within different administrative areas.
operational expenditure, government budget, financial analysis
false
Financial Performance
Government & Public Sector
Single Chart
PwC/Strategy&
Add to my slides
Remove from favorites
Presents a bar chart categorizing various government operational expenditures such as personnel, subsidies, and interest payments, with monetary values in NS '000.
Regulatory and Compliance
Government & Public Sector
Details operational expenditure categories within the government, essential for financial management and planning, focusing on personnel and interest payments as major expenses.
operational, expenditure, government, financial planning, analysis, personnel, subsidies, interest payments, table, management
false
Regulatory and Compliance
Government & Public Sector
Single Chart
PwC/Strategy&
Add to my slides
Remove from favorites
The slide displays a detailed breakdown of operational expenditure in different categories such as Personnel Expenditure, Goods and Services, and Interest Payments, represented through a bar chart. Each category is color-coded, and the values are clearly annotated.
Operational Efficiency
Government & Public Sector
This slide details the operational expenditures of the Namibian government, breaking down costs into specific categories like personnel and services, which is crucial for analyzing government spending efficiency and budget allocation.
operational expenditure, government spending, fiscal analysis
false
Operational Efficiency
Government & Public Sector
Single Chart
PwC/Strategy&
Add to my slides
Remove from favorites
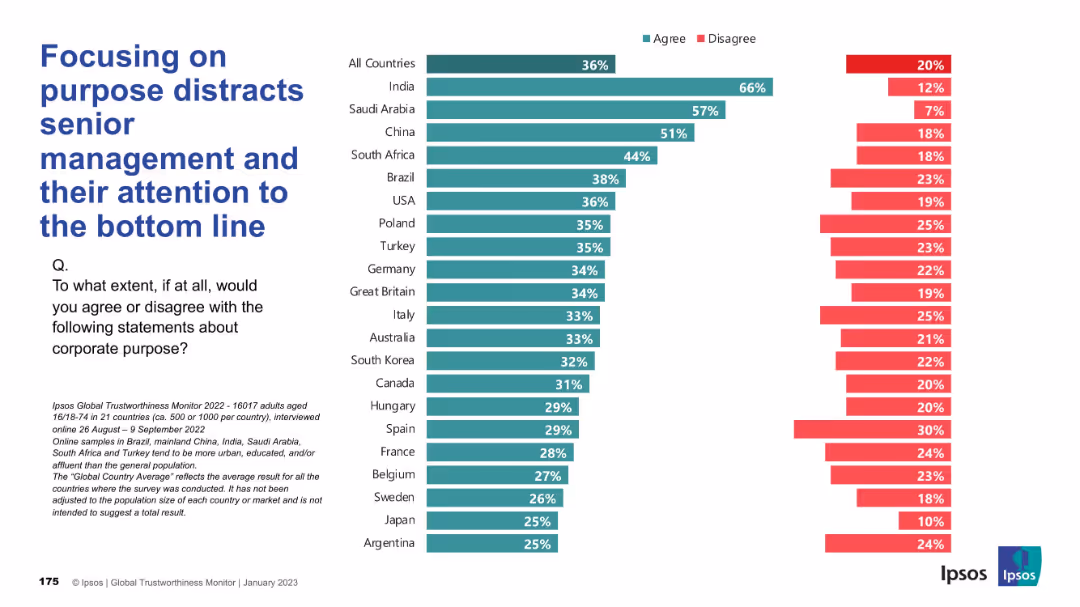
Standard Ipsos layout with ranked country responses; agree/disagree distribution displayed clearly; question and title on the left, with Ipsos citation below.
Operational Efficiency
Financial Services
This slide evaluates the belief that emphasizing purpose detracts from business efficiency. Global agreement is moderate, with India and Saudi Arabia expressing stronger belief in distraction due to purpose-centric focus.
operational focus, corporate purpose, distraction, senior management, Ipsos, efficiency, business strategy
false
Operational Efficiency
Financial Services
Mixed Chart
IPSOS
Add to my slides
Remove from favorites
Contains bullet points summarizing operational highlights and growth strategies, accompanied by a column chart of revenue growth with recurring and non-recurring figures.
Strategic Planning
Technology & Software
Likely serves as an executive summary, detailing key strategies and financial growth for a company.
Operational, Growth, Strategy, Revenue, Recurring, Non-recurring, Highlights, Financial
false
Strategic Planning
Technology & Software
Mixed Chart
Goldman Sachs
Add to my slides
Remove from favorites
Displays a multi-layered diagram categorizing operational maturity into four levels: Stable, Efficient, Predictive, and Future-ready. Each level is described with respect to technology, process, data, and talent.
Operational Efficiency
Professional Services
Describes different levels of operational maturity in organizations and their implications on business efficiency and future readiness. Useful for consultants and managers aiming to enhance operational strategies.
Operational Maturity, Business Strategy, Efficiency
false
Operational Efficiency
Professional Services
Table
Accenture
Add to my slides
Remove from favorites
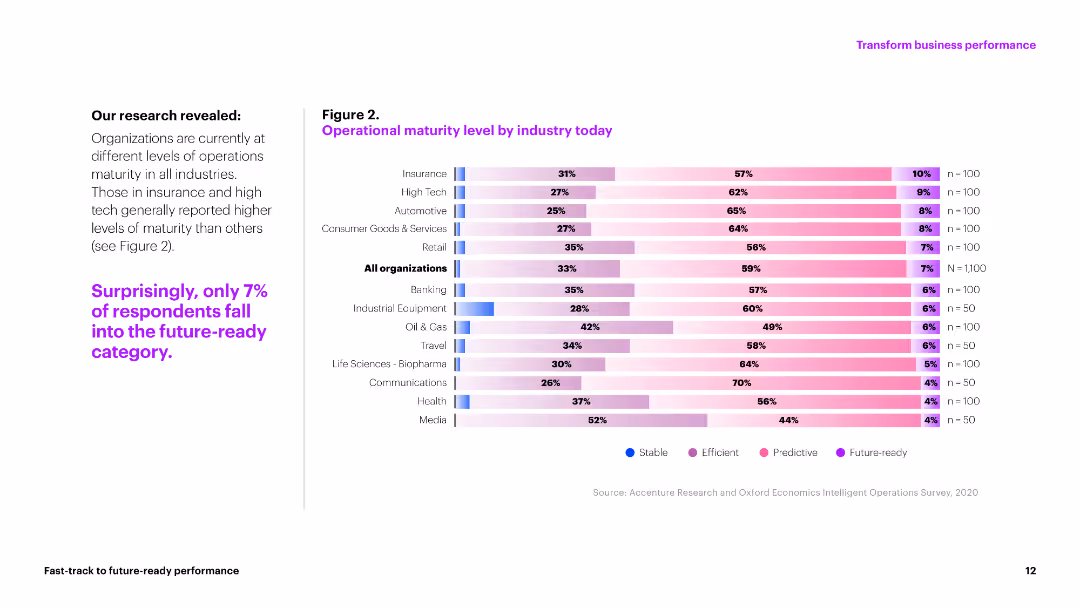
A column chart showing operational maturity levels across various industries, with detailed text explanations.
Market Analysis and Trends
Technology & Software
This slide presents data on the operational maturity levels of different industries, indicating areas of stability, efficiency, and readiness.
operational maturity, industry analysis, stability, efficiency, future-ready
false
Market Analysis and Trends
Technology & Software
Mixed Chart
Accenture
Add to my slides
Remove from favorites
A content slide with text on the left and a column chart on the right. The chart shows important skill sets required over the next five years.
Operational Efficiency
Financial Services
The slide focuses on the importance of operational resilience and business continuity, discussing key skill sets needed for future risk management.
operational resilience, business continuity, skills, future, risk management
false
Operational Efficiency
Financial Services
Mixed Chart
EY
Add to my slides
Remove from favorites
The slide includes multiple column charts showing priorities for operational resilience enhancements over the next three years, categorized by overall, G-SIB, and non-G-SIB responses.
Operational Efficiency
Financial Services
The slide outlines various priorities for operational resilience enhancements, highlighting differences between G-SIBs and non-G-SIBs, such as cybersecurity controls and technology capacity.
operational resilience, column charts, G-SIB, non-G-SIB
false
Operational Efficiency
Financial Services
Multiple Chart
EY
Add to my slides
Remove from favorites
The slide features column charts depicting additional operational resilience requirements expected from regulators in the next two years. The layout is clear with well-labeled charts.
Regulatory and Compliance
Financial Services
It presents data on expected additional requirements from regulators, including higher standards for cybersecurity, data protection, and monitoring critical third-party service providers.
operational resilience, regulators, column charts
false
Regulatory and Compliance
Financial Services
Multiple Chart
EY
Add to my slides
Remove from favorites
Image of a man working on a laptop. Column chart illustrating additional operational resilience requirements expected from regulators in the next two years.
Regulatory and Compliance
Financial Services
This slide highlights additional operational resilience requirements expected from regulators, such as higher standards for monitoring critical third-party service providers and heightened oversight expectations. It underscores the growing trend towards stricter regulatory standards in risk management and compliance.
operational resilience, regulatory requirements, third-party, monitoring, compliance
false
Regulatory and Compliance
Financial Services
Mixed Chart
EY
Add to my slides
Remove from favorites
Image of a man using a tablet in a server room. Column chart showing priority levels assigned to various areas of operational resilience.
Risk Assessment and Management
Financial Services
This slide covers areas of operational resilience for enhancements over the next five years, focusing on third-party dependencies, technology capacity, client experience, and workforce resilience. It provides insights into CRO priorities regarding resilience aligned with major challenges they face.
operational resilience, technology, client experience, workforce, priorities
false
Risk Assessment and Management
Financial Services
Mixed Chart
EY
Add to my slides
Remove from favorites
A gauge diagram in a gradient from orange to yellow, indicating a balance between operational and strategic focuses, with a pointer set at 'Balanced'.
Market Analysis and Trends
Professional Services
Analyzes the focus of organizations on operational versus strategic approaches, providing insights into how companies balance daily operations with long-term strategic planning.
operational, strategic, focus, planning, balance, organizations, approaches
false
Market Analysis and Trends
Professional Services
Single Chart
PwC/Strategy&
Add to my slides
Remove from favorites
Minimal text with four distinct blocks each containing a strategic focus area, supported by icons.
Strategic Planning
Financial Services
Focuses on the company’s operational strategy elements, from client-centric structure to accountability. Useful for presenting organizational strategy updates.
Operational Strategy, Client-Centric, Growth, Accountability, Financial Planning, Business
false
Strategic Planning
Financial Services
Table
Goldman Sachs
Add to my slides
Remove from favorites
An intricate network diagram on a dark background illustrates client and personnel connections, with color-coded dots and sector labels demonstrating operational strategies.
Operational Efficiency
Financial Services
The slide operationalizes the organization's approach, showing connectivity and key areas like collaboration and infrastructure between clients and staff.
Operational, Strategy, Clients, Personnel, Investment, Banking, Asset, Management
false
Operational Efficiency
Financial Services
Uncategorized
Goldman Sachs
Add to my slides
Remove from favorites
The slide presents a complex, color-coded matrix graph showing the frequency of deployment versus complexity of operational value creation levers.
Operational Efficiency
Professional Services
This slide details various operational value creation levers, categorized by complexity and deployment frequency, suggesting strategic focus areas for business partnerships.
operational, value, complexity, deployment, strategy
false
Operational Efficiency
Professional Services
Single Chart
Accenture
Add to my slides
Remove from favorites
The slide features a large image of an hourglass against a calendar background on the left. On the right, three column charts show firm operation years for total, hedge fund, and private equity.
Market Analysis and Trends
Financial Services
This slide presents data on how long firms have been in operation, divided into total, hedge fund, and private equity categories, with years of operation segmented in a column chart.
operation, firm, hedge fund, private equity, years
false
Market Analysis and Trends
Financial Services
Multiple Chart
EY
Add to my slides
Remove from favorites
The slide features a mix of text and bar charts with segmented pie charts displaying data on respondents' functions and industries.
Operational Efficiency
Industrial & Manufacturing
The slide presents an overview of the Operations Efficiency Radar study, focusing on manufacturing and service providers, targeting functional heads.
Operations Efficiency, CFO, Manufacturing, Survey, Trends
false
Operational Efficiency
Industrial & Manufacturing
Multiple Chart
Roland Berger
Add to my slides
Remove from favorites
The slide includes icons and key facts related to the Operations Efficiency Radar, summarizing survey scope, participation, and data points.
Operational Efficiency
Industrial & Manufacturing
Provides an overview of the Operations Efficiency Radar, summarizing key metrics, industries covered, and the scope of the surveys conducted.
Operations Efficiency, Survey, Data Points, Trends
false
Operational Efficiency
Industrial & Manufacturing
Pillar
Roland Berger
Add to my slides
Remove from favorites
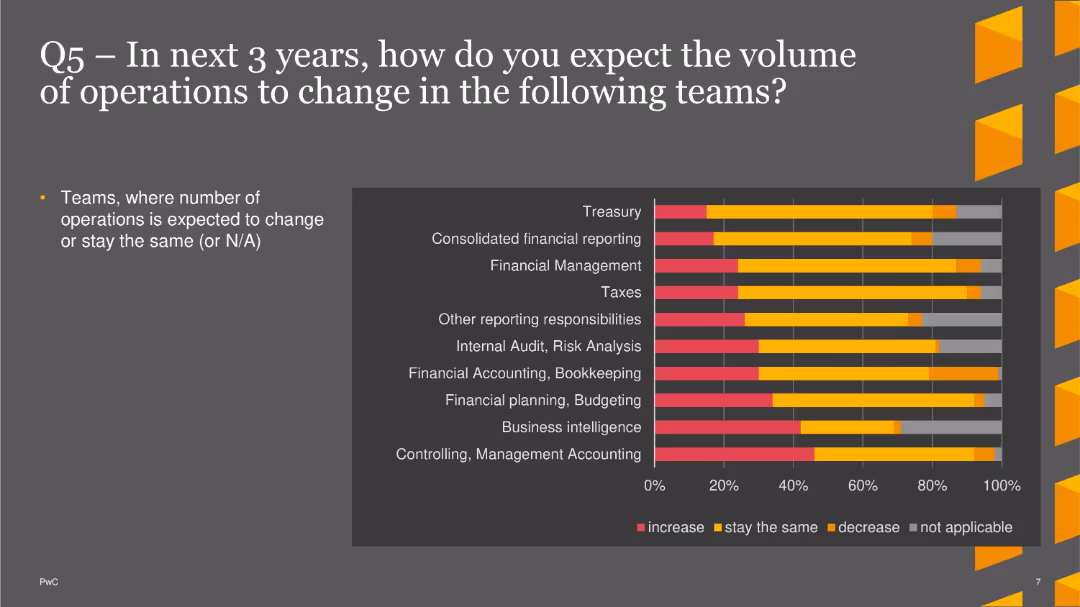
The slide includes a bar chart depicting expected changes in operations volume across various teams over the next three years.
Market Analysis and Trends
Financial Services
This slide highlights teams where operations volume is expected to change or stay the same, focusing on treasury, financial reporting, and management.
Operations, Future, Teams, Bar Chart, PwC, Survey, 2022
false
Market Analysis and Trends
Financial Services
Single Chart
PwC/Strategy&
Add to my slides
Remove from favorites
The slide features a flow chart with icons and arrows detailing steps from 'Insight Generation' to 'New Product/Offerings Development' including intermediary processes.
Operational Efficiency
Professional Services
This slide outlines an operational framework for sustaining and scaling value creation in organizations through various phases like insight generation, concept creation, and portfolio management.
operations, innovation, management, strategy, process, portfolio, development, concept, insight, value
false
Operational Efficiency
Professional Services
Linear Flow
McKinsey
Add to my slides
Remove from favorites
This slide combines text blocks and a color-coded text blocks illustrating transitions from stable to efficient, and efficient to predictive, up to future-ready stages, highlighted in purple and pink tones.
Operational Efficiency
Technology & Software
Outlines strategic steps for organizations to enhance their operations maturity. It describes transitions from stable to efficient, efficient to predictive, and predictive to future-ready, suggesting focused improvements at each stage.
operations maturity, strategic steps, efficiency, predictive, future-ready, transformation, business roadmap, Accenture Research
false
Operational Efficiency
Technology & Software
Linear Flow
Accenture
Add to my slides
Remove from favorites
Contains lists and categorizations of risks such as Product, Supply base, Manufacturing, etc., alongside icons illustrating different types of impact.
Risk Assessment and Management
Professional Services
Offers a detailed breakdown of various operations risks along with their potential impacts on revenue, cash, cost, and customer satisfaction.
Operations risk, Categories, Impact analysis, Revenue, Cash, Cost, Customer
false
Risk Assessment and Management
Professional Services
Header Horizontal
Bain
Add to my slides
Remove from favorites
Features column charts showing the shifts in focus on flexibility, resilience, and business continuity versus cost reduction, customer service, and speed for the next years.
Strategic Planning
Professional Services
Discusses how operational strategies have shifted towards increasing resilience and flexibility, particularly after 2020, with quantitative future projections.
Operations strategy, Flexibility, Resilience, Business continuity, Cost reduction, Customer service, Speed
false
Strategic Planning
Professional Services
Multiple Chart
Bain
Add to my slides
Remove from favorites
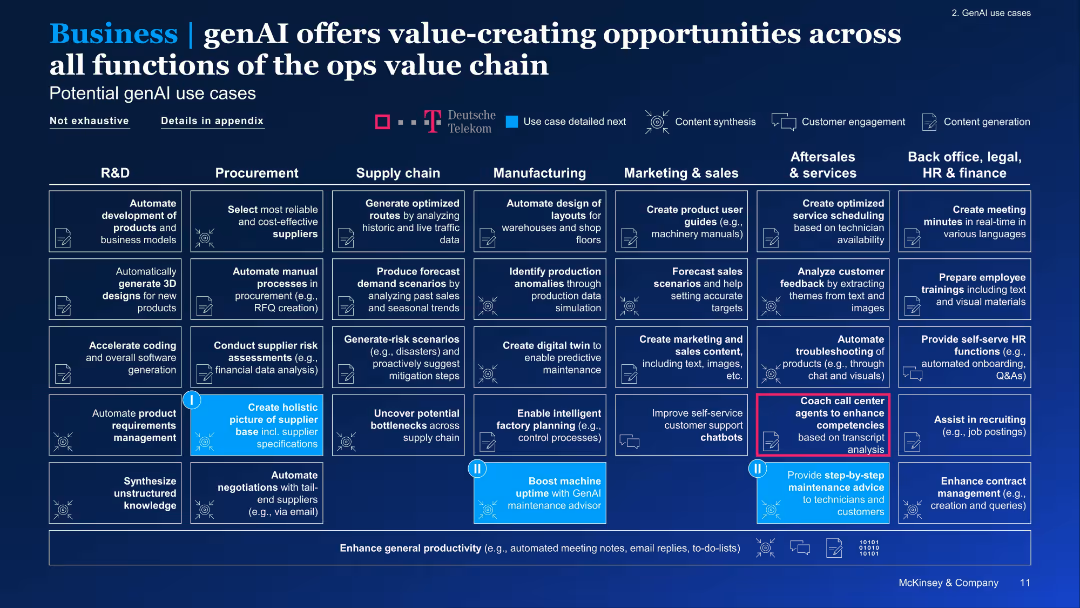
Matrix chart segmented by operational areas with icons indicating types of AI use (engagement, synthesis, etc.)
Product and Service Analysis
Telecommunications
This slide presents a matrix of generative AI applications across business functions—from R&D to HR. It illustrates how AI can optimize, automate, and enhance tasks like supplier selection, factory planning, and call center coaching, offering end-to-end value creation opportunities.
operations, value chain, GenAI use cases, automation, enhancement, coaching, productivity
false
Product and Service Analysis
Telecommunications
Single Chart
McKinsey
Add to my slides
Remove from favorites
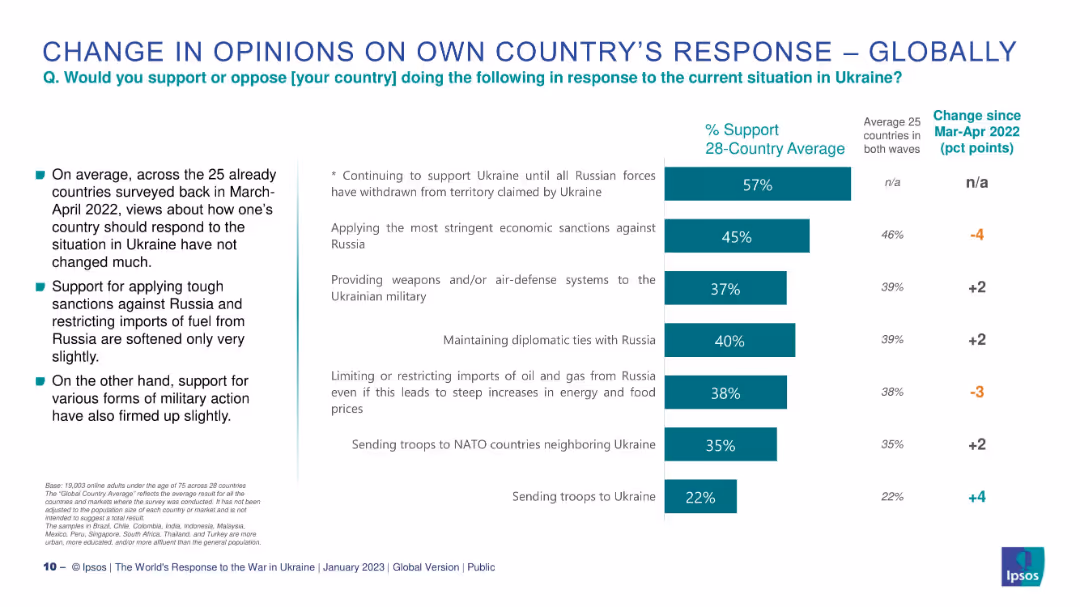
Chart identical in structure to 19953 but includes change indicators since Mar-Apr 2022.
Market Analysis and Trends
Government & Public Sector
This slide examines how public opinion on government response to Ukraine has shifted over time. It shows percentage changes in support for various actions, such as sanctions, military involvement, and diplomacy, across countries surveyed in both 2022 and 2023.
opinion change, Ukraine, comparison, sanctions, diplomacy, Ipsos, military support
false
Market Analysis and Trends
Government & Public Sector
Mixed Chart
IPSOS
Add to my slides
Remove from favorites
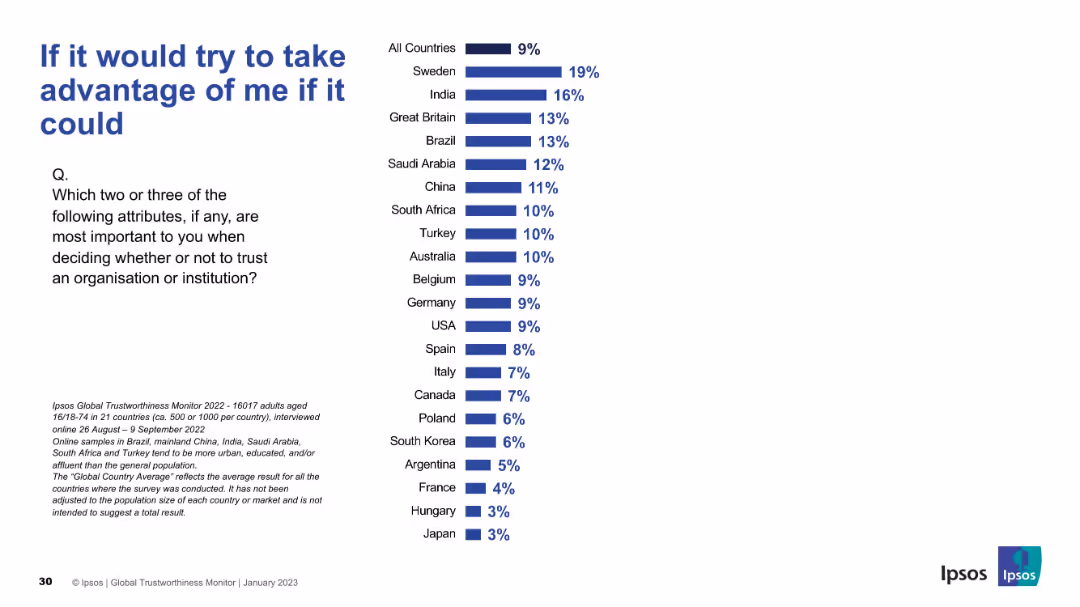
Reversed logic compared to other slides—lower percentages indicate higher tolerance. Sweden and India top the list.
Market Analysis and Trends
Professional Services
Explores the negative attribute of opportunism as a factor in distrust. Sweden and India show higher sensitivity, while Japan and Hungary are less reactive to this trait.
opportunism, distrust, red flags, Ipsos survey, consumer perception, manipulation
false
Market Analysis and Trends
Professional Services
Mixed Chart
IPSOS
Add to my slides
Remove from favorites
A monochromatic background with a central, bold statement in orange. There's a list of three key opportunities and challenges related to digitization.
Strategic Planning
Professional Services
Serves as a thematic transition in a presentation, setting the stage for discussing how digitization affects growth, globalization, and work. It’s a prompt for deeper analysis on how these opportunities and challenges can be managed for strategic benefits.
opportunities, challenges, digitization, strategy, growth
false
Strategic Planning
Professional Services
Agenda
McKinsey
Add to my slides
Remove from favorites
A flowchart depicting a typical enterprise procurement process with steps from proposal to payment receipt. Accompanied by bullet points explaining the reasons for starting with procurement and its suitability for blockchain applications.
Operational Efficiency
Technology & Software
Describes EY's Network Procurement module within OpsChain 4.0, highlighting its deployment on the Baseline Protocol and the rationale for focusing on procurement processes first.
OpsChain, Network Procurement, Baseline Protocol, blockchain, enterprise procurement, EY, process flow, efficiency
false
Operational Efficiency
Technology & Software
Graphic
EY
Add to my slides
Remove from favorites
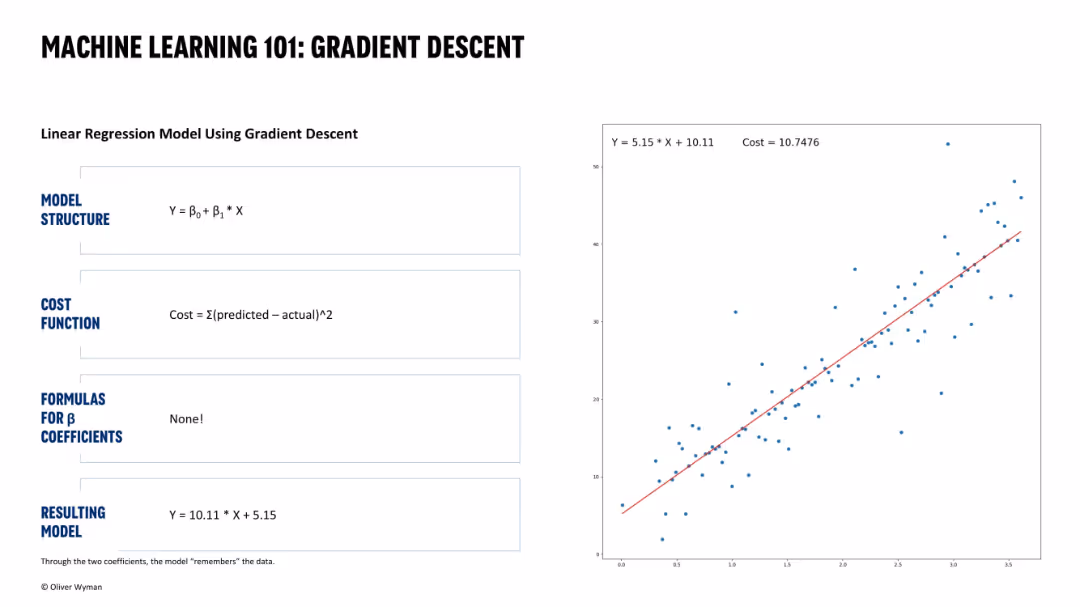
Same structure. Final panel shows cost minimized with properly fitted regression line matching analytical solution.
Technology and Digital Transformation
Artificial Intelligence
Concludes the gradient descent optimization. Coefficients match those in the formula-based solution (Slide 16331), confirming that gradient descent reached the optimal model.
optimal model, gradient descent, coefficient convergence, machine learning, regression fit, cost minimization, data fitting
false
Technology and Digital Transformation
Artificial Intelligence
Single Chart
Oliver Wyman
Add to my slides
Remove from favorites
This comparative slide is divided into two sections contrasting what has been done with what is left to do regarding the company's optimisation efforts. It's a visually simple design with checkmarks for completed tasks and bullet points for planned tasks.
Operational Efficiency
Financial Services
This slide assesses the company's operational optimisation progress against future goals, serving as a status update and action plan for continuous improvement.
Optimisation, Progress, Future Goals, Action Plan, Improvement
false
Operational Efficiency
Financial Services
Table
Morgan Stanley
Add to my slides
Remove from favorites
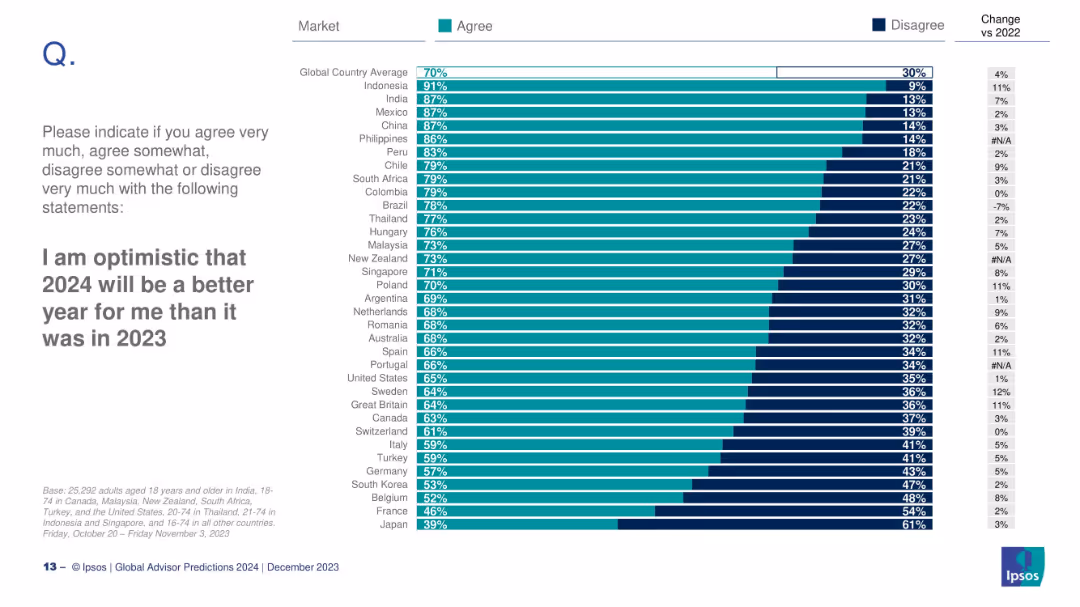
Bar chart with country rankings on optimism for 2024; includes % change from 2022.
Strategic Planning
Professional Services
This slide ranks optimism across countries. Indonesia (91%) and India (87%) show highest optimism for 2024, while Japan (39%) and France (46%) are lowest.
optimism, 2024, country comparison, Ipsos, hope, personal improvement
false
Strategic Planning
Professional Services
Mixed Chart
IPSOS
Add to my slides
Remove from favorites
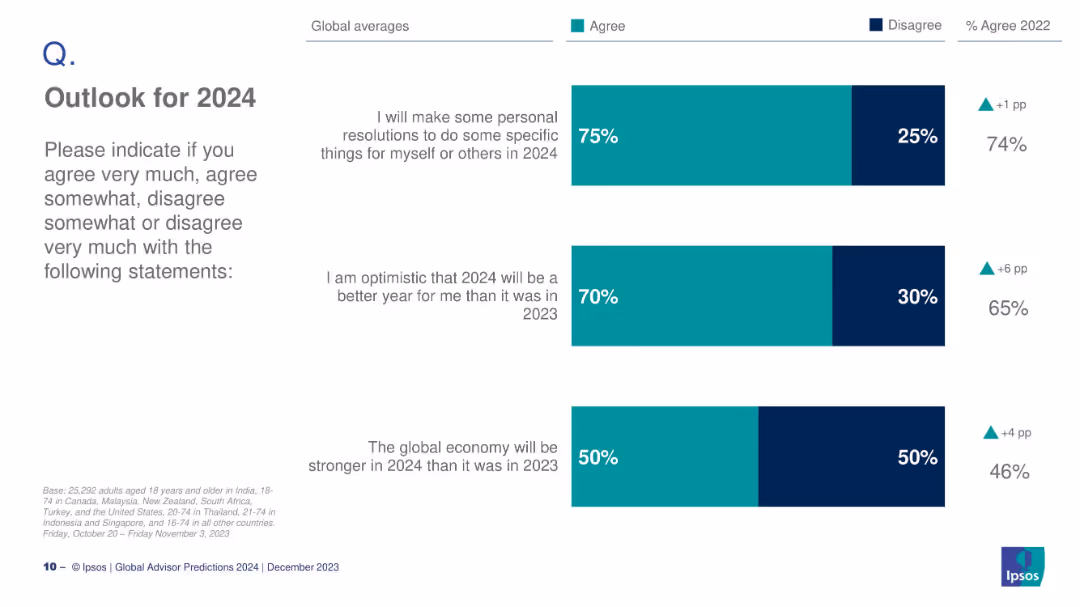
Bar chart with three global statements on 2024 optimism: resolutions, optimism for better year, and global economy strength.
Strategic Planning
Professional Services
This slide forecasts sentiment for 2024, highlighting that 75% plan resolutions, 70% are optimistic it will be a better year, and 50% believe the economy will improve.
optimism, 2024, resolutions, economy, sentiment, Ipsos, predictions, outlook
false
Strategic Planning
Professional Services
Mixed Chart
IPSOS
Add to my slides
Remove from favorites
Previous
Next
You don't have any favorites yet.
Please wait loading your favorites slides...
Create a FREE account to continue browsing
Receive Instant Access to 1,000+ slides from companies like McKinsey, Google, and Goldman Sachs
First Name
Last Name
Email
Password
I agree to all
Terms & Privacy Policy
Thank you! Your submission has been received!
Oops! Something went wrong while submitting the form.
Have an account?
Sign in
Upgrade to PRO to Save slides
Advanced Search and Filters
Access to 15,000+ slides
Access to Category Pages
Save/Bookmark Slides
PowerPoint Template Library
Pick a Plan
MONTHLY
$12/month
Billed every month, Cancel anytime.
YEARLY
$9/year
Billed $108 annually, Cancel anytime.
Checkout for $12/month
Checkout for $108/yr
Secured by Stripe | AES-256 bit encryption