My Account
My Slides
Search by Category
Pricing
Templates
View All Templates
Download Template Slides
✦ AI Search
Feedback
Login
Logout
Get Started
Browse all Slides
Browse all Slides
Create a FREE Account
Instant access to 1,000+ real slides from top companies like McKinsey, BCG, Goldman Sachs, Google and many more!
First Name
Last Name
Email
Password
I agree to all
Terms & Privacy Policy
Thank you! Your submission has been received!
Oops! Something went wrong while submitting the form.
Have an account?
Sign in
Saved Slides
Total No. of slides saved
0
↻ Refresh
✖ Clear all
The slide includes an image of two people kayaking. There are two pie charts showing expectations for Greece’s attractiveness, divided by companies established and not established in Greece.
Strategic Planning
Hospitality & Tourism
The slide outlines survey findings that show optimism about Greece's attractiveness, with 67% of respondents expecting improvement over the next three years, similar to the rest of Europe.
optimism, attractiveness, Greece, future, survey, established, non-established
false
Strategic Planning
Hospitality & Tourism
Multiple Chart
EY
Add to my slides
Remove from favorites
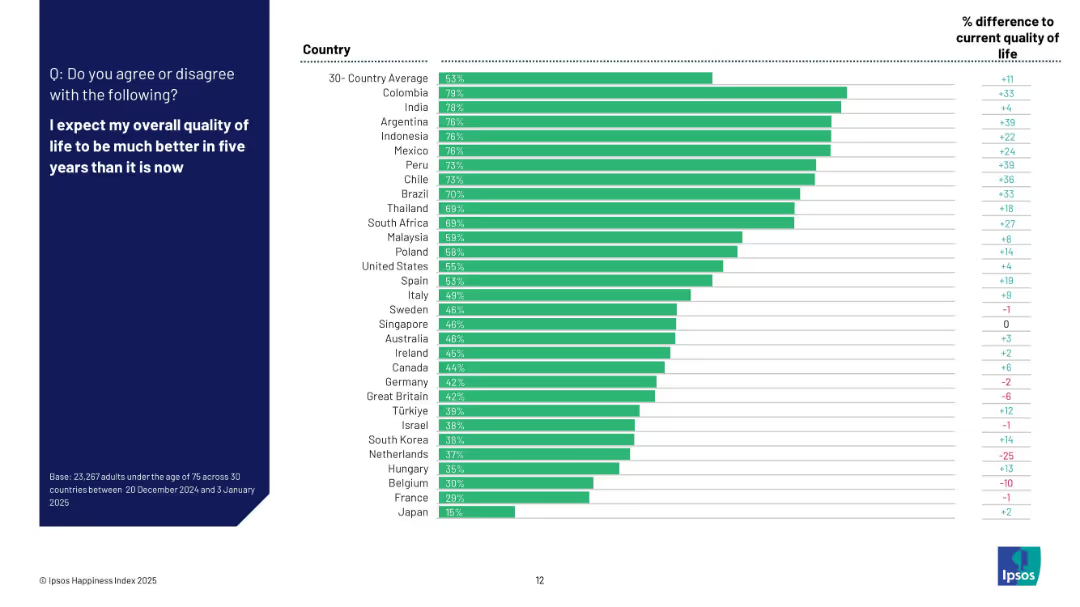
Vertical bar chart with countries ranked by optimism about future quality of life; includes side column with percentage difference from current life assessment.
Market Analysis and Trends
Professional Services
The slide ranks countries based on optimism regarding future quality of life. Colombia, India, and Argentina are the most optimistic, with Japan ranking lowest. It also shows the percentage point difference compared to their current quality of life, highlighting shifts in sentiment.
optimism, future quality of life, Ipsos, expectation, country sentiment, 2025, outlook, survey, global confidence
false
Market Analysis and Trends
Professional Services
Mixed Chart
IPSOS
Add to my slides
Remove from favorites
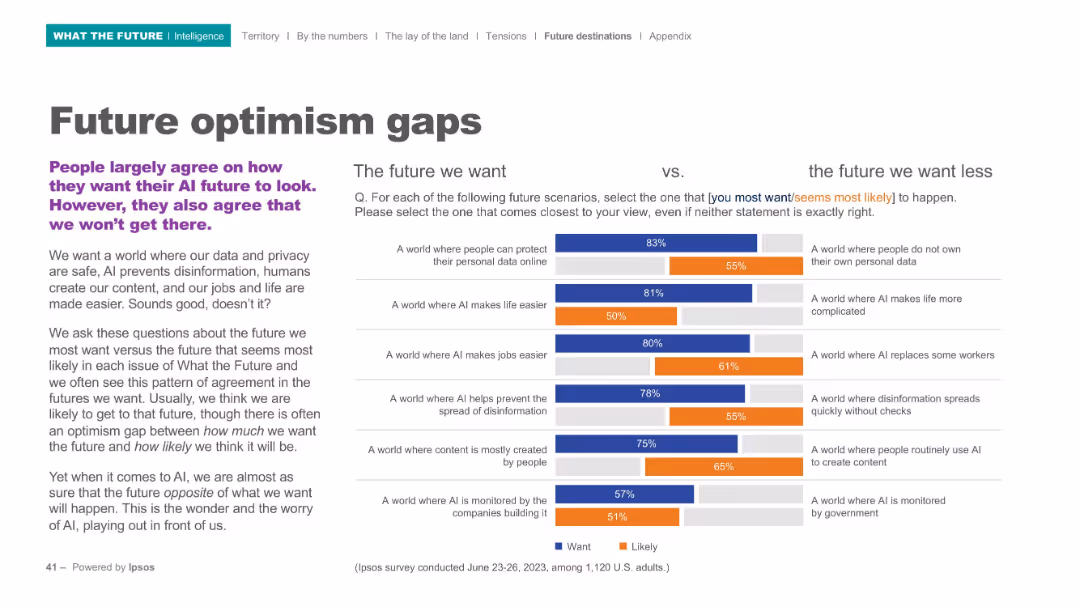
Two-column bar graph comparison with headline text on left, descriptive text below, and detailed survey bars to the right.
Market Analysis and Trends
Artificial Intelligence
The slide contrasts ideal AI futures ("the future we want") with the futures people expect ("the future we want less"). It reveals consistent optimism gaps, where people desire a safer, more helpful AI future but don't believe it will happen.
optimism gap, AI future, expectations vs reality, privacy, disinformation, automation, human content, Ipsos survey
false
Market Analysis and Trends
Artificial Intelligence
Mixed Chart
IPSOS
Add to my slides
Remove from favorites
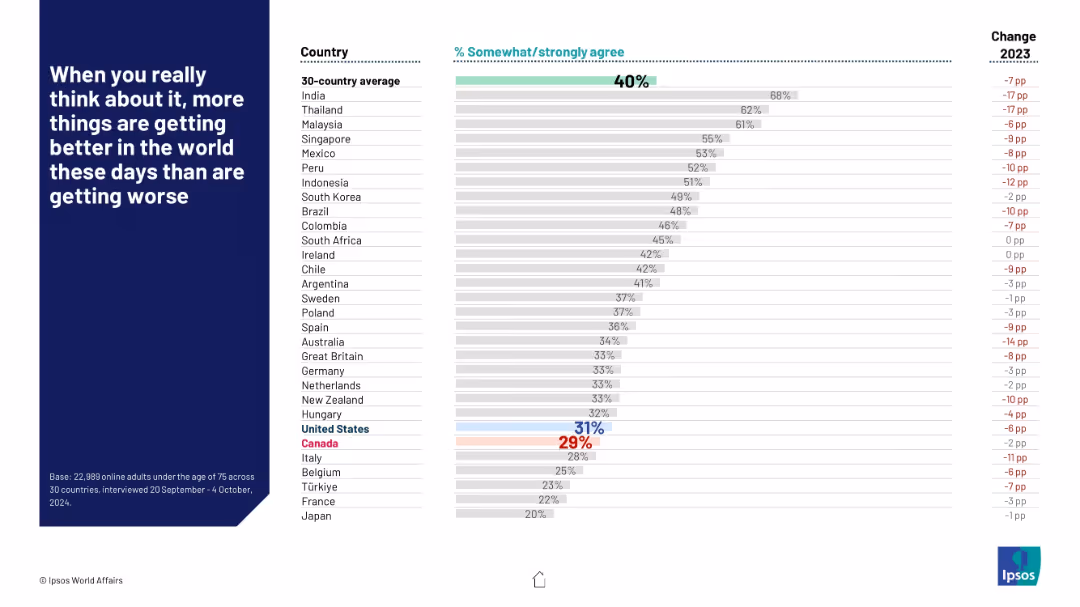
Horizontal bar chart by country showing optimism, with a change column on the right; emphasis on global average and outliers.
Market Analysis and Trends
Government & Public Sector
This slide presents optimism levels by country, measuring agreement with the idea that the world is improving. India leads with 68%, while Japan is the lowest at 20%. The global average stands at 40%, with most countries seeing a drop from the previous year.
optimism, global attitudes, improvement perception, world trends, Ipsos, pessimism, public opinion, yearly change, survey results, 2024
false
Market Analysis and Trends
Government & Public Sector
Mixed Chart
IPSOS
Add to my slides
Remove from favorites
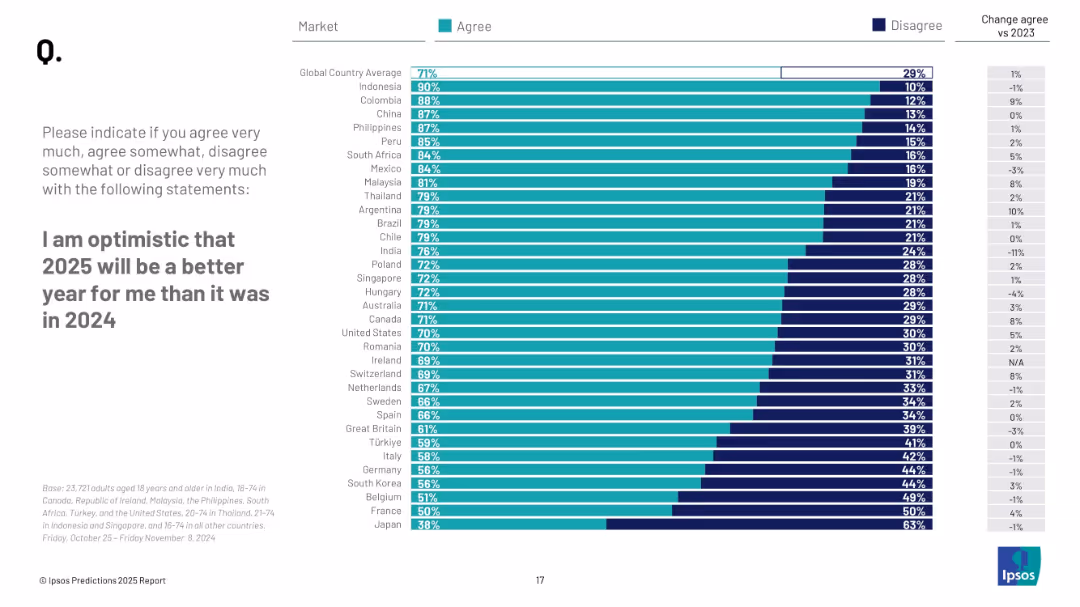
Bar chart comparing country-level agreement vs disagreement on personal optimism for 2025; right-aligned bar with % values; side column with change from 2023.
Market Analysis and Trends
Professional Services
This slide presents survey results on personal optimism for 2025 across countries, comparing how many people agree or disagree that 2025 will be better for them than 2024, and changes from previous year.
optimism, global attitudes, personal outlook, country comparison, 2025, Ipsos, bar chart, sentiment, improvement, survey results
false
Market Analysis and Trends
Professional Services
Mixed Chart
IPSOS
Add to my slides
Remove from favorites
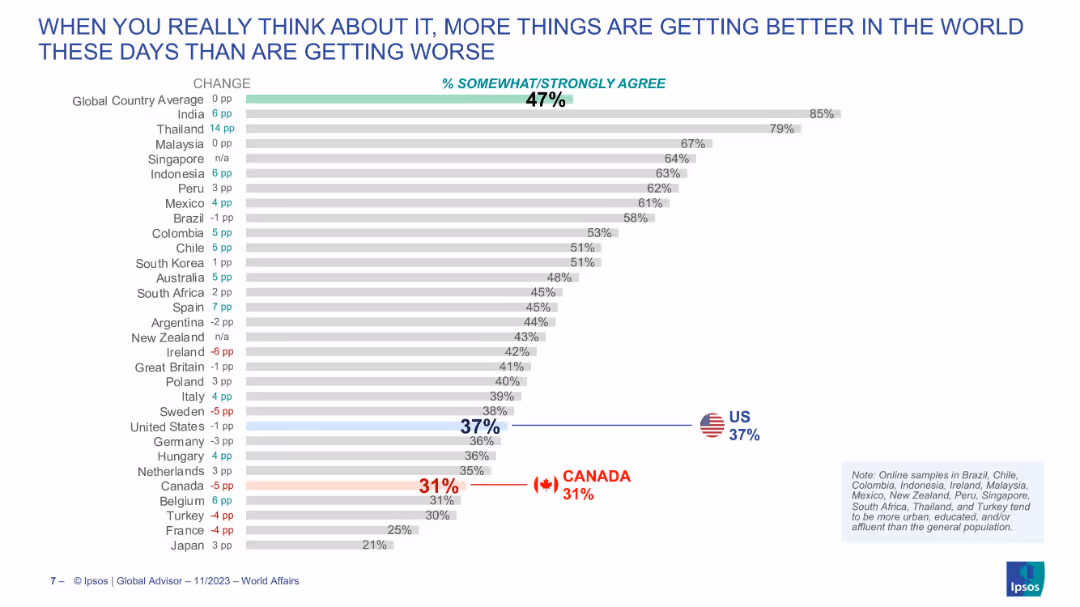
Bar chart with change indicators showing agreement with the view that the world is improving; ranked by country.
Market Analysis and Trends
Media & Entertainment
This slide explores public optimism globally, comparing countries that believe more things are improving than worsening, with India and Thailand showing the most positivity.
optimism, improvement, public sentiment, inequality, global attitudes, comparative analysis
false
Market Analysis and Trends
Media & Entertainment
Single Chart
IPSOS
Add to my slides
Remove from favorites
The slide features a pie chart showing 37% optimism, bullet points on the right with blue headings, and demographics at the bottom. Simple white background with minimalistic design.
Market Analysis and Trends
Financial Services
The slide presents data indicating that optimistic investors are more likely to invest actively and have confidence in a quick economic recovery. Demographic details are included.
optimism, investment, confidence, demographics, COVID-19
false
Market Analysis and Trends
Financial Services
Mixed Chart
IPSOS
Add to my slides
Remove from favorites
The slide features a column chart comparing group underlying revenues/RWA for UBS FY22, CS FY22, 2H23 annualized post-merger, and projected 2026 exit rate. Text on the left lists actions: >6bn capital release by 2026, reduction of low-return exposures, alignment of return hurdle frameworks, and optimization of models and hedging activities.
Financial Performance
Financial Services
The slide outlines strategies to optimize financial resources for sustainable growth and higher returns. It includes actions for capital release, reduction of low-return exposures, and optimization of financial models. This slide is suitable for discussing financial strategy and performance improvement with stakeholders.
optimization, financial resources, sustainable growth, returns, capital
false
Financial Performance
Financial Services
Mixed Chart
UBS
Add to my slides
Remove from favorites
Features a pie chart and lists analyzing how employees spend time and common types of process inefficiencies.
Operational Efficiency
Professional Services
Discusses methods to optimize business processes by eliminating non-value-added activities and reducing waste.
optimization, processes, efficiency, waste, activities
false
Operational Efficiency
Professional Services
Mixed Chart
Deloitte
Add to my slides
Remove from favorites
Features four small column charts comparing capacity differences between Option 3C and the Base case across various scenarios (Central, Step Change, Fast Change, Slow Change).
Financial Performance
Energy & Utilities
Compares capacity differences between Option 3C and the Base case, providing insights into potential changes in energy production capacities across different scenarios.
Option 3C, capacity, comparison, Base case, energy, scenarios, Central, Step Change, Fast Change, Slow Change
false
Financial Performance
Energy & Utilities
Multiple Chart
EY
Add to my slides
Remove from favorites
The slide contains four bar charts illustrating cumulative gross market benefits across different scenarios (Central, Step Change, Fast Change, Slow Change).
Financial Performance
Energy & Utilities
Forecasts cumulative gross market benefits under different scenarios, presenting data on CAPEX, FOM, fuel, VOM, and other factors discounted to June 2020 dollars.
Option 3C, market benefits, forecast, scenarios, CAPEX, FOM, fuel, VOM, discounted
false
Financial Performance
Energy & Utilities
Multiple Chart
EY
Add to my slides
Remove from favorites
A split-view slide with two sets of column charts. The left chart in blue shows quarterly revenue in euros for five quarters, while the right green chart tracks the order book value for the same periods. A high-contrast footer with the event name and date grounds the slide. In the top-right corner, an image of an office environment with people provides a real-world connection to the data presented.
Financial Performance
Real Estate & Construction
Illustrates the company's order book growth across all businesses, providing a snapshot of revenue and orders, which is pertinent for stakeholders during financial updates or company meetings.
order book, business growth, revenue, financial analysis, quarterly data, real estate, construction, performance review
false
Financial Performance
Real Estate & Construction
Multiple Chart
Goldman Sachs
Add to my slides
Remove from favorites
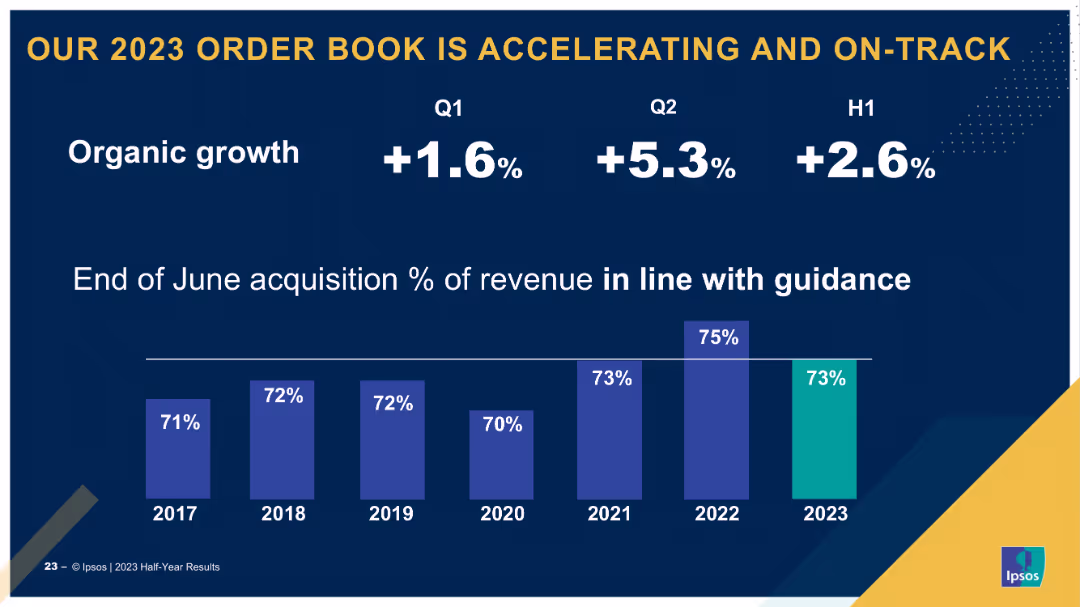
Single-column layout with a bar chart showing quarterly and half-year organic growth rates. Uses callouts for specific growth percentages and year comparisons.
Market Analysis and Trends
Financial Services
Highlights the acceleration of the order book in 2023, showing organic growth percentages for Q1, Q2, and H1, and acquisition revenue percentages compared to previous years.
order book, growth, 2023, Q1, Q2, H1
false
Market Analysis and Trends
Financial Services
Single Chart
IPSOS
Add to my slides
Remove from favorites
Horizontal bar chart showing contributions to order book growth from various sectors. Uses different colors for each sector and additional columns for order book impact.
Market Analysis and Trends
Financial Services
Analyzes the contributions of different sectors to order book growth, including public sector, CPG, financial services, travel, and big tech, with and without COVID-19 impact.
order book, growth, sectors, impact, analysis
false
Market Analysis and Trends
Financial Services
Single Chart
IPSOS
Add to my slides
Remove from favorites
Table with projects for delivery years and their values, client names. Column chart for net order book by segments. List of projects under execution. Company logo.
Operational Efficiency
Energy & Utilities
Details robust order book valued at ~$18B, upcoming project deliveries, and the segmentation of net order book. Used for showcasing financial strength and operational capacity.
order book, projects, net value, clients, execution, rigs, floaters, financial strength
false
Operational Efficiency
Energy & Utilities
Mixed Chart
Morgan Stanley
Add to my slides
Remove from favorites
A column chart displays the order intake from 2018 to 2021, with a blue gradient. The slide includes red text boxes with bullet points on strategic outlook and future projections.
Sales and Business Development
Industrial & Manufacturing
It displays a positive trend in order intake, with strategic notes on market positioning and future expectations. This is likely used in sales meetings or investor briefings to demonstrate sales momentum and business growth.
Order Intake, Sales Trend, Strategic Outlook, Aerospace, Defense
false
Sales and Business Development
Industrial & Manufacturing
Mixed Chart
Goldman Sachs
Add to my slides
Remove from favorites
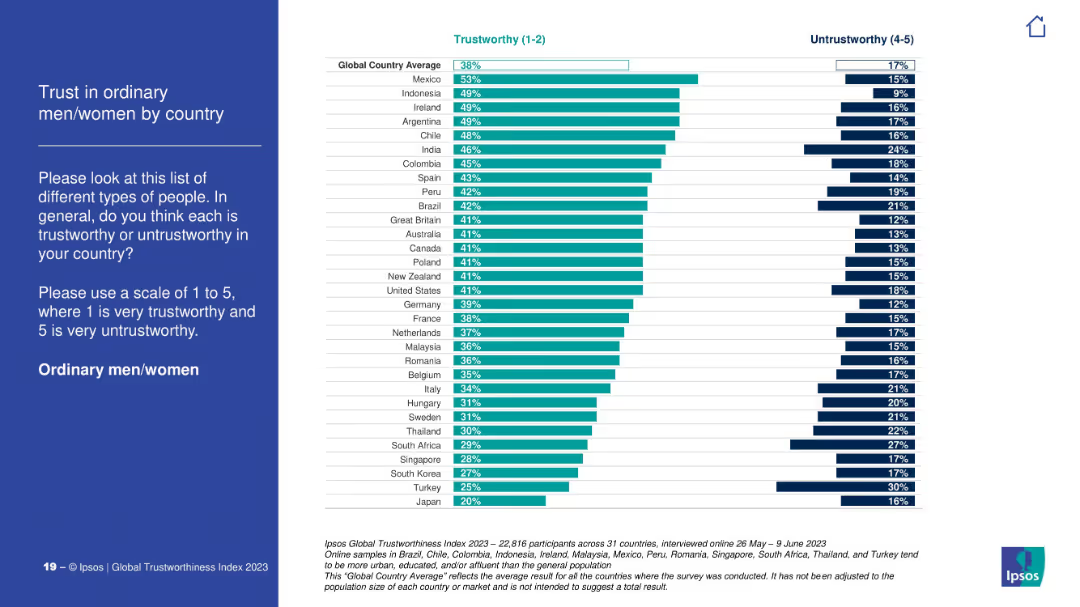
Ranked bar chart showing trust in ordinary citizens by country, with global average noted. Consistent color coding, minimalist visual style.
Customer and Market Segmentation
Government & Public Sector
The slide depicts how ordinary citizens are perceived in terms of trustworthiness across countries. Mexico, Indonesia, and Ireland are highest; Japan and Turkey are lowest. The global average sits at 38%.
ordinary citizens, trust metrics, public perception, Ipsos, social trust, survey results
false
Customer and Market Segmentation
Government & Public Sector
Mixed Chart
IPSOS
Add to my slides
Remove from favorites
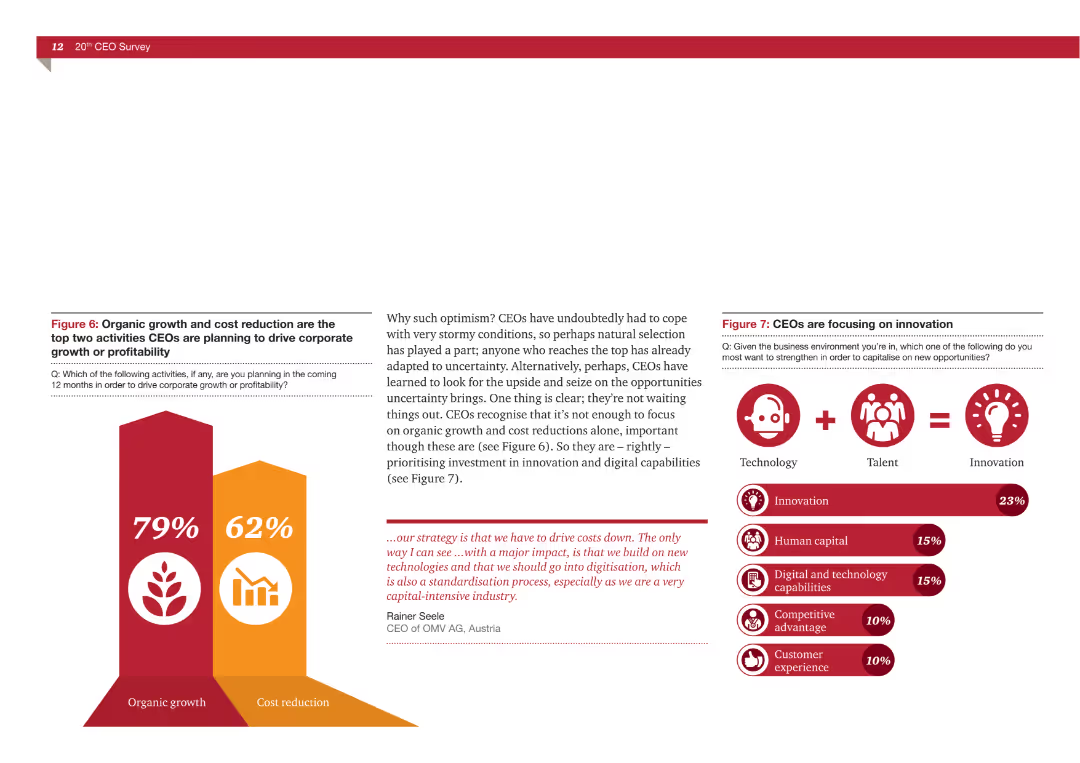
The slide features a column chart comparing organic growth (79%) and cost reduction (62%). It also has icons and small textual descriptions explaining the focus on innovation.
Strategic Planning
Professional Services
This slide compares the top two activities CEOs are planning to drive corporate growth or profitability: organic growth and cost reduction. It highlights that 79% of CEOs focus on organic growth while 62% prioritize cost reduction. The slide emphasizes the need for innovation.
Organic growth, cost reduction, CEOs, corporate growth, profitability, innovation, strategic planning
false
Strategic Planning
Professional Services
Multiple Chart
PwC/Strategy&
Add to my slides
Remove from favorites
This slide presents a line chart showing the organic growth in emerging markets from 2013 to 2022, and a small group of circle charts representing 10-year average growth comparisons between emerging markets and Nestlé Group.
Market Analysis and Trends
Consumer Goods
The slide highlights Nestlé's organic growth trends in emerging markets over a decade, emphasizing the impact of pricing and volume on overall growth. It serves to compare historical performance and forecast future potential in these markets.
organic growth, emerging markets, Nestlé, pricing, RIG
false
Market Analysis and Trends
Consumer Goods
Single Chart
Deutsche Bank
Add to my slides
Remove from favorites
Displays column charts comparing net new households and wealth management referrals over several years. The graphs are accompanied by textual explanations and key growth drivers.
Strategic Planning
Financial Services
Discusses the organic growth and enterprise connectivity strategies, highlighting new household acquisition and referral trends within the business, underpinned by a variety of strategic growth drivers.
Organic Growth, Enterprise Connectivity, Net New Households, Wealth Management, Referrals, Growth Drivers, BAC, Market Connectivity
false
Strategic Planning
Financial Services
Multiple Chart
Morgan Stanley
Add to my slides
Remove from favorites
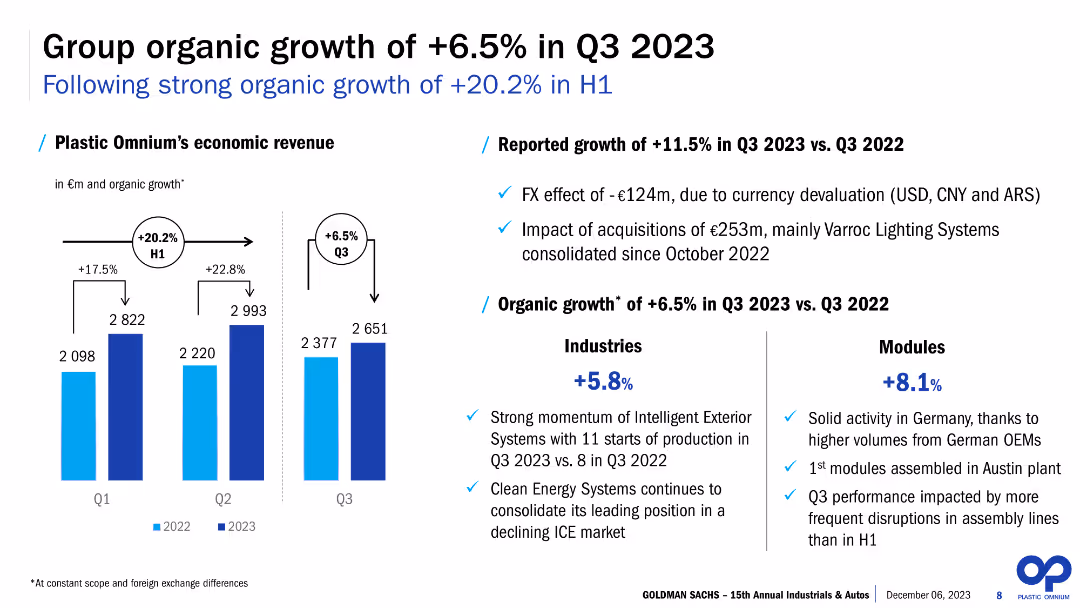
This slide presents column charts comparing economic revenue over three quarters for two consecutive years, with textual annotations and bullet points highlighting key financial figures and percentages. The design includes two shades of blue to distinguish the years and is accompanied by symbols representing different industry sectors and a module. Visual elements are arranged for easy comparison of data points.
Financial Performance
Industrial & Manufacturing
The slide discusses the company's economic revenue and organic growth rate in Q3 2023, with a comparison to the previous year. It shows reported growth, effects of currency devaluation, and the impact of acquisitions. Additionally, it provides a breakdown of growth by industry and modules. This slide is suitable for financial reviews, highlighting performance and growth in specific sectors and overall company health.
Organic Growth, Q3 2023, Revenue, Acquisitions, Industry, Modules, Percentages, Comparative, Financial
false
Financial Performance
Industrial & Manufacturing
Mixed Chart
Goldman Sachs
Add to my slides
Remove from favorites
Features a complex stacked column chart showing revenue growth over several years, including acquisitions.
Financial Performance
Financial Services
The slide likely aims to illustrate financial growth and strategic acquisitions for stakeholders or analysts.
Organic Growth, Revenue, Acquisitions, Financial, Analysis, CAGR, Trend, Performance
false
Financial Performance
Financial Services
Single Chart
Goldman Sachs
Add to my slides
Remove from favorites
The slide includes two column charts showing economic revenue growth in Q1, Q2, and Q3 of 2022 and 2023. There are bullet points on the right side detailing the reported growth, impact of acquisitions, and growth in industries and modules.
Financial Performance
Financial Services
The slide reports Plastic Omnium’s economic revenue growth in Q3 2023, highlighting a 6.5% increase. It details the impact of currency devaluation, acquisitions, and sector-specific growth in industries and modules. The focus is on financial performance and growth metrics.
Organic growth, revenue, Q3 2023, financial performance, acquisitions, industry growth, module growth, economic revenue, currency impact, growth metrics
false
Financial Performance
Financial Services
Mixed Chart
Goldman Sachs
Add to my slides
Remove from favorites
The slide contains a header, a background image, and two sections: a text block on the left and a bar chart on the right. The bar chart shows survey responses on people's attitudes toward genetically modified and engineered foods, with different colors representing levels of agreement and disagreement.
Product and Service Analysis
Agriculture & Food Production
Discusses the debate between organic and genetically modified foods. The bar chart illustrates survey data on people's efforts to avoid genetically modified foods, showing varying levels of agreement and disagreement with the statement about avoiding such foods.
Organic, modified foods, engineered foods, survey, attitudes
false
Product and Service Analysis
Agriculture & Food Production
Mixed Chart
IPSOS
Add to my slides
Remove from favorites
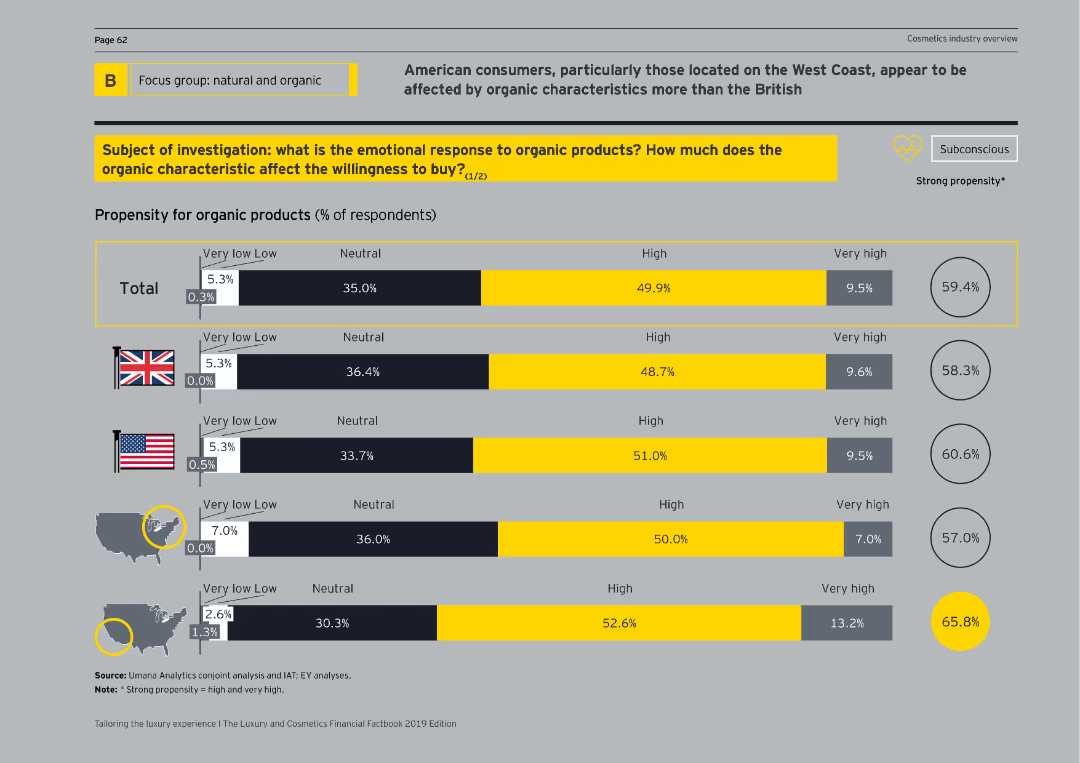
The slide contains bar charts showing respondents' propensity for organic products, segmented by total, UK, US, and regional preferences.
Customer and Market Segmentation
Consumer Goods
The slide analyzes the emotional response to organic product attributes and their impact on purchase decisions, comparing responses across different regions and demographics.
organic products, emotional response, propensity, regions
false
Customer and Market Segmentation
Consumer Goods
Single Chart
EY
Add to my slides
Remove from favorites
Bar graph and respondent quotes about steps being taken to enhance organizational agility, focusing on training and technology.
Strategic Planning
Professional Services
Outlines the specific actions companies are taking to become more agile, ranking culture and training among the top measures being implemented.
Organizational Agility, Training, Culture, Steps, Bar Graph, Quotes
false
Strategic Planning
Professional Services
Mixed Chart
Kearney
Add to my slides
Remove from favorites
This slide contrasts organizational models using a dark theme, with vertical bars and pie chart elements. It visually differentiates current vs. future expectations through color-coding and is supplemented with callouts for additional context.
Organizational Structure and Change
Professional Services
Discusses anticipated changes in organizational structure, shifting away from hierarchical models, which is essential for understanding evolving corporate cultures and internal dynamics across various industries.
Organizational Change, Corporate Culture, Hierarchy, Flat Structure, Industry Dynamics, Future Trends
false
Organizational Structure and Change
Professional Services
Multiple Chart
Kearney
Add to my slides
Remove from favorites
Comprises bullet points with accompanying icons describing characteristics of future organizational models designed for efficiency and adaptability.
Organizational Structure and Change
Professional Services
Discusses the evolution of organizational structures that prioritize speed, flexibility, and cross-functional collaboration to adapt to rapidly changing markets.
organizational change, flexibility, speed, adaptability, structure
false
Organizational Structure and Change
Professional Services
Header Horizontal
McKinsey
Add to my slides
Remove from favorites
The slide contrasts old and new organizational structures with visual elements like arrows and boxed text to emphasize changes.
Organizational Structure and Change
Consumer Goods
Discusses the organizational restructuring of Unilever to enhance focus on nutrition, increasing agility and market responsiveness.
organizational change, nutrition, agility, market responsiveness, restructuring
false
Organizational Structure and Change
Consumer Goods
Header Horizontal
Deutsche Bank
Add to my slides
Remove from favorites
This slide features a two-part comparison: on the left, a bar chart displays percentages of respondents prioritizing flat organizational structure; on the right, a boxed section shows percentages of executives considering culture-driven organization a high priority, categorized by job title and company size. Dark background with highlights in blue and yellow for visual emphasis.
Market Analysis and Trends
Professional Services
The slide presents survey data indicating the importance of moving towards a flat organizational structure, with 49% rating it as a high/urgent priority. The breakout box compares the urgency of a culture-driven organization among CEOs, CFOs, and COOs, and by company size, emphasizing different priorities across roles and company scales.
organizational change, priority, culture, executive survey, company size, flat structure, CEO, CFO, COO
false
Market Analysis and Trends
Professional Services
Single Chart
Kearney
Add to my slides
Remove from favorites
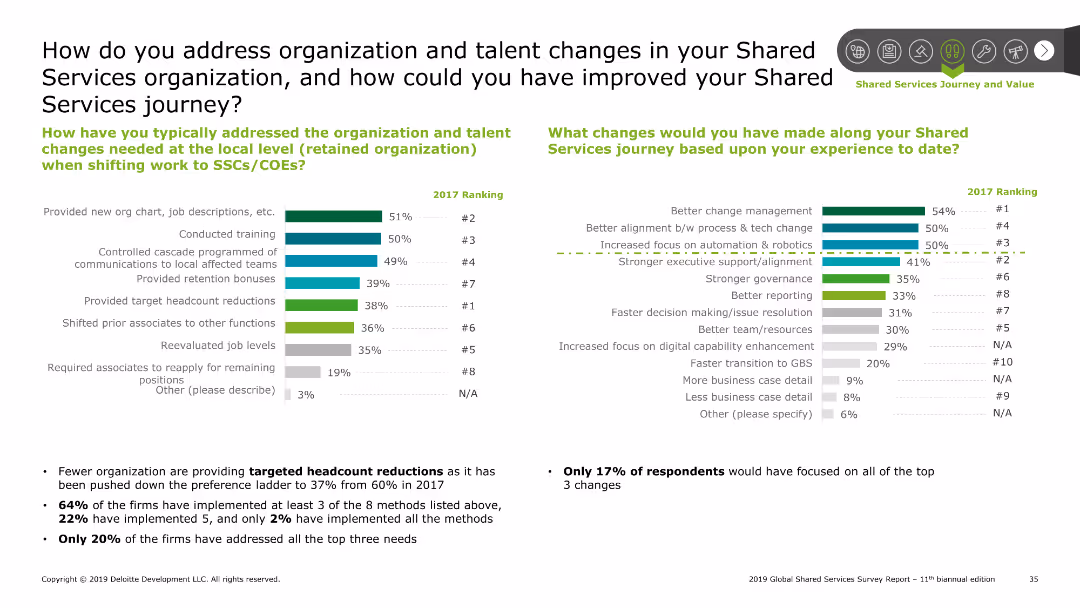
The slide contains a bar chart showing methods for addressing organizational changes and a column chart with improvements for the shared services journey.
Organizational Structure and Change
Professional Services
This slide discusses methods for addressing organizational and talent changes in shared services, and identifies potential improvements based on past experiences.
Organizational change, talent management, shared services, improvements
false
Organizational Structure and Change
Professional Services
Multiple Chart
Deloitte
Add to my slides
Remove from favorites
Features four rounded rectangles, each with a heading and a short text blurb beneath it. The slide is divided into quadrants representing different aspects of work structure and delivery.
Organizational Structure and Change
Professional Services
Encourages thinking about work delivery, organization, employee experience, and enabling work. Useful for initiating discussions on organizational changes needed for the future of work.
Organizational Change, Work, Structure, Planning
true
Organizational Structure and Change
Professional Services
Pillar
Deloitte
Add to my slides
Remove from favorites
A bar chart comparing different industries' approaches to culture and organizational structure in 2026, using colors to differentiate between 'control', 'hybrid', and 'culture' focused models. The layout is straightforward with clearly labeled categories and percentages, enabling easy comparison across industries.
Market Analysis and Trends
Professional Services
Forecasting future trends, this slide compares industries' approaches to organizational structure for 2026. It reveals preferences for control, hybrid, or culture models within sectors like consumer goods, retail, and media, providing a comprehensive overview of anticipated shifts in organizational strategy influenced by cultural considerations.
organizational culture, 2026 forecast, industry comparison, structure models, consumer goods, retail, media
false
Market Analysis and Trends
Professional Services
Single Chart
Kearney
Add to my slides
Remove from favorites
This slide uses a grid layout to present comparative data on cultural attitudes in business across different regions, including Europe, the USA, China, India, and Japan. Each region's response percentages to various statements about organizational culture are displayed in a tabulated format.
Organizational Structure and Change
Professional Services
Compares the role of organizational culture in business success across different global regions, highlighting differing attitudes towards culture's importance in business operations and strategy.
organizational culture, global comparison, business attitudes
false
Organizational Structure and Change
Professional Services
Table
PwC/Strategy&
Add to my slides
Remove from favorites
Multiple column charts over three slides, showing global perspectives on the strength of organizational culture including purpose, leadership, and employee motivation.
Market Analysis and Trends
Professional Services
Examines the perceived strength of organizational cultures globally, focusing on leadership's effectiveness and employee connection to organizational goals.
organizational culture, leadership effectiveness, employee motivation, global perspectives
false
Market Analysis and Trends
Professional Services
Single Chart
PwC/Strategy&
Add to my slides
Remove from favorites
Divides concepts of purpose, strategy, and culture visually, accompanied by a supermarket case study responding to COVID-19. It uses clear lines and text separation for organizational topics.
Operational Efficiency
Retail & E-commerce
Emphasizes the alignment of purpose, strategy, and culture in driving organizational success, showcased through a supermarket case study during the COVID-19 crisis.
Organizational culture, Strategic alignment, COVID-19, Supermarket
false
Operational Efficiency
Retail & E-commerce
Header Vertical
BCG
Add to my slides
Remove from favorites
Block diagrams outline steps to create a resilient and agile organization, using a dual-tone color scheme for clarity.
Operational Efficiency
Professional Services
Details a five-step process to enhance organizational design for resilience and agility, preparing for the new reality with rapid assessment and implementation strategies.
Organizational design, Resilience, Agility, Productivity, Cost efficiency
false
Operational Efficiency
Professional Services
Linear Flow
BCG
Add to my slides
Remove from favorites
Displays diagrams and lists outlining four key aspects of organizational design diagnostics.
Performance Metrics and KPIs
Professional Services
Focuses on evaluating spans of control, workforce composition, salary analysis, and duplication in organizations.
organizational, design, structure, analysis, workforce
false
Performance Metrics and KPIs
Professional Services
Framework
Deloitte
Add to my slides
Remove from favorites
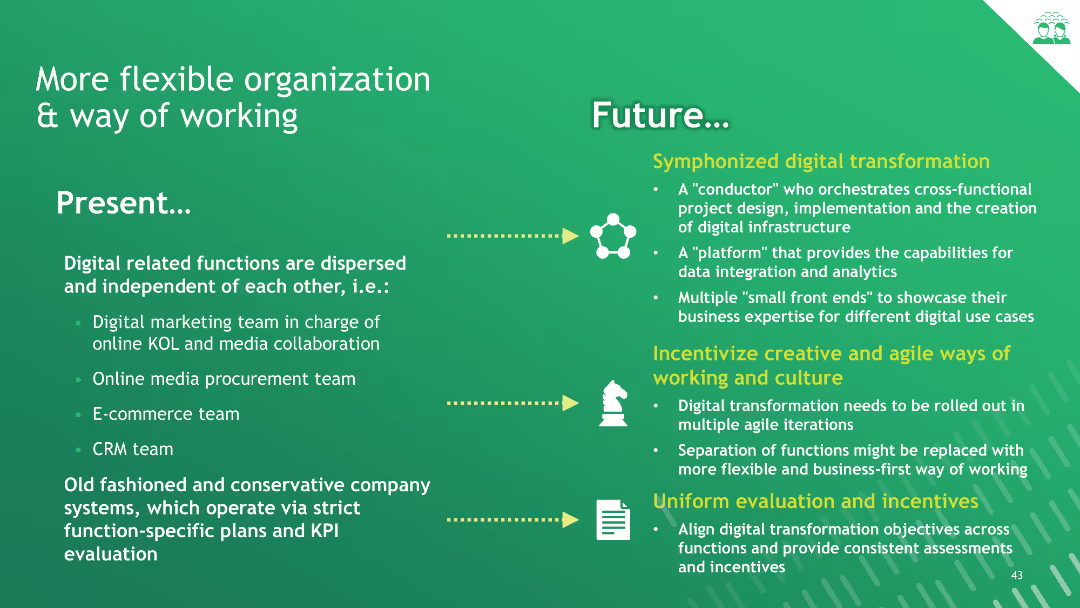
The slide contrasts current organizational practices with future strategies for flexibility and digital transformation, using a two-column format with bullet points.
Organizational Structure and Change
Consumer Goods
This slide contrasts the present state of organizational practices with future strategies aimed at fostering flexibility and digital transformation, highlighting the shift in work culture.
organizational flexibility, digital transformation, work culture, future strategies, current practices
false
Organizational Structure and Change
Consumer Goods
Header Vertical
BCG
Add to my slides
Remove from favorites
Features an aerial view of people at workstations arranged to spell "health," with overlaying text segments explaining management impacts on health, in a minimalistic and engaging layout.
Operational Efficiency
Professional Services
This slide visually represents how management styles impact organizational health, useful for discussions on corporate culture and management training.
organizational health, management, corporate culture, professional services, engagement
false
Operational Efficiency
Professional Services
Linear Flow
McKinsey
Add to my slides
Remove from favorites
Contains a horizontal bar graph showing the correlation between organizational health and shareholder return, displayed in a simple and clear manner.
Operational Efficiency
Professional Services
Analyzes how varying levels of organizational health affect shareholder returns over time, making it suitable for financial analysis presentations or stakeholder meetings.
organizational health, performance, shareholder return, bar graph, financial analysis, professional services
false
Operational Efficiency
Professional Services
Single Chart
McKinsey
Add to my slides
Remove from favorites
Displays a circular diagram detailing the nine dimensions of organizational health, supplemented by statistics and performance impacts in side pie charts.
Human Resources and Talent Management
Professional Services
This slide advocates for regular assessments of organizational health across nine critical dimensions to better integrate SDG strategies into the core business processes, highlighting how such practices can lead to enhanced performance and competitive advantage.
Organizational Health, SDG Strategy, Performance Improvement, Competitive Advantage
false
Human Resources and Talent Management
Professional Services
Multiple Chart
McKinsey
Add to my slides
Remove from favorites
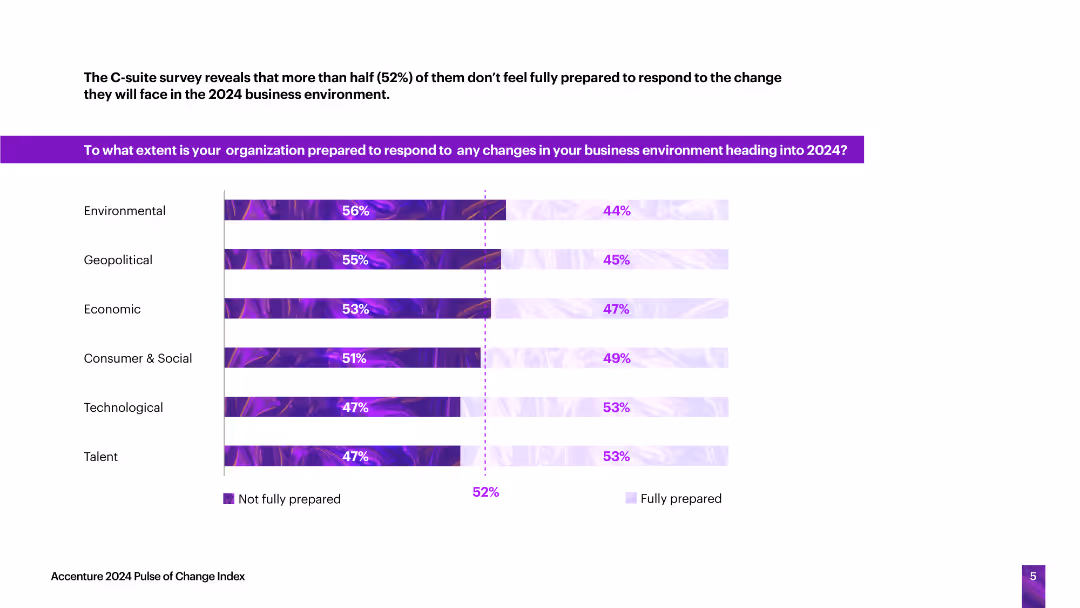
This slide includes a horizontal bar chart showing the preparedness of organizations to respond to various changes (environmental, geopolitical, economic, social, technological, talent) heading into 2024.
Technology and Digital Transformation
Technology & Software
The slide presents data on how prepared organizations feel about responding to changes in various areas, with more than half not feeling fully prepared for the upcoming business environment changes.
organizational preparedness, change, environmental, geopolitical, technological
false
Technology and Digital Transformation
Technology & Software
Single Chart
Accenture
Add to my slides
Remove from favorites
A simple slide with a central graphic of four interconnected diamonds, each labeled with a business division, and a textual statement below emphasizing client-centricity.
Strategic Planning
Financial Services
Demonstrates the unified approach of the firm, highlighting the integration of different business divisions to ensure client-centric service and strategic talent deployment.
Organizational Structure, Client-Centricity, Integration, Talent Deployment
false
Strategic Planning
Financial Services
Framework
Goldman Sachs
Add to my slides
Remove from favorites
Organizational chart of the SUB divisional management committee and ExB of Credit Suisse with individual roles.
Organizational Structure and Change
Financial Services
Displays the management structure of Credit Suisse’s SUB division, detailing the roles and responsibilities of each executive member.
Organizational structure, management committee, SUB, Credit Suisse, executives
false
Organizational Structure and Change
Financial Services
Diagram
Credit Suisse
Add to my slides
Remove from favorites
A central hexagon labeled "Engineering-centric organization" with arrows pointing to roles like CTO, CPO.
Organizational Structure and Change
Financial Services
Describes the roles and responsibilities within an engineering-centric organization, emphasizing transformation and execution.
organizational structure, transformation, engineering, roles, responsibilities
false
Organizational Structure and Change
Financial Services
Diagram
Credit Suisse
Add to my slides
Remove from favorites
Contains column charts representing origination costs and headcount, and green checkmarks for achieved milestones. The information is well-organized and clearly labeled.
Operational Efficiency
Financial Services
Outlines strategies and results for reducing origination costs in home lending. This slide can help in illustrating cost management success in the financial industry.
Origination Costs, Efficiency, Servicing Expenses, Home Lending
false
Operational Efficiency
Financial Services
Multiple Chart
JP Morgan
Add to my slides
Remove from favorites
Features dual-axis column charts showing origination volume in dark and light blue, with growth annotation. The right side has column charts depicting Home Lending ROE with a trend line indicating an increase.
Financial Performance
Financial Services
Displays growth in consumer originations and scaling of correspondent lending with a significant increase in ROE, highlighting the division’s strong financial performance over two years.
Origination Volume, Consumer, Correspondent, Return on Equity, Growth, Financial Performance
false
Financial Performance
Financial Services
Multiple Chart
JP Morgan
Add to my slides
Remove from favorites
This slide showcases dual column charts for global and Indian OTT market revenues from 2019 to 2024. The global market is indicated in gray, while India is highlighted in orange, showing rapid growth. Additionally, it features a line graph comparing subscription and transactional VOD market shares.
Market Analysis and Trends
Media & Entertainment
Highlights the dramatic growth of India's OTT market, positioning it as a significant player on the global stage by 2024. This slide is beneficial for discussions on market entry strategies, competitive analysis, and investment opportunities in India's burgeoning digital content market, emphasizing the shift towards subscription models.
OTT, market growth, India, global comparison
false
Market Analysis and Trends
Media & Entertainment
Multiple Chart
PwC/Strategy&
Add to my slides
Remove from favorites
Line graph depicting the growing percentage of OTT revenues within total TV revenues in Scandinavia from 2014 to 2023.
Market Analysis and Trends
Media & Entertainment
This slide illustrates the shift towards OTT platforms in Scandinavia, reflecting growing viewer preference for personalized entertainment.
OTT revenues, TV revenues, digital shift, Scandinavian market
false
Market Analysis and Trends
Media & Entertainment
Single Chart
PwC/Strategy&
Add to my slides
Remove from favorites
Features a bar chart showing the growth rates for different types of OTT video services in Hong Kong, Asia Pacific, and globally. Each region's growth is color-coded, with detailed percentages provided for subscription and transactional video on demand. The slide also includes a brief text summarizing the key points about market penetration and revenue sources for OTT services.
Market Analysis and Trends
Media & Entertainment
Highlights the comparative growth rates for OTT video services in Hong Kong, the Asia Pacific, and globally, emphasizing the slower growth in Hong Kong due to its smaller population size. The slide aims to provide insights into the development of digital media services and their varying adoption rates across different regions.
OTT, subscription growth, Hong Kong, Asia Pacific, global, bar chart, video on demand
false
Market Analysis and Trends
Media & Entertainment
Mixed Chart
PwC/Strategy&
Add to my slides
Remove from favorites
Contains a line chart comparing the revenue trends for traditional TV and OTT video in the Asia Pacific region, excluding Mainland China, from 2016 to 2025. The slide also features text discussing the impact of consumer behavior shifts and technological advancements on these media formats, particularly highlighting the influence of COVID-19 and 5G on market trends.
Market Analysis and Trends
Media & Entertainment
Offers a broader regional perspective on the growth of OTT video services compared to traditional TV, emphasizing the slow but steady increase in OTT revenues across the Asia Pacific region. This slide provides context for the larger shifts in media consumption patterns influenced by technological and societal changes.
OTT, traditional TV, Asia Pacific, revenue trends, growth, COVID-19, 5G, line chart
false
Market Analysis and Trends
Media & Entertainment
Mixed Chart
PwC/Strategy&
Add to my slides
Remove from favorites
Features a line chart depicting the declining revenue trend for traditional TV and the rising trend for OTT video in Hong Kong from 2016 to 2025. The slide also includes a column chart showing the number of households in Hong Kong subscribing to various TV services over the same period, highlighting the shift in consumer behavior towards digital streaming platforms.
Market Analysis and Trends
Media & Entertainment
Analyzes the shifting dynamics between traditional television and over-the-top (OTT) video services in Hong Kong, projecting that OTT will surpass traditional TV revenues by 2024. This slide is useful for understanding the impact of digital transformation on media consumption and the increasing preference for streaming services over traditional broadcast formats.
OTT, traditional TV, Hong Kong, revenue trends, line chart, bar chart, consumer behavior
false
Market Analysis and Trends
Media & Entertainment
Multiple Chart
PwC/Strategy&
Add to my slides
Remove from favorites
This slide includes a column chart and a pie chart detailing the revenue and market share of OTT video in Hong Kong and other leading regions globally. The bar chart displays the year-on-year revenue growth from 2018 to 2025, while the pie chart shows the global market share distribution among the US, Mainland China, Japan, and others for 2020.
Market Analysis and Trends
Media & Entertainment
Discusses the growth in revenue from over-the-top (OTT) media services and video games in Hong Kong, comparing it with global trends. The slide highlights the substantial impact of streaming and digital consumption habits that have been sustained post-lockdown periods, pointing out the robust growth in these entertainment sectors.
OTT, video games, Hong Kong, revenue growth, market share, global, bar chart, pie chart
false
Market Analysis and Trends
Media & Entertainment
Multiple Chart
PwC/Strategy&
Add to my slides
Remove from favorites
Displays column charts and pie charts analyzing the OTT video revenue by segment within Hong Kong and the Asia Pacific region, excluding Mainland China. The column charts compare revenue from subscription-based and transactional video on demand from 2019 to 2025, while the pie charts show the CAGR for these segments over the period 2021-2025.
Market Analysis and Trends
Media & Entertainment
The slide presents a detailed comparison of growth trends in the OTT video segments, specifically focusing on subscription and transactional models. It underscores the accelerated growth in Hong Kong's OTT video market compared to broader Asia Pacific trends, offering insights into consumer preferences and market dynamics.
OTT, video, growth trends, Hong Kong, Asia Pacific, CAGR, revenue, column chart, pie chart
false
Market Analysis and Trends
Media & Entertainment
Multiple Chart
PwC/Strategy&
Add to my slides
Remove from favorites
Bar chart showing growth rates across various media segments in the Scandinavian E&M market. Horizontal bars of varying lengths in red and gray, labeled with media types and their projected growth rates.
Market Analysis and Trends
Media & Entertainment
The slide highlights the projected growth rates of various media segments in the Scandinavian market, with OTT video and internet access showing the highest growth towards 2023.
OTT video, internet access, media growth, Scandinavian market, E&M industry
false
Market Analysis and Trends
Media & Entertainment
Single Chart
PwC/Strategy&
Add to my slides
Remove from favorites
Displays column charts showing global and Indian OTT video revenues from 2020 to 2025, with significant growth noted in India.
Market Analysis and Trends
Media & Entertainment
Highlights the booming growth of the OTT video segment, particularly in India, with detailed revenue projections up to 2025.
OTT video, revenue growth, India, global trends, 2025 forecast, digital content
false
Market Analysis and Trends
Media & Entertainment
Multiple Chart
PwC/Strategy&
Add to my slides
Remove from favorites
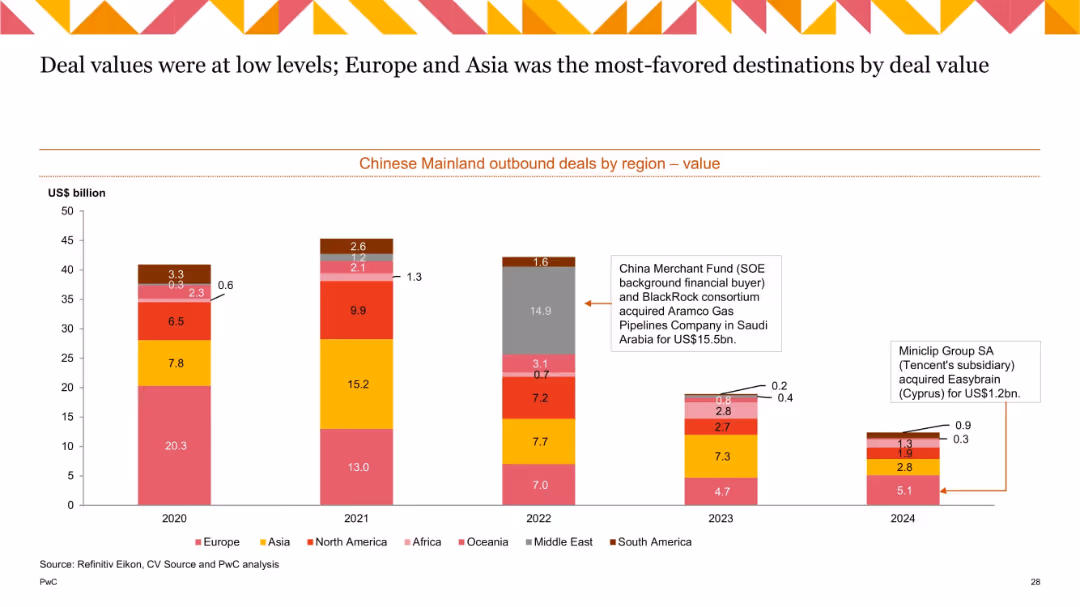
Stacked bar chart (2020–2024) showing deal values by destination region; includes notable deal annotations.
Market Analysis and Trends
Government & Public Sector
This slide displays the regional distribution of outbound Chinese deal values. Europe and Asia remained the preferred destinations. Despite overall low deal values, notable transactions such as China Merchant Fund’s and Tencent’s acquisitions are highlighted. The trend indicates targeted but fewer large transactions.
outbound deals, region analysis, Europe, Asia, China Merchant Fund, Tencent, M&A value, destination trends
false
Market Analysis and Trends
Government & Public Sector
Single Chart
PwC/Strategy&
Add to my slides
Remove from favorites
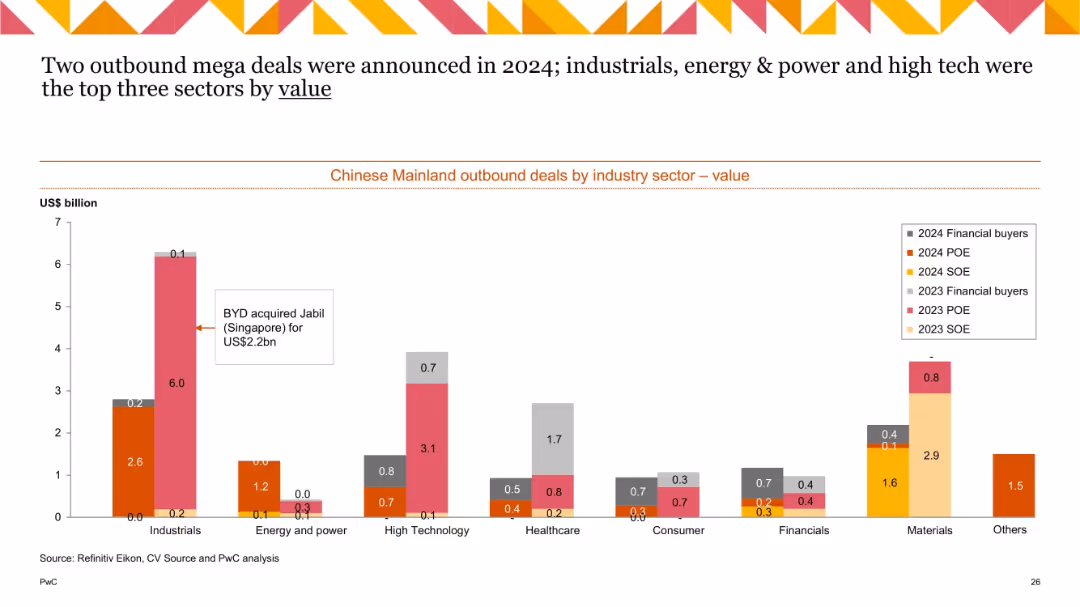
Stacked bar chart (2023 & 2024) showing industry-wise deal values by investor type. Callout highlights BYD acquisition.
Investment Analysis
Industrial & Manufacturing
The slide highlights deal values in outbound Chinese M&A by industry for 2023 and 2024, with a breakdown by investor type. Industrials lead due to a $2.2B mega-deal (BYD acquiring Jabil), followed by Energy & Power and High Technology. POEs and financial buyers are the main contributors in value.
outbound M&A, deal value, BYD acquisition, POE, financial buyer, industrials, high tech, China
false
Investment Analysis
Industrial & Manufacturing
Single Chart
PwC/Strategy&
Add to my slides
Remove from favorites
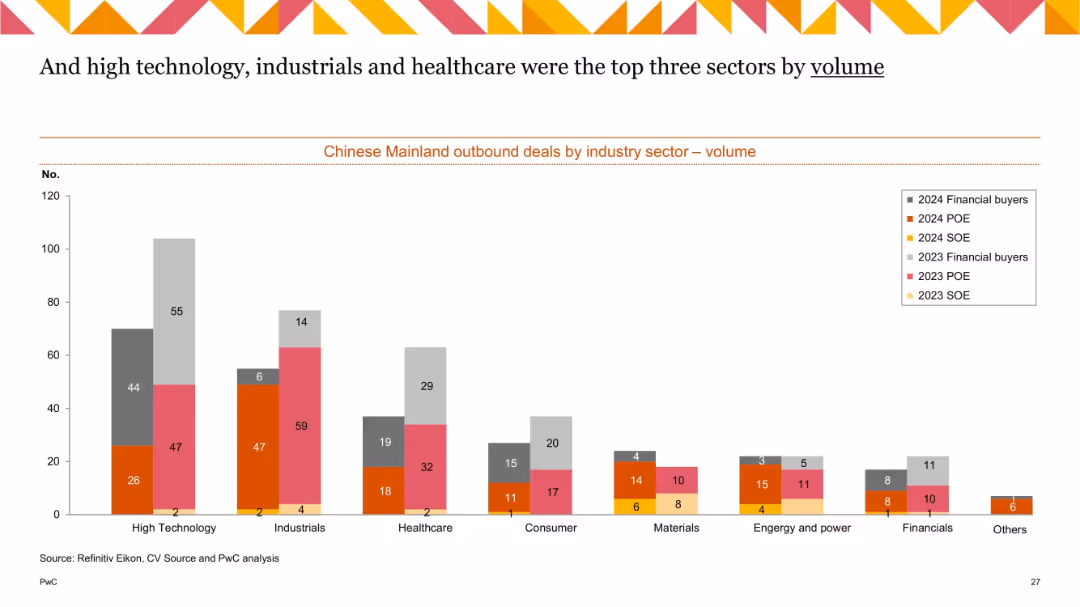
Stacked bar chart for 2023 & 2024 showing number of deals by industry and investor type.
Market Analysis and Trends
Industrial & Manufacturing
This slide compares outbound deal volumes by sector and investor type from China in 2023 and 2024. High Technology, Industrials, and Healthcare lead in number of transactions. Financial buyers and POEs dominate the deal counts, with SOE involvement being comparatively limited.
outbound M&A, deal volume, high tech, POE, financial buyer, sector analysis, industrial
false
Market Analysis and Trends
Industrial & Manufacturing
Single Chart
PwC/Strategy&
Add to my slides
Remove from favorites
Integrates a scatter plot correlating outbreak lengths with GDP forecasts, complemented by color-coded annotations.
Risk Assessment and Management
Professional Services
Correlates outbreak lengths with economic performance forecasts, providing insights into the impact of health crises on economies.
outbreak, GDP growth, economic performance, health crisis, forecast, correlation
false
Risk Assessment and Management
Professional Services
Single Chart
BCG
Add to my slides
Remove from favorites
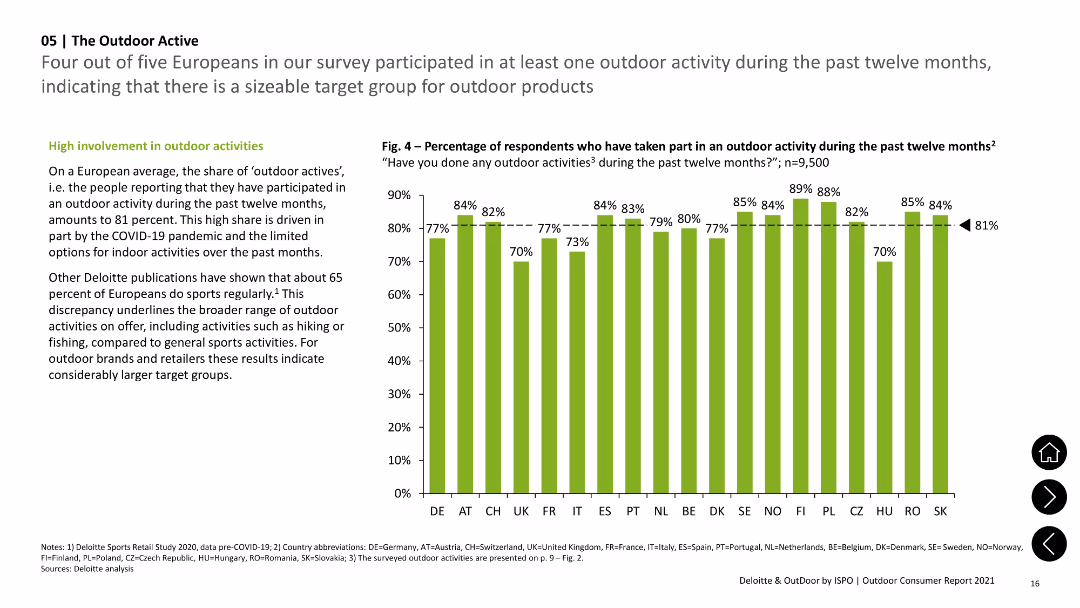
Features a column chart showing percentages of outdoor activity participation across various European countries with text summarizing high involvement in these.
Market Analysis and Trends
Consumer Goods
Shows the percentage of Europeans participating in outdoor activities, emphasizing high involvement rates and variation among countries.
Outdoor, Activities, Europe, Participation, Survey
false
Market Analysis and Trends
Consumer Goods
Mixed Chart
Deloitte
Add to my slides
Remove from favorites
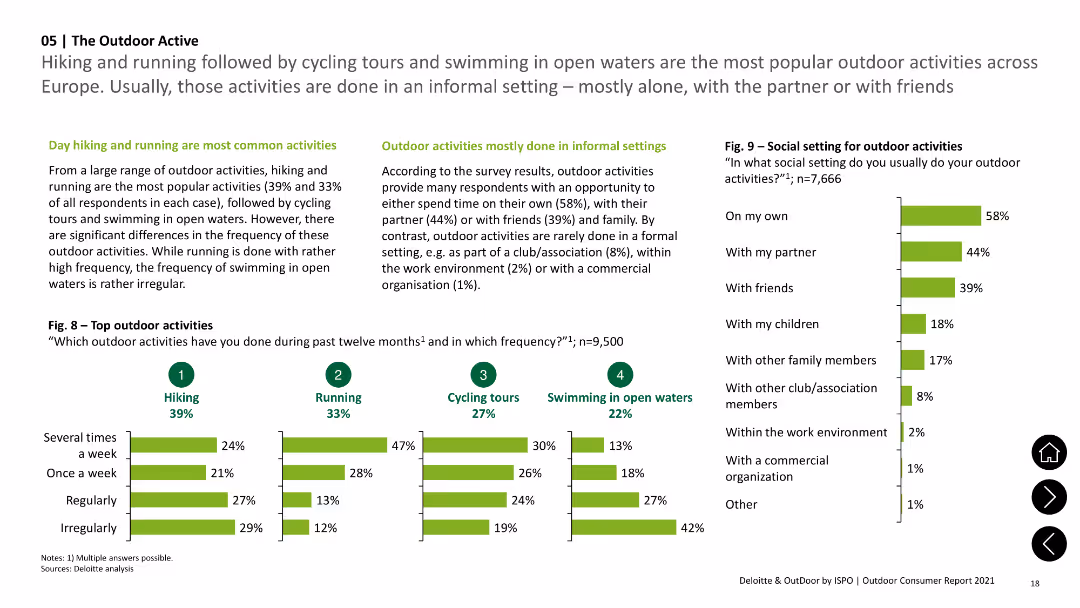
Column charts showing frequency of top outdoor activities like hiking, running, cycling, and swimming, with text describing informal settings of these activities.
Market Analysis and Trends
Consumer Goods
Highlights popular outdoor activities, including hiking and running, and their frequency. Notes that most activities are done informally.
Outdoor, Activities, Hiking, Running, Frequency
false
Market Analysis and Trends
Consumer Goods
Multiple Chart
Deloitte
Add to my slides
Remove from favorites
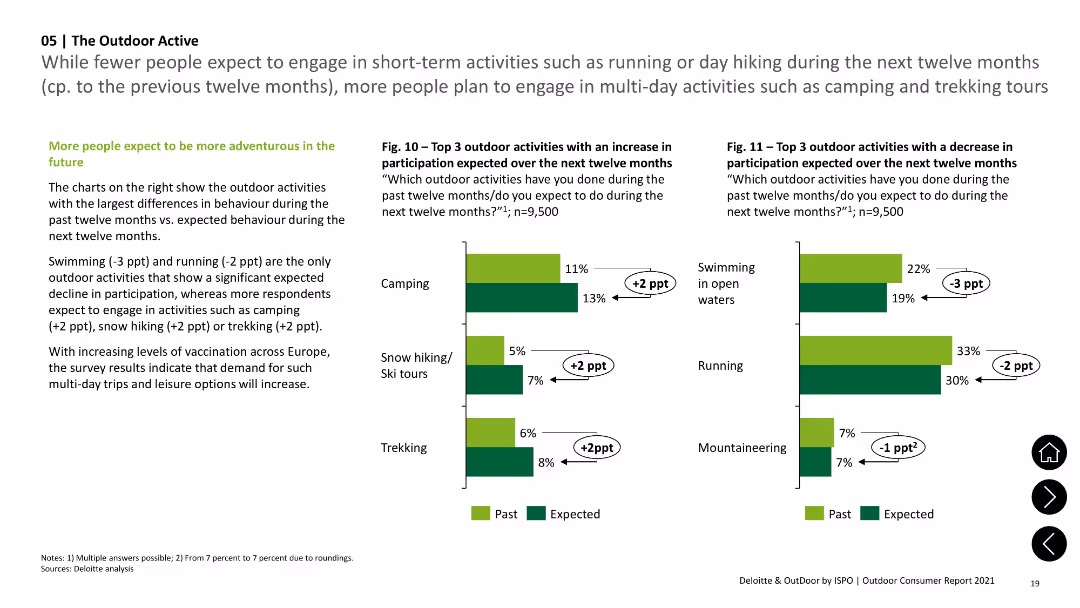
Column charts indicating past vs. expected future participation in various outdoor activities, with notes on changes in adventure expectations.
Market Analysis and Trends
Consumer Goods
Compares past participation rates in outdoor activities with future expectations, noting increases in camping and trekking.
Outdoor, Future, Camping, Trekking, Participation
false
Market Analysis and Trends
Consumer Goods
Multiple Chart
Deloitte
Add to my slides
Remove from favorites
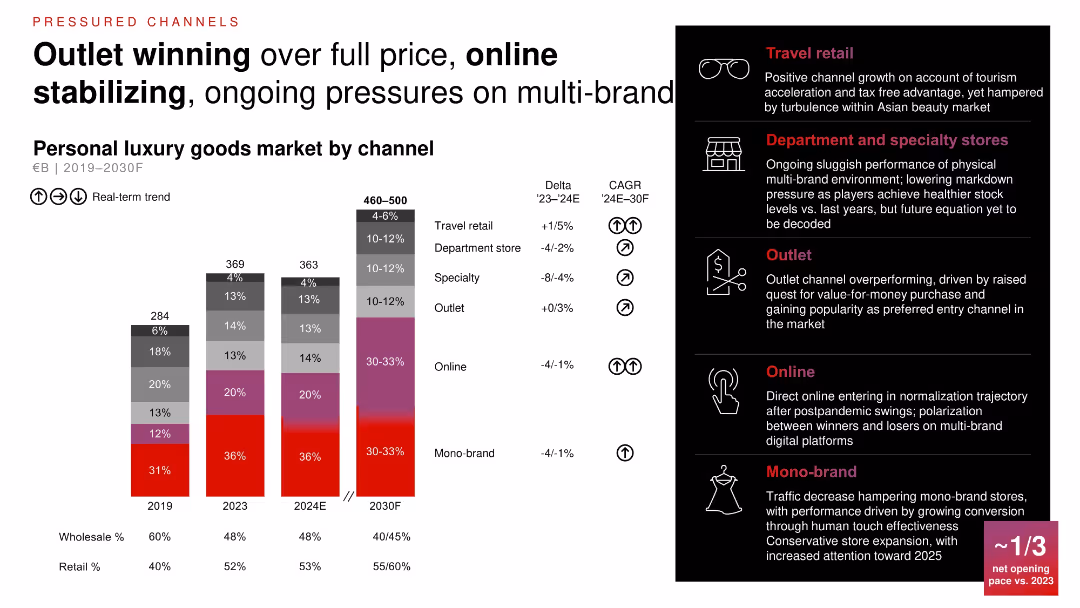
Bar graph comparing channel mix (2019–2030F); right-side summary of retail channel trends with icons and CAGR insights; color-coded segments for different channels.
Product and Service Analysis
Consumer Goods
The slide shows ongoing changes in luxury goods channels, with outlets gaining over full-price and online stabilizing. It analyzes shifts across travel retail, department stores, mono-brand stores, and digital channels, forecasting future trends.
outlet growth, online stabilization, retail channels, mono-brand, travel retail, market forecast
false
Product and Service Analysis
Consumer Goods
Mixed Chart
Bain
Add to my slides
Remove from favorites
Line chart comparing DURAVYU 2.7mg (excluding outlier) vs. aflibercept across 24 weeks. Annotated visual highlights the +2.8 mean difference.
Product and Service Analysis
Healthcare & Pharmaceuticals
Shows enhanced visual acuity (+10.1 letters) when excluding one outlier in the DURAVYU 2.7mg group, improving its margin over aflibercept. Supports stronger efficacy claims by removing statistical noise caused by a missed visit.
outlier exclusion, BCVA, DURAVYU, vision improvement, clinical data
false
Product and Service Analysis
Healthcare & Pharmaceuticals
Single Chart
Goldman Sachs
Add to my slides
Remove from favorites
Two-column layout with titles, bullet points, and a color block separating two categories. No charts or graphs present.
Financial Performance
Financial Services
The slide compares the short-term financial outlook of annuity-style and market-facing businesses, detailing factors impacting their performance. It serves to inform stakeholders about the anticipated financial results and business operations for the immediate future.
outlook, financial, comparison, annuity, market-facing
false
Financial Performance
Financial Services
Table
Morgan Stanley
Add to my slides
Remove from favorites
The slide consists of a combination of textual analysis and line graphs, with a clear separation of topics. The color-coded lines represent interest rate projections, providing a straightforward comparison.
Strategic Planning
Financial Services
This slide delivers a forecast on interest rates and market conditions, likely aimed at strategizing for future market movements. The content is critical for financial planning and forecasting, intended to inform decision-making in financial services.
Outlook, Interest Rates, Market, Forecast
false
Strategic Planning
Financial Services
Mixed Chart
Morgan Stanley
Add to my slides
Remove from favorites
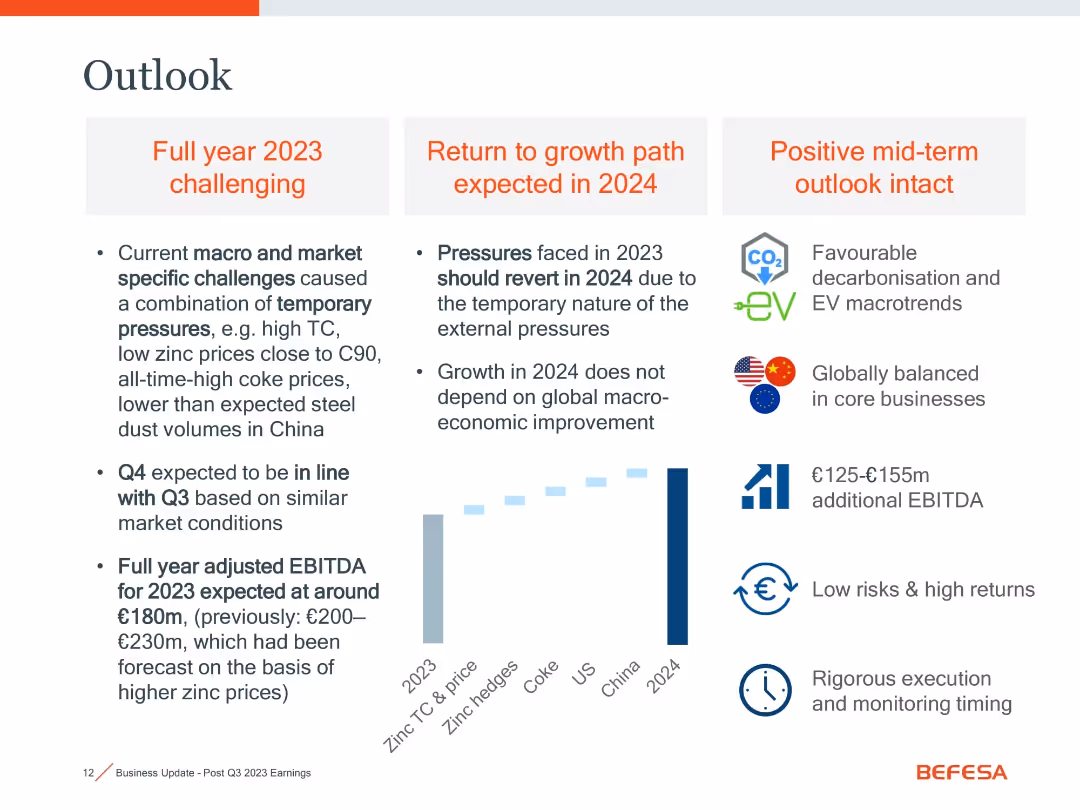
Three-column layout (2023 challenges, 2024 recovery, mid-term positives) with icons and summary bullets
Strategic Planning
Industrial & Manufacturing
Outlines 2023 pressures (e.g., low zinc prices, high TC), expected 2024 recovery, and positive mid-term outlook supported by decarbonization trends and operational rigor. EBITDA forecast adjusted to €180m.
outlook, zinc prices, 2024 recovery, decarbonization, macro challenges
false
Strategic Planning
Industrial & Manufacturing
Mixed Chart
Goldman Sachs
Add to my slides
Remove from favorites
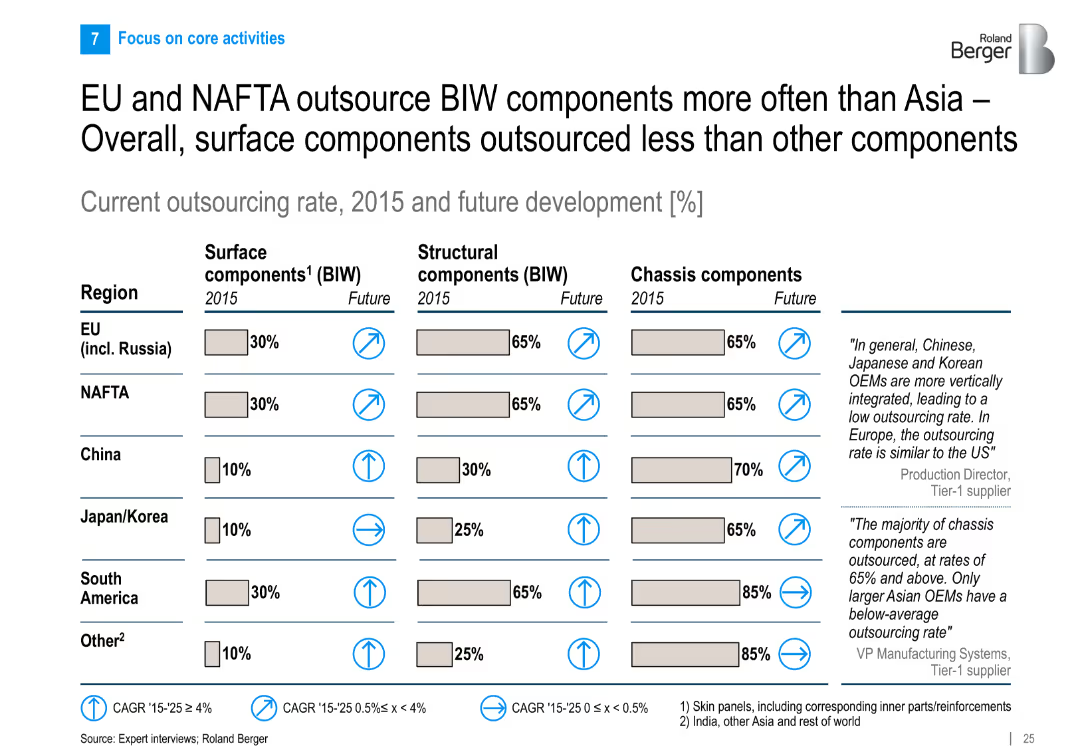
Table comparing outsourcing rates of surface, structural, and chassis components by region in 2015 and expected future; includes expert quotes
Strategic Planning
Industrial & Manufacturing
Details regional differences in BIW component outsourcing, noting that EU and NAFTA outsource more than Asia. Also forecasts growth in outsourcing, with expert insights on OEM strategies and vertical integration.
outsourcing, BIW components, EU, NAFTA, China, structural parts, surface components, chassis
false
Strategic Planning
Industrial & Manufacturing
Multiple Chart
Roland Berger
Add to my slides
Remove from favorites
This slide shows a combination of text and a column chart. The text explains the rationale for outsourcing, and the chart lists various capabilities being outsourced by percentage.
Operational Efficiency
Financial Services
The slide describes how APAC family offices are outsourcing capabilities like tax, risk, and technology to manage external demands and improve in-house capabilities.
outsourcing, capabilities, APAC, family offices, external expertise
false
Operational Efficiency
Financial Services
Mixed Chart
EY
Add to my slides
Remove from favorites
A content slide with text on the left and a column chart on the right. The chart highlights risk management roles and functions with potential for outsourcing.
Operational Efficiency
Financial Services
This slide discusses the potential for outsourcing and co-sourcing in risk management, identifying key functions that could benefit from these strategies.
outsourcing, co-sourcing, risk management, functions, strategies
false
Operational Efficiency
Financial Services
Multiple Chart
EY
Add to my slides
Remove from favorites
This slide includes a column chart with past, present, and projected future data points comparing the extent of outsourcing in digital marketing. It uses a clean and straightforward design, employing contrasting colors to differentiate between the time frames and sectors involved. Additional text provides context and insights related to the chart.
Customer and Market Segmentation
Professional Services
Analyzing the role of external agencies in digital marketing, this slide provides data on outsourcing trends across different sectors. It is relevant for evaluating and planning digital marketing strategies, particularly the decision to in-source versus outsource elements of digital campaigns.
outsourcing, digital marketing, sector comparison, future trends, agencies
false
Customer and Market Segmentation
Professional Services
Mixed Chart
Deloitte
Add to my slides
Remove from favorites
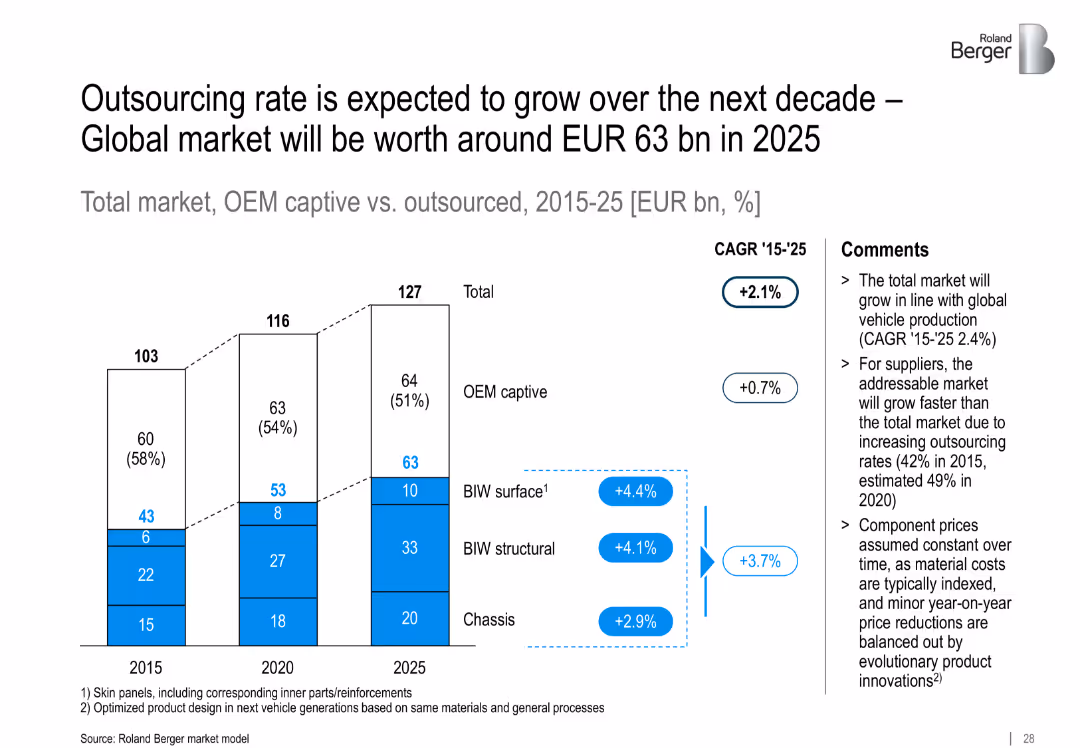
Vertical stacked bar chart with three grouped columns (2015, 2020, 2025) showing OEM captive vs. outsourced market components. Includes CAGR labels and comment section.
Market Analysis and Trends
Industrial & Manufacturing
The slide forecasts growth in outsourcing within the automotive body and chassis market. It predicts OEM captive shares will decline while outsourced market grows, driven by cost and efficiency pressures.
outsourcing, OEM, market growth, automotive, BIW, chassis, CAGR, supplier market, Roland Berger
false
Market Analysis and Trends
Industrial & Manufacturing
Mixed Chart
Roland Berger
Add to my slides
Remove from favorites
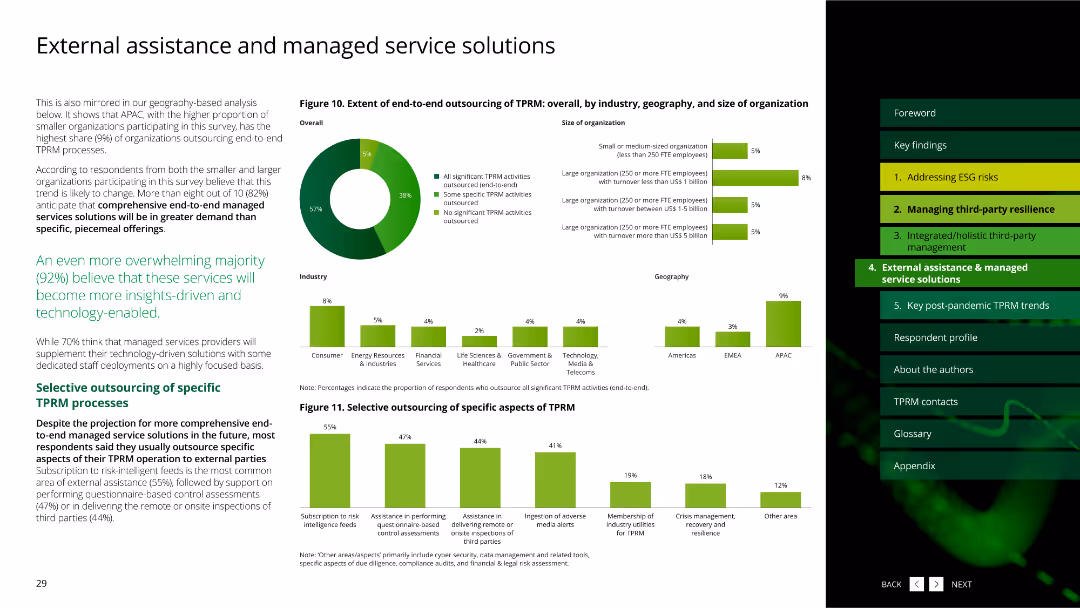
This slide includes a pie chart and multiple column charts with green bars, showing the extent of outsourcing in third-party risk management (TPRM) by various segments.
Strategic Planning
Professional Services
The slide discusses the extent of end-to-end outsourcing of TPRM processes, highlighting the differences across industries, geographies, and organization sizes.
outsourcing, third-party risk management, pie chart, column charts, industries, professional services
false
Strategic Planning
Professional Services
Multiple Chart
Deloitte
Add to my slides
Remove from favorites
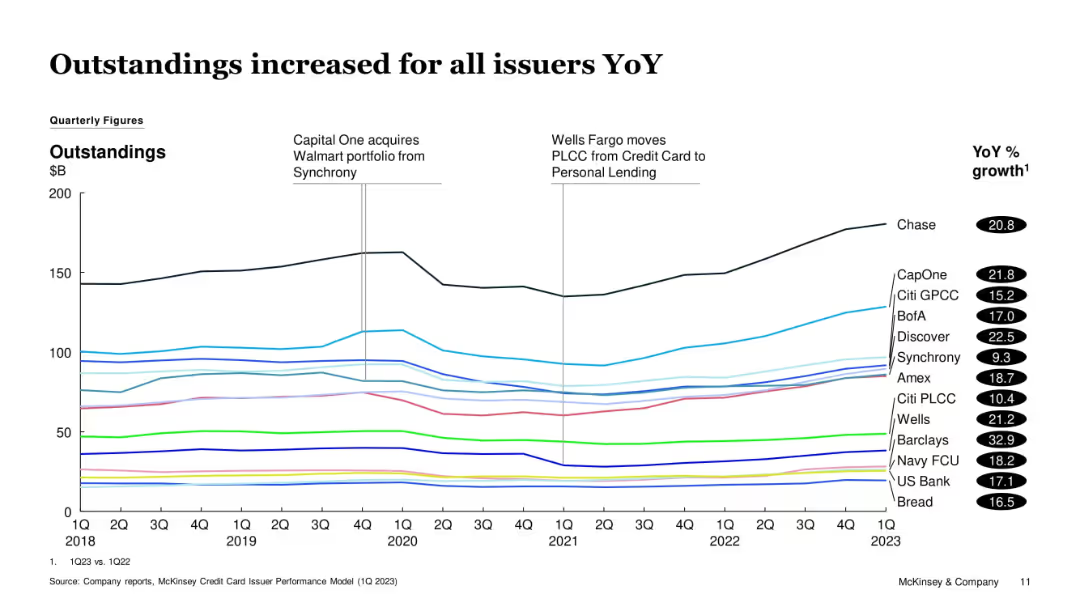
Line graph with multiple issuer lines showing quarterly credit card outstandings from 2018 to 1Q23. Vertical markers highlight key events. YoY % growth listed in black ovals on the right.
Financial Performance
Financial Services
The slide shows year-over-year growth in credit card outstandings for various issuers, with all showing increases. Chase, Capital One, and Discover led in volume. Major events like portfolio acquisitions and PLCC transitions are annotated.
Outstandings, Credit, Issuers, Growth, Chase, Capital One, Discover, Synchrony, Citi, Quarterly
false
Financial Performance
Financial Services
Single Chart
McKinsey
Add to my slides
Remove from favorites
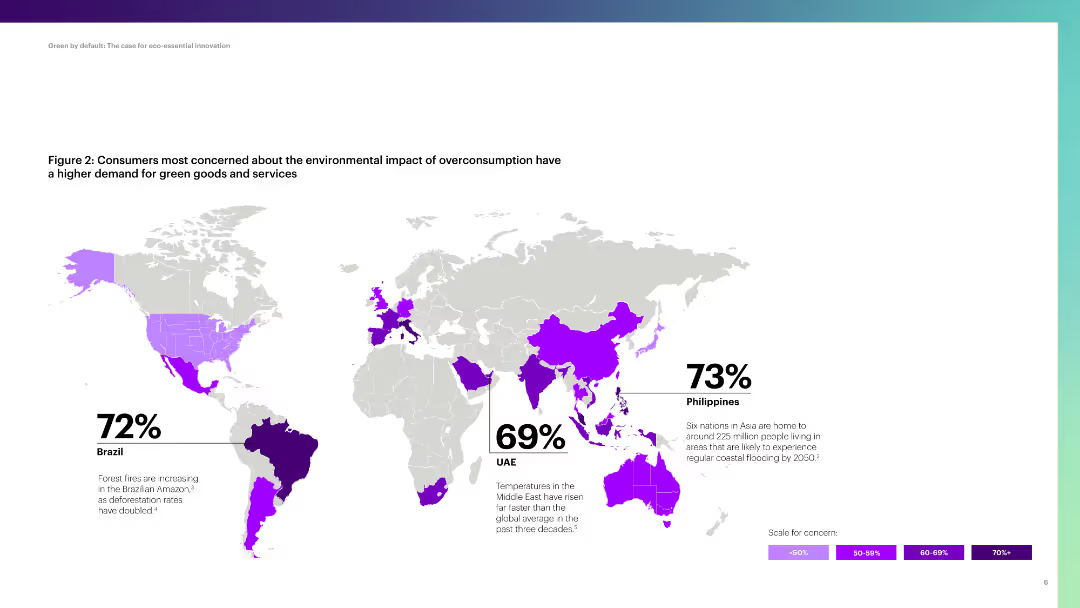
World map highlighting countries with high concern about overconsumption and demand for green goods, with Brazil, UAE, and Philippines featured.
Customer and Market Segmentation
Environmental Services & Sustainability
The slide shows global consumer concerns about overconsumption and the demand for green products, focusing on key countries.
overconsumption, green goods, demand, Brazil, UAE, Philippines, sustainability
false
Customer and Market Segmentation
Environmental Services & Sustainability
Graphic
Accenture
Add to my slides
Remove from favorites
The slide features a large column chart on the left, a central section with color-coded contributing factors, and a final column chart on the right, providing a clear comparison of overhead ratios over time.
Operational Efficiency
Financial Services
Demonstrates the improvement in the overhead ratio at JPMorgan Chase & Co., driven by various factors, meant for showcasing efficiency gains to investors.
overhead ratio, efficiency, revenue growth, JPMorgan, investment, expense
false
Operational Efficiency
Financial Services
Single Chart
JP Morgan
Add to my slides
Remove from favorites
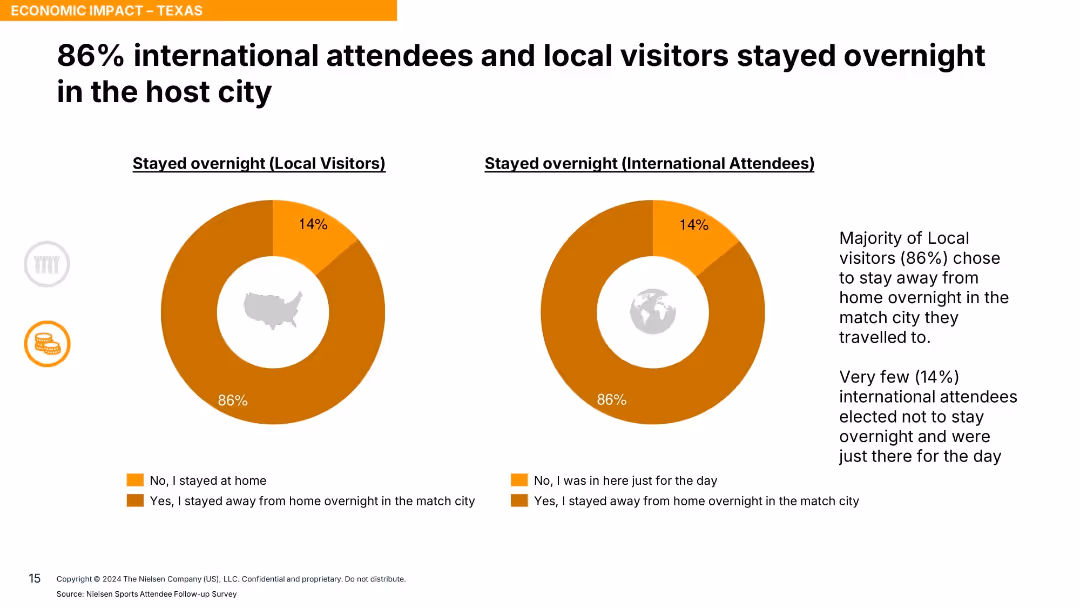
Two donut charts for local and international visitors with orange segments and supporting commentary on the right.
Market Analysis and Trends
Hospitality & Tourism
The slide reveals that 86% of both local and international attendees stayed overnight in the host city, indicating strong engagement and economic contribution through lodging.
overnight stays, lodging, event tourism, visitor behavior, accommodation, Texas, economic impact
false
Market Analysis and Trends
Hospitality & Tourism
Single Chart
Nielsen
Add to my slides
Remove from favorites
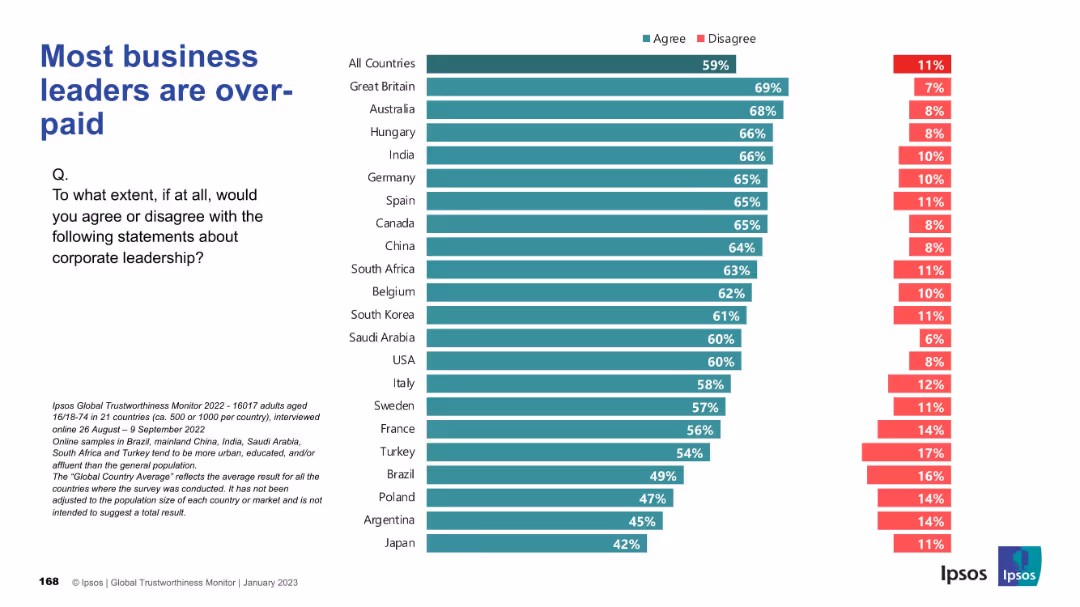
Horizontal bar chart slide with agree/disagree colored bars by country; consistent design style with teal and red bars; left-aligned title and survey question.
Human Resources and Talent Management
Financial Services
Public sentiment on executive compensation is highlighted, with the majority agreeing that business leaders are overpaid. The perception is consistent globally, especially strong in the UK and Australia.
overpaid, executive compensation, HR, inequality, corporate leadership, public opinion, Ipsos, remuneration
false
Human Resources and Talent Management
Financial Services
Mixed Chart
IPSOS
Add to my slides
Remove from favorites
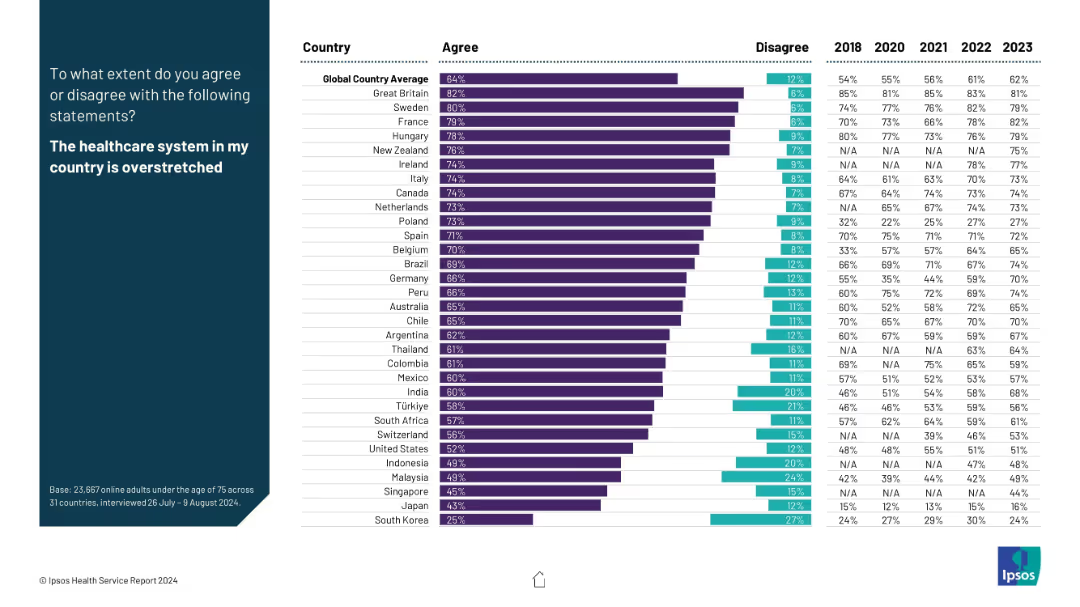
Bar chart comparing agreement and disagreement percentages with the statement across countries; time trend shown at right.
Risk Assessment and Management
Healthcare & Pharmaceuticals
This slide explores public sentiment about healthcare system capacity. Countries like the UK, Sweden, and France report very high agreement that systems are overstretched. The chart helps identify systemic pressure points globally.
overstretched healthcare, system capacity, perception, strain, survey
false
Risk Assessment and Management
Healthcare & Pharmaceuticals
Mixed Chart
IPSOS
Add to my slides
Remove from favorites
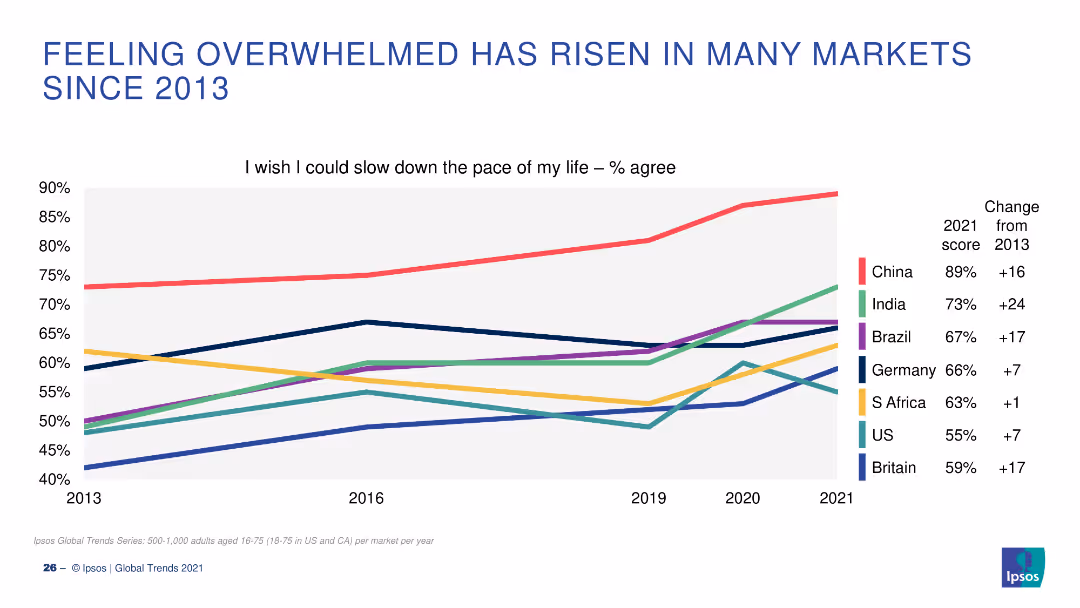
A line graph showing the percentage of people who wish they could slow down the pace of their lives, with data from 2013 to 2021 for several countries.
Market Analysis and Trends
Healthcare & Pharmaceuticals
The slide depicts the increasing trend of people feeling overwhelmed and wishing to slow down their lives in various markets from 2013 to 2021.
Overwhelmed, Life Pace, Trends, Markets, Countries
false
Market Analysis and Trends
Healthcare & Pharmaceuticals
Single Chart
IPSOS
Add to my slides
Remove from favorites
The slide features a text box on the left discussing firm ownership, with two column charts on the right showing ownership distribution among different groups for hedge funds and private equity.
Human Resources and Talent Management
Financial Services
This slide describes the ownership structure of firms in the financial services industry, focusing on the role of founders and other stakeholders in hedge funds and private equity firms.
ownership, founders, hedge funds, private equity, stakeholders
false
Human Resources and Talent Management
Financial Services
Multiple Chart
EY
Add to my slides
Remove from favorites
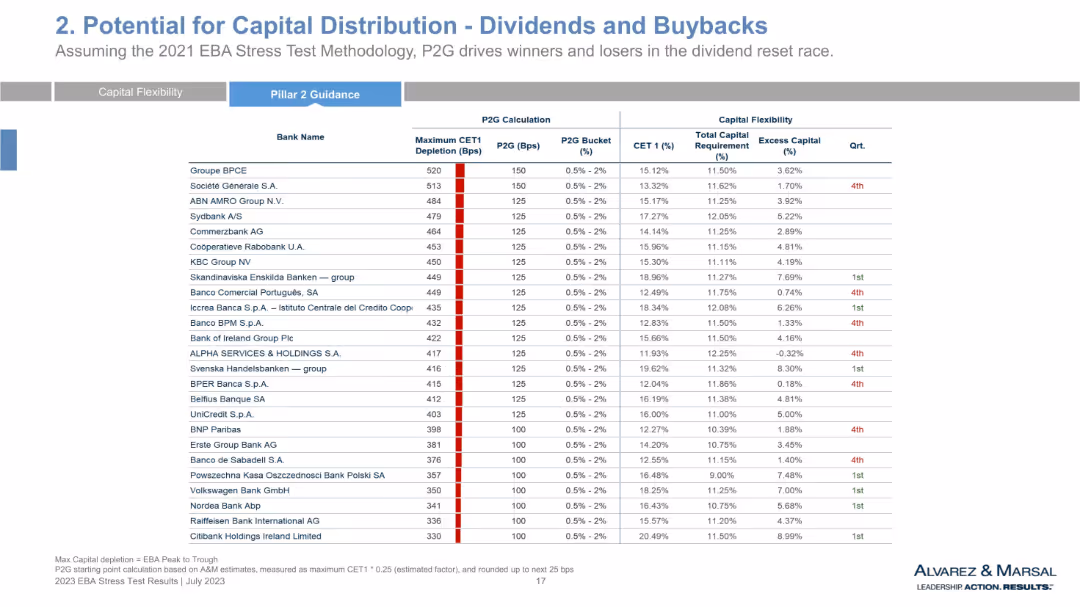
Continuation of previous table with more banks, keeping same structure—depletion, guidance, and capital ratios.
Regulatory and Compliance
Financial Services
This slide extends the bank-by-bank capital flexibility analysis, focusing on CET1 depletion and P2G designations. It continues the quartile categorization and highlights banks with high or low resilience in capital allocation. Key comparisons inform regulatory outcomes and dividend planning.
P2G analysis, CET1 depletion, stress testing, ECB regulation, capital excess, quartile, financial resilience
false
Regulatory and Compliance
Financial Services
Single Chart
Alvarez & Marsal
Add to my slides
Remove from favorites
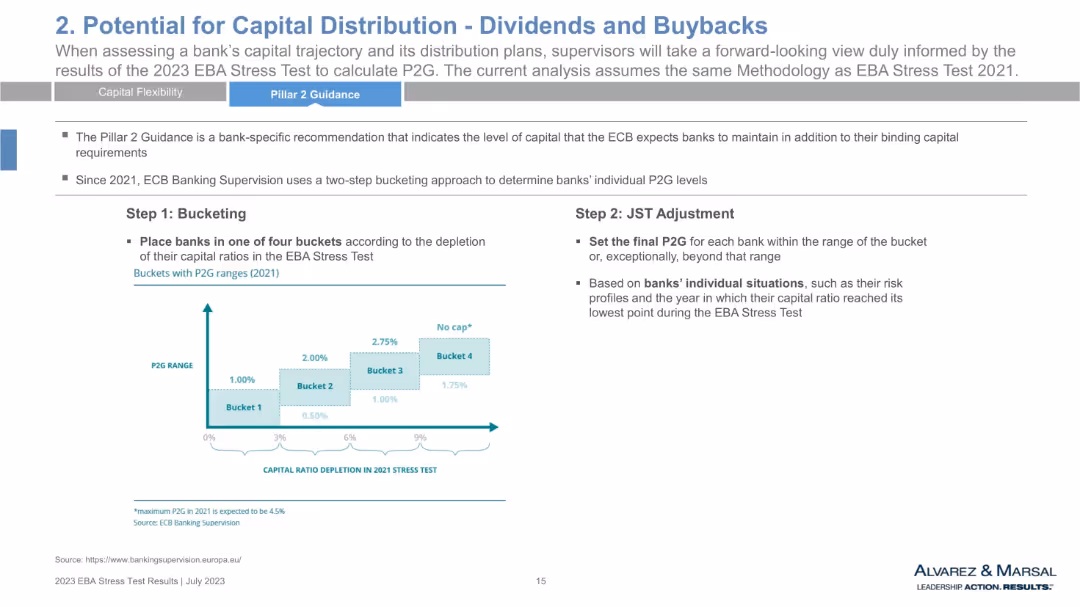
Split two-column layout with text and a graphical step model chart. Describes ECB bucketing and adjustment methodology.
Regulatory and Compliance
Financial Services
This slide explains how the ECB sets Pillar 2 Guidance (P2G) using a two-step approach. Step 1 places banks into capital depletion buckets, and Step 2 involves JST adjustments based on individual risk profiles. The goal is to establish P2G expectations post-stress test, influencing bank capital requirements and supervisory decisions.
P2G, ECB, Pillar 2 Guidance, stress test, JST, capital buckets, capital regulation, supervision, EBA methodology
false
Regulatory and Compliance
Financial Services
Mixed Chart
Alvarez & Marsal
Add to my slides
Remove from favorites
The slide includes a map of Europe highlighting various Power-to-gas projects, along with a table detailing project names, production capacities, storage and injection methods, end-use applications, and budgets.
Investment Analysis
Energy & Utilities
This slide presents an overview of ongoing Power-to-gas projects in Europe, showcasing their objectives, capacities, and funding. It aims to demonstrate the viability and investment potential of Power-to-gas technology.
P2G projects, Europe, investment, hydrogen, technology viability
false
Investment Analysis
Energy & Utilities
Graphic
Kearney
Add to my slides
Remove from favorites
The slide presents text descriptions of the key advantages of P2G, supported by a bar chart showing 2050 P2G potential in TWh for France.
Technology and Digital Transformation
Energy & Utilities
This slide discusses the benefits of Power-to-gas (P2G) for integrating renewable energy into the electricity grid. It highlights advantages like energy storage and transport, and projects P2G potential for the year 2050.
P2G, renewable energy, electricity grid, energy storage, 2050 potential
false
Technology and Digital Transformation
Energy & Utilities
Mixed Chart
Kearney
Add to my slides
Remove from favorites
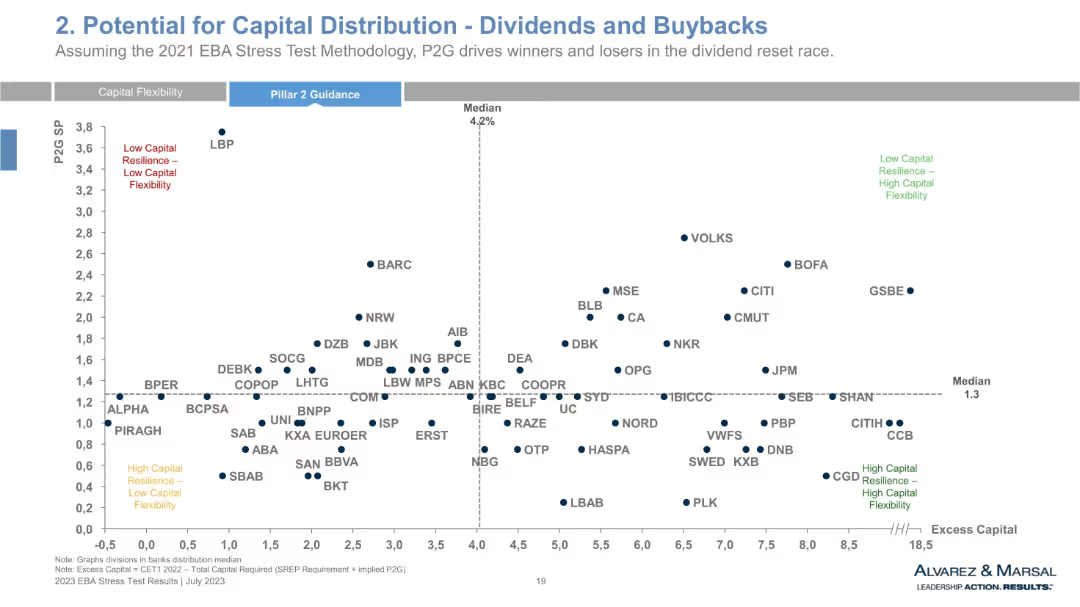
Scatter plot with P2G Spread vs. Excess Capital, divided into four quadrants. Each dot represents a bank. Median lines mark division axes.
Strategic Planning
Financial Services
This scatter plot visualizes the tradeoff between banks' excess capital and P2G spread. It categorizes institutions into four zones—highlighting strengths and vulnerabilities in capital flexibility and resilience. The layout helps stakeholders identify which banks are well-positioned for distributions and which may face regulatory constraints.
P2G spread, excess capital, stress test, capital resilience, quadrant chart, CET1, financial strength, risk-adjusted performance
false
Strategic Planning
Financial Services
Single Chart
Alvarez & Marsal
Add to my slides
Remove from favorites
A line chart presents EPEX spot prices for selected countries (France, Germany, DK1, NO2, SE3), showing prices over 1,000 hours per year. The graph highlights the price peaks for wind and solar in 2030.
Market Analysis and Trends
Energy & Utilities
The slide discusses the opportunistic selling of P2P electricity in the spot market, noting that prices exceed the levelized cost of energy (LCOE) less than 1% of the time.
P2P, electricity, spot market, EPEX, LCOE, prices, wind, solar, energy, storage
false
Market Analysis and Trends
Energy & Utilities
Mixed Chart
Kearney
Add to my slides
Remove from favorites
A column chart displays the levelized cost of electricity from power-to-power (P2P) for different energy sources (wind, solar, grid wind, grid solar) over different power capacities (1 MW, 10 MW, 100 MW).
Market Analysis and Trends
Energy & Utilities
The slide compares the cost of energy from different P2P sources over time. It highlights the variability in cost from $180 to $270 per MWhe by 2030, focusing on storage and infrastructure costs.
P2P, energy, levelized cost, electricity, storage, infrastructure, wind, solar, grid
false
Market Analysis and Trends
Energy & Utilities
Multiple Chart
Kearney
Add to my slides
Remove from favorites
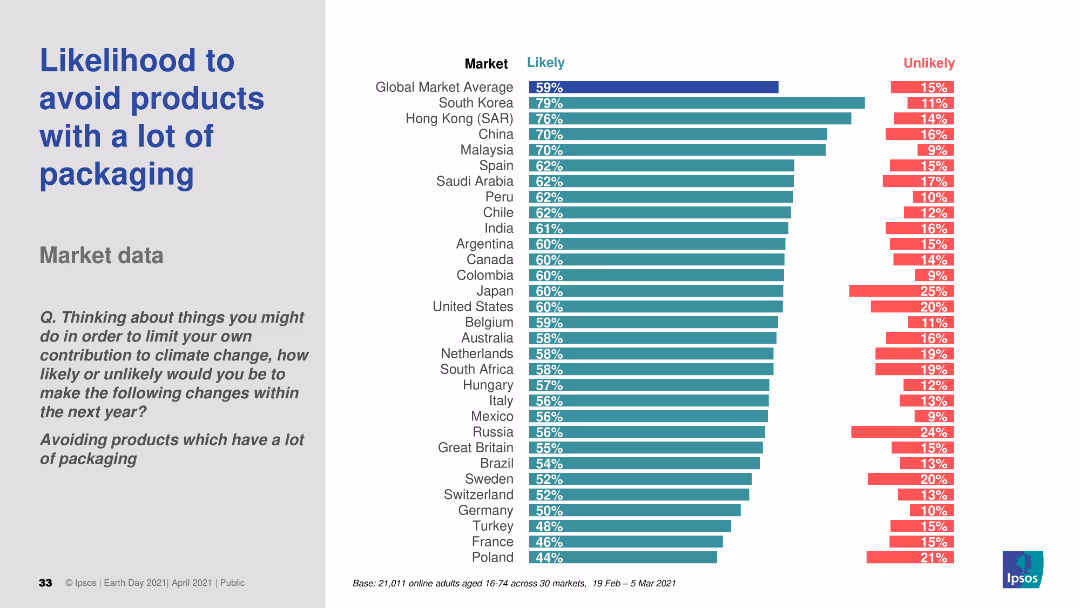
The slide features a column chart showing the likelihood of avoiding products with a lot of packaging across various markets. It uses two colors to indicate "Likely" and "Unlikely." The text includes a question and survey details.
Market Analysis and Trends
Environmental Services & Sustainability
The slide presents survey data on the likelihood of avoiding products with excessive packaging, comparing responses across different global markets.
packaging, avoidance, likelihood, survey, environmental impact
false
Market Analysis and Trends
Environmental Services & Sustainability
Multiple Chart
IPSOS
Add to my slides
Remove from favorites
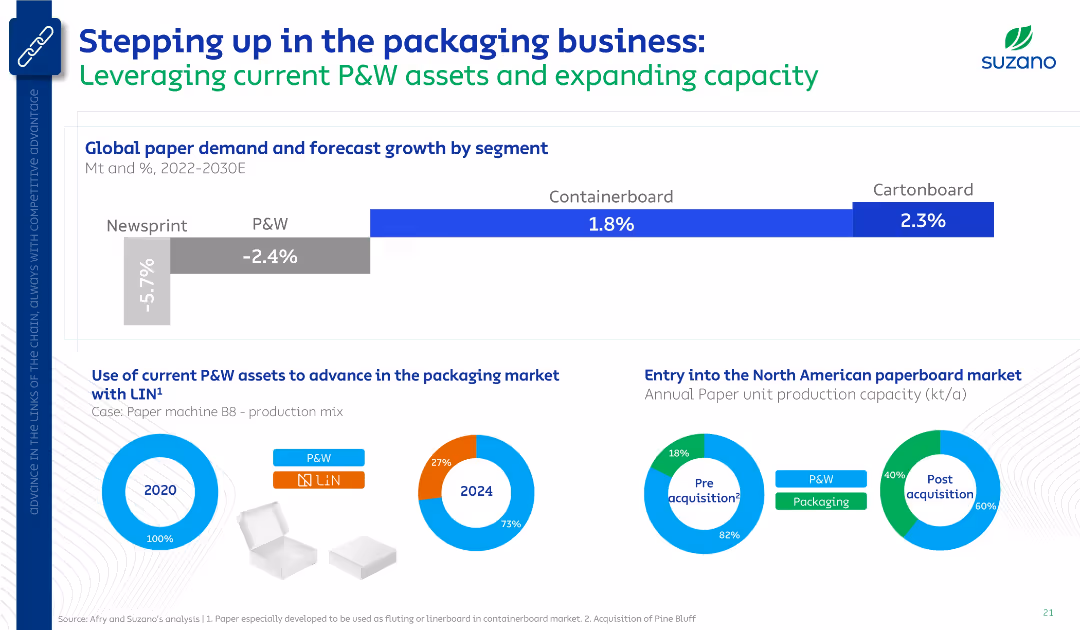
Balanced layout with a growth forecast bar chart and pie charts showing shift in production mix pre- and post-acquisition. Emphasizes strategy in packaging markets.
Strategic Planning
Industrial & Manufacturing
Illustrates Suzano’s strategic pivot from P&W to packaging by reallocating production capacity and acquiring new assets. Forecast shows containerboard and cartonboard segments growing through 2030, while P&W shrinks.
packaging, P&W, containerboard, production shift, Suzano, acquisition
false
Strategic Planning
Industrial & Manufacturing
Multiple Chart
Goldman Sachs
Add to my slides
Remove from favorites
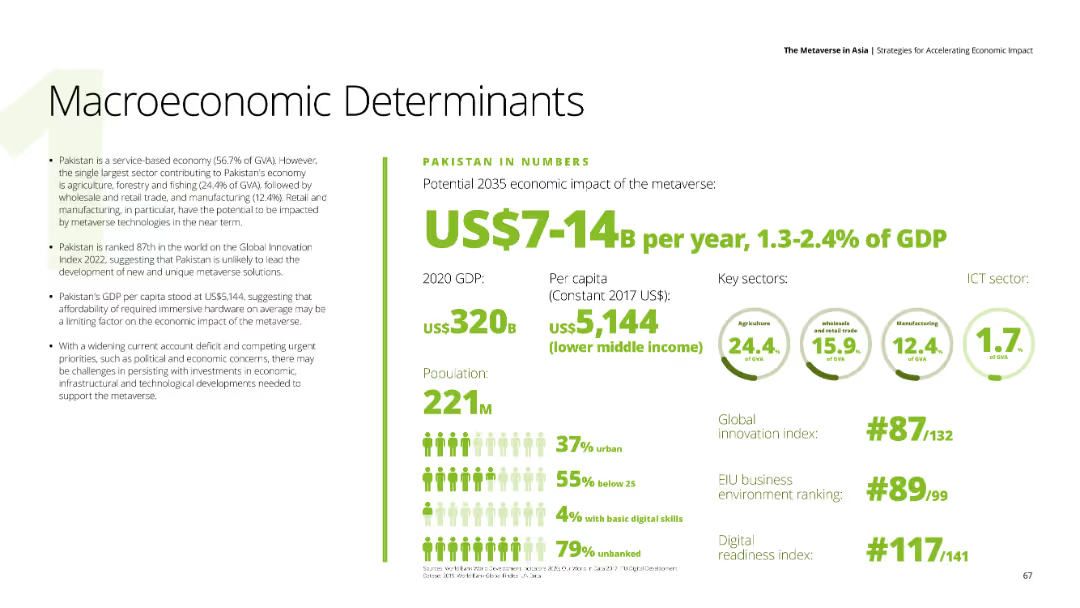
Presents text about Pakistan's economic impact of the metaverse, with data on GDP, per capita income, and key sectors like agriculture, wholesale trade, and manufacturing. The background is white with green and black text.
Market Analysis and Trends
Financial Services
Evaluates Pakistan's economic outlook regarding the metaverse, mentioning GDP, innovation index ranking, and challenges such as political and economic concerns.
Pakistan, metaverse, economic impact, agriculture, innovation
false
Market Analysis and Trends
Financial Services
Mixed Chart
Deloitte
Add to my slides
Remove from favorites
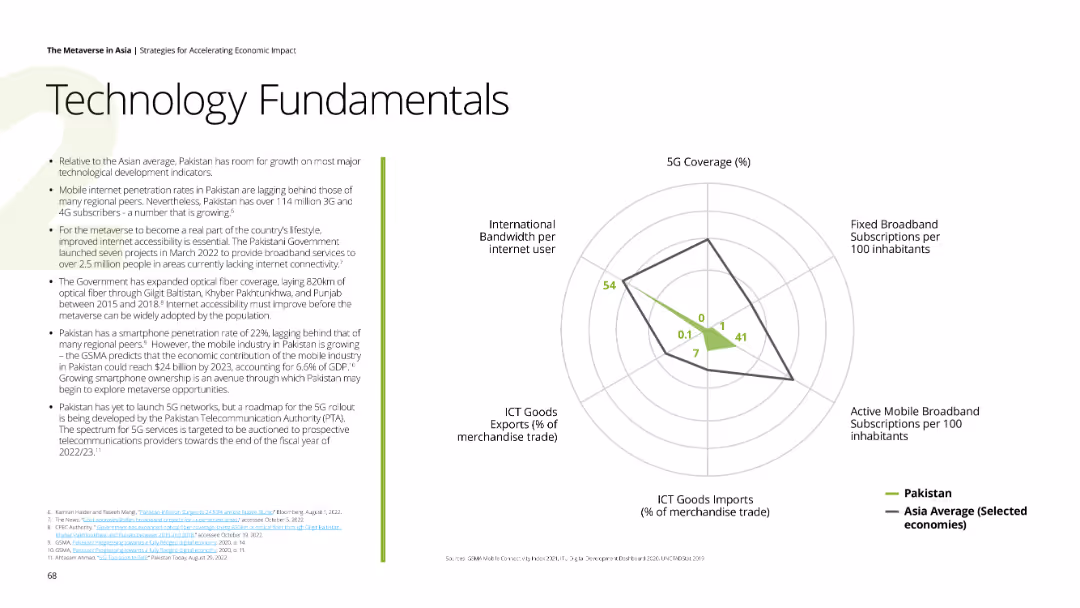
Contains a spider chart comparing Pakistan's 5G coverage, broadband subscriptions, mobile broadband subscriptions, ICT goods imports, and international bandwidth per internet user with Asia average. The background is white, and accents are green.
Technology and Digital Transformation
Technology & Software
Reviews Pakistan's ICT development indicators, highlighting the growth in mobile and broadband subscriptions, and the impact of government initiatives on digital infrastructure.
Pakistan, technology, 5G, broadband, digital infrastructure
false
Technology and Digital Transformation
Technology & Software
Mixed Chart
Deloitte
Add to my slides
Remove from favorites
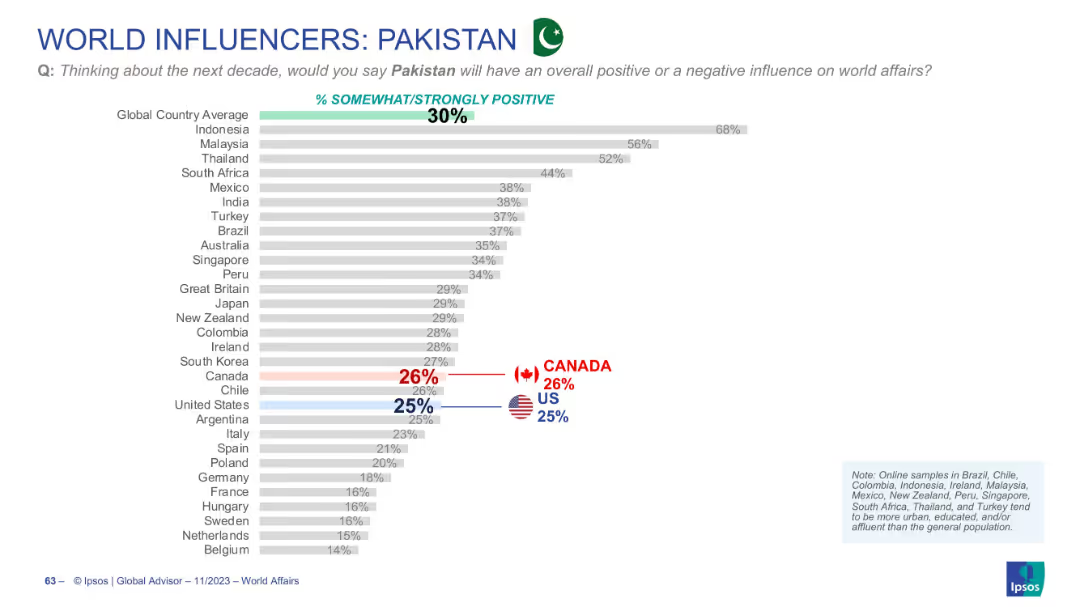
Horizontal bar chart showing approval ratings of Pakistan’s influence by country, including US and Canada in red and blue.
Market Analysis and Trends
Government & Public Sector
This slide shows that 30% of global respondents view Pakistan’s influence positively. Support is strongest in Indonesia, and weakest in North America and parts of Europe.
Pakistan, world opinion, positive influence, Ipsos, geopolitical perception, bar chart
false
Market Analysis and Trends
Government & Public Sector
Single Chart
IPSOS
Add to my slides
Remove from favorites
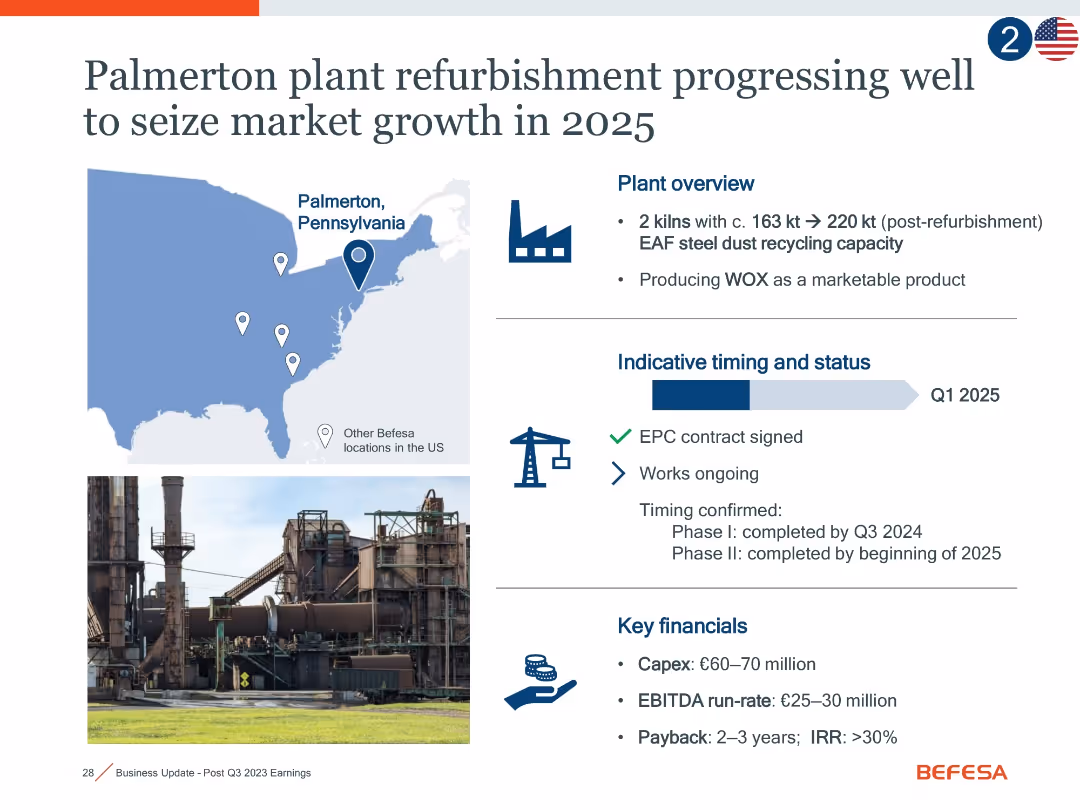
Combination of map, timeline, and financial infographic; includes icons for progress, a photo of the plant, and milestone details.
Operational Efficiency
Industrial & Manufacturing
This slide details the Palmerton, PA plant refurbishment, highlighting expanded capacity, project timing (Q1 2025), signed contracts, and projected returns. It emphasizes growth potential and efficiency improvements with expected EBITDA of €25–30m and IRR >30%.
Palmerton, refurbishment, EAF, WOX, EBITDA, market growth, capacity
false
Operational Efficiency
Industrial & Manufacturing
Mixed Chart
Goldman Sachs
Add to my slides
Remove from favorites
Repeat layout of 18022: includes Pennsylvania map, plant photo, timeline, and financial return indicators.
Operational Efficiency
Industrial & Manufacturing
Duplicate of slide 18022: highlights capacity increase and efficiency benefits from the Palmerton refurbishment project. Key takeaways include a €60–70m Capex, EBITDA of €25–30m, and IRR >30%, reinforcing the project's economic and strategic value.
Palmerton, steel dust, refurbishment, EBITDA, IRR, efficiency, 2025
false
Operational Efficiency
Industrial & Manufacturing
Mixed Chart
Goldman Sachs
Add to my slides
Remove from favorites
A line chart comparing 'Goods' (in blue) and 'Services' (in orange) spending by US consumers is presented on this slide. The chart tracks the spending index from December 2019, showing a sharp decline followed by a recovery with fluctuating levels for both categories.
Financial Performance
Technology & Software
This slide shows the impact of the pandemic on US consumer spending, demonstrating changes in the level and composition of expenditures on goods and services. It could be used to analyze consumer behavior during economic shocks and guide business strategy adjustments.
Pandemic, Consumer Spending, US, Goods, Services, Economic Impact, Spending Behavior
false
Financial Performance
Technology & Software
Single Chart
JP Morgan
Add to my slides
Remove from favorites
Contains six line graphs showing COVID-19 daily new cases for each country, with date markers on the x-axis and cases on the y-axis. The background is white and the graphs are in blue.
Risk Assessment and Management
Healthcare & Pharmaceuticals
Reflecting on the challenges of 2020, this slide shows the trend of COVID-19 cases across six Southeast Asian countries, revealing the pandemic's impact on the region.
pandemic, COVID-19, Southeast Asia, daily cases, line graph, uncertainty, 2020
false
Risk Assessment and Management
Healthcare & Pharmaceuticals
Multiple Chart
Bain
Add to my slides
Remove from favorites
The slide includes several statistics and icons highlighting the increase in cyber attacks during the pandemic and the drivers of digital adoption.
Risk Assessment and Management
Technology & Software
This slide explains the rise in cyber attacks during the COVID-19 pandemic, citing a 600% increase in phishing attacks and an 80% rise in cyber attacks on IT teams. It also discusses key drivers of digital adoption.
pandemic, digital adoption, cyber attacks, COVID-19, phishing, IT security, statistics, cybersecurity, BCG
false
Risk Assessment and Management
Technology & Software
Boxed
BCG
Add to my slides
Remove from favorites
Previous
Next
You don't have any favorites yet.
Please wait loading your favorites slides...
Create a FREE account to continue browsing
Receive Instant Access to 1,000+ slides from companies like McKinsey, Google, and Goldman Sachs
First Name
Last Name
Email
Password
I agree to all
Terms & Privacy Policy
Thank you! Your submission has been received!
Oops! Something went wrong while submitting the form.
Have an account?
Sign in
Upgrade to PRO to Save slides
Advanced Search and Filters
Access to 15,000+ slides
Access to Category Pages
Save/Bookmark Slides
PowerPoint Template Library
Pick a Plan
MONTHLY
$12/month
Billed every month, Cancel anytime.
YEARLY
$9/year
Billed $108 annually, Cancel anytime.
Checkout for $12/month
Checkout for $108/yr
Secured by Stripe | AES-256 bit encryption