My Account
My Slides
Search by Category
Pricing
Templates
View All Templates
Download Template Slides
✦ AI Search
Feedback
Login
Logout
Get Started
Browse all Slides
Browse all Slides
Create a FREE Account
Instant access to 1,000+ real slides from top companies like McKinsey, BCG, Goldman Sachs, Google and many more!
First Name
Last Name
Email
Password
I agree to all
Terms & Privacy Policy
Thank you! Your submission has been received!
Oops! Something went wrong while submitting the form.
Have an account?
Sign in
Saved Slides
Total No. of slides saved
0
↻ Refresh
✖ Clear all
Bar charts showing transportation mode usage for work/study and non-work/non-study travel
Market Analysis and Trends
Transportation & Logistics
Discusses the increase in the use of personal cars for travel, comparing modes of transportation usage
Personal cars, transportation, travel, work, survey
false
Market Analysis and Trends
Transportation & Logistics
Multiple Chart
EY
Add to my slides
Remove from favorites
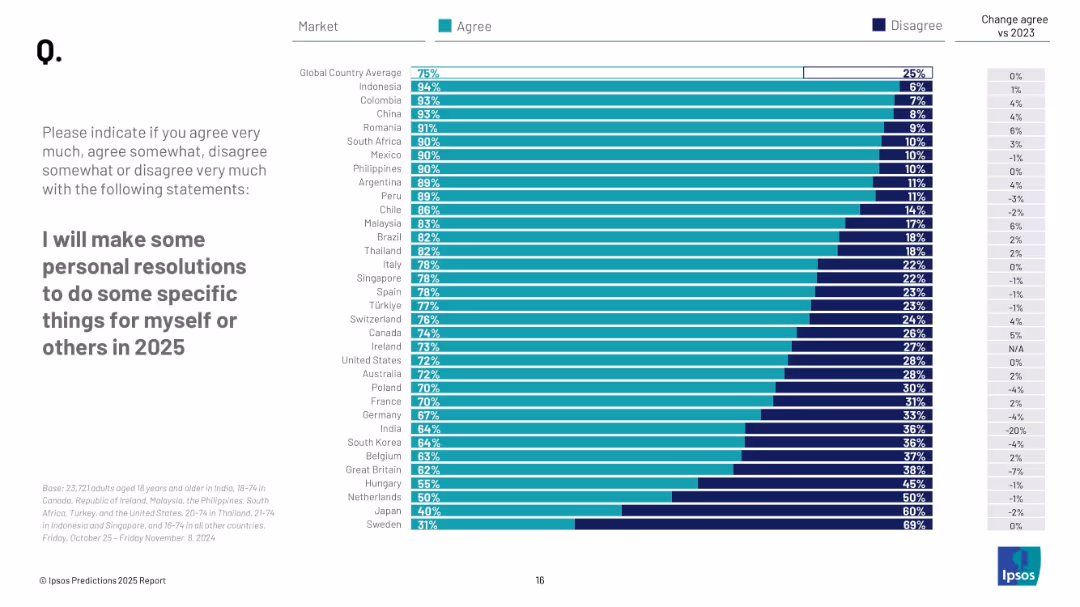
Ranked bar chart of country responses; shows % agree, % disagree, and change from 2023.
Human Resources and Talent Management
Professional Services
The slide highlights intent to make personal resolutions in 2025, with countries like Indonesia (94%) and Colombia (93%) showing strong agreement. Global average is 75%. Sweden ranks lowest at 31%, reflecting wide cultural differences in resolution-setting.
personal goals, behavior change, public resolution, 2025 plans, Ipsos survey, global comparison
false
Human Resources and Talent Management
Professional Services
Mixed Chart
IPSOS
Add to my slides
Remove from favorites
Includes several bar charts depicting the adoption levels of personalization techniques in commerce, using AI and machine learning.
Market Analysis and Trends
Retail & E-commerce
Analyzes the use of personalization in commerce, emphasizing AI-driven micro-segmentation and its effectiveness in real-time data usage.
personalization, AI, machine learning, micro-segmentation, bar chart
false
Market Analysis and Trends
Retail & E-commerce
Multiple Chart
BCG
Add to my slides
Remove from favorites
Bar graph and icons representing the strategies executives are focusing on to achieve personalization in consumer channels.
Strategic Planning
Retail & E-commerce
Highlights specific strategies companies are adopting to provide personalized shopping experiences, with a focus on data analytics and omnichannel efforts.
Personalization, Channel Strategy, Data Analytics, Omnichannel, Executive Strategy, Bar Graph
false
Strategic Planning
Retail & E-commerce
Single Chart
Kearney
Add to my slides
Remove from favorites
Slide features image-focused layout discussing the importance of personalization in consumer interactions, with a timeline of increasing trend relevance.
Product and Service Analysis
Retail & E-commerce
Analyzes how personalization in digital spaces is shaping consumer experiences, appealing strongly to Gen X and Millennials.
personalization, consumer experiences, Gen X, Millennials, digital
false
Product and Service Analysis
Retail & E-commerce
Multiple Chart
Bain
Add to my slides
Remove from favorites
A bar graph with a percentage breakout showing the prioritization of personalized product offerings by executives.
Market Analysis and Trends
Professional Services
Evaluates the importance placed on personalized products in business strategy, as seen by different company sizes and executive roles.
Personalization, Executive Priorities, Bar Graph, Product Strategy
false
Market Analysis and Trends
Professional Services
Single Chart
Kearney
Add to my slides
Remove from favorites
Contains multiple bar charts illustrating the current and future states of personalization in customer service within financial services. The slide is detailed, showing statistics and trends in a clear, organized manner with visual aids.
Market Analysis and Trends
Financial Services
Explores how personalization in financial services is becoming crucial, with projections on how much it will increase in importance, reflecting investor expectations and technological advancements.
personalization, financial services, customer experience, investor expectations, technology
false
Market Analysis and Trends
Financial Services
Multiple Chart
Deloitte
Add to my slides
Remove from favorites
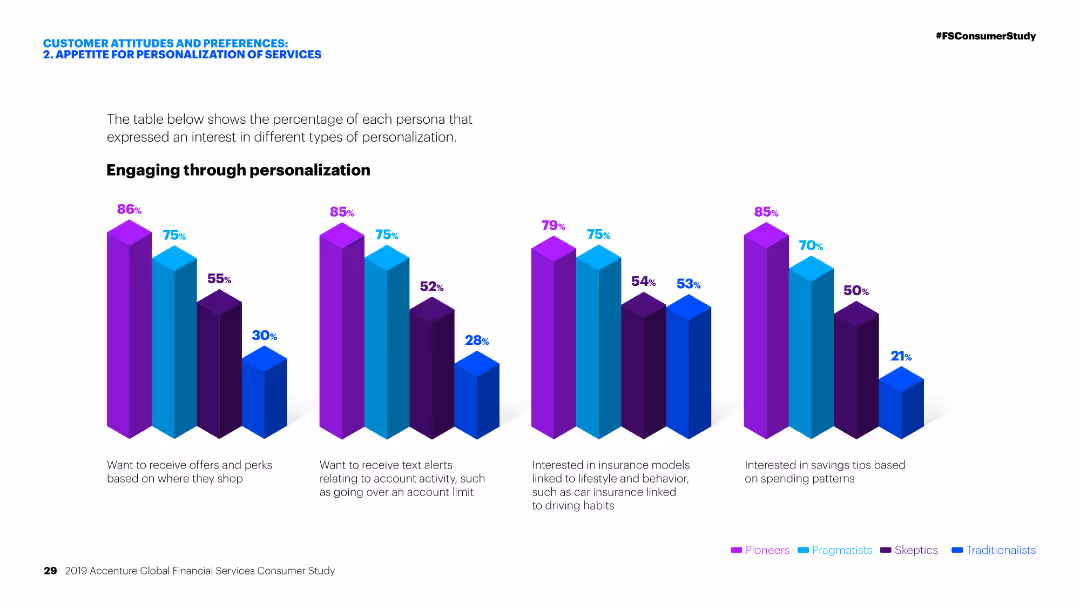
Column charts showing interest in various types of personalization across different personas.
Customer and Market Segmentation
Financial Services
Analysis of customer personas' interest in personalized services in financial services, focusing on offers, text alerts, insurance models, and savings tips.
Personalization, financial services, customer personas, offers, text alerts, insurance models, savings tips, market analysis, segmentation
false
Customer and Market Segmentation
Financial Services
Multiple Chart
Accenture
Add to my slides
Remove from favorites
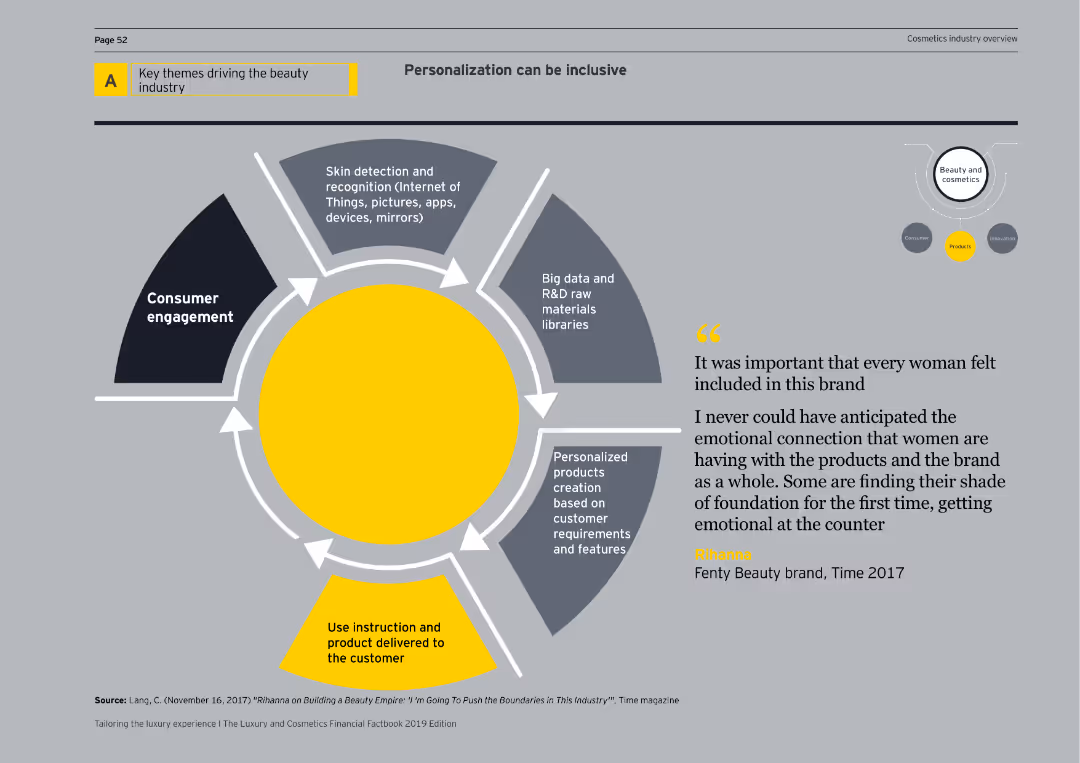
Features a diagram depicting consumer engagement, skin detection, big data, personalized products, and delivery mechanisms for inclusive personalization.
Market Analysis and Trends
Consumer Goods
Explores the role of personalization in the beauty industry, emphasizing inclusive approaches and advanced technological applications.
personalization, inclusivity, consumer engagement, skin detection, big data, beauty products, innovation, cosmetics, diagram, market analysis
false
Market Analysis and Trends
Consumer Goods
Linear Flow
EY
Add to my slides
Remove from favorites
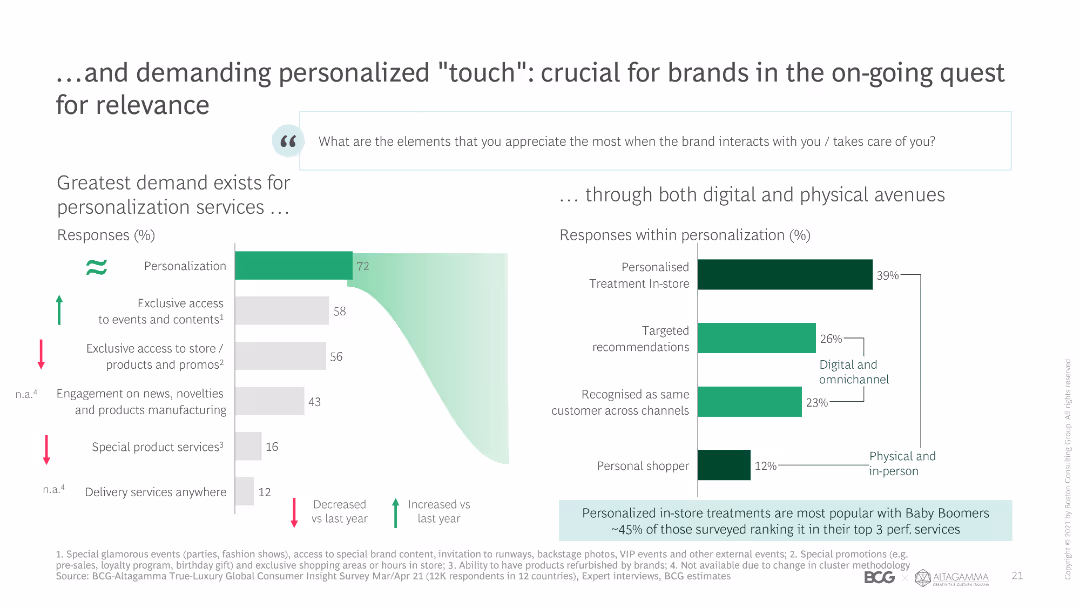
Bar chart and text showing the demand for personalization services among luxury consumers, with a breakdown of responses within personalization by digital and physical avenues.
Customer and Market Segmentation
Media & Entertainment
Analyzes the demand for personalized services in the luxury market, highlighting the preference for both digital and physical personalization avenues.
personalization, luxury brands, digital, physical, consumer demand
false
Customer and Market Segmentation
Media & Entertainment
Multiple Chart
BCG
Add to my slides
Remove from favorites
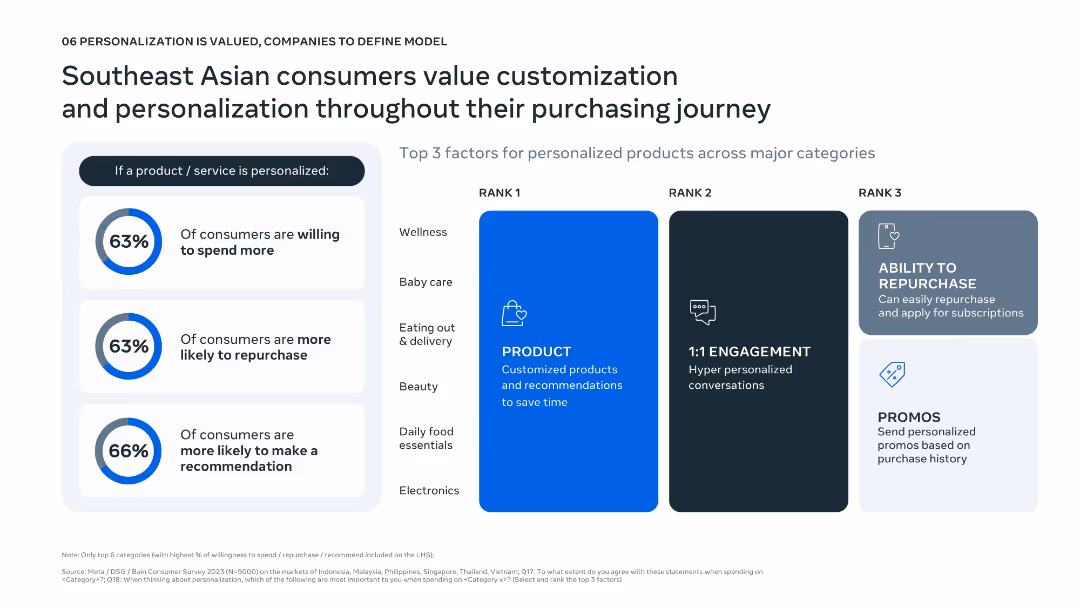
Left: three circular metrics highlight % willing to spend/repurchase/recommend; Right: ranked grid showing top 3 personalization factors per category.
Customer and Market Segmentation
Consumer Goods
Emphasizes the value Southeast Asian consumers place on product personalization. Over 60% are willing to spend more and repurchase when offerings are personalized. Key personalization elements include product customization, 1:1 engagement, and ease of repurchase across categories like wellness, baby care, and electronics.
personalization, repurchase, customer journey, customization, SEA
false
Customer and Market Segmentation
Consumer Goods
Mixed Chart
Bain
Add to my slides
Remove from favorites
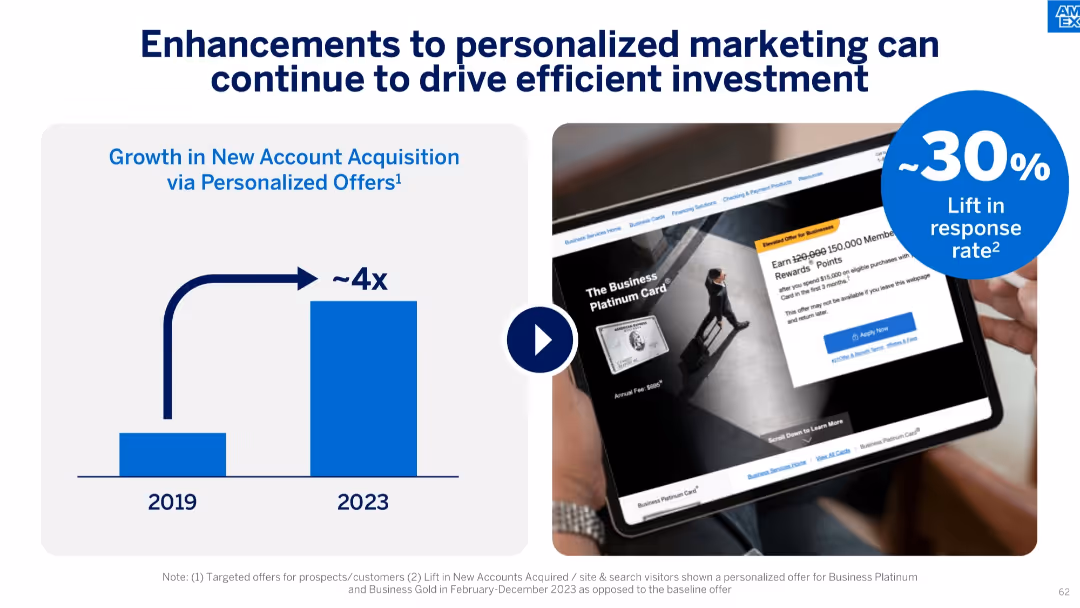
Split into two halves: left has a vertical bar chart (2019 vs 2023), right shows a tablet ad mockup and a 30% lift icon.
Investment Analysis
Financial Services
The slide demonstrates how personalized marketing efforts have significantly improved new account acquisition (~4x growth) and lifted response rates by ~30%. It showcases data from 2019 to 2023, emphasizing the value of targeted digital offers.
personalized marketing, account acquisition, response rate, ROI, 2023, digital offers, ad performance, efficiency, marketing growth, customer targeting
false
Investment Analysis
Financial Services
Mixed Chart
McKinsey
Add to my slides
Remove from favorites
Slide with multiple pie charts detailing company focus areas in personalized nutrition, with percentages and icons.
Market Analysis and Trends
Agriculture & Food Production
Discusses company investments in personalized nutrition, focusing on product traceability and plant-based alternatives.
personalized nutrition, product traceability, plant-based, pie charts, investment
false
Market Analysis and Trends
Agriculture & Food Production
Multiple Chart
Deloitte
Add to my slides
Remove from favorites
The slide presents multiple stacked column charts in green shades showing the percentage of companies reporting different barriers to the development of personalized nutrition. Text boxes provide additional context and statistical data.
Market Analysis and Trends
Agriculture & Food Production
The slide provides insights into the main barriers faced by companies in developing personalized nutrition, such as R&D, consumer demand variations, and cost issues, alongside commentary on market trends and challenges.
personalized nutrition, R&D, consumer demand, cost barriers, market challenges
false
Market Analysis and Trends
Agriculture & Food Production
Mixed Chart
Deloitte
Add to my slides
Remove from favorites
Displays pie chart and bar charts detailing job titles, account premiums, respondents' ages, and years in the insurance industry for personal lines-focused underwriters.
Market Analysis and Trends
Financial Services
Offers a detailed demographic and financial profile of personal lines-focused underwriters, including job roles, premium sizes, age groups, and industry tenure.
personal lines, insurance, demographics, job roles, premiums, age distribution, tenure, financial analysis
false
Market Analysis and Trends
Financial Services
Multiple Chart
Accenture
Add to my slides
Remove from favorites
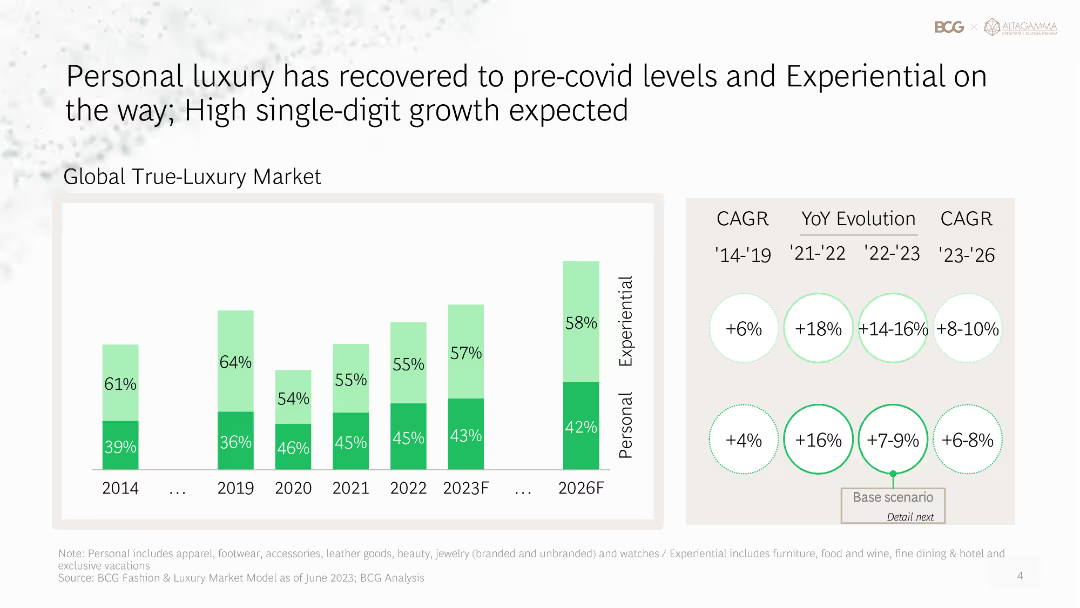
Column chart showing the recovery of the personal luxury market to pre-COVID levels, with projections for future growth in both personal and experiential categories.
Market Analysis and Trends
Consumer Goods
Analyzes the recovery of the personal luxury market post-COVID, providing growth projections for both personal and experiential luxury segments.
personal luxury, market recovery, post-COVID, growth projections, experiential
false
Market Analysis and Trends
Consumer Goods
Mixed Chart
BCG
Add to my slides
Remove from favorites
Vertical bar chart by country, measuring agreement/disagreement on individual responsibility; styled like previous slides.
Strategic Planning
Environmental Services & Sustainability
The data reflects decreasing belief that individuals must take personal action to address climate change. Despite the decline, countries like Colombia, Mexico, and South Africa still report strong agreement, while Japan shows the lowest individual sense of duty.
Personal responsibility, Climate perception, Ipsos survey, Individual action, Global data
false
Strategic Planning
Environmental Services & Sustainability
Mixed Chart
IPSOS
Add to my slides
Remove from favorites
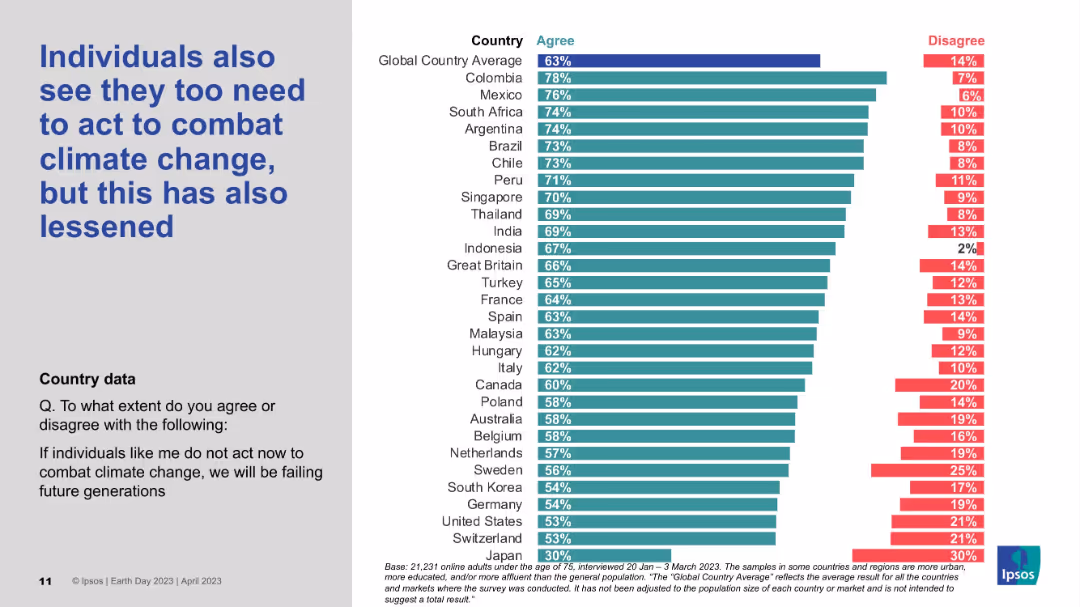
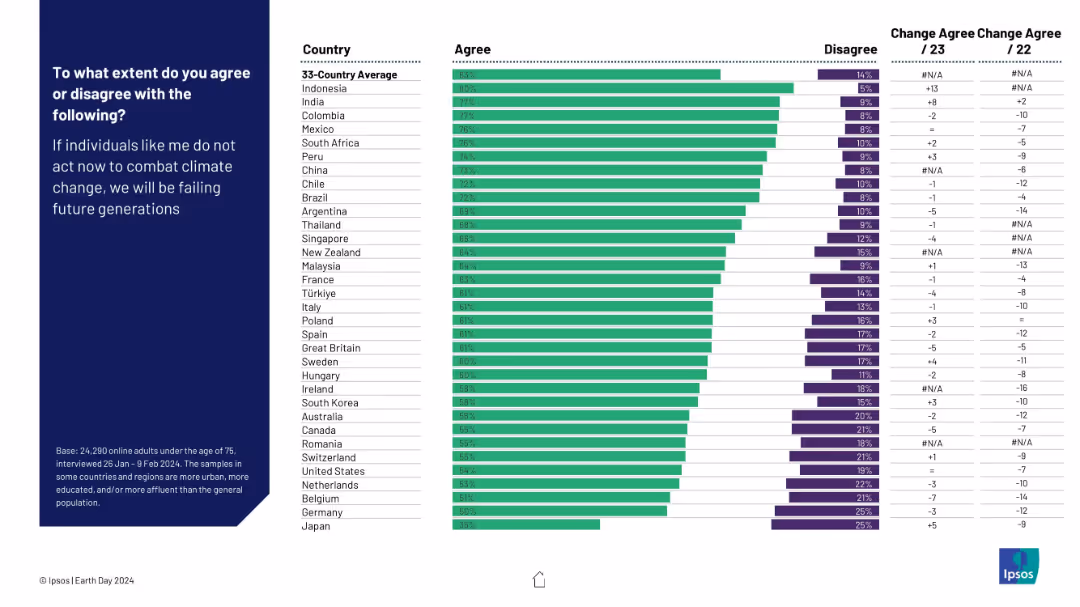
Similar layout to 19611: left-aligned text prompt and right-side horizontal bar chart showing country-wise agreement.
Strategic Planning
Environmental Services & Sustainability
This slide presents the belief that individuals must act to prevent failure for future generations. It ranks countries by percentage agreeing with this responsibility.
personal responsibility, future generations, climate action, global sentiment, Ipsos, environmental attitudes, public opinion
false
Strategic Planning
Environmental Services & Sustainability
Mixed Chart
IPSOS
Add to my slides
Remove from favorites
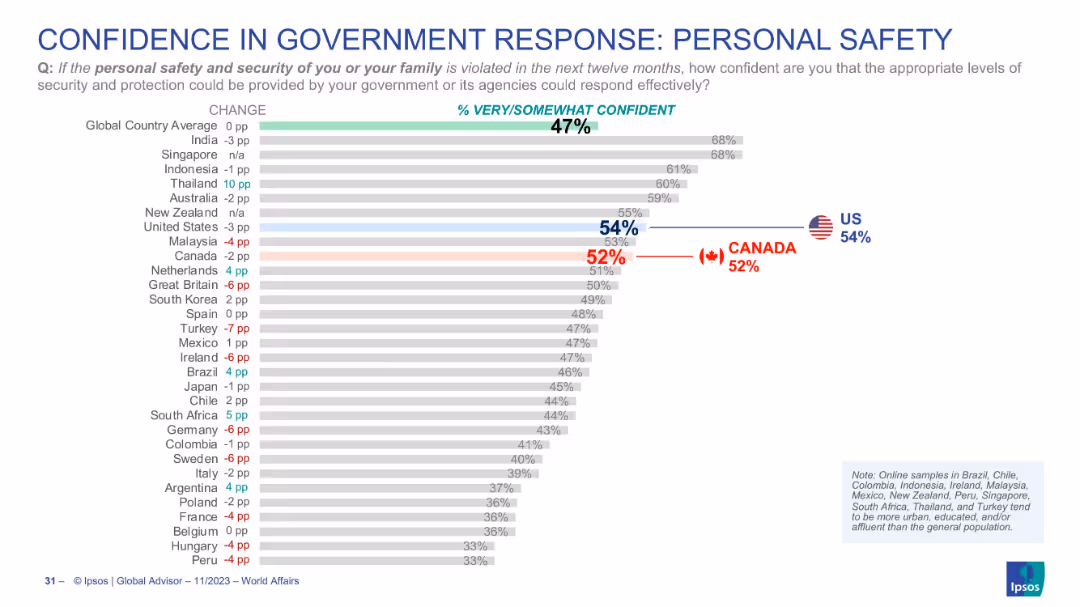
Horizontal bars, color-highlighted for emphasis on Canada and U.S., ranks countries by perceived government efficacy
Risk Assessment and Management
Government & Public Sector
This slide evaluates public confidence in governmental protection in personal safety matters. Global confidence is at 47%, with Canada scoring slightly above at 52% and the U.S. at 54%.
personal safety, crime response, public opinion, Canada, US, global average, Ipsos, survey
false
Risk Assessment and Management
Government & Public Sector
Single Chart
IPSOS
Add to my slides
Remove from favorites
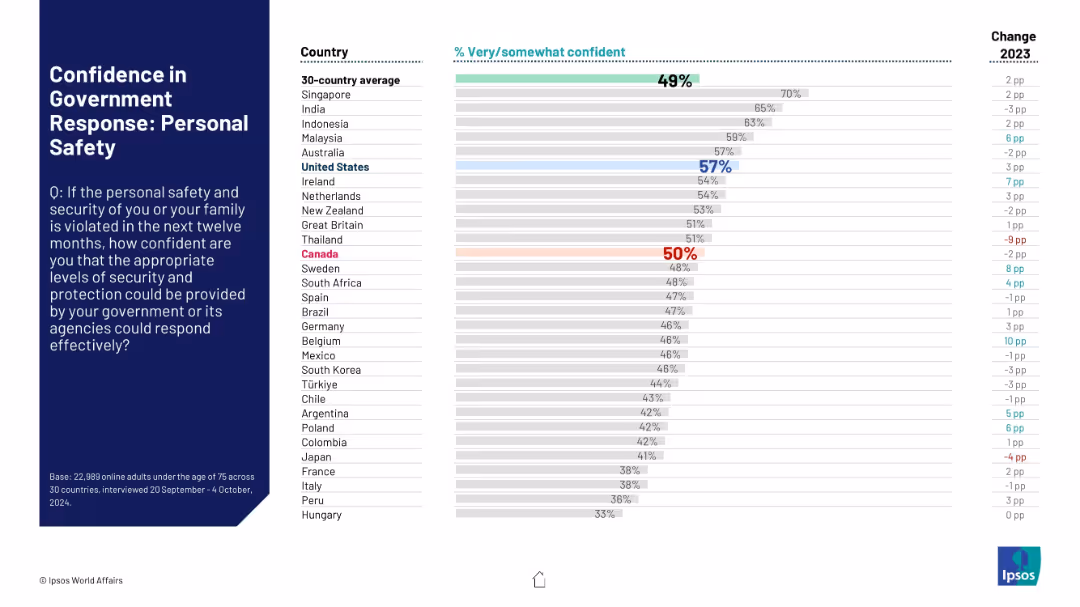
Horizontal bar graph ranks confidence in governmental ability to protect personal safety; Canada at 50%.
Risk Assessment and Management
Government & Public Sector
This chart reflects public confidence in government protection of personal safety. Canada’s rating is at the 30-country average (50%), while the U.S. shows higher trust at 57%.
personal safety, security, confidence, perception, government trust, Canada, U.S., Ipsos, 2024, survey
false
Risk Assessment and Management
Government & Public Sector
Mixed Chart
IPSOS
Add to my slides
Remove from favorites
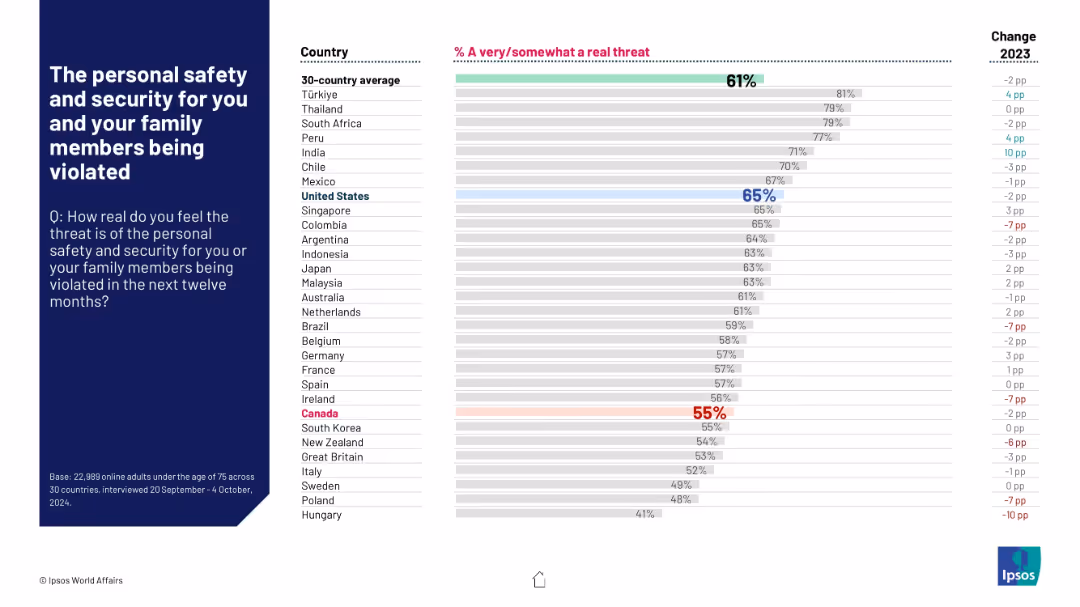
Horizontal bar chart ranking countries by concern over personal safety violations; Canada and U.S. highlighted.
Risk Assessment and Management
Government & Public Sector
The slide presents public perceptions of the threat to personal and family safety across countries. U.S. respondents show relatively high concern (65%), while Canada’s perception is lower (55%).
personal safety, threat, global perception, survey results, 2024, Canada, U.S., Ipsos, risk, family security
false
Risk Assessment and Management
Government & Public Sector
Mixed Chart
IPSOS
Add to my slides
Remove from favorites
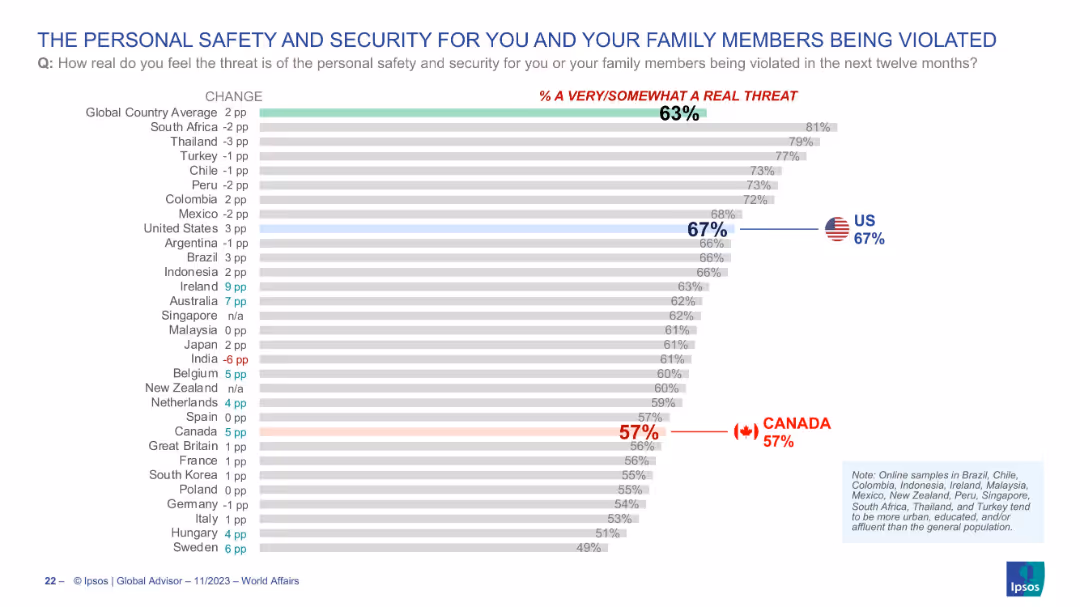
Horizontal bar chart showing country-wise public sentiment on personal/family safety; Canada and US highlighted with flags and bolded percentages.
Risk Assessment and Management
Government & Public Sector
This slide explores public fears regarding personal safety or that of family members being violated within the next year. The US stands at 67% and Canada at 57%, while the global average is 63%. It provides insight into societal perceptions of crime and domestic insecurity.
personal security, family safety, crime risk, perception, Canada, USA, Ipsos, threat, public opinion
false
Risk Assessment and Management
Government & Public Sector
Single Chart
IPSOS
Add to my slides
Remove from favorites
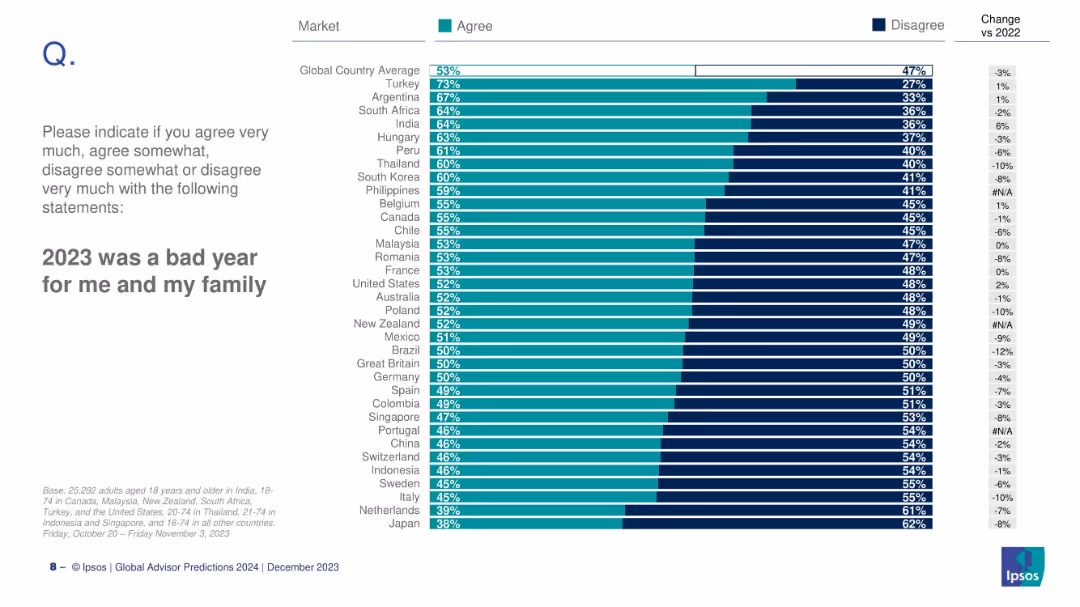
Similar bar chart to previous slide, but focused on personal/family-level sentiment across countries, with % change vs 2022.
Market Analysis and Trends
Professional Services
This slide details the global personal/family perception of 2023, with Turkey topping the chart at 73% agreement and Japan at the bottom with 38%. Global average agreement is 53%.
personal sentiment, bad year, family impact, country comparison, Ipsos, survey, 2023, bar chart
false
Market Analysis and Trends
Professional Services
Mixed Chart
IPSOS
Add to my slides
Remove from favorites
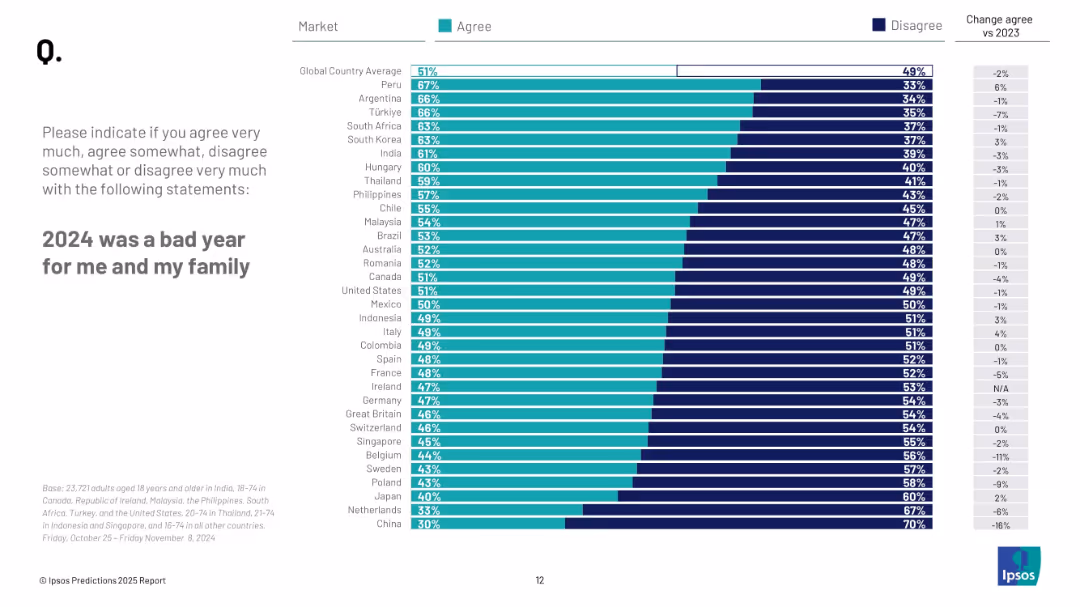
Horizontal bar chart similar to previous slide, but measuring personal/family sentiment by country; includes % agree/disagree and change vs 2023.
Market Analysis and Trends
Professional Services
This slide details how people around the world felt about their personal and family well-being in 2024. Peru (67%) tops the list, while China (30%) and Netherlands (33%) are lowest. Global average is 51%.
personal sentiment, family impact, 2024 hardship, global perspective, Ipsos survey, public opinion
false
Market Analysis and Trends
Professional Services
Mixed Chart
IPSOS
Add to my slides
Remove from favorites
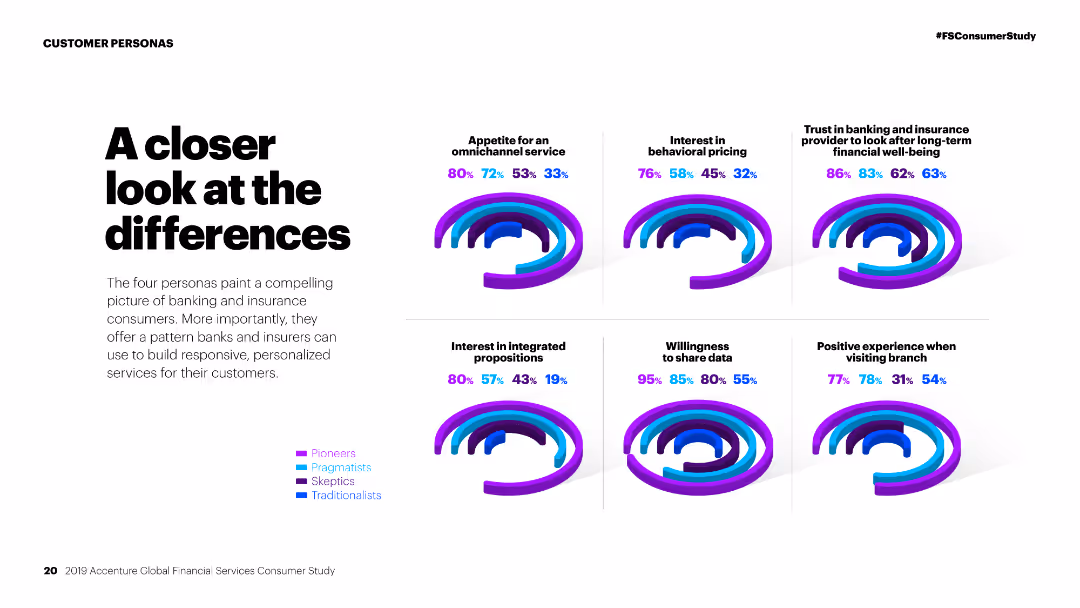
Column charts comparing personas on various factors like omnichannel service, behavioral pricing, and willingness to share data.
Competitive Landscape
Financial Services
Comparison of different customer personas in financial services, analyzing their preferences and behaviors towards various service aspects.
Personas, financial services, comparison, omnichannel service, behavioral pricing, data sharing, customer preferences, market study, segmentation
false
Competitive Landscape
Financial Services
Multiple Chart
Accenture
Add to my slides
Remove from favorites
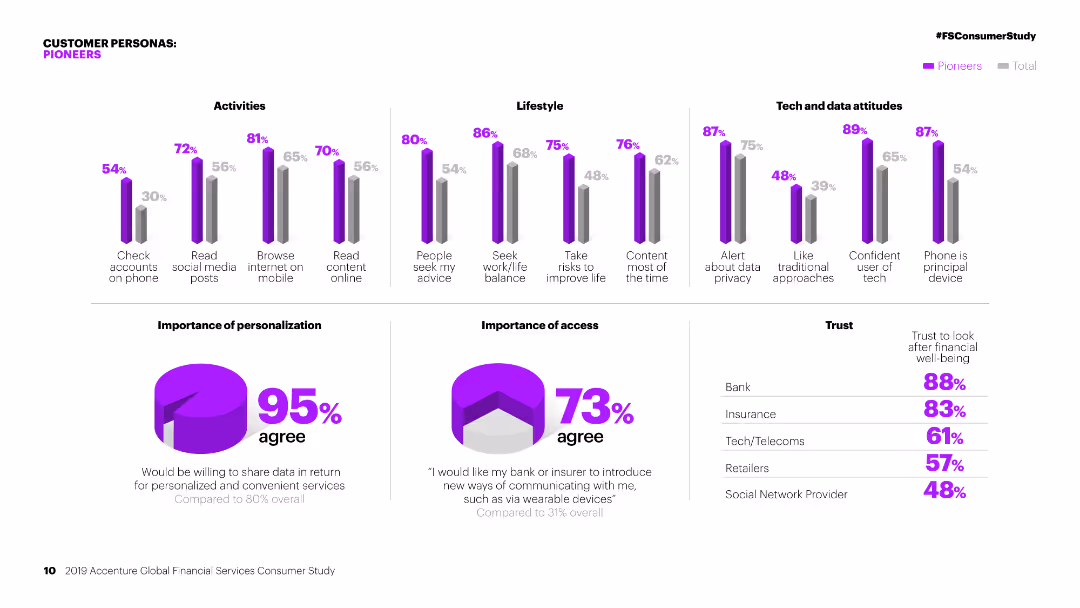
Column charts showing activities, lifestyle, and tech attitudes of 'Pioneers' compared to the total. Pie charts on personalization and access.
Customer and Market Segmentation
Financial Services
Detailed segmentation of 'Pioneers' in financial services, focusing on their activities, lifestyle, attitudes towards tech, and personalization preferences.
Personas, financial services, segmentation, pioneers, activities, lifestyle, tech attitudes, personalization, market study, access
false
Customer and Market Segmentation
Financial Services
Multiple Chart
Accenture
Add to my slides
Remove from favorites
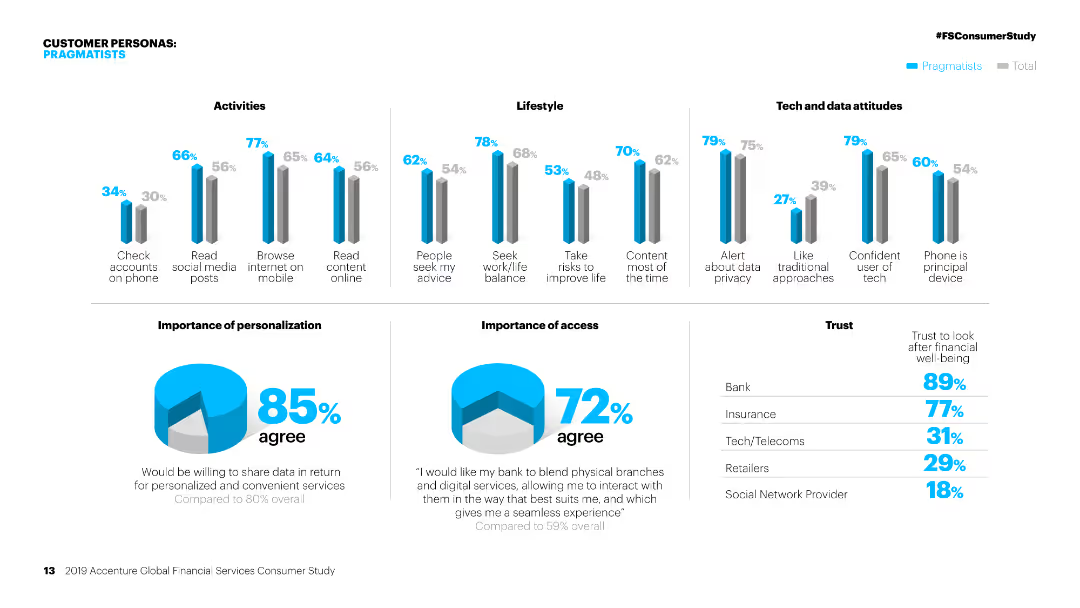
Column charts showing activities, lifestyle, and tech attitudes of 'Pragmatists' compared to the total. Pie charts on personalization and access.
Customer and Market Segmentation
Financial Services
Detailed segmentation of 'Pragmatists' in financial services, focusing on their activities, lifestyle, attitudes towards tech, and personalization preferences.
Personas, financial services, segmentation, pragmatists, activities, lifestyle, tech attitudes, personalization, market study, access
false
Customer and Market Segmentation
Financial Services
Multiple Chart
Accenture
Add to my slides
Remove from favorites
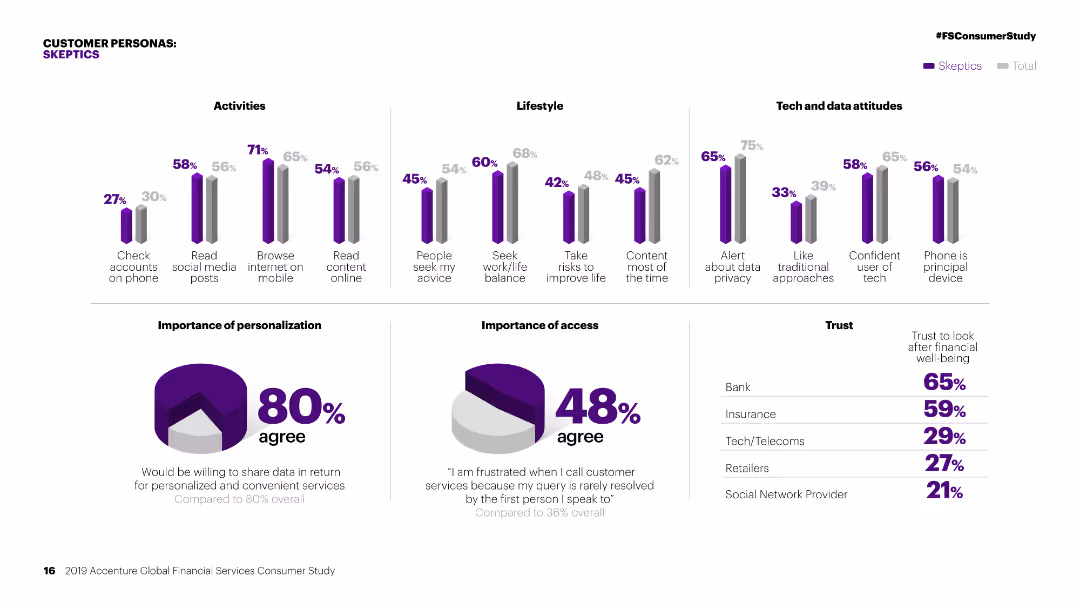
Column charts showing activities, lifestyle, and tech attitudes of 'Skeptics' compared to the total. Pie charts on personalization and access.
Customer and Market Segmentation
Financial Services
Detailed segmentation of 'Skeptics' in financial services, focusing on their activities, lifestyle, attitudes towards tech, and personalization preferences.
Personas, financial services, segmentation, skeptics, activities, lifestyle, tech attitudes, personalization, market study, access
false
Customer and Market Segmentation
Financial Services
Multiple Chart
Accenture
Add to my slides
Remove from favorites
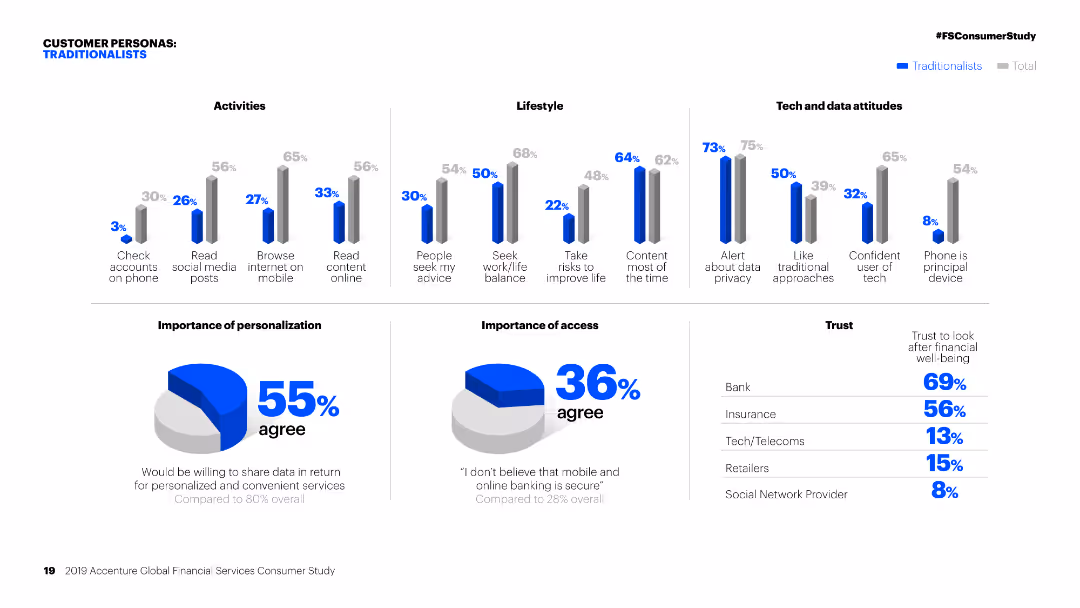
Column charts showing activities, lifestyle, and tech attitudes of 'Traditionalists' compared to the total. Pie charts on personalization and access.
Customer and Market Segmentation
Financial Services
Detailed segmentation of 'Traditionalists' in financial services, focusing on their activities, lifestyle, attitudes towards tech, and personalization preferences.
Personas, financial services, segmentation, traditionalists, activities, lifestyle, tech attitudes, personalization, market study, access
false
Customer and Market Segmentation
Financial Services
Multiple Chart
Accenture
Add to my slides
Remove from favorites
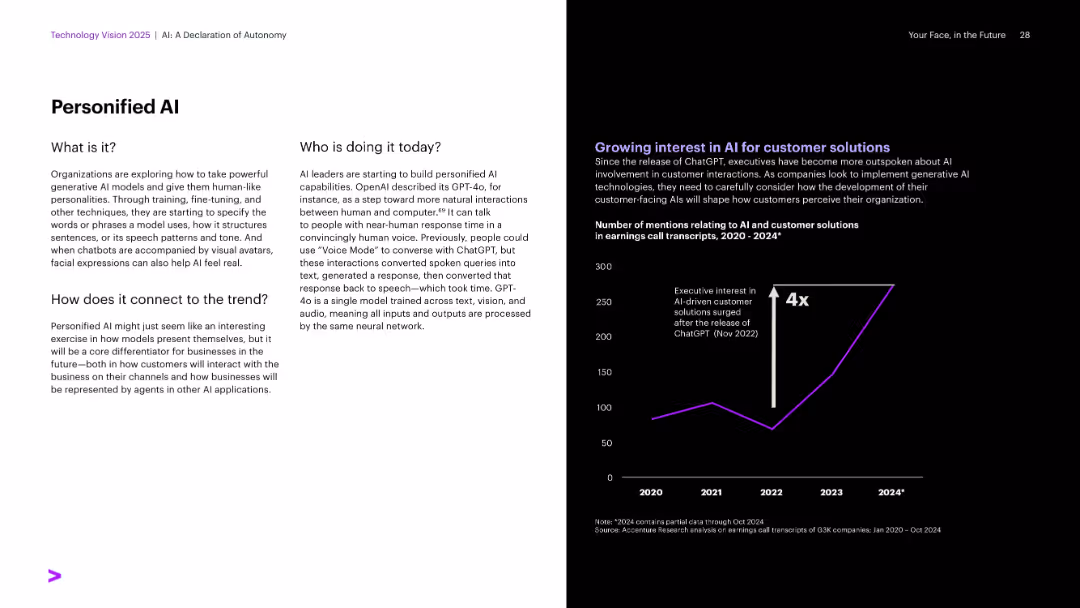
Split layout: left side white with text blocks; right side black with a line graph and purple accent color.
Technology and Digital Transformation
Artificial Intelligence
The slide explains the concept of personified AI, detailing how organizations are designing AIs with human-like traits for better interaction. It includes current leaders in the space (e.g., OpenAI with GPT-4o) and presents data showing increased executive interest in AI customer solutions since ChatGPT's launch.
Personified AI, GPT-4o, ChatGPT, customer solutions, speech AI, avatars
false
Technology and Digital Transformation
Artificial Intelligence
Mixed Chart
Accenture
Add to my slides
Remove from favorites
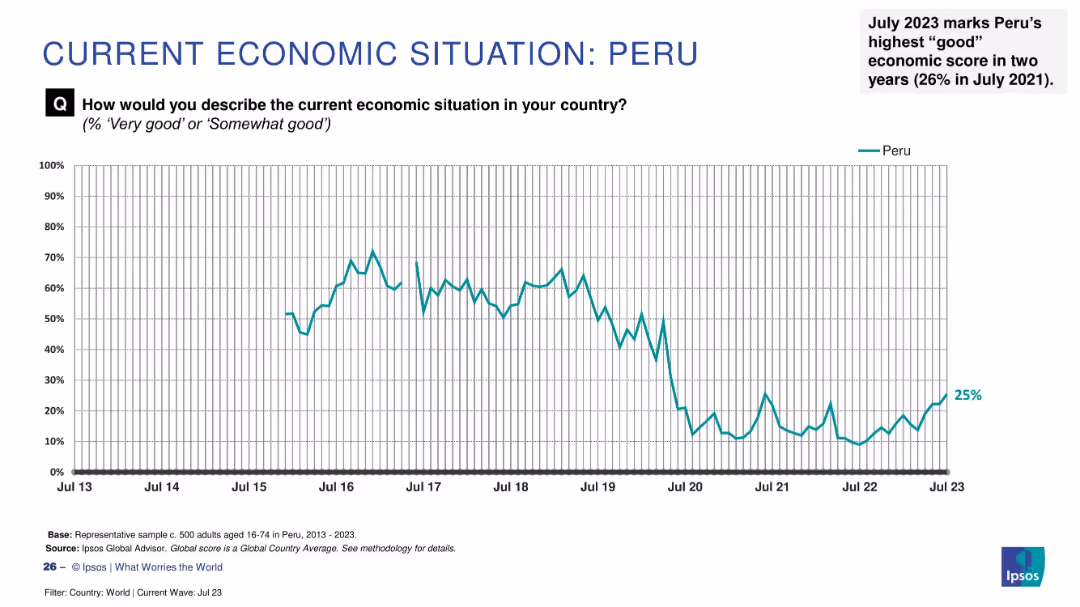
Line graph showing sentiment trend from 2013 to July 2023 with a recent rise to 25% and an annotation on 2-year high.
Market Analysis and Trends
Financial Services
Peru has reached its highest economic optimism in two years (25%) as of July 2023. This visual shows the overall downward trend followed by a modest recovery, emphasizing recent improvement.
Peru, economic sentiment, public perception, Ipsos data, 2023 trends, two-year high, economic outlook, Latin America, recovery
false
Market Analysis and Trends
Financial Services
Single Chart
IPSOS
Add to my slides
Remove from favorites
The slide consists of three charts: a column chart for real GDP, and two line charts for private consumption and investment, and international trade data.
Market Analysis and Trends
Financial Services
This slide outlines Peru's economic status, covering real GDP growth, private consumption and investment, and international trade data as of 4Q23.
Peru, economic snapshot, GDP, consumption, investment, trade
false
Market Analysis and Trends
Financial Services
Multiple Chart
JP Morgan
Add to my slides
Remove from favorites
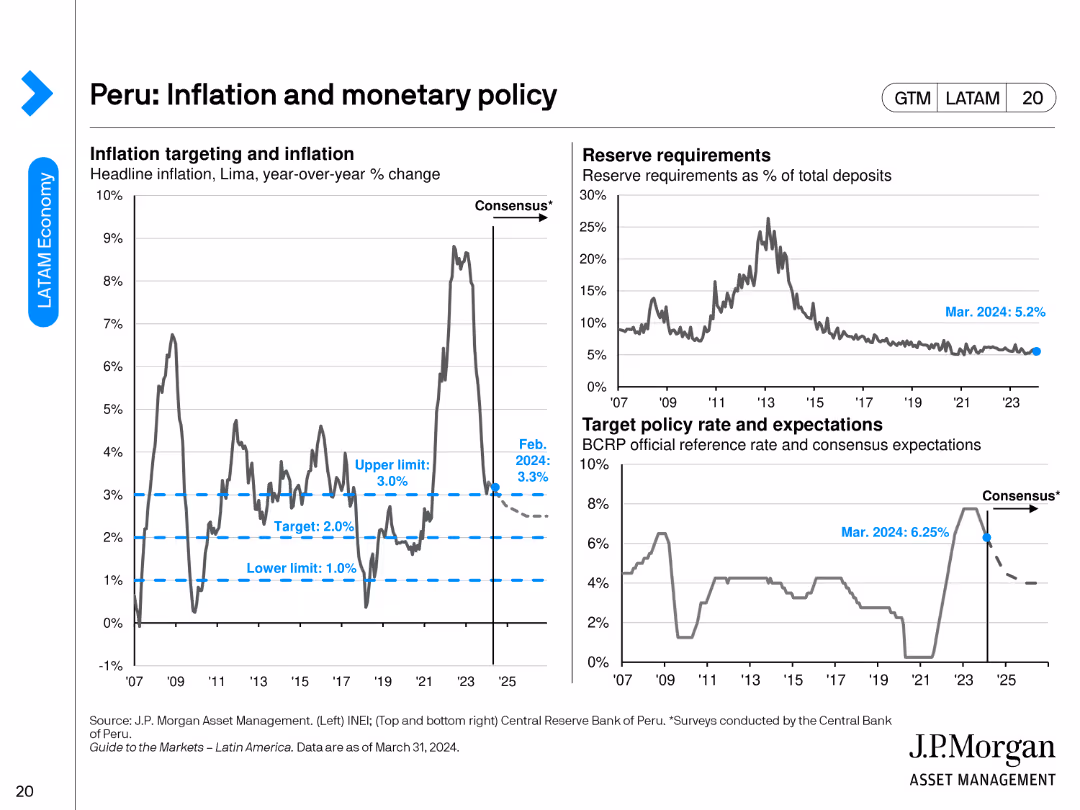
The slide presents three charts: a line chart for inflation targeting, another for reserve requirements, and a chart for target policy rates.
Regulatory and Compliance
Financial Services
This slide focuses on Peru's inflation and monetary policy, detailing inflation targeting, reserve requirements, and target policy rates as of February 2024.
Peru, inflation, monetary policy, reserve requirements, policy rates
false
Regulatory and Compliance
Financial Services
Multiple Chart
JP Morgan
Add to my slides
Remove from favorites
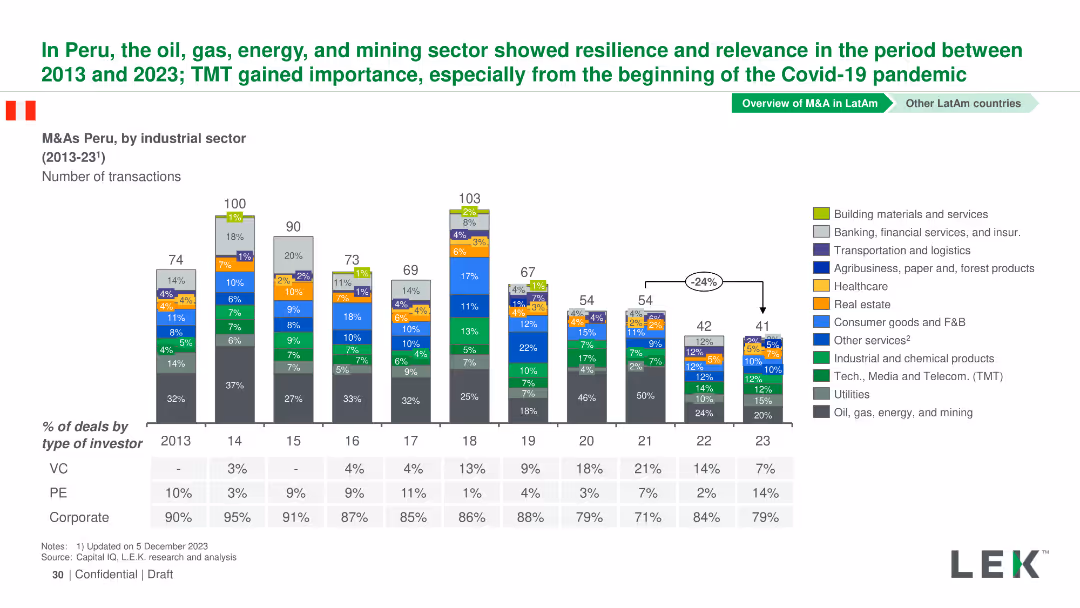
Column chart showing the number of M&A transactions by industrial sector in Peru from 2013-2023. Sectors are color-coded and detailed in a legend.
Market Analysis and Trends
Financial Services
This slide presents M&A transactions in Peru from 2013-2023, highlighting the resilience and relevance of the oil, gas, energy, and mining sectors.
Peru, M&A, Industrial Sectors, Transactions, Trends
false
Market Analysis and Trends
Financial Services
Mixed Chart
LEK
Add to my slides
Remove from favorites
Similar design to others; shows global average and detailed country-by-country percentage comparisons
Risk Assessment and Management
Government & Public Sector
Focusing on a single reason for inaction—feeling that no action would make a difference—this slide presents country-level data and gender-based breakdowns to highlight where this sentiment is most prevalent.
pessimism, gender equality, action barriers, Ipsos, survey data, global comparison
false
Risk Assessment and Management
Government & Public Sector
Mixed Chart
IPSOS
Add to my slides
Remove from favorites
The slide contains a pie chart showing 53% pessimism, bullet points on the right with orange headings, and demographic details at the bottom. White background with clean design.
Market Analysis and Trends
Financial Services
This slide explains that pessimistic investors are more cautious, focusing on long-term disruption, cutting back spending, and staying put in their investments. Demographic details are included.
pessimism, investment, caution, demographics, COVID-19
false
Market Analysis and Trends
Financial Services
Mixed Chart
IPSOS
Add to my slides
Remove from favorites
The slide is divided into a textual description on the left and a line graph on the right that tracks economic and social/political pessimism over four years, differentiating between millennials and Gen Z. It uses blue and green lines against a white background.
Market Analysis and Trends
Technology & Software
This slide explores the growing economic and social/political pessimism among millennials and Gen Z. The line graph shows an increasing trend in negative outlooks from 2018 to 2021. It suggests a correlation with recent global events and the potential long-term impacts on societal attitudes and business strategies.
Pessimism, Millennials, Gen Z, Economic Outlook, Social Political, Line Graph, Trends, Business Strategy
false
Market Analysis and Trends
Technology & Software
Mixed Chart
Deloitte
Add to my slides
Remove from favorites
Blue panel on left with explanatory text; bar chart on right showing country-by-country comparison
Regulatory and Compliance
Government & Public Sector
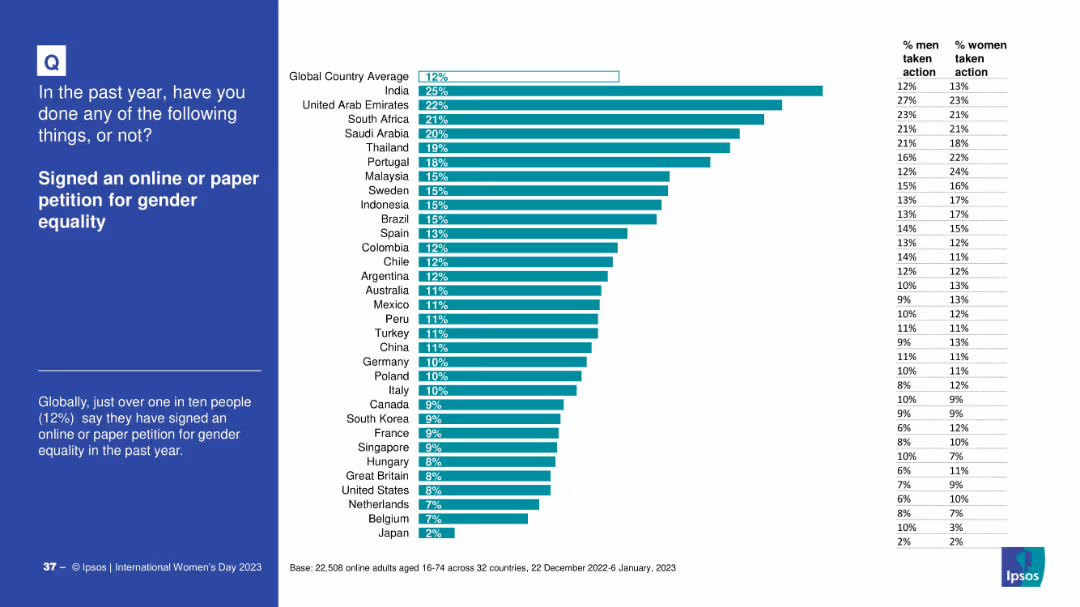
The slide illustrates how many people in different countries signed petitions—either online or on paper—supporting gender equality. It also shows gender-based differences in participation rates.
petition, activism, gender rights, global survey, civic action, gender equality, Ipsos
false
Regulatory and Compliance
Government & Public Sector
Mixed Chart
IPSOS
Add to my slides
Remove from favorites
The slide features a combination of text and graphical data with a large line chart showing the trend of market growth in pet supplies. Icons and small graphics add a visual element to the statistics presented, making the slide engaging and informative.
Market Analysis and Trends
Consumer Goods
Discusses the growth in the pet supplies market through the pandemic and expected post-pandemic trends. It emphasizes increased adoption rates, consumer spending, and the impact of e-commerce on the market dynamics. The slide also projects continued market growth driven by these factors.
pet supplies, market growth, COVID-19, e-commerce, consumer behavior, adoption rates, future trends
false
Market Analysis and Trends
Consumer Goods
Mixed Chart
BCG
Add to my slides
Remove from favorites
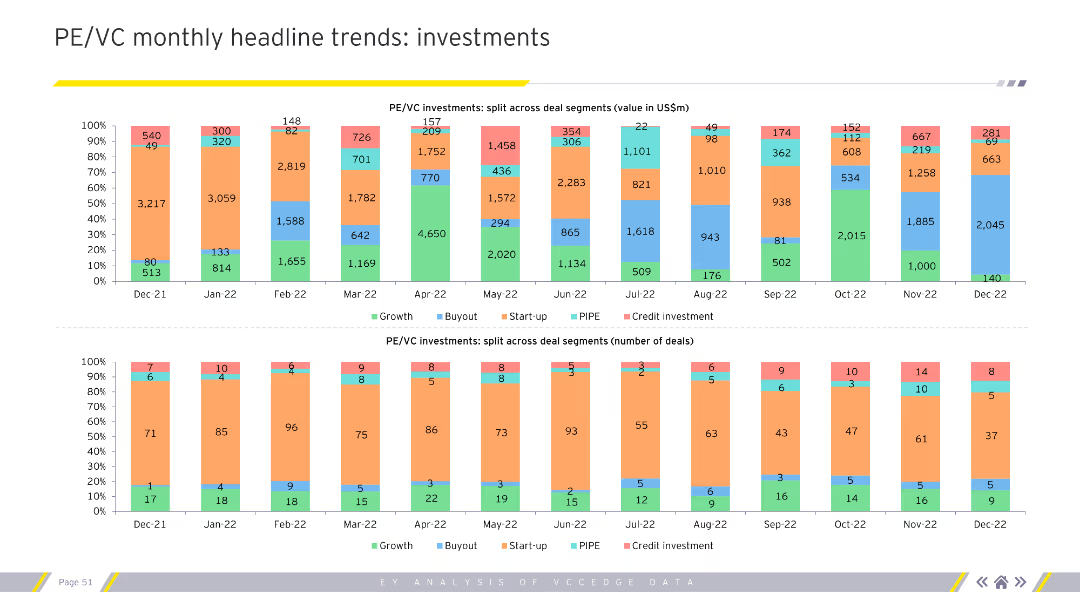
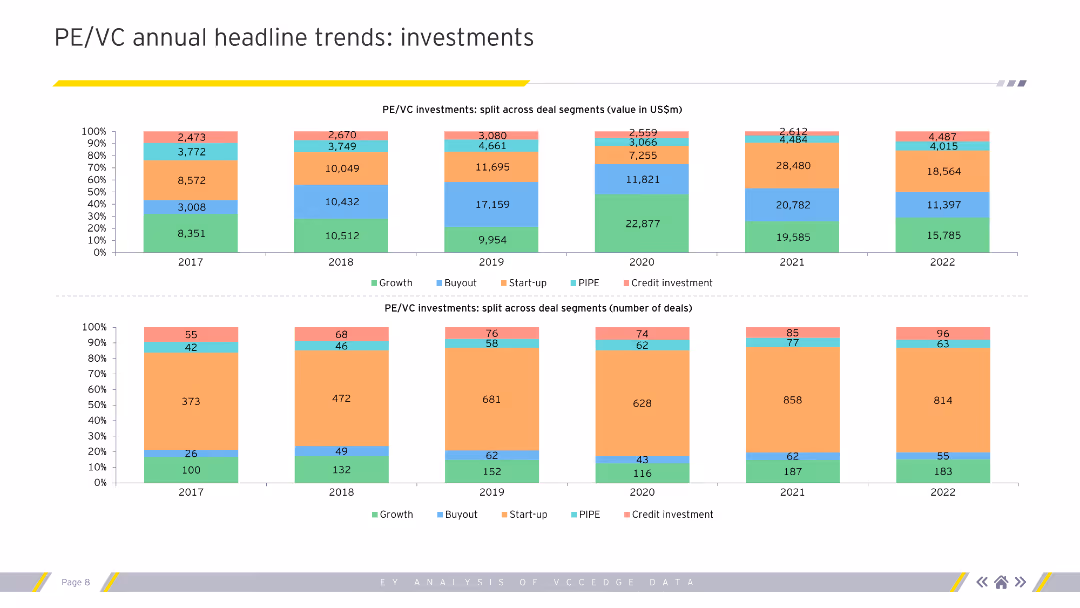
This slide features two stacked column charts: one showing PE/VC investments by deal segments in terms of value, and another showing the number of deals. The charts use different colors to differentiate between segments like Growth, Buyout, Start-up, PIPE, and Credit Investment, with detailed numerical data.
Market Analysis and Trends
Financial Services
This slide breaks down the PE/VC investments across various deal segments by both value and number of deals, providing a comprehensive view of how different segments are performing over time. This information is essential for strategic planning and investment analysis.
PE/VC, deal segments, investment value, number of deals, growth, buyout
false
Market Analysis and Trends
Financial Services
Multiple Chart
EY
Add to my slides
Remove from favorites
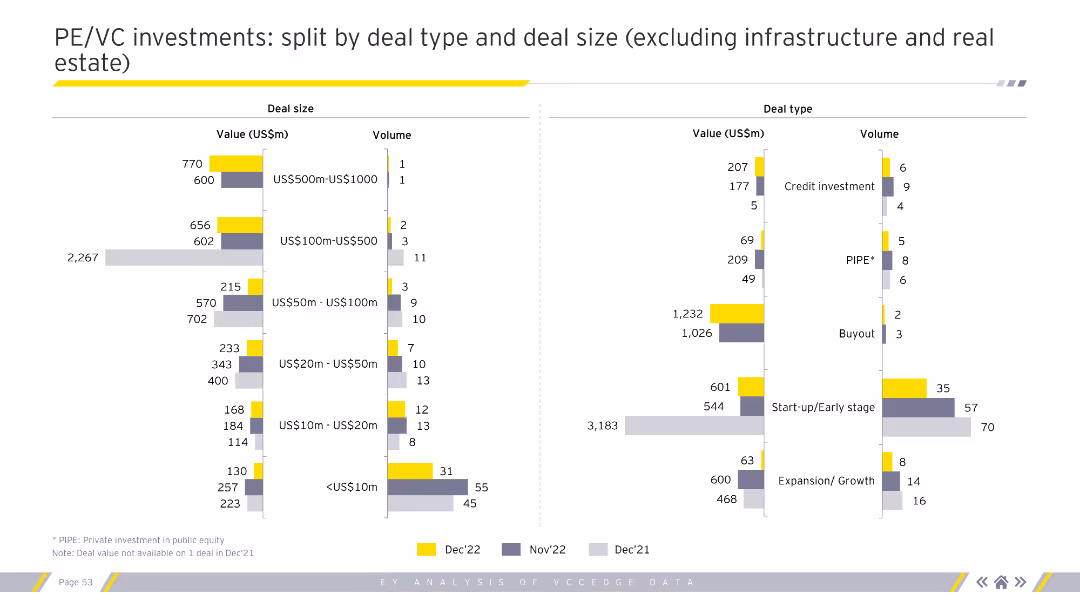
This slide features two bar charts: one showing PE/VC investments by deal size and the other by deal type, excluding infrastructure and real estate. It uses a color scheme to differentiate between months and categories, providing detailed numerical data for precise analysis.
Market Analysis and Trends
Financial Services
The slide provides a detailed breakdown of PE/VC investments by deal type and size, excluding infrastructure and real estate. This helps in understanding the distribution of investments across various deal sizes and types, aiding in strategic investment decisions.
PE/VC, deal type, deal size, investment distribution, strategic planning
false
Market Analysis and Trends
Financial Services
Multiple Chart
EY
Add to my slides
Remove from favorites
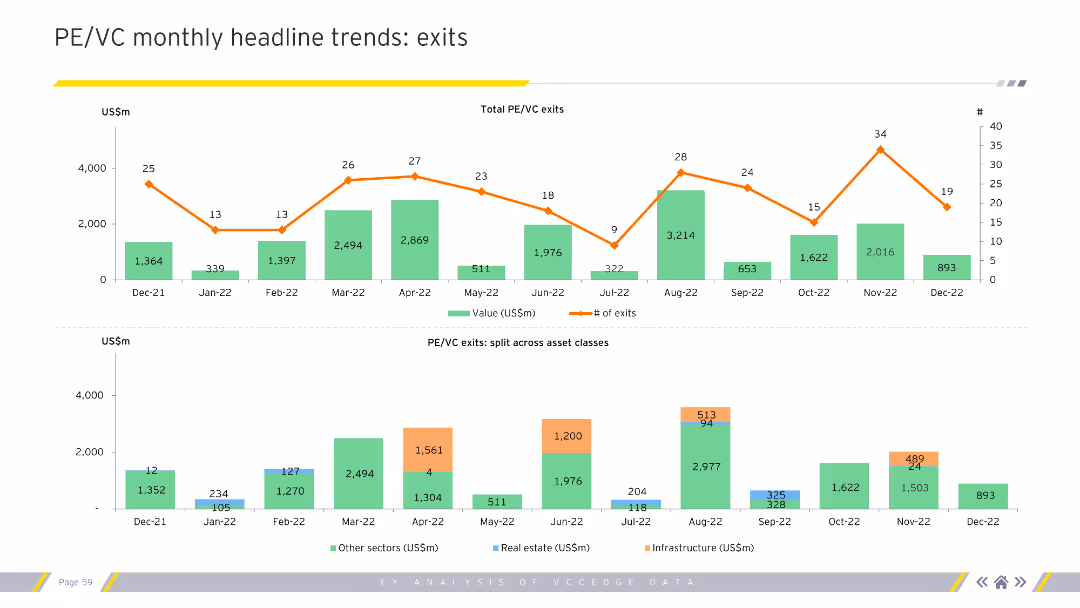
The slide contains two column charts. The upper chart shows PE/VC exit values in US$m against the number of exits from Jan-22 to Jan-23. The lower chart breaks down PE/VC exits across asset classes within the same period. The slide uses green, orange, and blue colors to differentiate data segments.
Market Analysis and Trends
Financial Services
The slide provides a monthly breakdown of Private Equity and Venture Capital (PE/VC) exits from January 2022 to January 2023. It shows both the total value of exits and the number of exits. Additionally, it splits the PE/VC exits across different asset classes, giving a detailed view of market trends and performance.
PE/VC, exits, asset classes, monthly trends, financial data, value, number, breakdown, market trends, performance
false
Market Analysis and Trends
Financial Services
Multiple Chart
EY
Add to my slides
Remove from favorites
The slide contains two main sections with column charts: the top section shows total PE/VC exits over time, and the bottom section splits exits across different asset classes.
Investment Analysis
Financial Services
This slide presents monthly trends in PE/VC exits, displaying total exit values and the distribution across various asset classes over a specific period.
PE/VC exits, monthly trends, asset classes, exit values, financial analysis
false
Investment Analysis
Financial Services
Multiple Chart
EY
Add to my slides
Remove from favorites
The slide includes two column charts. The top chart shows monthly exits trends by value and number of exits. The bottom chart shows exits split across asset classes.
Market Analysis and Trends
Financial Services
It analyzes PE/VC exit trends over several months, with data split across different asset classes.
PE, VC, exits, monthly trends, asset classes, value, number of exits
false
Market Analysis and Trends
Financial Services
Multiple Chart
EY
Add to my slides
Remove from favorites
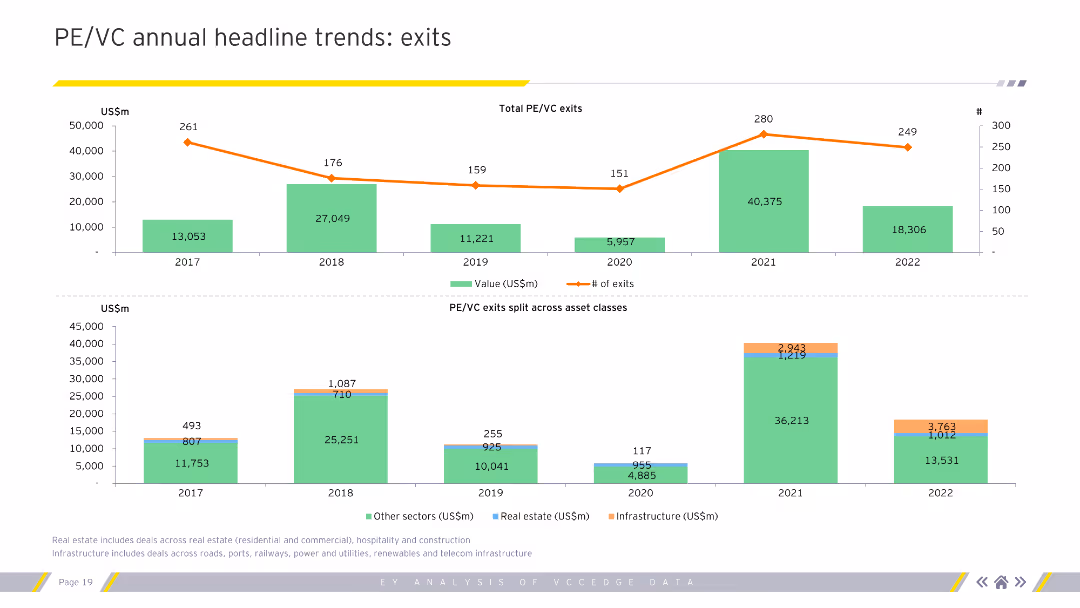
Column charts showing PE/VC exits split across asset classes, with total exits by value and number of exits for 2017-2022.
Investment Analysis
Financial Services
Analyzes annual trends in private equity and venture capital exits, focusing on value and number of exits.
PE/VC, exits, trends, asset classes, analysis
false
Investment Analysis
Financial Services
Multiple Chart
EY
Add to my slides
Remove from favorites
The slide contains a column chart showing total PE/VC exits over months and a stacked column chart splitting exits across asset classes. It uses a line chart to show the number of exits, creating a dense and informative visual that highlights trends over time.
Market Analysis and Trends
Financial Services
This slide illustrates the monthly trends in PE/VC exits, showing total exit values and the number of exits across various asset classes. It helps in analyzing exit trends over time, essential for understanding market behavior and planning exit strategies.
PE/VC, exits, trends, asset classes, number of exits
false
Market Analysis and Trends
Financial Services
Multiple Chart
EY
Add to my slides
Remove from favorites
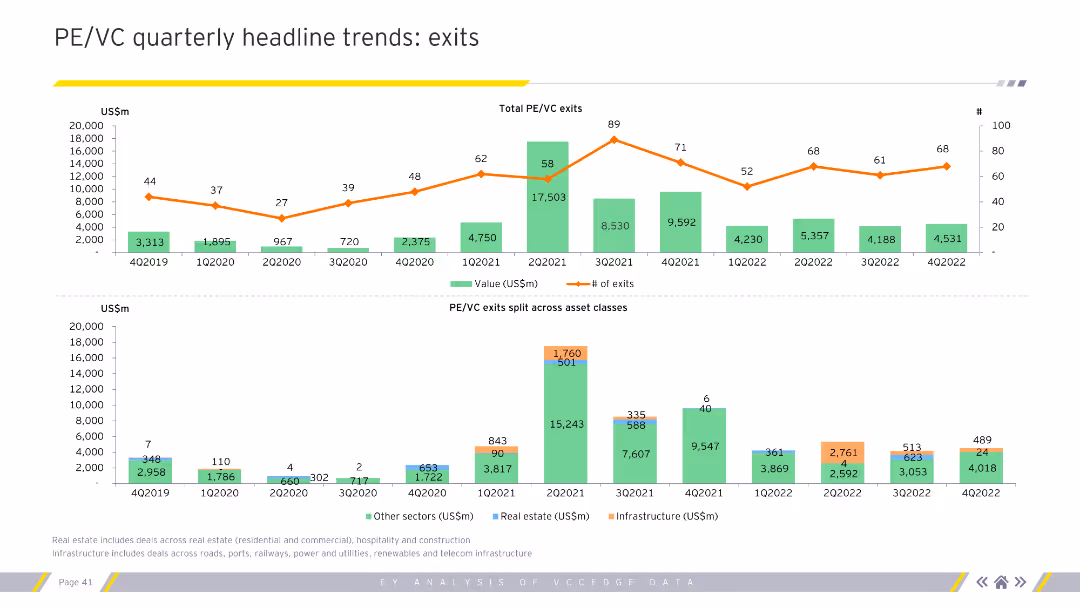
Features line and column charts showing total PE/VC exits by value and number across quarters, split by asset classes. Visual complexity is moderate.
Market Analysis and Trends
Financial Services
Highlights quarterly trends in private equity and venture capital exits, detailing values, number of exits, and sector-specific data. Essential for financial analysts and strategists.
PE, VC, exits, trends, financial, analysis
false
Market Analysis and Trends
Financial Services
Multiple Chart
EY
Add to my slides
Remove from favorites
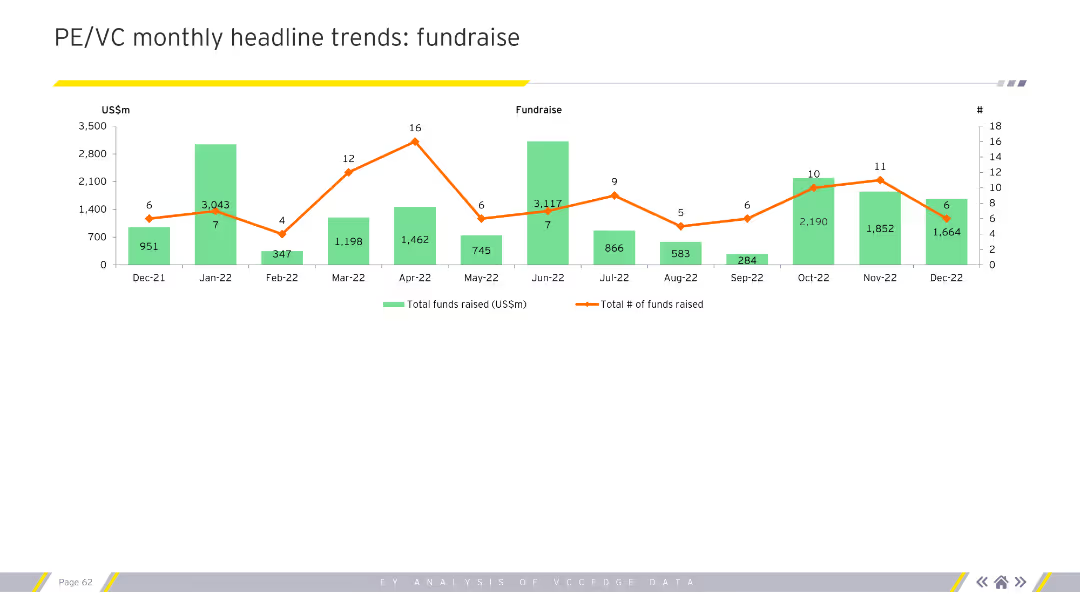
The slide contains a column chart showing monthly trends in PE/VC fundraising, with total funds raised in green bars and the number of funds raised represented by an orange line.
Market Analysis and Trends
Financial Services
This slide tracks monthly trends in private equity and venture capital fundraising over a year. It shows the total amount of funds raised each month and the corresponding number of funds. The purpose is to analyze fundraising activity trends.
PE/VC, Fundraise, Monthly Trends, Funds Raised, Column Chart, Line Chart
false
Market Analysis and Trends
Financial Services
Multiple Chart
EY
Add to my slides
Remove from favorites
The slide contains a column chart displaying monthly PE/VC fundraising totals in US$m and the number of funds raised from Jan-22 to Jan-23. The chart uses green for fund values and orange for the number of funds raised.
Market Analysis and Trends
Financial Services
The slide presents data on monthly PE/VC fundraising activities from January 2022 to January 2023. It highlights the total amount of funds raised and the number of fundraising events, showing trends in the fundraising landscape over the specified period.
PE/VC, fundraising, monthly trends, financial data, value, number, market analysis, fundraise trends, financial services, investment
false
Market Analysis and Trends
Financial Services
Single Chart
EY
Add to my slides
Remove from favorites
The slide includes a column chart tracking monthly headline trends for fundraising by total funds raised and number of funds raised.
Market Analysis and Trends
Financial Services
This slide tracks PE/VC fundraising trends over several months, highlighting total funds raised and the number of funds.
PE, VC, fundraising, monthly trends, total funds, number of funds
false
Market Analysis and Trends
Financial Services
Single Chart
EY
Add to my slides
Remove from favorites
The slide contains a column chart showing total funds raised over months and a line chart overlay indicating the number of funds raised. The visual is moderately dense, with detailed numerical data that highlights trends and patterns in fundraising activities.
Market Analysis and Trends
Financial Services
This slide provides an overview of monthly fundraising trends in PE/VC, showing the total funds raised and the number of fundraising activities. It helps in analyzing the fundraising landscape and identifying trends, useful for strategic financial planning and analysis.
PE/VC, fundraising, trends, total funds, number of funds
false
Market Analysis and Trends
Financial Services
Single Chart
EY
Add to my slides
Remove from favorites
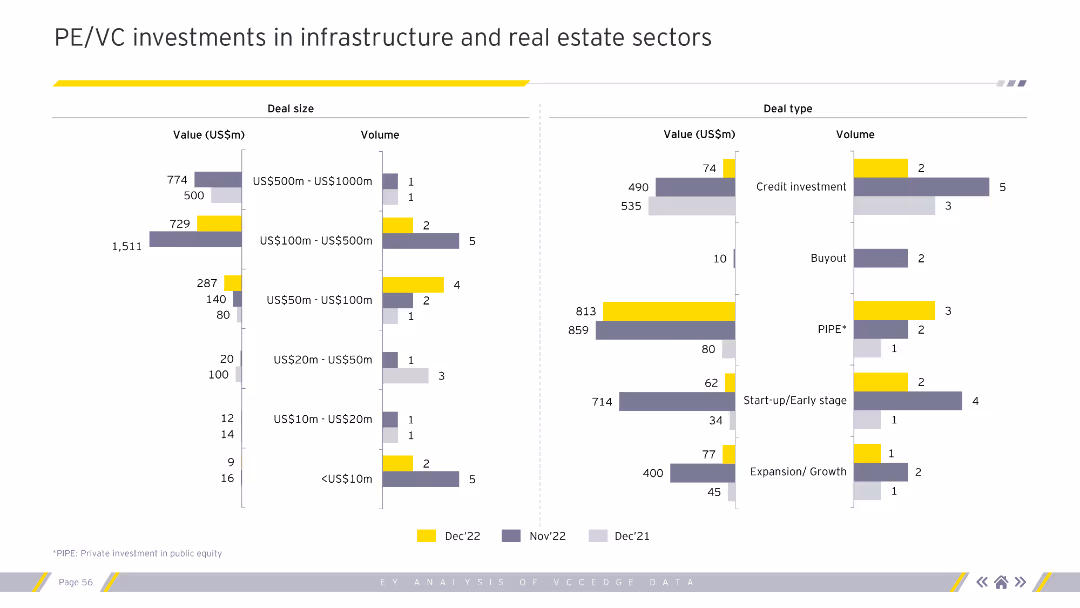
This slide features two bar charts: one illustrating investments by deal size and the other by deal type within the infrastructure and real estate sectors. The charts use color schemes to differentiate data points, providing a detailed and clear visual representation.
Market Analysis and Trends
Real Estate & Construction
The slide provides an in-depth look at PE/VC investments in infrastructure and real estate by deal size and type. It helps in understanding the distribution and scale of investments, aiding strategic planning and investment decision-making within these sectors.
PE/VC, infrastructure, real estate, deal size, deal type
false
Market Analysis and Trends
Real Estate & Construction
Multiple Chart
EY
Add to my slides
Remove from favorites
The slide features two bar charts. The left bar chart shows deal sizes by value and volume. The right bar chart shows deal types by value and volume.
Investment Analysis
Real Estate & Construction
This slide compares the PE/VC investments in infrastructure and real estate sectors based on deal size and type.
PE, VC, infrastructure, real estate, investments, deal size, deal type, volume, value
false
Investment Analysis
Real Estate & Construction
Multiple Chart
EY
Add to my slides
Remove from favorites
The slide contains two bar charts: one showing investments in infrastructure and real estate sectors by value, and the other by the number of deals. The charts use different colors for each month to make comparisons easier and highlight trends clearly.
Market Analysis and Trends
Real Estate & Construction
This slide focuses on PE/VC investments in the infrastructure and real estate sectors, detailing the investment values and number of deals. It helps in analyzing the investment patterns and trends within these specific sectors, providing insights for strategic planning.
PE/VC, infrastructure, real estate, investment value, number of deals
false
Market Analysis and Trends
Real Estate & Construction
Multiple Chart
EY
Add to my slides
Remove from favorites
The slide has two sections with stacked column charts: the top section shows investment values across deal segments, and the bottom section illustrates the number of deals in each segment.
Investment Analysis
Financial Services
This slide provides an overview of PE/VC investments split across deal segments, detailing both the value and the number of deals in each segment.
PE/VC investments, deal segments, investment values, deal count, financial analysis
false
Investment Analysis
Financial Services
Multiple Chart
EY
Add to my slides
Remove from favorites
Displays stacked column charts for PE/VC investments split across deal segments by value and number of deals monthly. Uses multiple colors for segmentation. Visual complexity is moderate.
Market Analysis and Trends
Financial Services
Provides a detailed monthly breakdown of PE/VC investments by deal segments (growth, buyout, startup), both in value and number. Useful for market analysts and investors.
PE, VC, investments, deal segments, monthly
false
Market Analysis and Trends
Financial Services
Multiple Chart
EY
Add to my slides
Remove from favorites
Shows column charts for PE/VC investments split by deal size and deal type, excluding infrastructure and real estate. Visual complexity is moderate.
Investment Analysis
Financial Services
Breaks down PE/VC investments by deal size and type, providing insights into investment strategies excluding infrastructure and real estate. Essential for investment analysts.
PE, VC, investments, deal size, deal type
false
Investment Analysis
Financial Services
Multiple Chart
EY
Add to my slides
Remove from favorites
The slide features two sections with bar charts: the left section shows deal sizes by value, and the right section illustrates deal types by volume and value.
Investment Analysis
Real Estate & Construction
This slide analyzes PE/VC investments in the infrastructure and real estate sectors, focusing on deal sizes and types, and providing a detailed breakdown of investment values and volumes.
PE/VC investments, deal size, deal type, infrastructure, real estate
false
Investment Analysis
Real Estate & Construction
Multiple Chart
EY
Add to my slides
Remove from favorites
The slide features two sections with bar charts: the left section shows deal sizes by value, and the right section illustrates deal types by volume and value.
Investment Analysis
Financial Services
This slide details PE/VC investments categorized by deal size and type, providing insights into the distribution of investment values and volumes across different deal categories.
PE/VC investments, deal size, deal type, investment values, investment volumes
false
Investment Analysis
Financial Services
Multiple Chart
EY
Add to my slides
Remove from favorites
The slide displays bar charts showing investments split by deal size and deal type, with values and volumes differentiated for recent months.
Market Analysis and Trends
Financial Services
This slide categorizes private equity and venture capital investments based on deal size and type, providing a detailed breakdown of investment amounts and volumes, useful for analyzing market dynamics and investment preferences.
PE/VC, Investments, Deal Size, Deal Type, Value, Volume, Bar Chart
false
Market Analysis and Trends
Financial Services
Multiple Chart
EY
Add to my slides
Remove from favorites
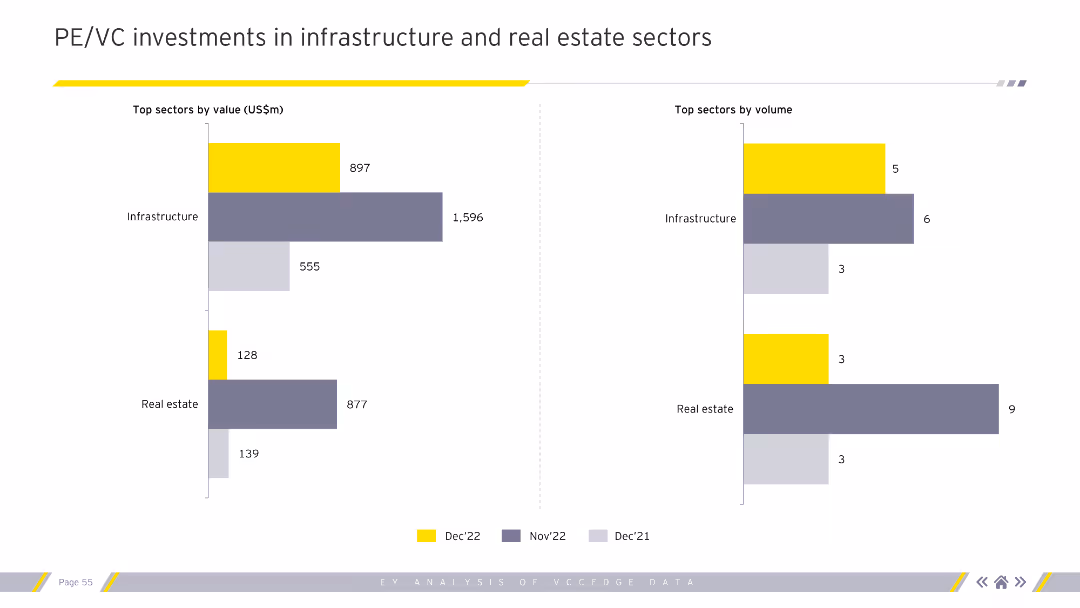
Displays column charts for top sectors by value and volume of PE/VC investments in infrastructure and real estate for different months. Uses grey, purple, and yellow colors. Visual complexity is moderate.
Investment Analysis
Real Estate & Construction
Examines PE/VC investments in infrastructure and real estate sectors, focusing on top sectors by value and volume. Vital for sector-specific investment analysis.
PE, VC, investments, infrastructure, real estate
false
Investment Analysis
Real Estate & Construction
Multiple Chart
EY
Add to my slides
Remove from favorites
The slide features bar charts showing investments in infrastructure and real estate sectors by deal size and type, with values and volumes for recent months.
Market Analysis and Trends
Real Estate & Construction
This slide breaks down private equity and venture capital investments in infrastructure and real estate by deal size and type, offering a detailed look at investment patterns and helping to understand sector-specific dynamics.
PE/VC, Investments, Infrastructure, Real Estate, Deal Size, Deal Type, Bar Chart
false
Market Analysis and Trends
Real Estate & Construction
Multiple Chart
EY
Add to my slides
Remove from favorites
The slide includes two bar charts: the left chart shows investment values in infrastructure and real estate, while the right chart displays the number of deals in each sector.
Investment Analysis
Real Estate & Construction
This slide examines PE/VC investments in infrastructure and real estate sectors, detailing investment values and the number of deals over a specific period.
PE/VC investments, infrastructure, real estate, investment values, deal count
false
Investment Analysis
Real Estate & Construction
Multiple Chart
EY
Add to my slides
Remove from favorites
The slide contains bar charts showing investments in infrastructure and real estate sectors by value and number of deals, with different time periods represented.
Market Analysis and Trends
Real Estate & Construction
This slide presents investment data for infrastructure and real estate sectors, comparing the total value of investments and the number of deals across different months, aimed at providing insights into sector-specific investment trends.
PE/VC, Investments, Infrastructure, Real Estate, Value, Deals, Bar Chart
false
Market Analysis and Trends
Real Estate & Construction
Multiple Chart
EY
Add to my slides
Remove from favorites
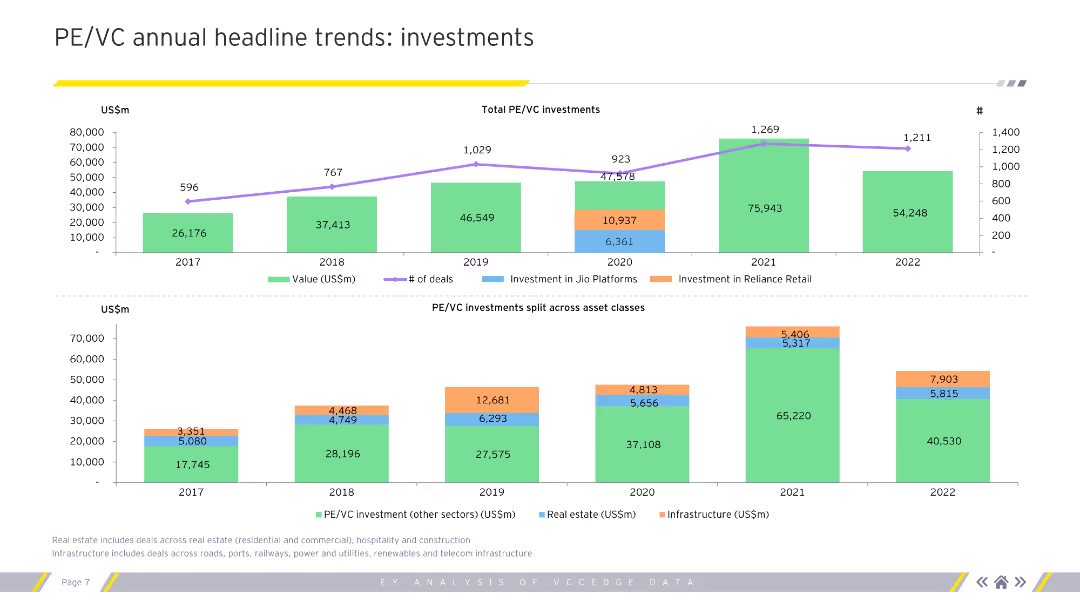
The slide contains column charts showing PE/VC investments by value, number of deals, and asset classes from 2017 to 2022.
Financial Performance
Financial Services
The slide presents PE/VC investment trends, highlighting total investments, number of deals, and asset class distribution over recent years.
PE/VC investments, investment trends, asset classes, column charts, financial performance
false
Financial Performance
Financial Services
Multiple Chart
EY
Add to my slides
Remove from favorites
The slide features two main sections with column charts: the top section shows total PE/VC investments over time, and the bottom section splits investments across different asset classes.
Investment Analysis
Financial Services
This slide presents monthly trends in PE/VC investments, displaying total investment values and the distribution across various asset classes.
PE/VC investments, monthly trends, asset classes, investment values, financial analysis
false
Investment Analysis
Financial Services
Multiple Chart
EY
Add to my slides
Remove from favorites
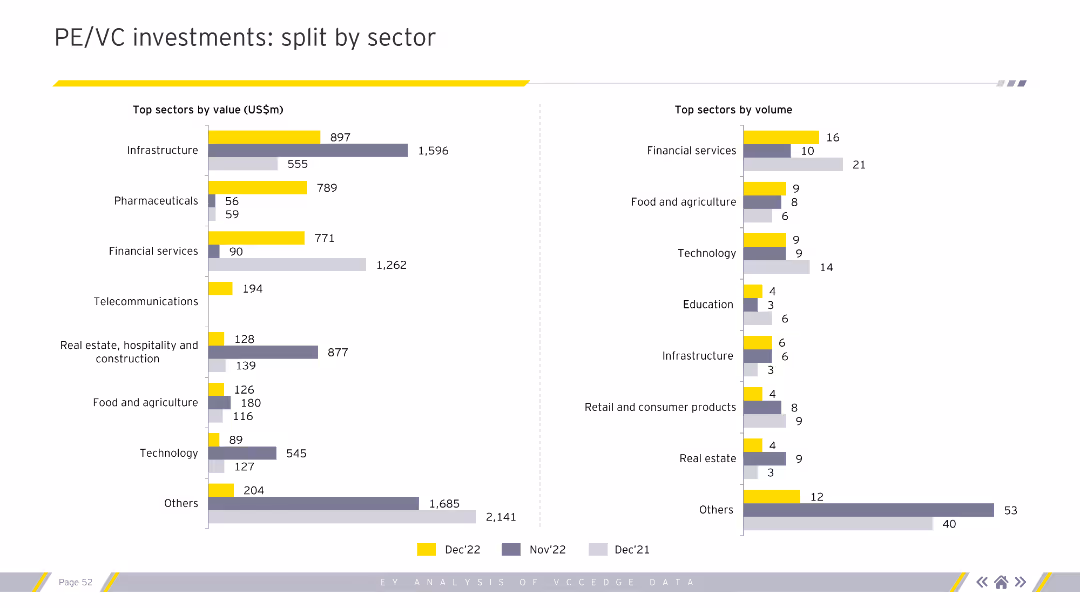
The slide contains two sections: the left section with a bar chart showing top sectors by investment value, and the right section with a column chart displaying the number of deals by sector.
Investment Analysis
Financial Services
This slide breaks down PE/VC investments by sector, highlighting the top sectors in terms of investment value and the number of deals completed.
PE/VC investments, sectors, investment value, deal count, financial analysis
false
Investment Analysis
Financial Services
Multiple Chart
EY
Add to my slides
Remove from favorites
The slide includes horizontal bar charts showing top sectors by investment value and number of deals for recent months, with color coding for different time periods.
Market Analysis and Trends
Financial Services
This slide analyzes private equity and venture capital investments by sector, comparing the top sectors by investment value and the number of deals over recent months, aimed at identifying sector trends and performance.
PE/VC, Investments, Sectors, Value, Deals, Trends, Bar Chart
false
Market Analysis and Trends
Financial Services
Multiple Chart
EY
Add to my slides
Remove from favorites
Contains column charts comparing top sectors by value and volume of PE/VC investments for different months. Uses grey, purple, and yellow colors. Visual complexity is moderate.
Market Analysis and Trends
Financial Services
Analyzes the distribution of PE/VC investments across various sectors by value and volume, highlighting key investment areas. Important for sector analysts and investors.
PE, VC, investments, sectors, value, volume
false
Market Analysis and Trends
Financial Services
Multiple Chart
EY
Add to my slides
Remove from favorites
This slide contains two main parts: a column chart showing total PE/VC investments over months, and a stacked column chart breaking down investments by asset classes. It includes detailed numerical data with a line chart overlaying deal numbers, creating a moderately dense and informative visual.
Market Analysis and Trends
Financial Services
The slide illustrates the monthly trends in private equity and venture capital investments, highlighting the total investment values and the number of deals across various asset classes. This helps analyze investment trends over time, beneficial for market analysis and strategic planning.
PE/VC, investments, trends, asset classes, deals
false
Market Analysis and Trends
Financial Services
Multiple Chart
EY
Add to my slides
Remove from favorites
Column charts showing PE/VC investment splits by value and number of deals across deal segments for 2017-2022.
Investment Analysis
Financial Services
Analyzes annual trends in private equity and venture capital investments, focusing on value and number of deals.
PE/VC, investments, trends, deals, growth
false
Investment Analysis
Financial Services
Multiple Chart
EY
Add to my slides
Remove from favorites
The slide features two column charts. The upper chart shows total PE/VC investments in agriculture from 2018 to Jan-23. The lower chart details deal types by the number of deals and investment values in US$m. The charts use blue and orange to differentiate data points.
Market Analysis and Trends
Agriculture & Food Production
This slide focuses on PE/VC investment trends in the agriculture sector from 2018 to January 2023. It provides an overview of total investment values and the number of deals over the years, along with a detailed breakdown of deal types and their respective values.
PE/VC, investment trends, agriculture, deal types, financial data, investment values, number of deals, market trends, sector analysis, financial services
false
Market Analysis and Trends
Agriculture & Food Production
Multiple Chart
EY
Add to my slides
Remove from favorites
The slide contains two bar charts: one depicting top sectors by investment value and the other by number of deals. It uses a color scheme to differentiate data from different months, making it easy to compare sector performance across different time periods.
Market Analysis and Trends
Financial Services
This slide highlights the distribution of PE/VC investments across various sectors by both value and number of deals. It provides a clear comparison of sector-wise investment trends, useful for identifying high-performing sectors and strategic planning.
PE/VC, sectors, investment value, number of deals, sector performance
false
Market Analysis and Trends
Financial Services
Multiple Chart
EY
Add to my slides
Remove from favorites
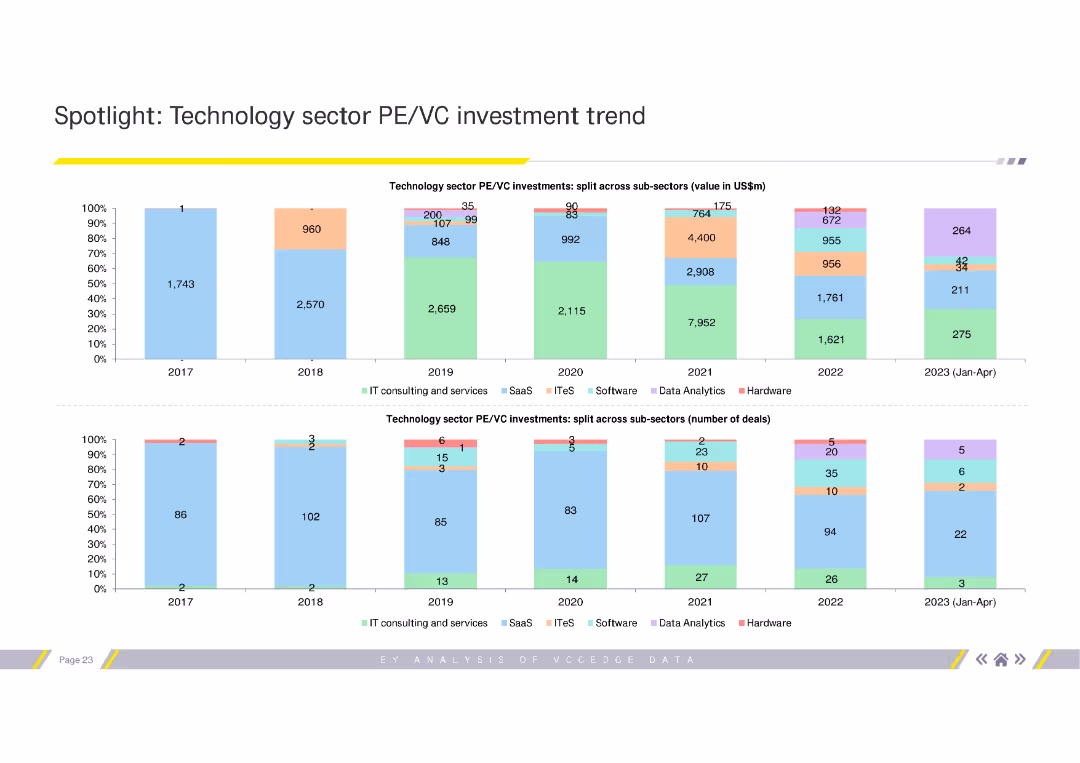
The slide features two column charts showing PE/VC investment trends in the technology sector. The first chart depicts investment values, the second shows the number of deals.
Investment Analysis
Financial Services
This slide analyzes the investment trends in the technology sector for PE/VC from 2017 to 2023. It breaks down the investments into sub-sectors like SaaS, IT consulting, etc.
PE/VC, technology, investment, trends, sub-sectors
false
Investment Analysis
Financial Services
Multiple Chart
EY
Add to my slides
Remove from favorites
This slide features a column chart showing technology sector PE/VC investments over years, with a line chart indicating the number of deals. It includes two stacked column charts breaking down investments by deal segments in terms of value and number of deals.
Market Analysis and Trends
Technology & Software
The slide highlights PE/VC investment trends in the technology sector, showing investment values and the number of deals over several years. It breaks down investments by deal segments, providing a comprehensive view of the sector's investment landscape.
PE/VC, technology sector, investment trends, deal segments, number of deals
false
Market Analysis and Trends
Technology & Software
Multiple Chart
EY
Add to my slides
Remove from favorites
The slide has text on the left emphasizing bold new ways of thinking, with three bullet points on the right indicating strategic initiatives for pharma companies.
Strategic Planning
Healthcare & Pharmaceuticals
The slide encourages pharma companies to continuously challenge what defines relevance, stop regarding field force as standalone, and minimize content clutter.
pharma, bold, strategies, relevance, content clutter
false
Strategic Planning
Healthcare & Pharmaceuticals
Vertical Flow
Accenture
Add to my slides
Remove from favorites
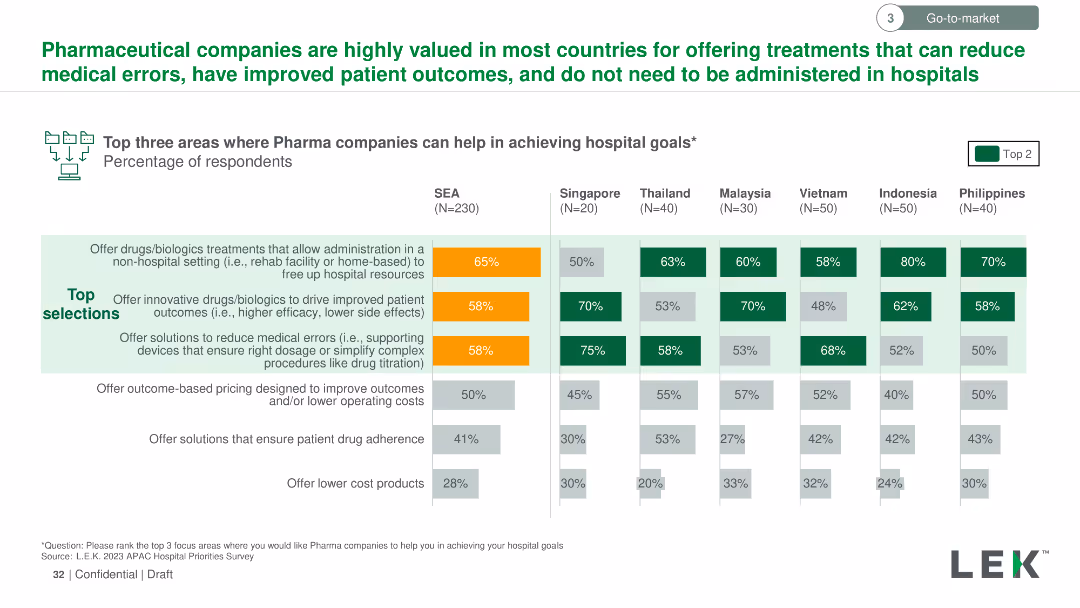
The slide uses a column chart to show the percentage of respondents selecting top areas where pharmaceutical companies can help achieve hospital goals across multiple countries. Key areas highlighted with orange and green colors.
Strategic Planning
Healthcare & Pharmaceuticals
The slide illustrates the top three areas where pharmaceutical companies can aid hospitals, focusing on non-hospital drug administration, innovative drug solutions, and medical error reduction. Data is broken down by country in Southeast Asia.
Pharmaceutical, hospitals, goals, respondents, percentage, non-hospital, innovative, error reduction
false
Strategic Planning
Healthcare & Pharmaceuticals
Multiple Chart
LEK
Add to my slides
Remove from favorites
The slide contains column charts showing sales and EBITDA figures for Q2 2020, with bullet points detailing the impacts of COVID-19 on elective treatments and procurement in China.
Financial Performance
Healthcare & Pharmaceuticals
This slide analyzes the financial impact of COVID-19 on the pharmaceutical sector in Q2 2020, highlighting reductions in elective treatments and volume-based procurement in China, along with sales and EBITDA figures.
Pharmaceuticals, COVID-19, Sales Impact, EBITDA, China
false
Financial Performance
Healthcare & Pharmaceuticals
Multiple Chart
Credit Suisse
Add to my slides
Remove from favorites
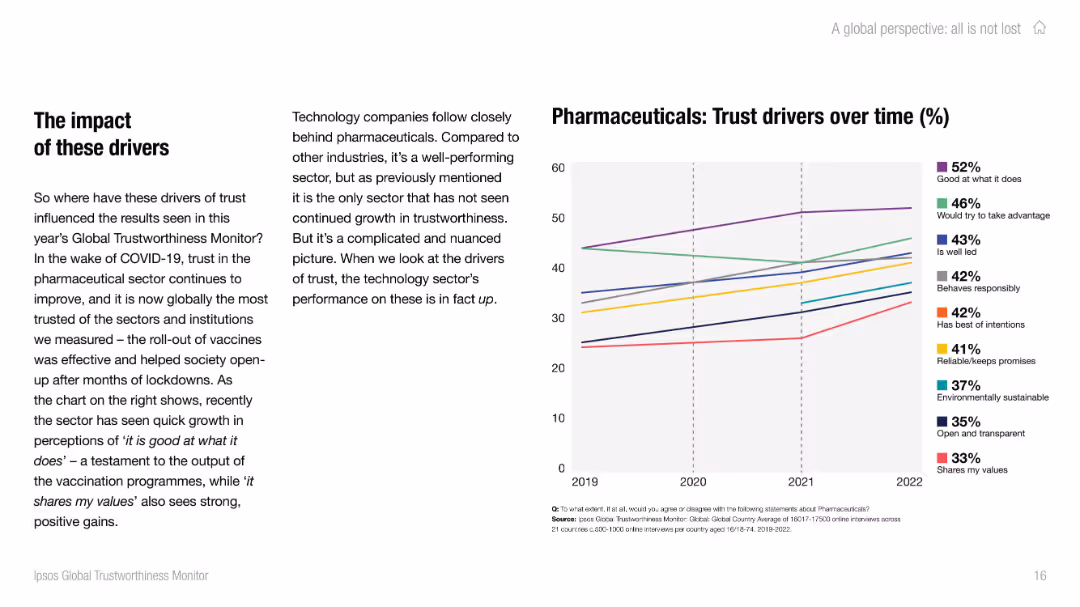
Left panel contains narrative on pharmaceutical trust growth; right side presents a multi-line graph showing trust driver metrics for the pharmaceutical sector from 2019–2022.
Market Analysis and Trends
Healthcare & Pharmaceuticals
This slide analyzes how specific trust drivers have influenced the pharmaceutical sector's trust growth post-COVID-19. Trust has risen due to perceptions of competence, leadership, and shared values. The chart quantifies these drivers over time, revealing sharp increases in key areas.
pharmaceuticals, COVID-19, trust metrics, driver analysis, vaccines, sector trust, public opinion, trend lines
false
Market Analysis and Trends
Healthcare & Pharmaceuticals
Mixed Chart
IPSOS
Add to my slides
Remove from favorites
Column charts showing foreign investment projects in pharmaceuticals and medical devices from 2018-2022.
Market Analysis and Trends
Healthcare & Pharmaceuticals
This slide discusses trends in foreign investments in the health sector, noting a slowdown but still above pre-COVID-19 levels.
pharmaceuticals, healthsciences, investment, Europe, trends
false
Market Analysis and Trends
Healthcare & Pharmaceuticals
Mixed Chart
EY
Add to my slides
Remove from favorites
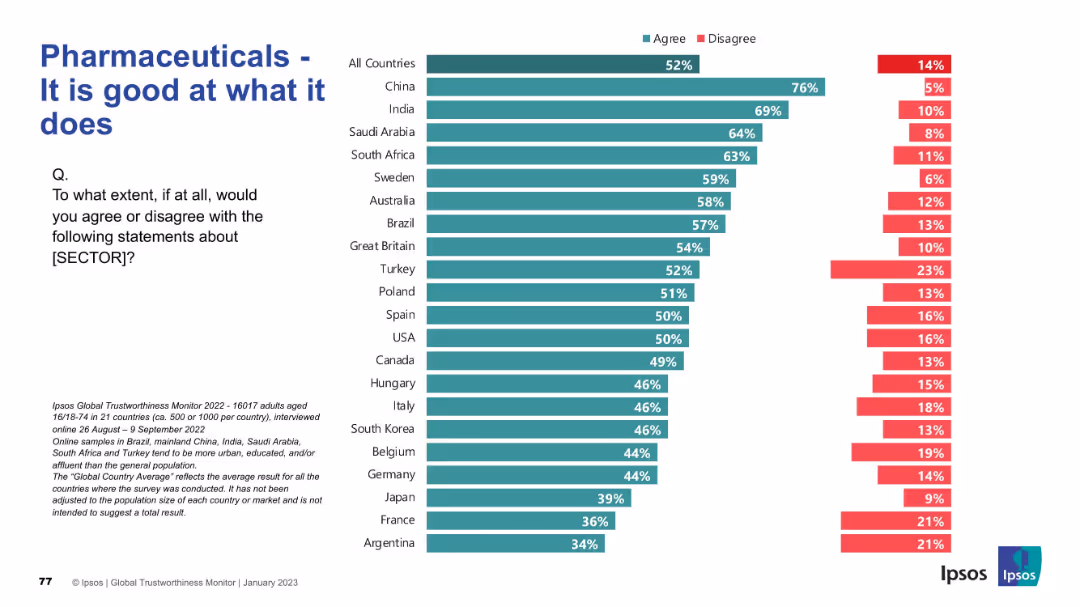
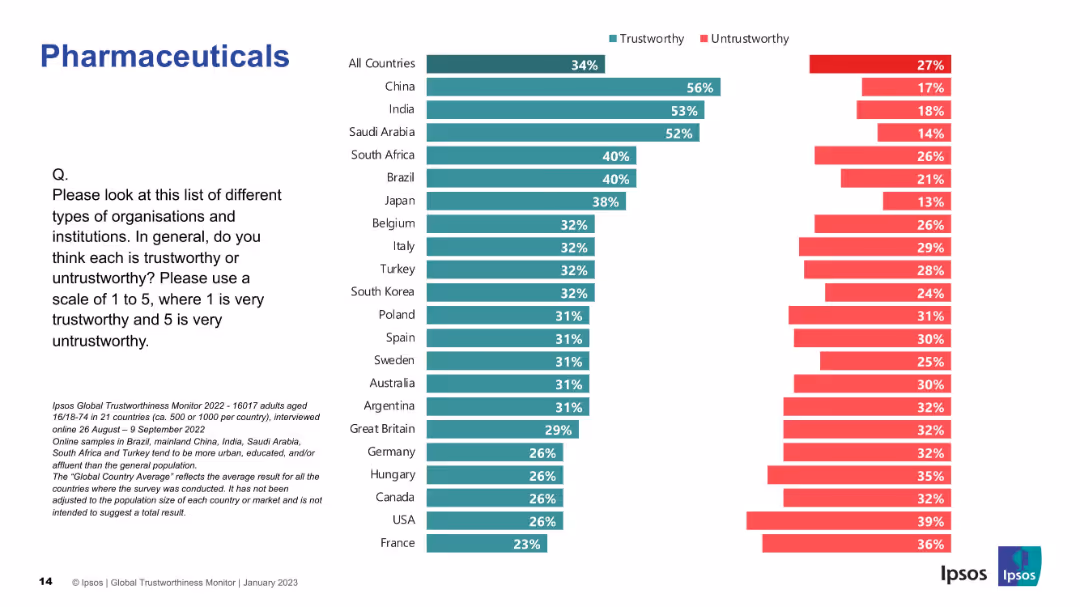
Horizontal bar chart with teal ("Agree") and red ("Disagree") segments per country, left-aligned title, question in black text, and Ipsos footer.
Market Analysis and Trends
Healthcare & Pharmaceuticals
This slide presents international public opinion on how well the pharmaceutical sector performs its functions, showing agreement levels by country. China, India, and Saudi Arabia have the highest agreement, while France and Argentina rank lowest.
pharmaceuticals, performance, global opinion, Ipsos, sector evaluation, trust, countries, agreement, industry perception, healthcare
false
Market Analysis and Trends
Healthcare & Pharmaceuticals
Mixed Chart
IPSOS
Add to my slides
Remove from favorites
The slide contains a text block discussing challenges faced by pharma companies and a list of company types within the industry.
Market Analysis and Trends
Healthcare & Pharmaceuticals
This slide outlines the key challenges faced by pharmaceutical companies and provides an overview of different company types in the sector.
pharma challenges, company types, market trends, industry overview, growth challenges
false
Market Analysis and Trends
Healthcare & Pharmaceuticals
Mixed Chart
Roland Berger
Add to my slides
Remove from favorites
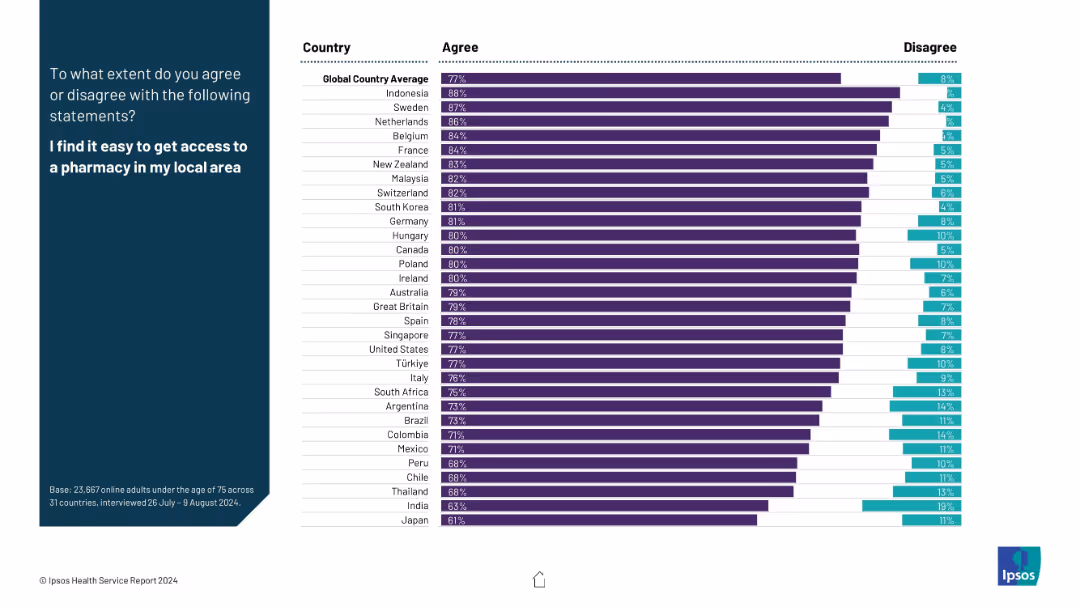
The layout includes agreement and disagreement percentages in horizontal bar format; global and country-specific values are displayed in a two-color bar chart.
Performance Metrics and KPIs
Healthcare & Pharmaceuticals
This slide assesses the ease of pharmacy access. Most countries show high agreement rates (e.g., Indonesia, Sweden), with global average agreement at 77%. Disagreement percentages are also highlighted.
pharmacy access, satisfaction, healthcare infrastructure, patient experience, availability, global survey, healthcare KPIs
false
Performance Metrics and KPIs
Healthcare & Pharmaceuticals
Mixed Chart
IPSOS
Add to my slides
Remove from favorites
The slide features a text block discussing key considerations for pharma executives and a radar chart illustrating strategic imperatives.
Strategic Planning
Healthcare & Pharmaceuticals
This slide provides an overview of the main considerations for pharma executives, including strategic imperatives and business leadership elements.
pharma executives, strategic imperatives, business leadership, strategic planning, radar chart
false
Strategic Planning
Healthcare & Pharmaceuticals
Diagram
Roland Berger
Add to my slides
Remove from favorites
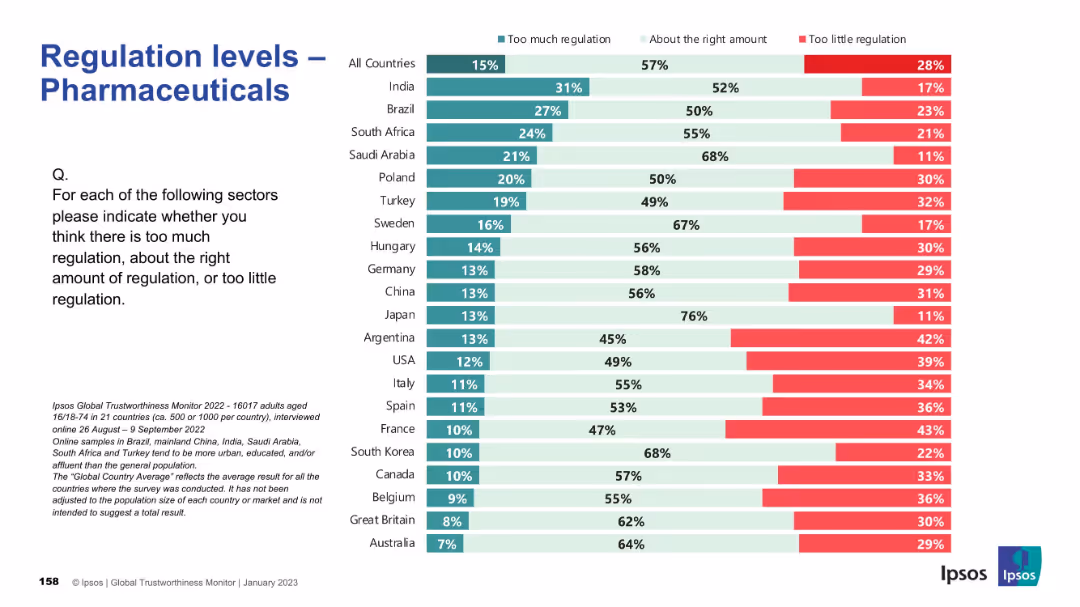
Same visual template; bar chart segmented by regulation perception; countries arranged top to bottom.
Regulatory and Compliance
Healthcare & Pharmaceuticals
The slide assesses how different countries perceive regulation in the pharmaceutical industry. While the global average suggests most think regulation is appropriate, countries such as Argentina, France, and USA show notable concern about underregulation. Japan, in contrast, sees regulation as sufficient.
pharma, healthcare, drug regulation, Ipsos, international survey, compliance, governance, public perception, health industry, oversight
false
Regulatory and Compliance
Healthcare & Pharmaceuticals
Mixed Chart
IPSOS
Add to my slides
Remove from favorites
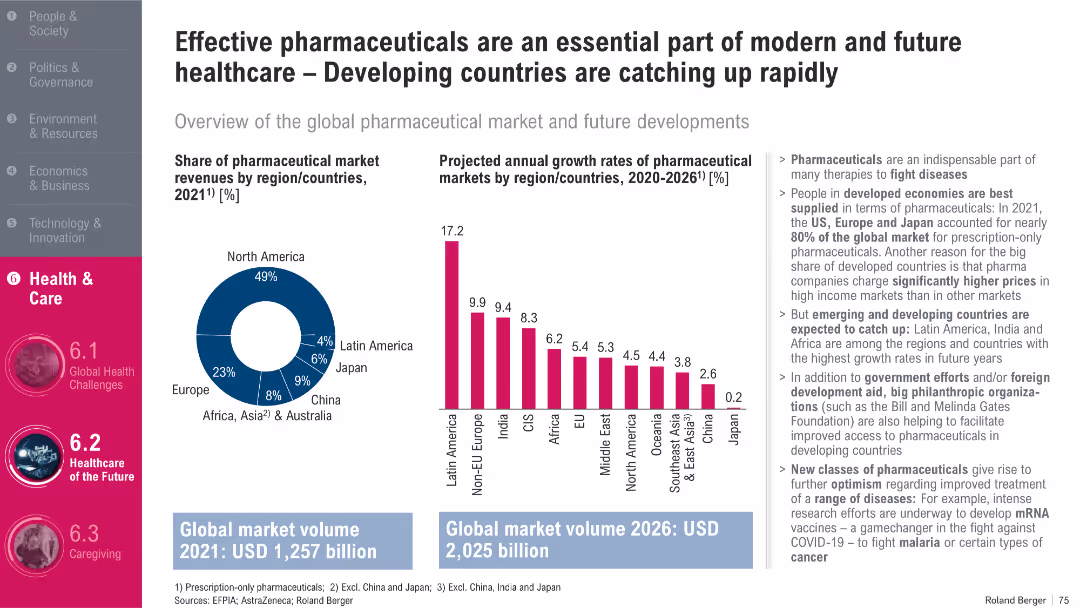
Pie chart (left), bar chart (right); bullet text with emphasis; blue-magenta palette
Market Analysis and Trends
Healthcare & Pharmaceuticals
The slide covers current pharmaceutical market shares and projected growth by region through 2026. While North America dominates current revenues, future growth is expected in developing regions like Latin America, India, and Africa. It emphasizes opportunities in innovation and access to modern medicines.
Pharma Market, Growth, Developing Markets, Innovation, Access
false
Market Analysis and Trends
Healthcare & Pharmaceuticals
Multiple Chart
Roland Berger
Add to my slides
Remove from favorites
The slide includes text on pharma companies' performance and a scatter plot matrix showing financial performance by product segment.
Competitive Landscape
Healthcare & Pharmaceuticals
This slide analyzes the performance disparity among pharma companies, identifying characteristics of top-performing companies (winners).
pharma performance, winners, financial matrix, product segments, competitive analysis
false
Competitive Landscape
Healthcare & Pharmaceuticals
Mixed Chart
Roland Berger
Add to my slides
Remove from favorites
The slide contains text and a bar chart comparing the share of winners across different pharma segments, highlighting blood plasma and CMO/CDMO.
Competitive Landscape
Healthcare & Pharmaceuticals
This slide presents data on the segments of the pharma industry with the highest share of top-performing companies, focusing on blood plasma and CDMO.
pharma segments, share of winners, blood plasma, CMO/CDMO, top-performing companies
false
Competitive Landscape
Healthcare & Pharmaceuticals
Multiple Chart
Roland Berger
Add to my slides
Remove from favorites
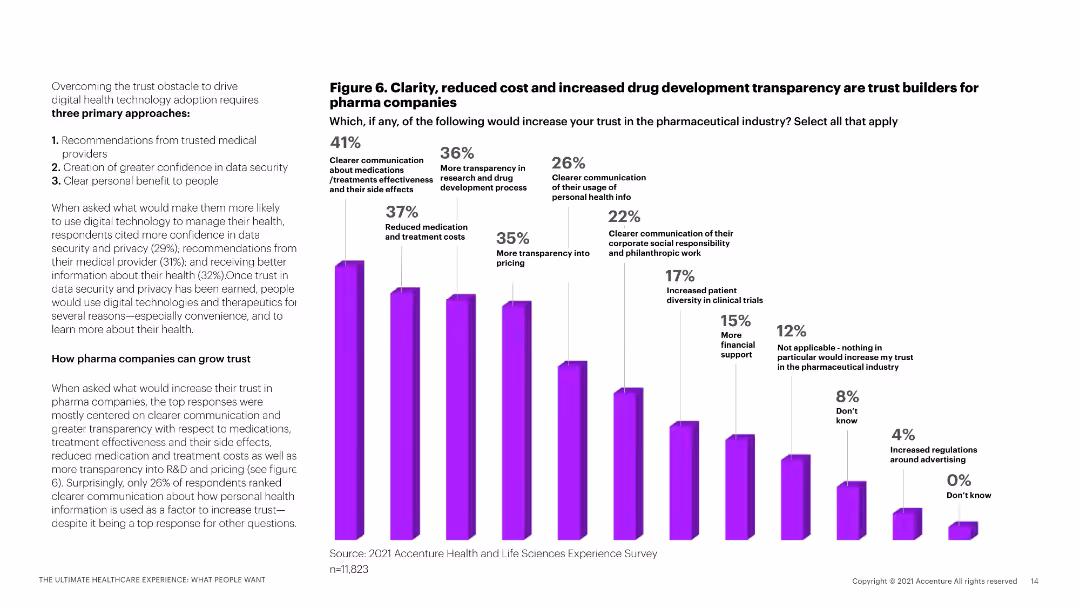
The slide features a column chart showing factors that would increase trust in pharmaceutical companies, with a textual description.
Market Analysis and Trends
Healthcare & Pharmaceuticals
This slide discusses factors that can build trust in pharmaceutical companies, such as communication clarity and reduced medication costs.
pharma trust, communication clarity, medication costs, transparency, patient trust
false
Market Analysis and Trends
Healthcare & Pharmaceuticals
Mixed Chart
Accenture
Add to my slides
Remove from favorites
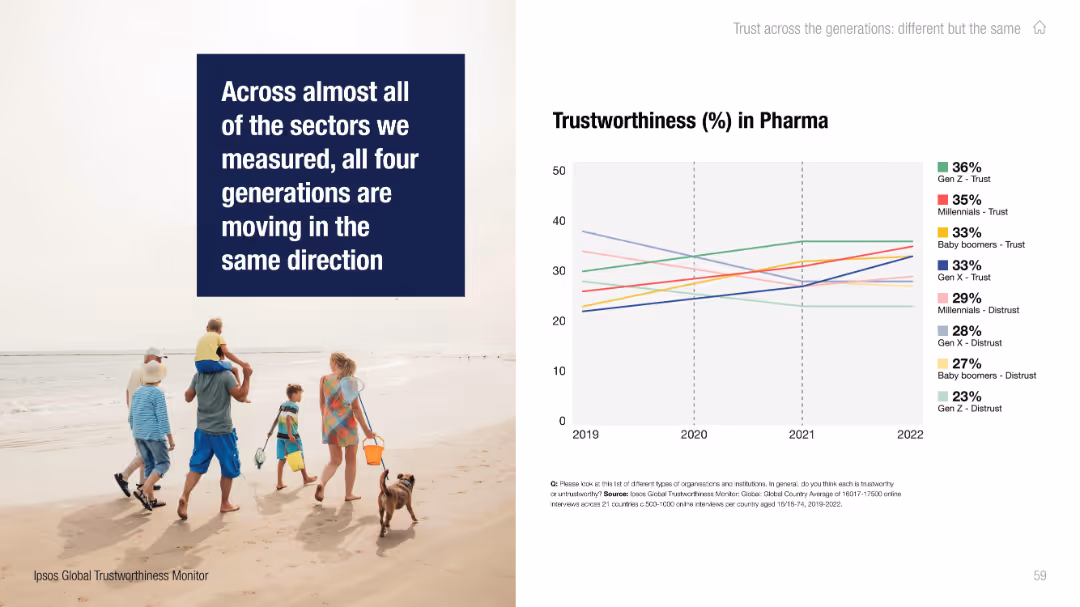
Split layout: photo of family walking on the beach with a bold quote on the left; line chart on the right.
Performance Metrics and KPIs
Healthcare & Pharmaceuticals
The slide highlights generational trends in trust toward the pharmaceutical sector, noting a general increase in trust across generations from 2019 to 2022.
pharma, trust, generational data, Ipsos, Millennials, Gen Z, Baby Boomers, Gen X, trend chart, trustworthiness
false
Performance Metrics and KPIs
Healthcare & Pharmaceuticals
Mixed Chart
IPSOS
Add to my slides
Remove from favorites
Vertical ranking bar chart; green/red bars show public trust in pharmaceutical sector by country.
Market Analysis and Trends
Healthcare & Pharmaceuticals
The slide reveals global trust levels in pharmaceutical companies, with China, India, and Saudi Arabia perceived as most trustworthy.
pharma, trust, global ranking, countries, survey, perception, Ipsos, healthcare, trustworthy, untrustworthy
false
Market Analysis and Trends
Healthcare & Pharmaceuticals
Mixed Chart
IPSOS
Add to my slides
Remove from favorites
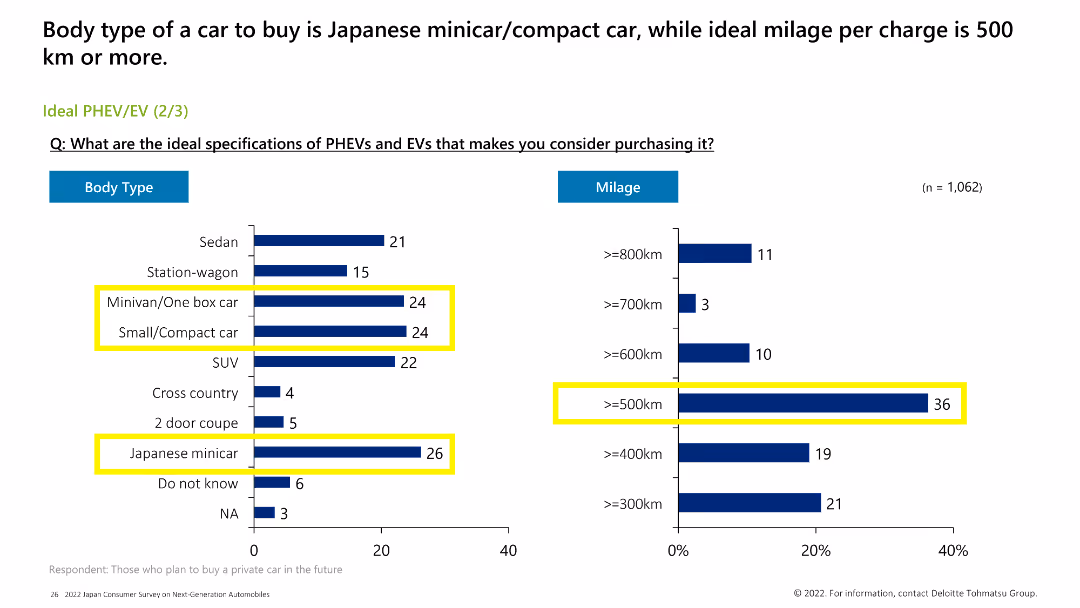
Column chart showing preferred body types and mileage for PHEV/EVs. Consumers favor Japanese minicars/compact cars with a mileage of 500 km or more per charge.
Market Analysis and Trends
Transportation & Logistics
The slide presents consumer preferences for PHEV/EV body types and mileage, highlighting a preference for Japanese minicars/compact cars and a minimum mileage of 500 km per charge.
PHEV, EV, body type, mileage, compact car, minicar, preference
false
Market Analysis and Trends
Transportation & Logistics
Multiple Chart
Deloitte
Add to my slides
Remove from favorites
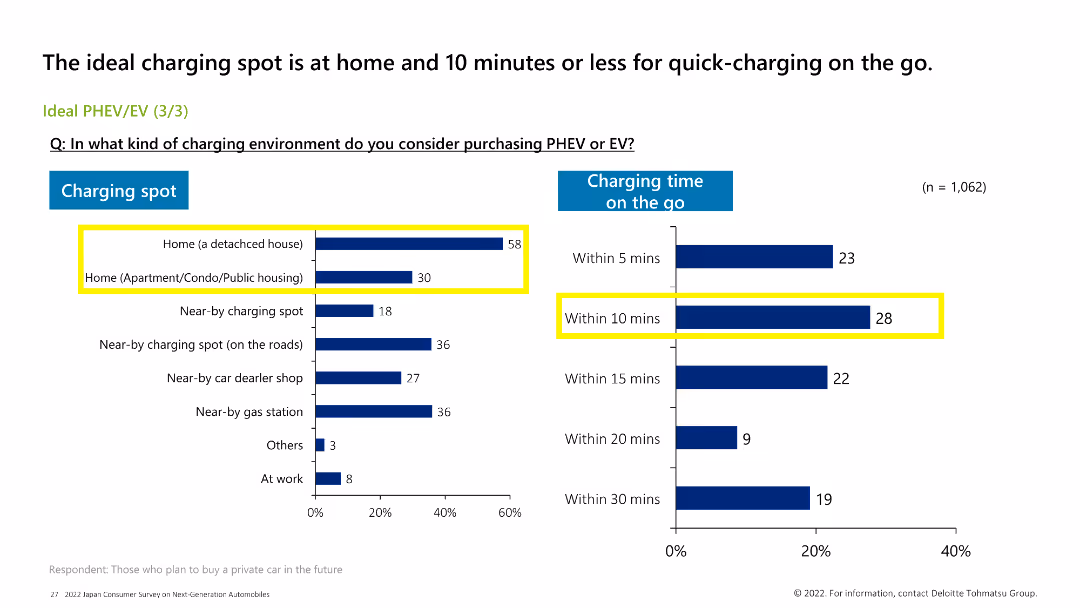
The slide features a bar chart on the left showing preferred charging spots, and a column chart on the right showing preferred charging times on the go. Color coding differentiates the data.
Market Analysis and Trends
Transportation & Logistics
The slide highlights the preferred charging locations for PHEV/EV and the desired charging times, with the most preferred location being at home and the preferred charging time within 10 mins.
PHEV, EV, charging spot, charging time, consumer preferences
false
Market Analysis and Trends
Transportation & Logistics
Multiple Chart
Deloitte
Add to my slides
Remove from favorites
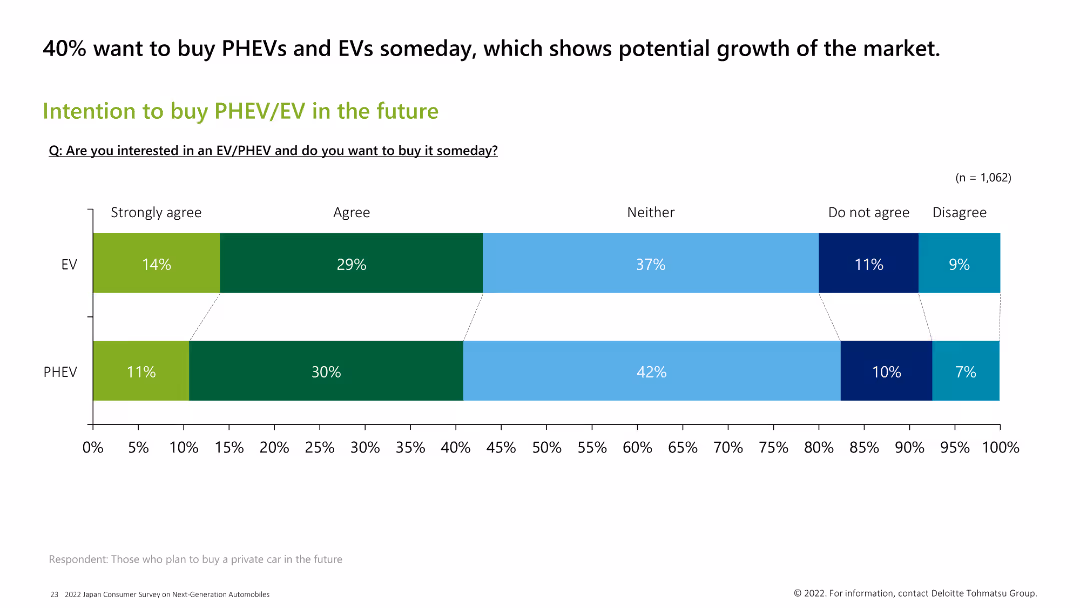
Horizontal bar chart showing consumer intentions to buy PHEV/EVs in the future. A significant portion (40%) expresses interest in purchasing these vehicles.
Market Analysis and Trends
Transportation & Logistics
The slide captures the future purchasing intentions for PHEV/EVs, indicating that 40% of consumers are interested in buying these vehicles someday, reflecting potential market growth.
PHEV, EV, future purchase, consumer intention, market growth
false
Market Analysis and Trends
Transportation & Logistics
Single Chart
Deloitte
Add to my slides
Remove from favorites
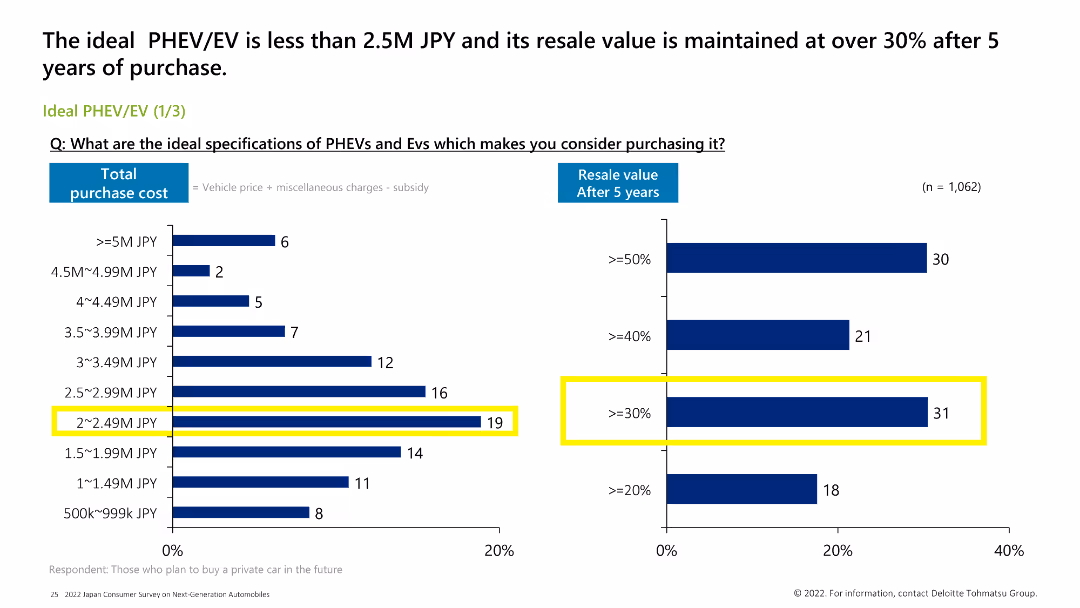
Column chart showing ideal specifications for PHEV/EVs regarding total purchase cost and resale value after 5 years. Most consumers prefer a cost below 2.5M JPY with a resale value over 30%.
Market Analysis and Trends
Transportation & Logistics
This slide outlines the ideal characteristics of PHEV/EVs for consumers, emphasizing a total purchase cost of under 2.5M JPY and a resale value of more than 30% after five years.
PHEV, EV, ideal specifications, purchase cost, resale value
false
Market Analysis and Trends
Transportation & Logistics
Multiple Chart
Deloitte
Add to my slides
Remove from favorites
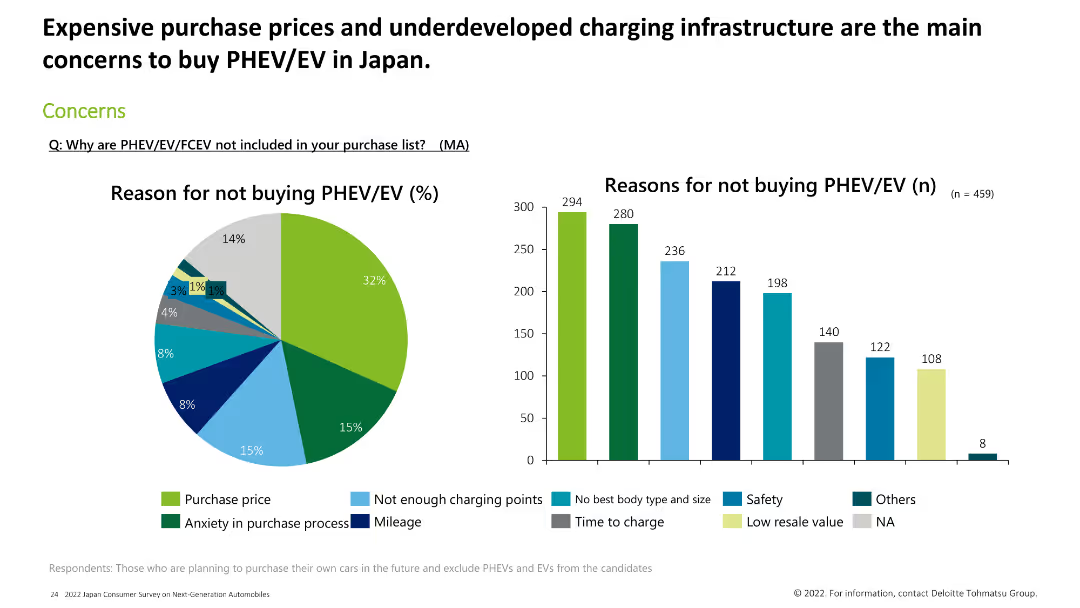
Pie chart and column chart showing reasons for not buying PHEV/EV, such as high purchase price, lack of charging points, and safety concerns.
Market Analysis and Trends
Transportation & Logistics
This slide discusses the main reasons consumers avoid purchasing PHEV/EVs, including high costs, insufficient charging infrastructure, and safety issues.
PHEV, EV, purchase concerns, charging points, cost, safety
false
Market Analysis and Trends
Transportation & Logistics
Multiple Chart
Deloitte
Add to my slides
Remove from favorites
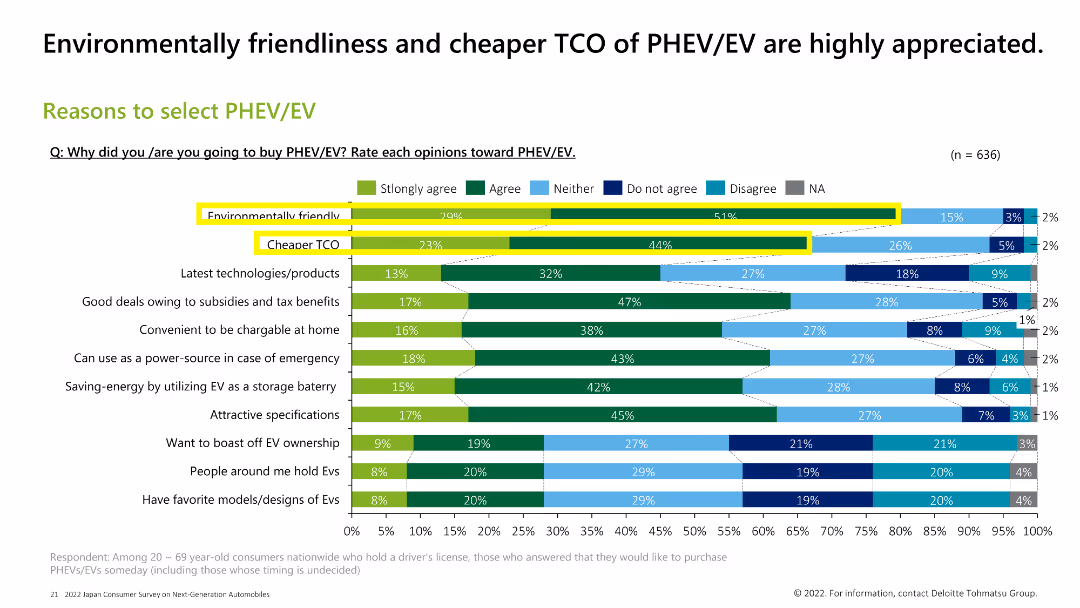
Horizontal bar chart illustrating the reasons for selecting PHEV/EV, with environmental friendliness and cheaper total cost of ownership (TCO) being the top reasons.
Market Analysis and Trends
Transportation & Logistics
This slide explains why consumers choose PHEV/EVs, highlighting environmental benefits and lower TCO as the primary motivations. It also lists other factors like technology, subsidies, and convenience.
PHEV, EV, selection reasons, environmental, TCO, technology
false
Market Analysis and Trends
Transportation & Logistics
Single Chart
Deloitte
Add to my slides
Remove from favorites
A column chart comparing emission profiles and commitments
Regulatory and Compliance
Government & Public Sector
Compares the Philippines' climate action and policies against ASEAN peers, highlighting areas of improvement and governmental commitments.
Philippines, ASEAN, climate action, policy, comparison
false
Regulatory and Compliance
Government & Public Sector
Header Horizontal
Bain
Add to my slides
Remove from favorites
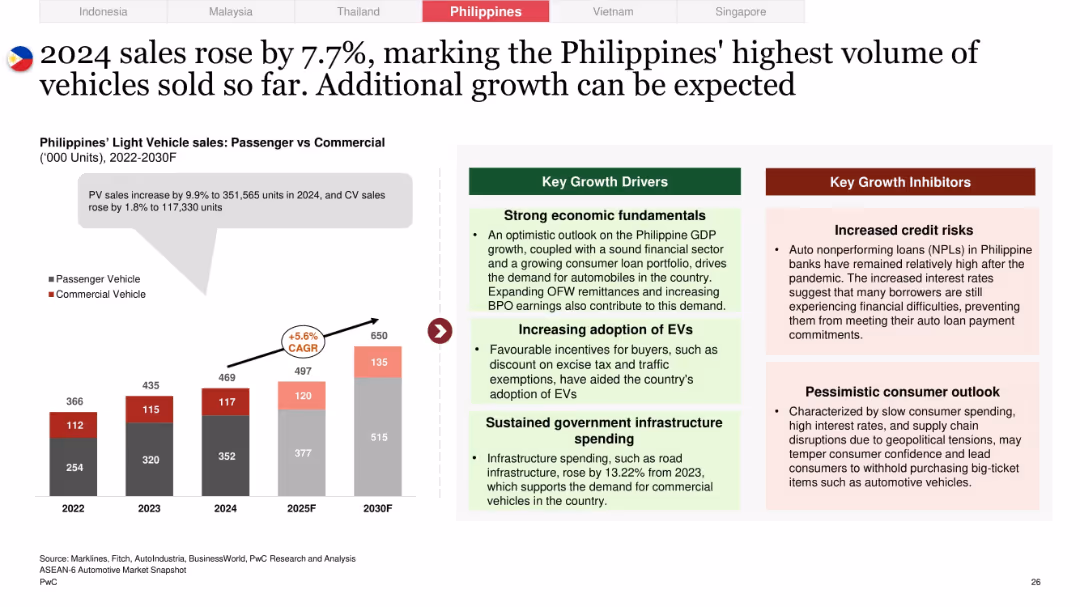
Left-aligned bar chart with PV/CV growth trends, growth and inhibitor boxes on right; light gray background behind graph annotation
Market Analysis and Trends
Industrial & Manufacturing
The Philippines experienced a 7.7% increase in vehicle sales, with strong gains in both PV and CV segments. Economic stability, EV adoption, and infrastructure spending are cited as enablers, while credit risk and weak consumer sentiment present hurdles.
Philippines, auto sales, growth forecast, credit risks, infrastructure spending, EV incentives, consumer outlook
false
Market Analysis and Trends
Industrial & Manufacturing
Mixed Chart
PwC/Strategy&
Add to my slides
Remove from favorites
This slide displays a combination of column charts and line graphs in a blue and white color palette, projecting the growth of the Philippines' digital economy, specifically highlighting e-commerce, transport & food, online travel, and online media sectors. Each sector's growth trajectory from 2021 to 2030 is clearly shown, with annotations for compounded annual growth rates (CAGR).
Market Analysis and Trends
Retail & E-commerce
This slide analyzes the anticipated growth of the digital economy in the Philippines, with a projection of reaching approximately $35 billion by 2025, driven by e-commerce. It serves as an analytical tool for market researchers, strategists, and business development professionals to identify trends and investment opportunities within the digital marketplace of the Philippines.
Philippines, Digital Economy, E-commerce, Growth, Projection, CAGR, Online Travel, Media, Transport
false
Market Analysis and Trends
Retail & E-commerce
Multiple Chart
Bain
Add to my slides
Remove from favorites
Previous
Next
You don't have any favorites yet.
Please wait loading your favorites slides...
Create a FREE account to continue browsing
Receive Instant Access to 1,000+ slides from companies like McKinsey, Google, and Goldman Sachs
First Name
Last Name
Email
Password
I agree to all
Terms & Privacy Policy
Thank you! Your submission has been received!
Oops! Something went wrong while submitting the form.
Have an account?
Sign in
Upgrade to PRO to Save slides
Advanced Search and Filters
Access to 15,000+ slides
Access to Category Pages
Save/Bookmark Slides
PowerPoint Template Library
Pick a Plan
MONTHLY
$12/month
Billed every month, Cancel anytime.
YEARLY
$9/year
Billed $108 annually, Cancel anytime.
Checkout for $12/month
Checkout for $108/yr
Secured by Stripe | AES-256 bit encryption