My Account
My Slides
Search by Category
Pricing
Templates
View All Templates
Download Template Slides
✦ AI Search
Feedback
Login
Logout
Get Started
Browse all Slides
Browse all Slides
Create a FREE Account
Instant access to 1,000+ real slides from top companies like McKinsey, BCG, Goldman Sachs, Google and many more!
First Name
Last Name
Email
Password
I agree to all
Terms & Privacy Policy
Thank you! Your submission has been received!
Oops! Something went wrong while submitting the form.
Have an account?
Sign in
Saved Slides
Total No. of slides saved
0
↻ Refresh
✖ Clear all
This slide showcases multiple column charts comparing podcast advertising revenue share by industry from 2019 to 2020, with DTC leading.
Market Analysis and Trends
Media & Entertainment
Discusses market share distribution in podcast advertising, emphasizing the growth in Direct-to-Consumer, Pharmaceuticals, and Entertainment sectors.
podcast advertising, market share, DTC, pharmaceuticals, entertainment, 2019-2020
false
Market Analysis and Trends
Media & Entertainment
Single Chart
PwC/Strategy&
Add to my slides
Remove from favorites
Two donut charts comparing podcast ad revenue by different pricing models between 2017 and 2018, highlighted with colors.
Market Analysis and Trends
Media & Entertainment
Discusses the dominant pricing models for podcast advertising, pointing out the sustained lead of cost per thousand and the decline of cost per acquisition.
Podcast, Advertising, Pricing Models, Cost Per Thousand, 2017, 2018
false
Market Analysis and Trends
Media & Entertainment
Multiple Chart
PwC/Strategy&
Add to my slides
Remove from favorites
Contains a line chart illustrating quarterly growth in podcast advertising revenues from 2015 to 2018. Utilizes shades of teal to depict trends and growth rates, with annotations highlighting significant quarterly gains.
Financial Performance
Media & Entertainment
Details the quarterly growth in podcast advertising revenues over several years, emphasizing the robust increase in Q4 of each year. It provides a detailed look at the advertising market's dynamics and the increasing significance of podcast media in marketing strategies.
podcast, advertising, quarterly, growth, 2015, 2018, revenue, media
false
Financial Performance
Media & Entertainment
Single Chart
PwC/Strategy&
Add to my slides
Remove from favorites
Column chart displaying the distribution of different campaign types over three years for podcast ad revenues.
Market Analysis and Trends
Media & Entertainment
Analyzes changes in podcast advertising campaign types from 2016 to 2018, emphasizing the growth of brand awareness and branded content.
Podcast, Advertising, Revenue, Brand Awareness, Branded Content, 2016, 2017, 2018
false
Market Analysis and Trends
Media & Entertainment
Multiple Chart
PwC/Strategy&
Add to my slides
Remove from favorites
The slide features a large pie chart highlighting the share of podcast advertising revenue by posting frequency for the year 2021. It has annotations and color coding for different podcast frequencies such as daily, weekly, and monthly. The text is bold and readable.
Market Analysis and Trends
Media & Entertainment
This slide analyzes podcast advertising revenue distribution in 2021, showing that the majority comes from weekly/biweekly podcasts. This distribution is significant as it contrasts the lesser revenue share from daily podcasts, suggesting strategic insights into podcast scheduling and advertising tactics.
podcast, advertising, revenue, frequency, 2021
false
Market Analysis and Trends
Media & Entertainment
Single Chart
PwC/Strategy&
Add to my slides
Remove from favorites
Displays two column charts comparing year-over-year growth in podcast advertising revenues. Uses a colorful design with orange, teal, and yellow to represent different data points and trends clearly. Focuses on self-reported and market estimate comparisons.
Market Analysis and Trends
Media & Entertainment
Examines the growth trends in podcast advertising revenue from 2016 to 2018, with specific emphasis on self-reported versus market estimated revenues. It provides insights into the accelerating market acceptance and the viability of podcasting as an advertising medium.
podcast, advertising, revenue, growth, 2016, 2018, comparison, media
false
Market Analysis and Trends
Media & Entertainment
Multiple Chart
PwC/Strategy&
Add to my slides
Remove from favorites
This slide features a column chart, illustrating the growth in podcast advertising revenue over several years. The design uses a bright color palette to clearly differentiate between self-reported revenues and market estimates.
Market Analysis and Trends
Media & Entertainment
Highlights the significant growth in podcast advertising revenue, projecting a strong increase by 2021. It discusses year-over-year growth, emphasizing the rapid expansion of the market and its potential for advertisers. The final projected revenues for 2021 suggest a lucrative market.
podcast, advertising, revenue, growth, forecast, 2021, media, market trends
false
Market Analysis and Trends
Media & Entertainment
Single Chart
PwC/Strategy&
Add to my slides
Remove from favorites
A column chart showcasing growth in podcast advertising revenue from 2015 to 2017 with a projection for 2017. The growth percentages are highlighted above each bar.
Market Analysis and Trends
Media & Entertainment
This slide analyzes the growth trends in podcast advertising revenue, showing significant increases year over year with future projections. Useful for discussions on media market trends and revenue strategies.
podcast, advertising, revenue growth, media
false
Market Analysis and Trends
Media & Entertainment
Single Chart
PwC/Strategy&
Add to my slides
Remove from favorites
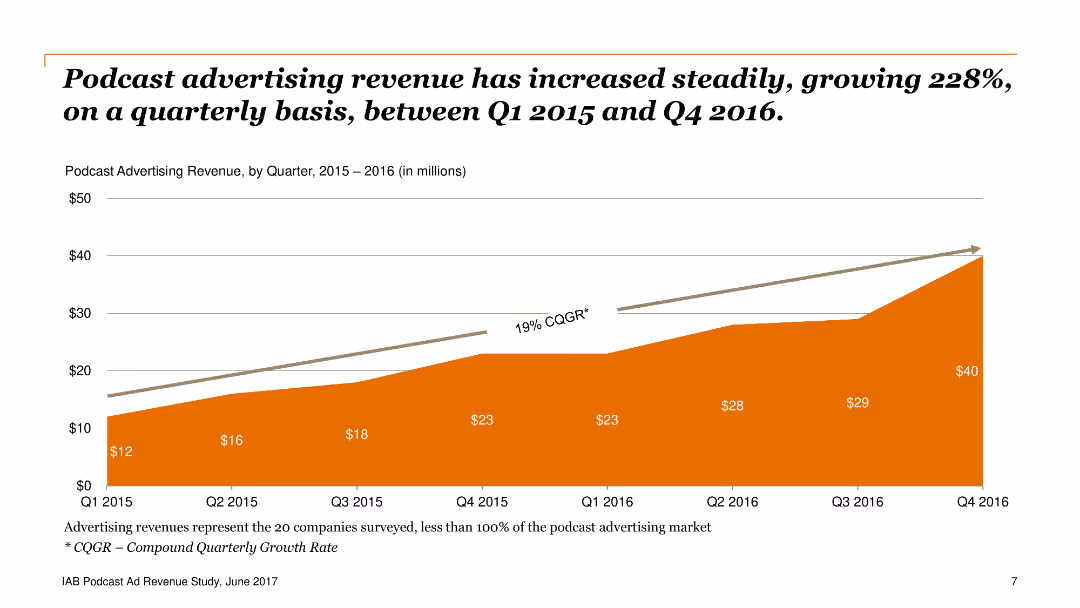
Column chart displaying podcast advertising revenue from Q1 2015 to Q4 2016, with an upward trend highlighted. Key figures include $12M in Q1 2015 and $40M in Q4 2016.
Market Analysis and Trends
Media & Entertainment
The slide shows the growth of podcast advertising revenue over time, emphasizing a 228% increase between Q1 2015 and Q4 2016. This can be used to highlight industry growth.
podcast, advertising, revenue, growth, media
false
Market Analysis and Trends
Media & Entertainment
Single Chart
PwC/Strategy&
Add to my slides
Remove from favorites
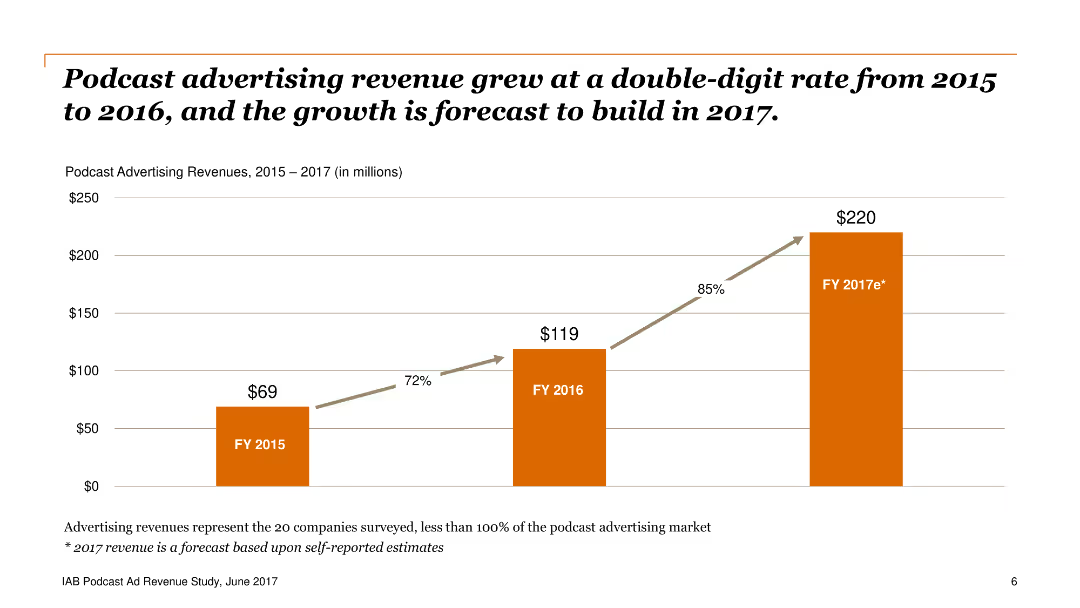
The slide features a column chart showing the growth of podcast advertising revenue from 2015 to 2017, highlighting significant increases each year.
Market Analysis and Trends
Media & Entertainment
This slide tracks the rapid growth of podcast advertising revenue, showing a substantial increase from $69 million in 2015 to $220 million in 2017. It emphasizes the strong upward trend in the podcast advertising market.
Podcast advertising, revenue growth, media, entertainment, market trends, digital advertising
false
Market Analysis and Trends
Media & Entertainment
Single Chart
PwC/Strategy&
Add to my slides
Remove from favorites
Two donut charts comparing the delivery mechanisms of podcast ads in 2017 and 2018. Includes percentages and color distinctions.
Market Analysis and Trends
Media & Entertainment
Shows the shift in podcast ad delivery mechanisms from 2017 to 2018, highlighting the increase in dynamically inserted ads versus edited-in/baked-in ads.
Podcast, Advertising, Revenue, Market Trends, Dynamic Insertion, 2017, 2018, Media
false
Market Analysis and Trends
Media & Entertainment
Multiple Chart
PwC/Strategy&
Add to my slides
Remove from favorites
The slide features two bar charts comparing podcast advertising revenue share by delivery mechanism between 2019 and 2020. The charts show a noticeable shift towards dynamically inserted ads.
Market Analysis and Trends
Media & Entertainment
This slide analyzes the shift in podcast advertising towards dynamically inserted ads over edited-in or baked-in ads, highlighting the need for agility in messaging.
podcast advertising, revenue share, dynamically inserted ads, 2019-2020, agility
false
Market Analysis and Trends
Media & Entertainment
Single Chart
PwC/Strategy&
Add to my slides
Remove from favorites
The slide contains multiple column charts comparing podcast ad revenue percentage shares by industry from 2020 to 2021, with a detailed list of industries and their contributions.
Market Analysis and Trends
Media & Entertainment
Analyzes the distribution of podcast ad revenues across different industries, noting a significant increase in the 'Other' category over two years.
Podcast, Advertising, Revenue, Trends, Industries
false
Market Analysis and Trends
Media & Entertainment
Single Chart
PwC/Strategy&
Add to my slides
Remove from favorites
Column chart tracking the growth in U.S. podcast ad revenues from 2018 to 2020.
Financial Performance
Media & Entertainment
Discusses trends in podcast advertising revenue amidst economic changes.
podcast, advertising revenue, U.S., market trend, economic impact
false
Financial Performance
Media & Entertainment
Single Chart
PwC/Strategy&
Add to my slides
Remove from favorites
Two donut charts showing the distribution of podcast campaign types by revenue in 2015 and 2016, with a shift towards brand awareness and the emergence of branded content.
Market Analysis and Trends
Media & Entertainment
Discusses the evolution of revenue-generating campaign types in podcasting, highlighting shifts towards brand awareness and branded content. Key for strategic discussions on content and advertising models in media.
podcast, campaign types, revenue, media
false
Market Analysis and Trends
Media & Entertainment
Multiple Chart
PwC/Strategy&
Add to my slides
Remove from favorites
This slide includes pie charts for 2019, 2020, and 2021 showing the distribution of podcast ad revenue by pricing model, particularly focusing on CPM (Cost per Thousand).
Financial Performance
Media & Entertainment
Analyzes the trend towards CPM pricing models in podcasting, aligning it with other digital media practices.
Podcast, CPM, Pricing, Trends
false
Financial Performance
Media & Entertainment
Multiple Chart
PwC/Strategy&
Add to my slides
Remove from favorites
Slide with a column chart comparing podcast ad revenue shares by content genre from 2020 to 2021, highlighting top genres like News, Comedy, and Society & Culture.
Market Analysis and Trends
Media & Entertainment
Reviews the popularity and revenue generation of different podcast genres, noting significant growth in ad revenue for sports post-COVID.
Podcast, Genres, Revenue, Trends, Sports
false
Market Analysis and Trends
Media & Entertainment
Single Chart
PwC/Strategy&
Add to my slides
Remove from favorites
The slide displays a column chart showing the growth of podcast ad revenues in the U.S. from 2015 to 2021, indicating significant year-over-year increases.
Market Analysis and Trends
Media & Entertainment
Highlights the explosive growth of the podcast industry, particularly in ad revenue, demonstrating its increasing significance within the media landscape. Useful for discussions on media trends, advertising potential, and strategic investments in digital audio platforms.
podcast growth, ad revenue, media trends, digital transformation, advertising potential
false
Market Analysis and Trends
Media & Entertainment
Single Chart
PwC/Strategy&
Add to my slides
Remove from favorites
This slide shows a combination of text, a pie chart, and a column chart. The pie chart represents the split of new and long-term podcast listeners, while the column chart shows frequency and number of podcasts listened to.
Market Analysis and Trends
Media & Entertainment
The slide discusses the growth in podcast listenership and spending. It shows that half of daily podcast listeners started in the past two years and that they now spend significant time listening to podcasts, indicating a growing market.
Podcast growth, listener engagement, spending trends, Nielsen study, podcast market, new listeners, long-term listeners, daily listening habits, podcast revenue
false
Market Analysis and Trends
Media & Entertainment
Multiple Chart
Nielsen
Add to my slides
Remove from favorites
Features column charts and a text box. Charts show U.S. market podcast ad revenues from 2015 to 2022, highlighting a significant growth in revenue. Text box details the growth rates of podcasting compared to other digital channels. Red and black bars indicate different years.
Financial Performance
Media & Entertainment
Discusses the rapid growth of podcast advertising revenues in the U.S., significantly outpacing overall internet ad revenue growth. Provides a detailed comparison to other digital advertising channels.
Podcasting, Ad Revenues, Digital Channels, Growth Rates, Market Trends
false
Financial Performance
Media & Entertainment
Single Chart
PwC/Strategy&
Add to my slides
Remove from favorites
This slide features a pie chart and bar graphs showing the growth in podcast listening over the past two years, including listener engagement and time spent listening.
Market Analysis and Trends
Media & Entertainment
The slide analyzes the growth in podcast listenership and engagement, showing that a significant number of listeners have started in the past two years and highlighting time spent listening.
podcasting growth, listener engagement, pie chart, bar graphs, media
false
Market Analysis and Trends
Media & Entertainment
Multiple Chart
Nielsen
Add to my slides
Remove from favorites
Slide shows a column chart with projected podcast ad revenues in the U.S. from 2020 to 2025. Each column represents a year with data points showing a significant increase, especially between 2022 and 2025. The chart is minimalistic with large, bold numbers and year labels.
Investment Analysis
Media & Entertainment
Projects future growth in podcast ad revenues, highlighting anticipated doubling by 2025. This slide is useful for investors and media planners to gauge the growth trajectory of podcast advertising.
Podcasting, Revenue Projections, Media Planning, Investment, Growth
false
Investment Analysis
Media & Entertainment
Single Chart
PwC/Strategy&
Add to my slides
Remove from favorites
Line graph detailing quarterly podcast advertising revenue from Q1 2015 to Q4 2016, illustrating a steady increase. A compound quarterly growth rate (CQGR) is noted, showing the progression of growth.
Market Analysis and Trends
Media & Entertainment
Focuses on the detailed quarterly growth of podcast advertising revenue, highlighting consistent increases and providing a compound growth rate. Useful for detailed financial analysis and planning in media.
podcast, quarterly, revenue, CQGR
false
Market Analysis and Trends
Media & Entertainment
Single Chart
PwC/Strategy&
Add to my slides
Remove from favorites
Column chart predicting the future growth of podcast revenues up to 2023.
Market Analysis and Trends
Media & Entertainment
Forecasts the rapid growth of podcast revenues over the next few years.
podcast, revenue forecast, market growth, future projections
false
Market Analysis and Trends
Media & Entertainment
Single Chart
PwC/Strategy&
Add to my slides
Remove from favorites
The slide features a red and green column chart showing U.S. market podcast revenue growth projections from 2019 to 2024, with figures in millions and percentage growth noted.
Financial Performance
Media & Entertainment
This slide presents the projected tripling of podcast revenues in the U.S. market over five years, highlighting significant growth from 2019 to 2024.
Podcast, Revenue, Growth, Media, Projections, U.S.
false
Financial Performance
Media & Entertainment
Single Chart
PwC/Strategy&
Add to my slides
Remove from favorites
This slide illustrates the quarterly growth trends of podcast revenues in the U.S. from 2016 to 2021, with a focus on the rebound from early pandemic impacts.
Market Analysis and Trends
Media & Entertainment
Analyzes the quarterly financial performance of the podcast sector, emphasizing resilience and robust growth despite initial pandemic-related downturns. This slide is valuable for stakeholders interested in media market dynamics and investment opportunities in digital media.
podcast revenue, quarterly growth, COVID-19 impact, financial resilience, media investments
false
Market Analysis and Trends
Media & Entertainment
Single Chart
PwC/Strategy&
Add to my slides
Remove from favorites
The slide features a red and grey donut chart contrasting "Audio Only" and "Video-Enabled" podcast revenue shares for 2020, with large text highlighting the main statistic.
Market Analysis and Trends
Media & Entertainment
This slide presents the 2020 revenue share between audio-only and video-enabled podcasts, showing a significant majority in audio-only.
podcasts, revenue share, advertising, media, video-enabled, audio-only, 2020, comparison
false
Market Analysis and Trends
Media & Entertainment
Single Chart
PwC/Strategy&
Add to my slides
Remove from favorites
The slide features a dark theme and includes a multi-layered area chart showing transaction volumes across several years, along with key financial statistics.
Market Analysis and Trends
Financial Services
This slide analyzes the merchant point-of-sale lending market, focusing on home improvement franchises, and visualizes transaction volume trends.
point-of-sale lending, home improvement, merchant network, transaction volume, financial statistics, FICO score, portfolio
false
Market Analysis and Trends
Financial Services
Mixed Chart
Goldman Sachs
Add to my slides
Remove from favorites
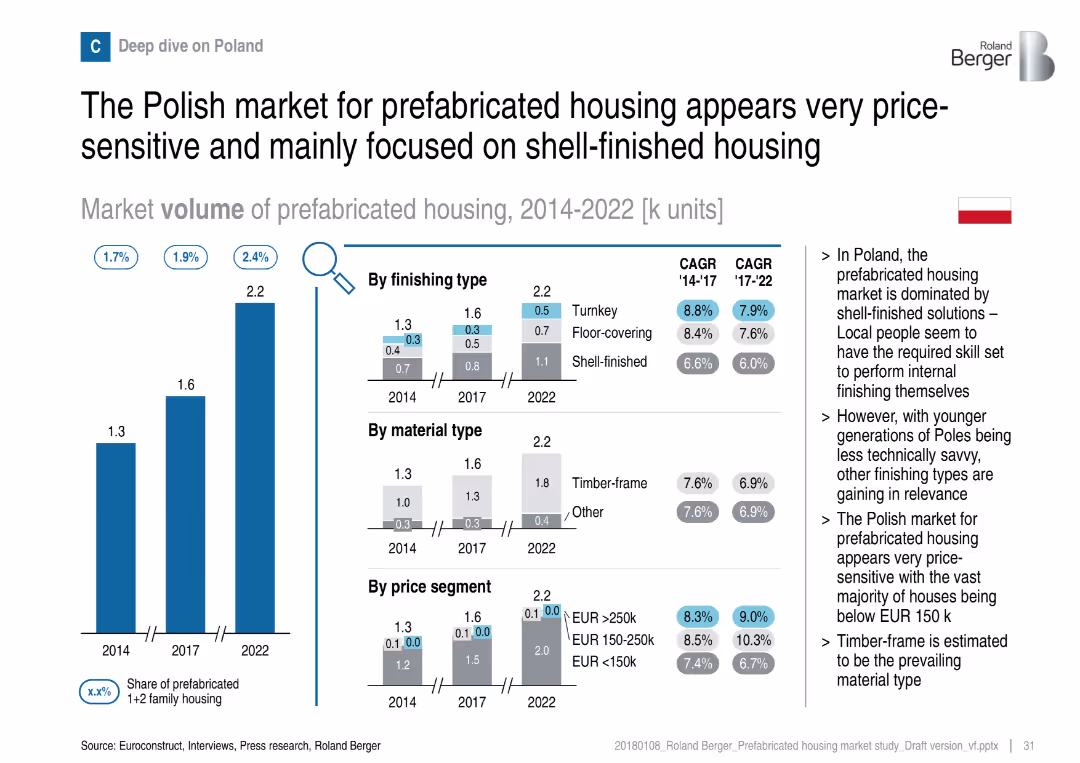
National deep dive layout with breakdown by finishing, material, price; Polish flag and side notes
Customer and Market Segmentation
Real Estate & Construction
Poland shows a price-sensitive market, with shell-finished housing dominating. Turnkey and other types are slowly gaining traction among younger consumers. The majority of homes fall below EUR 150k.
Poland, shell-finished, price-sensitive, turnkey, prefabricated, timber-frame, market segmentation
false
Customer and Market Segmentation
Real Estate & Construction
Multiple Chart
Roland Berger
Add to my slides
Remove from favorites
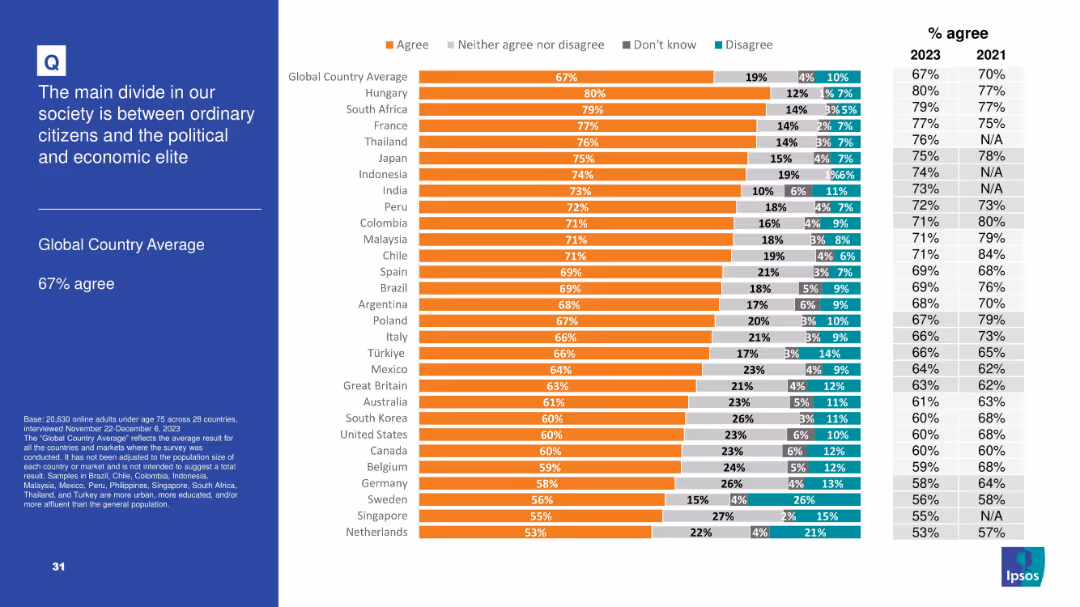
Typical format with bar chart showing percent agreement by country; right-hand trend columns comparing 2021 and 2023 data.
Market Analysis and Trends
Government & Public Sector
This slide focuses on societal polarization, particularly the belief in a fundamental divide between ordinary people and elites. With 67% agreement globally, the data reflect significant class tension or alienation. Countries like Hungary and South Africa show the highest levels of agreement, suggesting strong populist sentiment in those regions.
polarization, society, elite, citizens, populism, division, inequality, Ipsos
false
Market Analysis and Trends
Government & Public Sector
Mixed Chart
IPSOS
Add to my slides
Remove from favorites
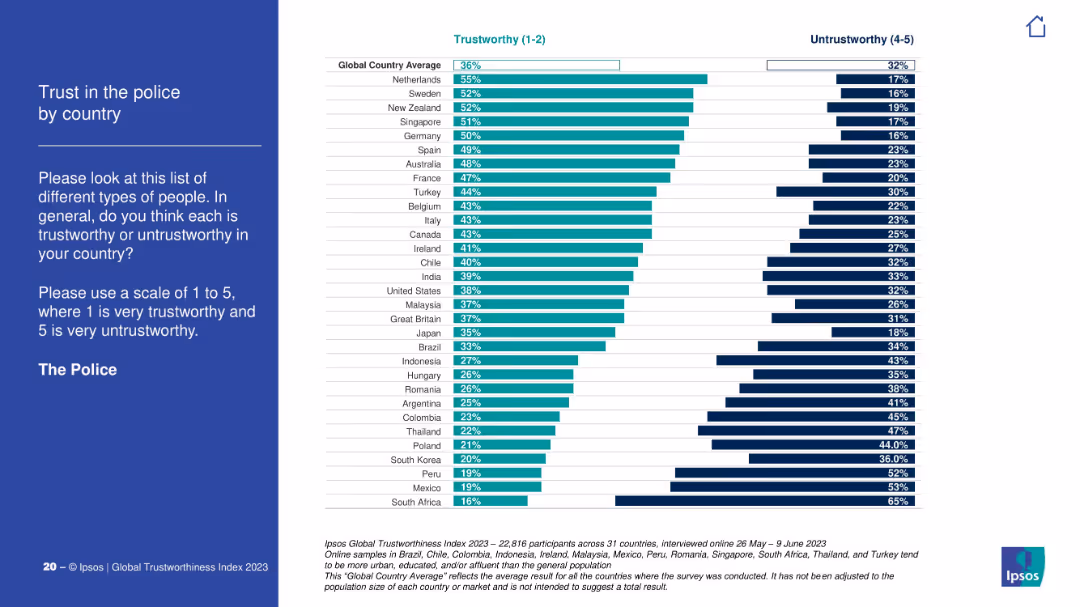
Vertical bars showing % trust in police across countries. Includes trust and untrust levels side-by-side. Ranked by trust.
Customer and Market Segmentation
Government & Public Sector
The chart analyzes global trust in police forces. The Netherlands, Sweden, and New Zealand show the highest trust levels. South Africa, Mexico, and Peru have the lowest. Global trust average is 36%, with notable disparities.
police, law enforcement, trust, global trust index, Ipsos, regional attitudes
false
Customer and Market Segmentation
Government & Public Sector
Mixed Chart
IPSOS
Add to my slides
Remove from favorites
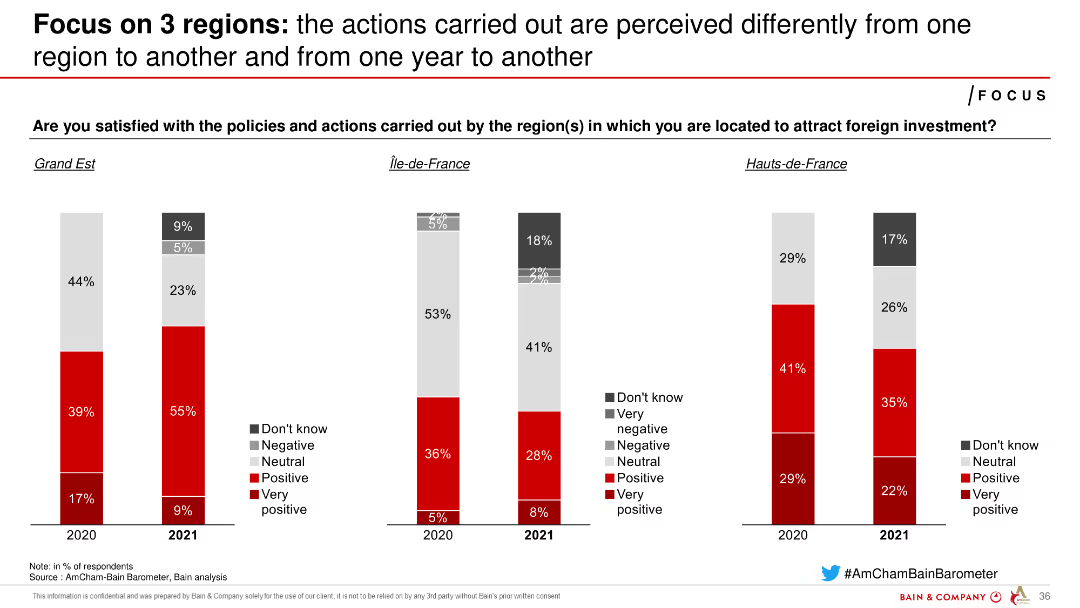
Column charts showing satisfaction with policies and actions in different French regions over two years, highlighting variances in perceptions.
Regulatory and Compliance
Government & Public Sector
Examines regional differences in satisfaction with policies and actions aimed at attracting foreign investment, showing changing perceptions over two years.
policies, actions, satisfaction, regions, perceptions
false
Regulatory and Compliance
Government & Public Sector
Multiple Chart
Bain
Add to my slides
Remove from favorites
The slide contains text explaining Greece's policy effectiveness, with two pie charts showing effectiveness ratings by companies established and not established in Greece, and bar charts comparing performance aspects.
Investment Analysis
Government & Public Sector
The slide evaluates Greece's attractiveness policy, revealing that a majority find it effective. It also compares performance aspects like attracting companies, innovative activities, and human talent.
policy, effectiveness, Greece, international investors, performance, comparison
false
Investment Analysis
Government & Public Sector
Multiple Chart
EY
Add to my slides
Remove from favorites
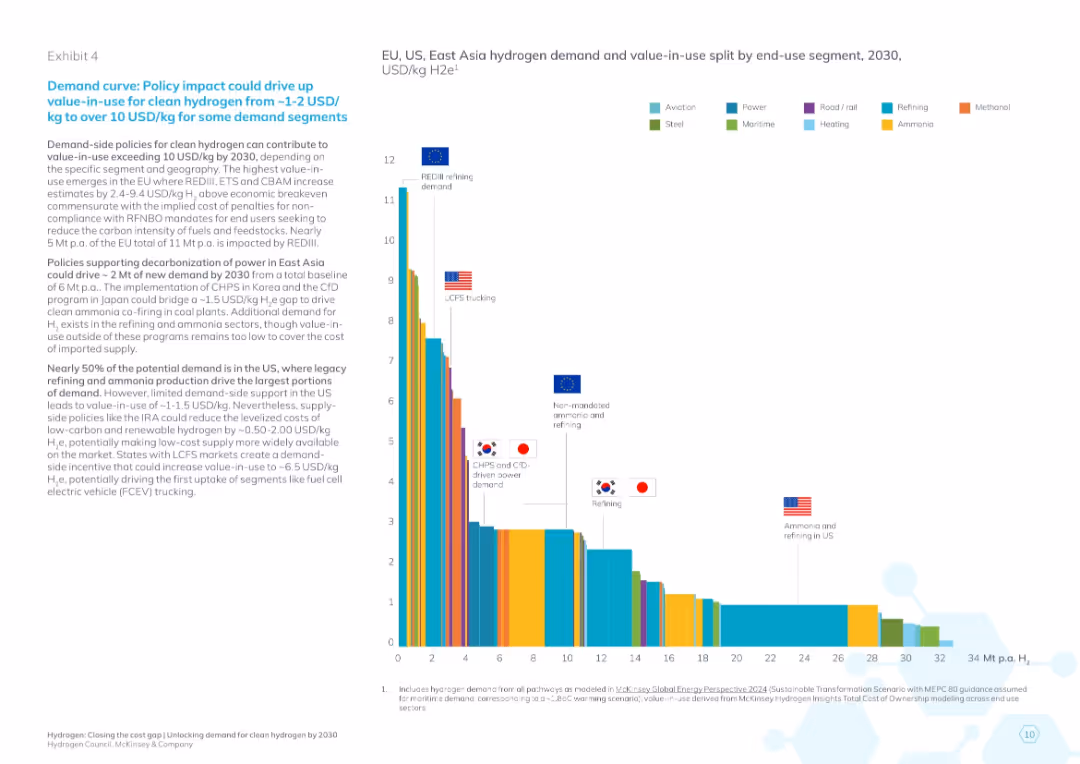
Left narrative on policy impact; right side has a bar chart split by country and sector showing hydrogen demand and value-in-use in 2030.
Strategic Planning
Energy & Utilities
Shows how policy can impact hydrogen demand and end-use value across regions. Emphasizes USA, EU, Japan, and Korea. Highlights potential for demand-driven adoption based on policy support and value-in-use across sectors.
policy impact, hydrogen value, sectoral demand, regional energy strategy, demand-side incentives, 2030 outlook, comparative analysis
false
Strategic Planning
Energy & Utilities
Mixed Chart
McKinsey
Add to my slides
Remove from favorites
The slide contrasts policy measures between countries using icons and bullet points, and presents two case studies in side panels.
Strategic Planning
Government & Public Sector
Discusses curated policy measures Australia could implement to attract major players in the industry, drawing parallels with successful international examples.
policy measures, industry tenants, Australia, investment incentives, supply chain security, case studies, Tesla, Hungary
false
Strategic Planning
Government & Public Sector
Vertical Flow
Accenture
Add to my slides
Remove from favorites
An image displaying a staircase infographic with five steps labeled with major policy reforms in Namibia, such as the Public Procurement Act and the NEEEF Bill.
Strategic Planning
Government & Public Sector
Provides an overview of significant structural policy reforms in Namibia, depicted through a staircase graphic. This visual representation aids in understanding the sequential importance and impact of each policy.
policy, Namibia, government reforms, legislation
false
Strategic Planning
Government & Public Sector
Vertical Flow
PwC/Strategy&
Add to my slides
Remove from favorites
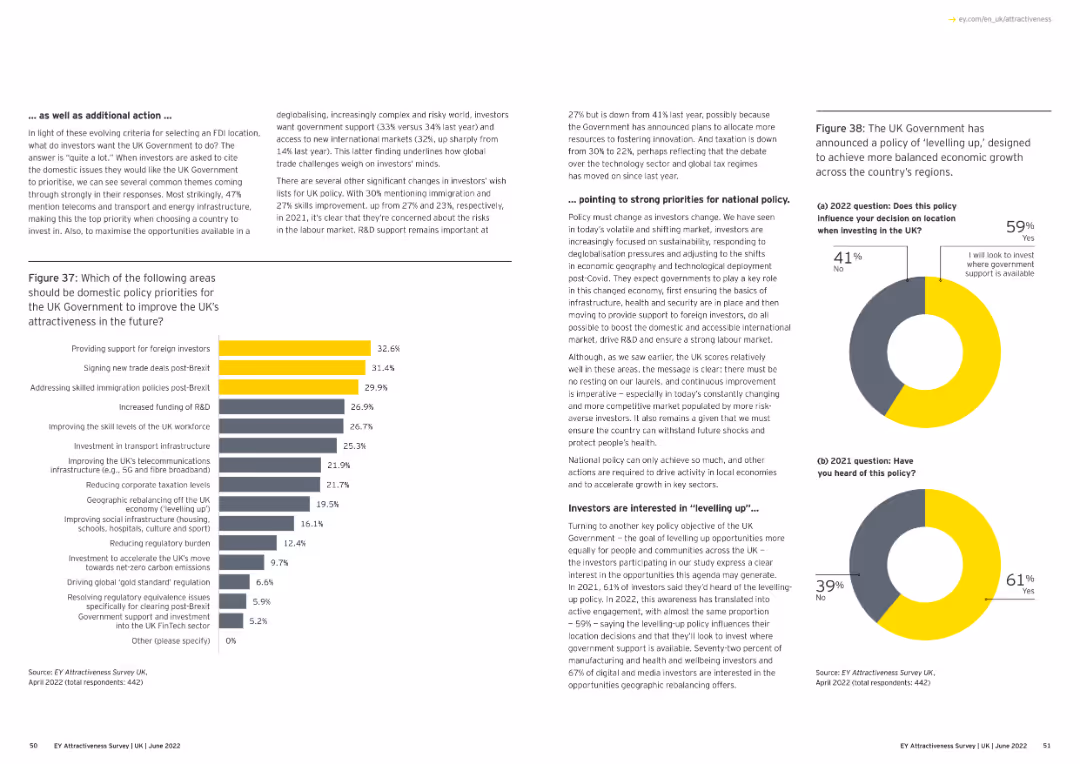
Text and a bar chart. The chart lists policy priorities for the UK government to improve attractiveness post-Brexit.
Regulatory and Compliance
Financial Services
The slide outlines policy priorities for the UK government to enhance attractiveness, focusing on foreign investment and trade deals.
policy priorities, UK government, post-Brexit, foreign investment, column chart
false
Regulatory and Compliance
Financial Services
Multiple Chart
EY
Add to my slides
Remove from favorites
Column chart showing changes in central bank policy rates for developed and emerging markets. Another chart shows expectations for future rates.
Market Analysis and Trends
Financial Services
Analyzes historical changes in central bank policy rates and provides expectations for future changes, comparing developed and emerging markets.
policy rate changes, central bank, developed markets, emerging markets
false
Market Analysis and Trends
Financial Services
Multiple Chart
JP Morgan
Add to my slides
Remove from favorites
The slide features two scatter plots showing asset class returns after rate hikes and rate cuts, segmented by different periods.
Market Analysis and Trends
Financial Services
The slide analyzes the impact of policy rate cycles on various asset classes, comparing returns following rate hikes and rate cuts across different periods.
policy rates, market performance, rate hikes, rate cuts, asset class returns
false
Market Analysis and Trends
Financial Services
Multiple Chart
JP Morgan
Add to my slides
Remove from favorites
This slide lists four key points with corresponding icons, emphasizing shifts in global battery policy.
Market Analysis and Trends
Government & Public Sector
Summarizes global shifts in battery industries and their implications for Australian policy, highlighting strategic responses.
policy shifts, battery industry, Australia, global trends
false
Market Analysis and Trends
Government & Public Sector
Pillar
Accenture
Add to my slides
Remove from favorites
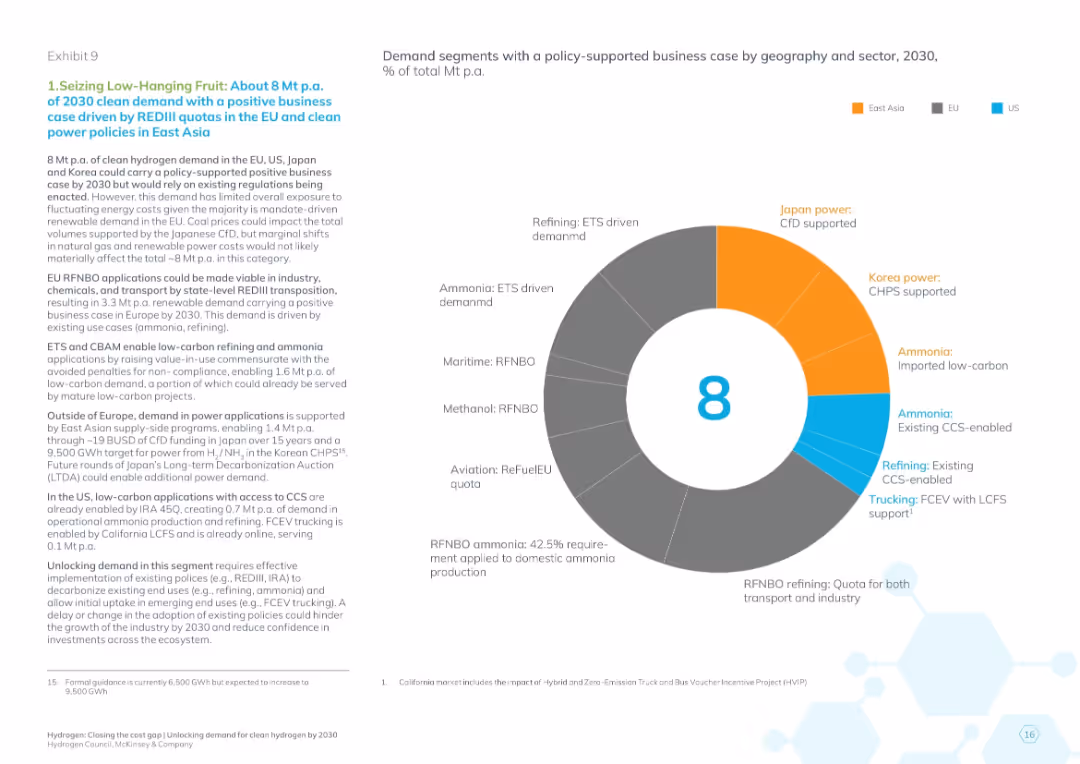
Donut chart categorizing the 8 Mt demand by sector and region; detailed policy analysis in left text panel
Regulatory and Compliance
Energy & Utilities
The slide explains how 8 Mt of hydrogen demand can be realized by 2030 under existing policies like REDIII in the EU and clean energy subsidies in East Asia. It details the sectors (refining, maritime, aviation, etc.) and the type of policy mechanisms (ETS, CfD, CHPS) enabling viability.
policy-supported demand, REDIII, clean hydrogen, ETS, CfD, CHPS, sector breakdown, EU, Japan, Korea
false
Regulatory and Compliance
Energy & Utilities
Mixed Chart
McKinsey
Add to my slides
Remove from favorites
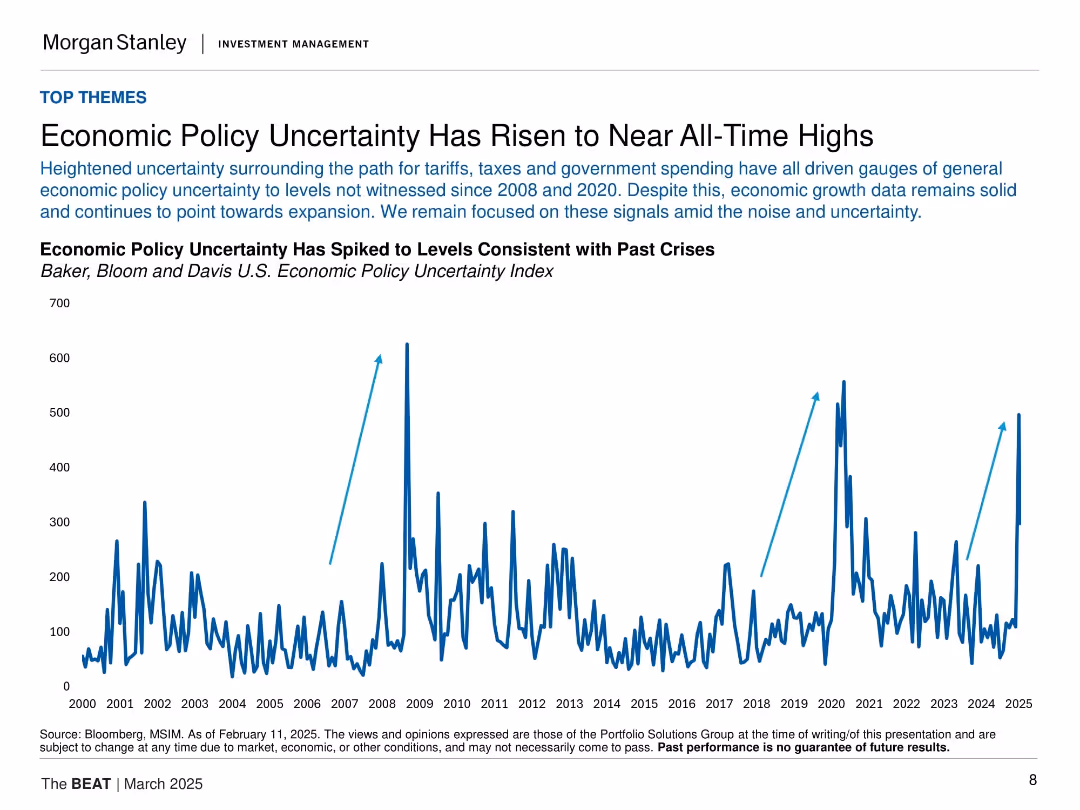
Large central line graph of policy uncertainty index from 2000 to 2025 with three arrows marking crisis peaks. Simple layout.
Risk Assessment and Management
Financial Services
Emphasizes heightened economic policy uncertainty linked to tariffs, taxes, and spending. The index has spiked to levels seen in past crises (2008, 2020), yet economic growth appears resilient.
policy uncertainty, economic risk, tariffs, government spending, market signals, historical spikes
false
Risk Assessment and Management
Financial Services
Single Chart
Morgan Stanley
Add to my slides
Remove from favorites
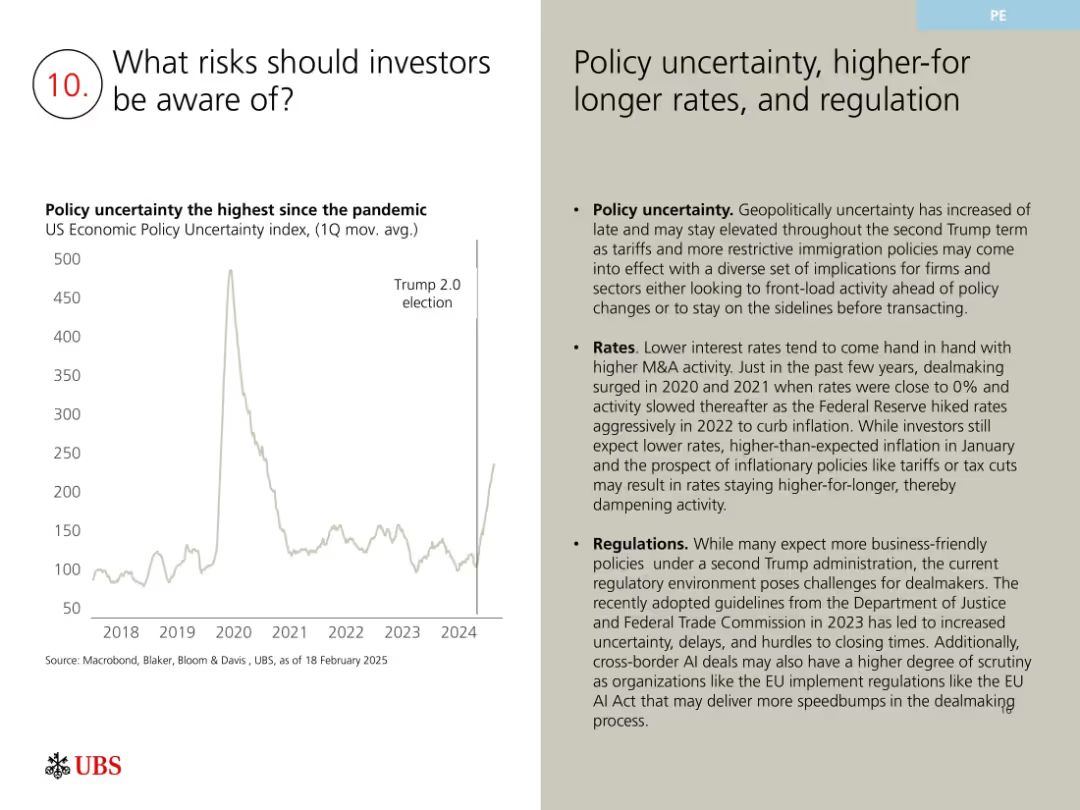
Line graph showing U.S. Policy Uncertainty Index; right side features bulleted text on uncertainty, rates, and regs.
Risk Assessment and Management
Financial Services
The slide outlines key investor risks including policy uncertainty from the Trump 2.0 election, elevated interest rates, and tougher regulations. These risks may dampen deal activity or extend timelines, particularly in M&A, affecting strategic and financial planning decisions.
policy uncertainty, Trump, interest rates, regulation, M&A, inflation
false
Risk Assessment and Management
Financial Services
Mixed Chart
UBS
Add to my slides
Remove from favorites
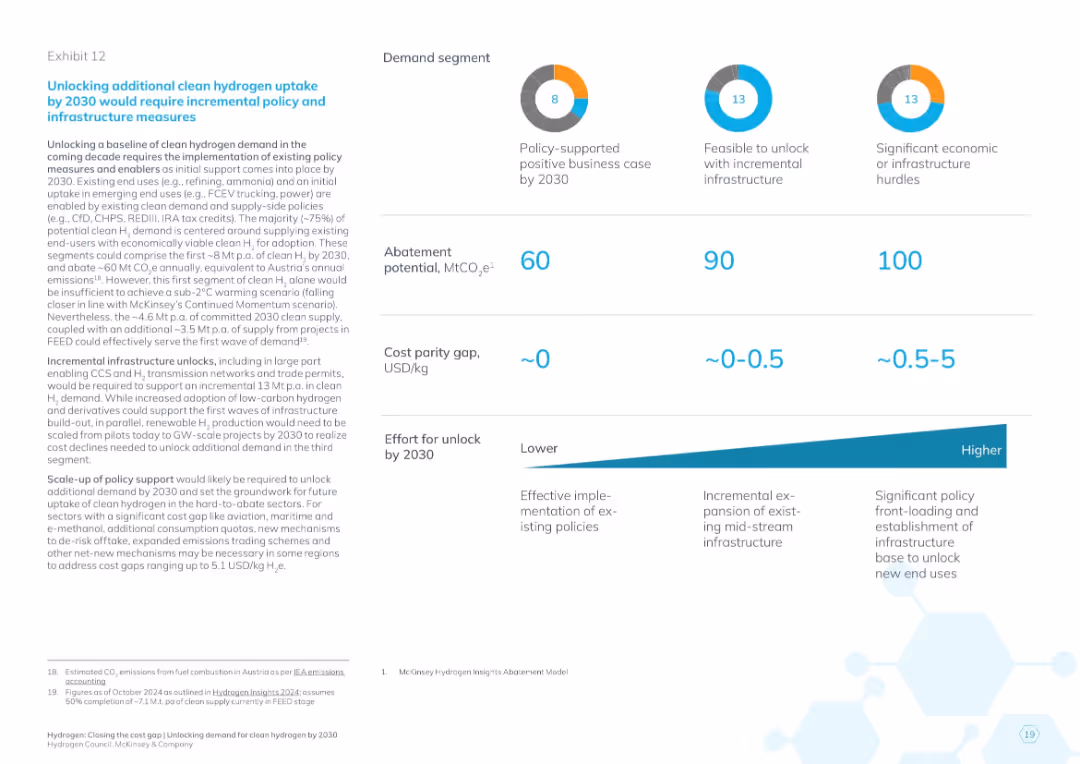
Horizontal comparison of three demand segments with abatement, cost gap, and unlock effort; effort scale at bottom
Strategic Planning
Energy & Utilities
This slide synthesizes hydrogen demand unlock strategies across three segments: policy-supported, infrastructure-feasible, and high-barrier. It quantifies their respective CO₂ abatement potentials, cost gaps, and the effort required to realize uptake by 2030.
policy vs infrastructure, hydrogen demand segments, CO₂ abatement, cost gap, 2030 unlock, strategic effort
false
Strategic Planning
Energy & Utilities
Mixed Chart
McKinsey
Add to my slides
Remove from favorites
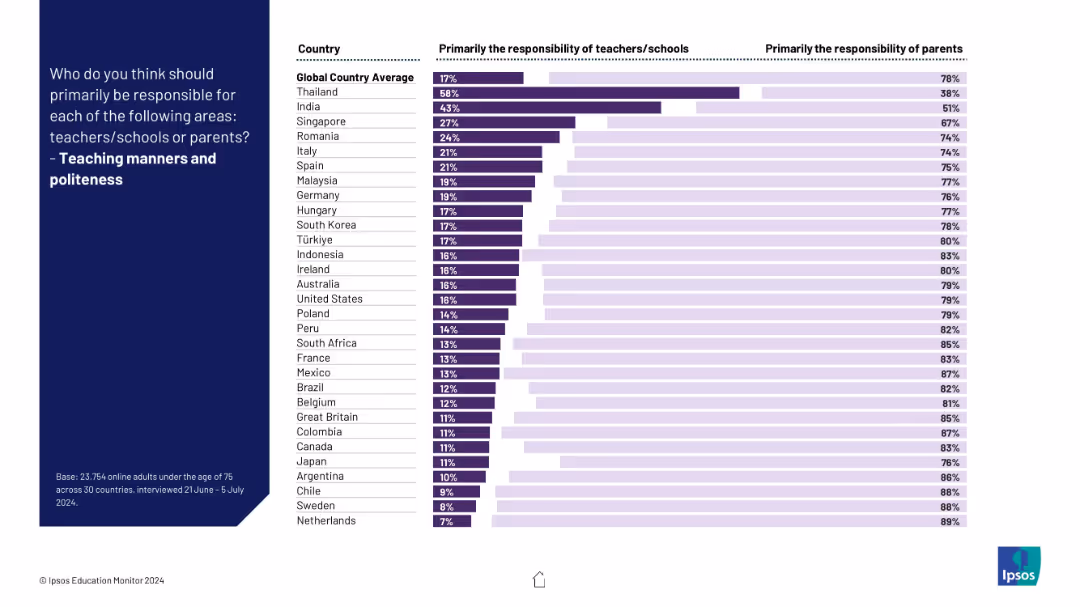
Same layout as previous: horizontal bar chart split by responsibility across countries; structured and consistent infographic design.
Human Resources and Talent Management
Education & Training
This slide presents global attitudes toward who should teach manners and politeness. Parents are overwhelmingly seen as the primary source, though some countries view schools as more involved.
politeness, responsibility, global survey, values, behavior, manners, education, Ipsos, cultural norms
false
Human Resources and Talent Management
Education & Training
Mixed Chart
IPSOS
Add to my slides
Remove from favorites
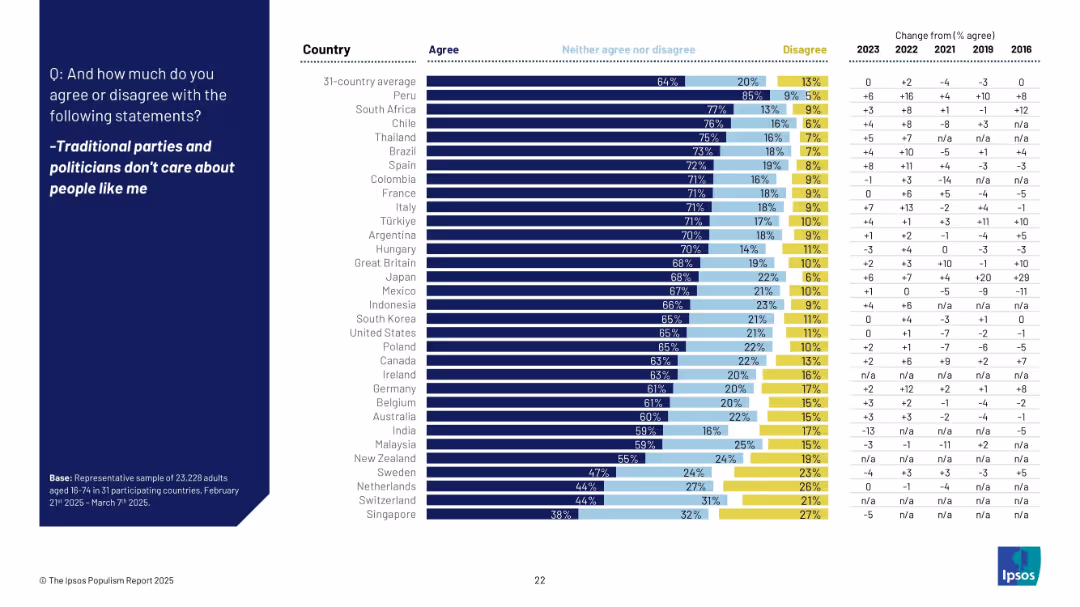
Horizontal bar chart comparing 31 countries' agreement rates on political alienation. Right-hand column includes multi-year trend comparisons.
Market Analysis and Trends
Government & Public Sector
This slide focuses on political alienation across countries. Agreement is highest in Peru, South Africa, and Chile, with sentiment increasing in many countries. Japan saw a 29pp rise since 2016, indicating growing distrust in traditional political institutions.
political alienation, distrust, Ipsos, traditional parties, public opinion, international trends, populism
false
Market Analysis and Trends
Government & Public Sector
Mixed Chart
IPSOS
Add to my slides
Remove from favorites
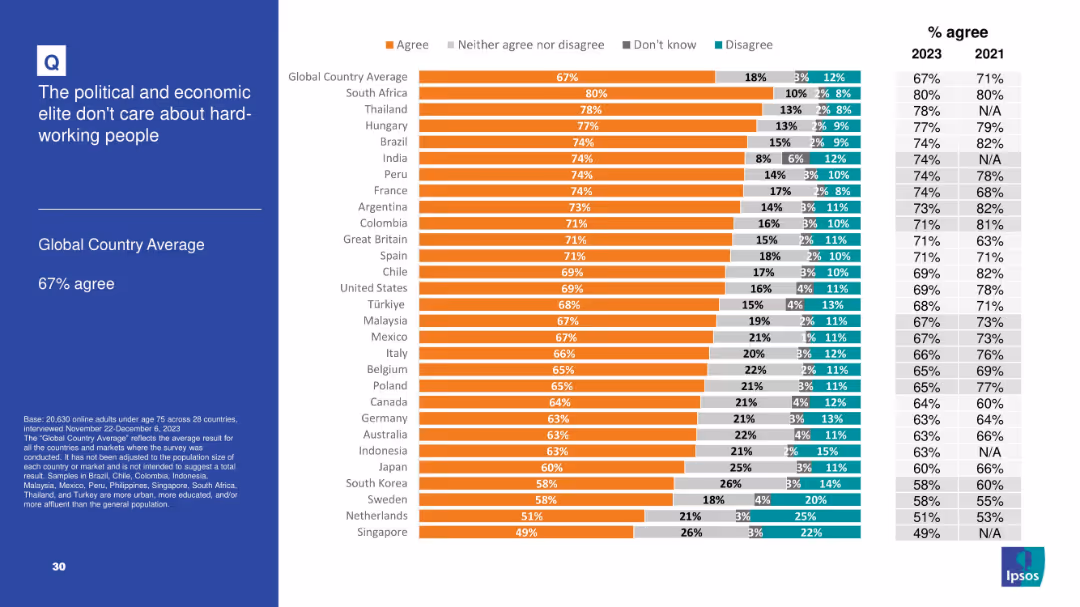
Follows same format as prior slides: bar chart, segmented by country; includes historical agreement percentage for 2021 for comparison.
Market Analysis and Trends
Government & Public Sector
This slide, with a 67% global agreement rate, emphasizes public disillusionment with elites and their perceived disconnect from the working population. South Africa and Thailand top the chart with over 75% agreement, reflecting global perceptions of injustice or imbalance in socio-economic influence and care.
political elite, economic elite, labor, perception, class divide, Ipsos, fairness, disconnect
false
Market Analysis and Trends
Government & Public Sector
Mixed Chart
IPSOS
Add to my slides
Remove from favorites
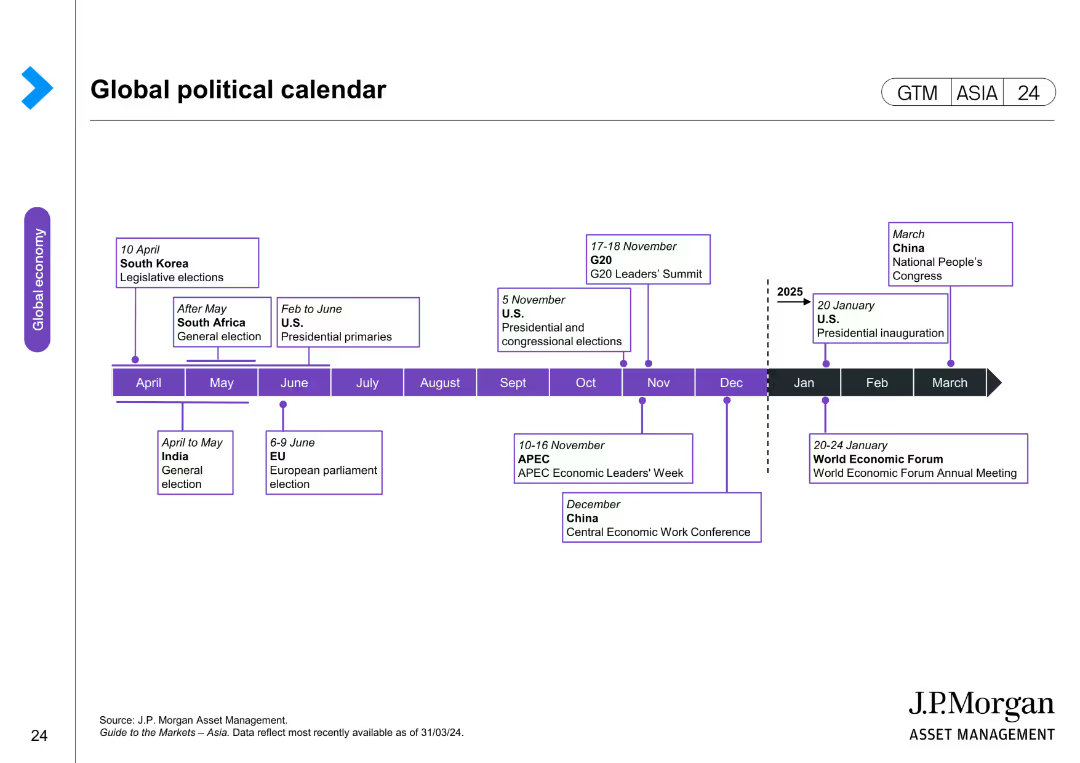
The slide displays a timeline with key global political events, including elections and summits, marked on a monthly basis. Events are categorized by country and type, with brief descriptions of each.
Strategic Planning
Government & Public Sector
The slide outlines a global political calendar, highlighting important political events and their timelines. It is used for strategic planning and understanding geopolitical impacts on markets.
political events, global timeline, elections, summits, geopolitical analysis, strategic planning, government calendar
false
Strategic Planning
Government & Public Sector
Linear Flow
JP Morgan
Add to my slides
Remove from favorites
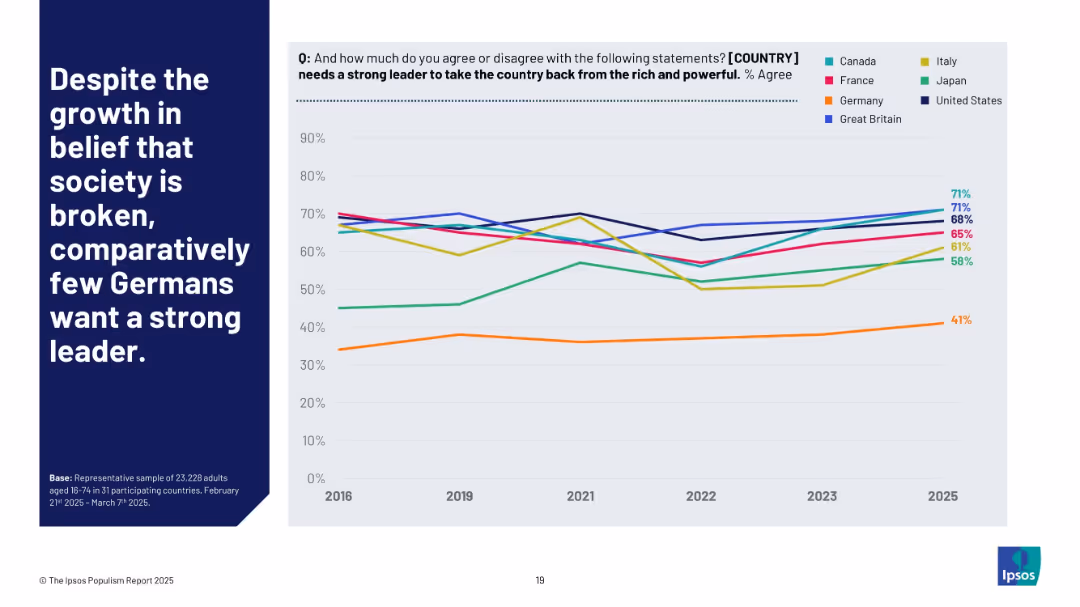
Line chart showing trends (2016–2025) of agreement with the need for a strong leader to counter elites, across selected countries. Germany is emphasized with a distinct low-trend line.
Strategic Planning
Government & Public Sector
This trend analysis reveals a disparity between perceived societal dysfunction and desire for authoritarian solutions. Germany, despite rising agreement with "society is broken," remains reluctant to support a strongman-style leader.
political sentiment, authoritarianism, Germany, Ipsos trend, society broken vs leadership, international comparison
false
Strategic Planning
Government & Public Sector
Mixed Chart
IPSOS
Add to my slides
Remove from favorites
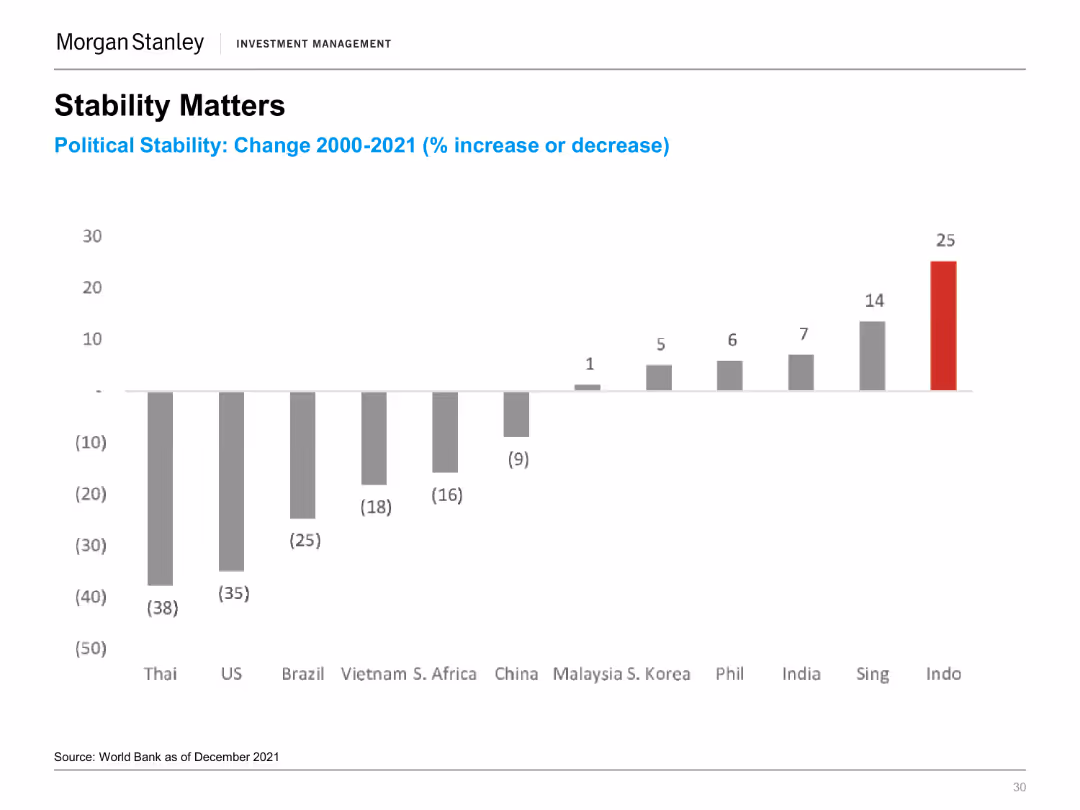
A column chart showing political stability changes (% increase or decrease) from 2000-2021 for various countries, with Indonesia having the highest increase.
Risk Assessment and Management
Financial Services
The slide highlights the importance of political stability, showing changes in stability across countries, with a focus on Indonesia's significant improvement.
Political Stability, Indonesia, Risk Management, Global Comparison, Stability Trends
false
Risk Assessment and Management
Financial Services
Single Chart
Morgan Stanley
Add to my slides
Remove from favorites
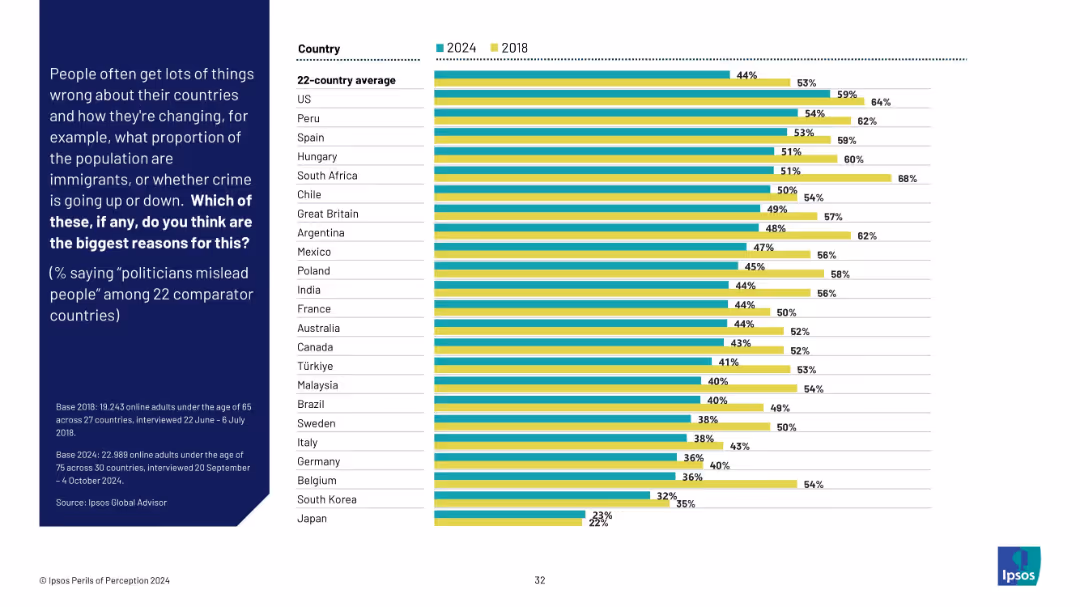
Grouped bar chart of 2024 vs 2018 showing belief that politicians mislead people. Ranked by country with noticeable shifts.
Market Analysis and Trends
Government & Public Sector
This slide tracks belief that politicians are misleading the public. While the global average decreased slightly from 2018, high distrust remains prominent in countries like the US, Peru, and Spain.
political trust, misinformation, public opinion, trend analysis, survey data, Ipsos, international governance
false
Market Analysis and Trends
Government & Public Sector
Mixed Chart
IPSOS
Add to my slides
Remove from favorites
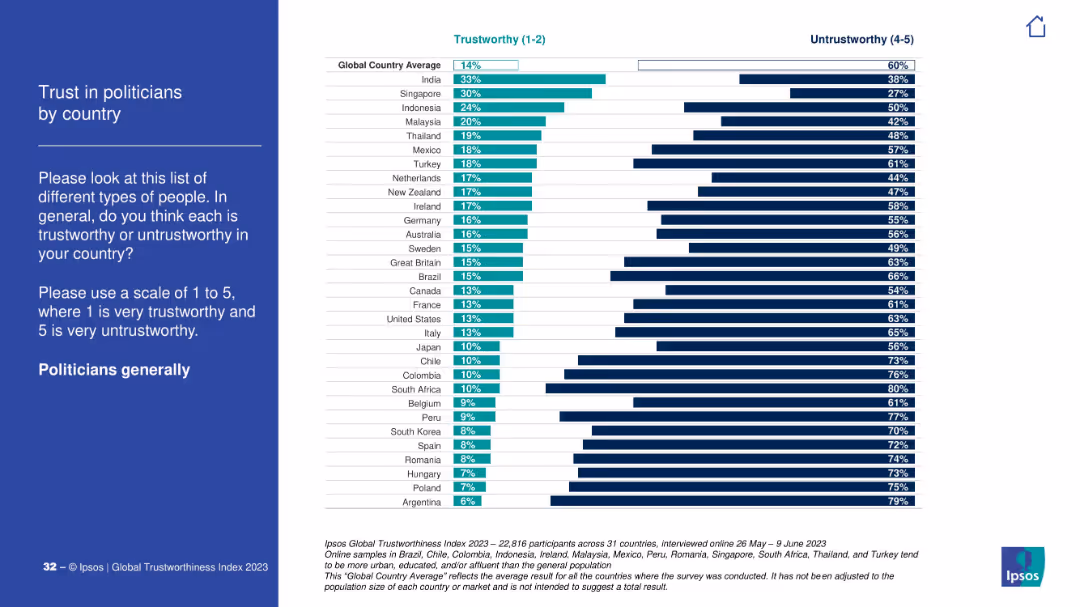
Layout consistent with rest; left pane for instructions, right pane chart comparing global trust in politicians by country.
Risk Assessment and Management
Government & Public Sector
This slide presents global public trust in politicians. India leads, while Argentina has the lowest trust scores, with most countries showing high distrust.
politicians, global trust, public opinion, Ipsos, credibility, country analysis, governance
false
Risk Assessment and Management
Government & Public Sector
Mixed Chart
IPSOS
Add to my slides
Remove from favorites
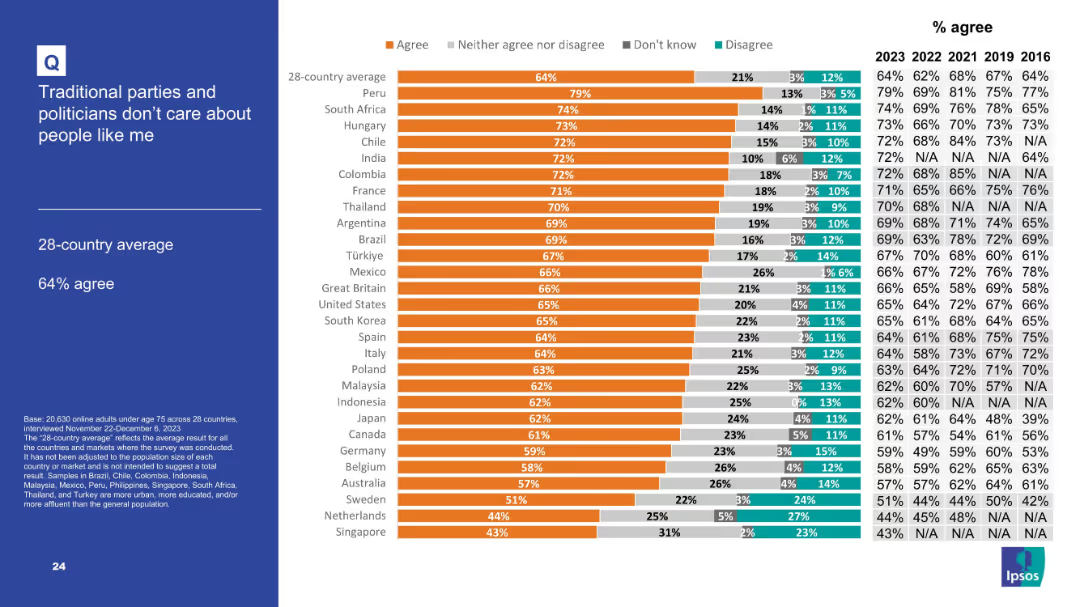
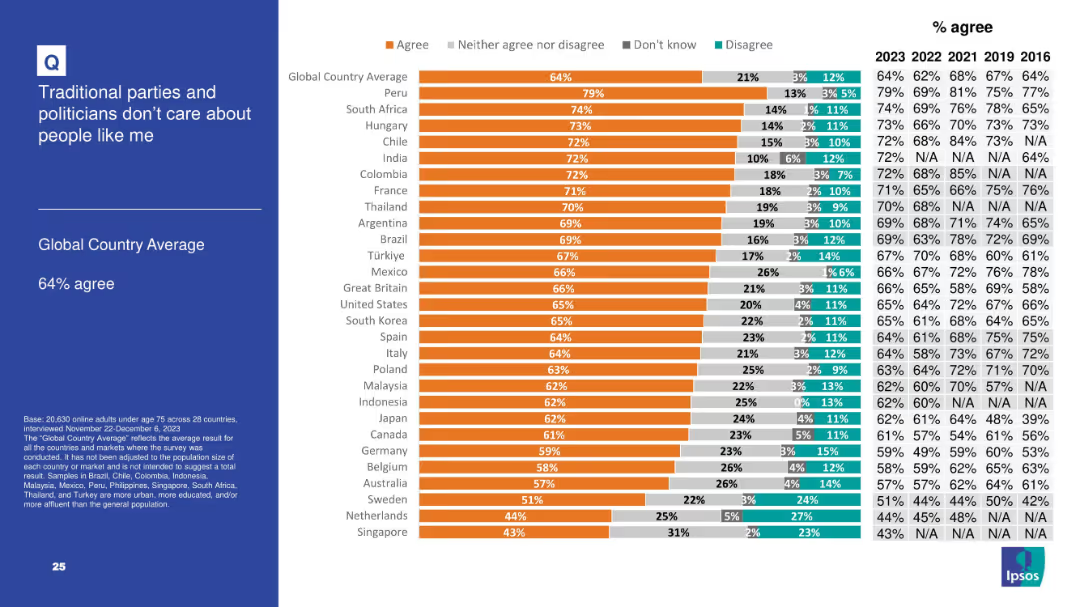
Similar to previous slide with title on the left and detailed bar chart on the right.
Market Analysis and Trends
Government & Public Sector
This slide indicates public disillusionment with traditional political parties. With a 28-country average of 64% agreement, it reflects a consistent perception that mainstream politicians are disconnected from ordinary citizens.
politicians, public trust, political dissatisfaction, survey, global sentiment
false
Market Analysis and Trends
Government & Public Sector
Mixed Chart
IPSOS
Add to my slides
Remove from favorites
Green line chart (2017–2025) with low-to-moderate variation; peak in June 2022. Annotated with GE timelines.
Market Analysis and Trends
Government & Public Sector
Focuses on disillusionment with political leadership. The trend shows spikes around scandals or political instability, particularly in 2022, reflecting eroding public trust.
politicians, trust, Ipsos, public sentiment, governance, UK, disillusionment, government
false
Market Analysis and Trends
Government & Public Sector
Single Chart
IPSOS
Add to my slides
Remove from favorites
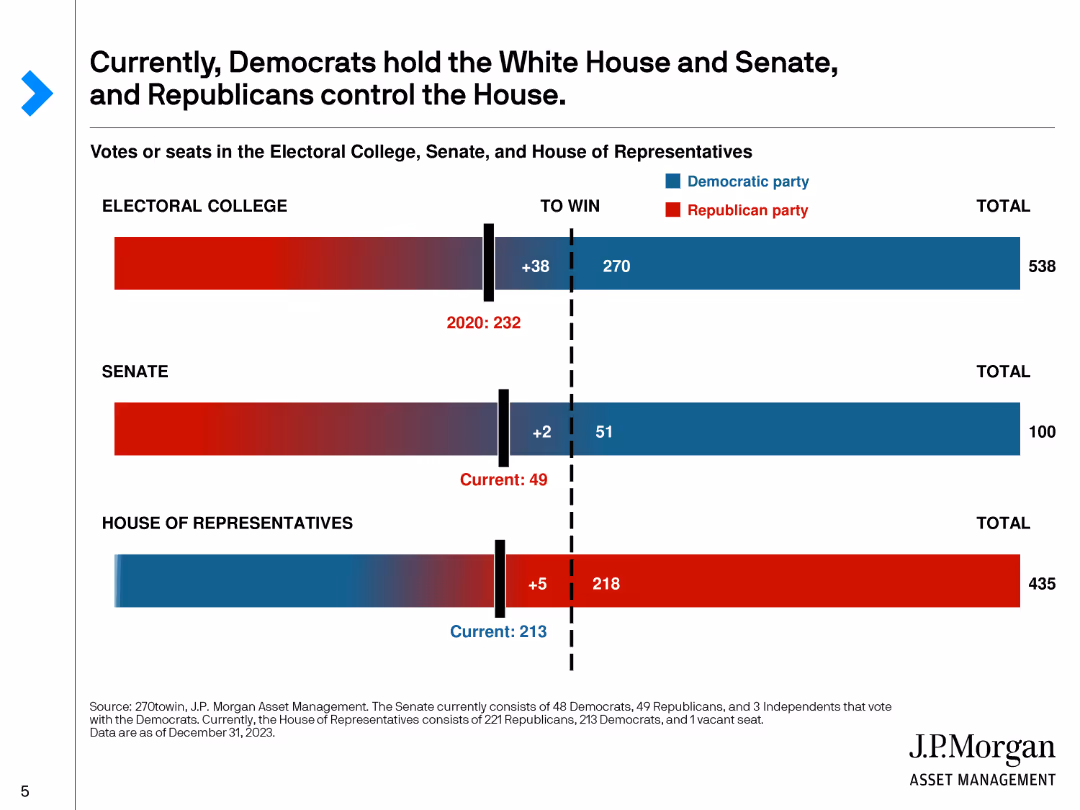
This slide includes bar charts showing the current composition of the Electoral College, Senate, and House of Representatives, with red and blue colors representing the respective parties.
Market Analysis and Trends
Government & Public Sector
Illustrates the current political landscape in the U.S., showing the distribution of power between Democrats and Republicans in the Electoral College, Senate, and House of Representatives.
Politics, Electoral College, Senate, House, Parties
false
Market Analysis and Trends
Government & Public Sector
Single Chart
JP Morgan
Add to my slides
Remove from favorites
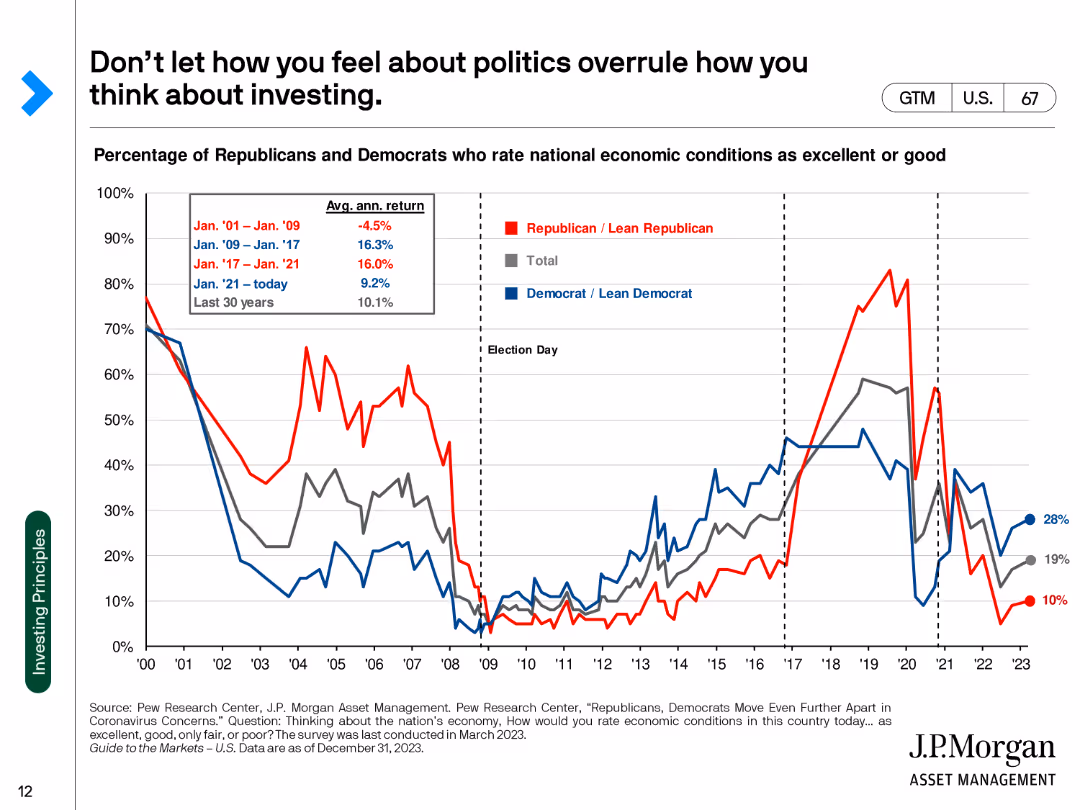
The slide contains a line chart showing the percentage of Republicans and Democrats who rate national economic conditions as excellent or good from 2000 to 2023.
Market Analysis and Trends
Financial Services
This slide analyzes the correlation between political affiliation and perception of national economic conditions, emphasizing that investment decisions should not be influenced by political biases.
Politics, Investing, Economic Conditions, Perception, Analysis
false
Market Analysis and Trends
Financial Services
Single Chart
JP Morgan
Add to my slides
Remove from favorites
Similar format to Slide 19041, featuring a bar chart comparing responses across countries; historical agreement trend percentages are included in a right-hand column.
Market Analysis and Trends
Government & Public Sector
This slide displays how much agreement there is globally with the idea that traditional politicians are disconnected from ordinary citizens. With 64% of respondents agreeing, it indicates widespread distrust or disillusionment with the political establishment. Countries like Peru and South Africa show particularly high agreement levels.
politics, public trust, parties, global survey, populism, disconnection, Ipsos, opinion, citizen sentiment
false
Market Analysis and Trends
Government & Public Sector
Mixed Chart
IPSOS
Add to my slides
Remove from favorites
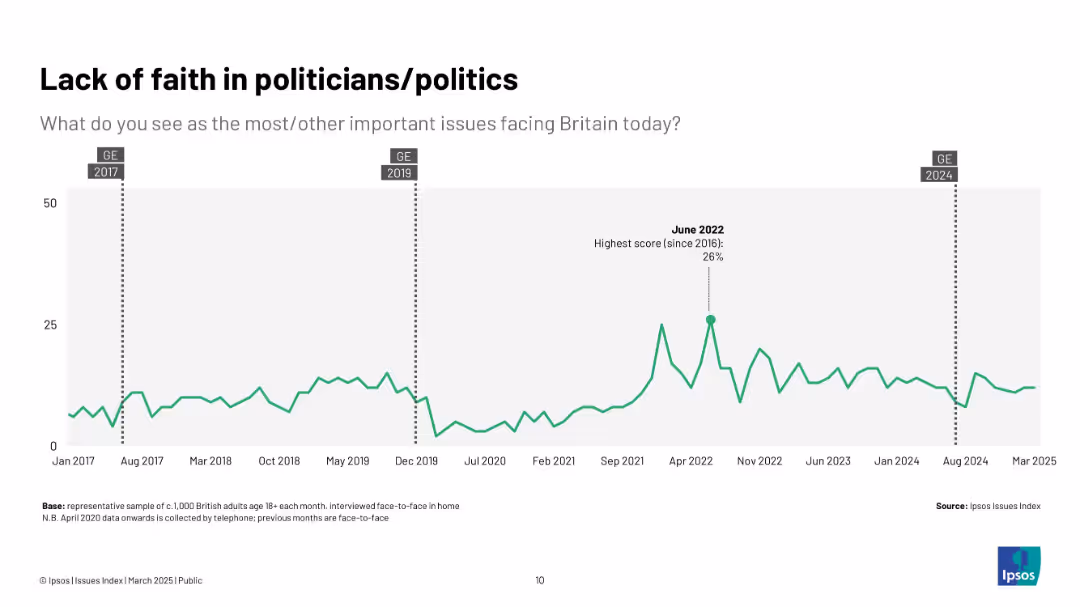
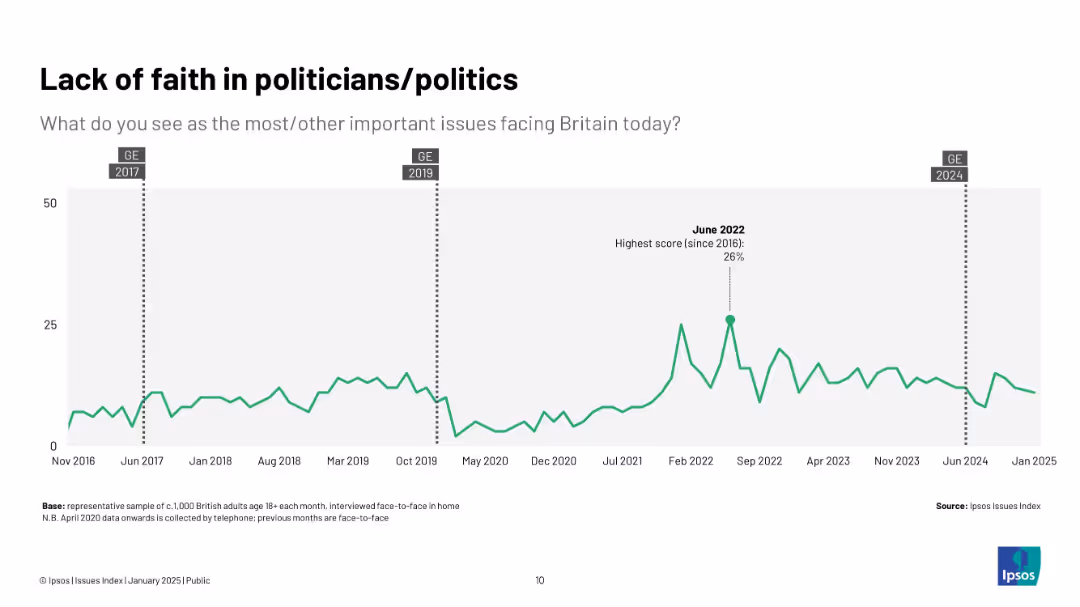
Line graph with labeled key events (e.g., general elections) plotted over time (2016–2025); peak annotations and clean layout on white background.
Market Analysis and Trends
Government & Public Sector
Shows the trend in public concern over politicians/politics in Britain, peaking at 26% in June 2022. Includes markers for general elections and data collection notes.
politics, trust, UK, Ipsos, public opinion, trends, elections, issues index, concern levels
false
Market Analysis and Trends
Government & Public Sector
Single Chart
IPSOS
Add to my slides
Remove from favorites
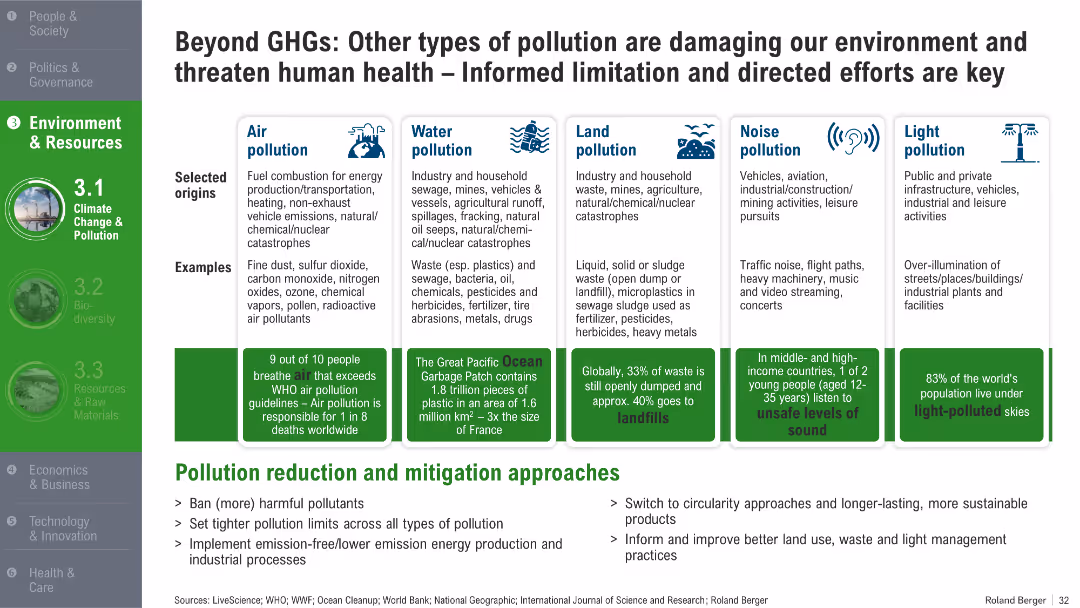
Infographic-style boxes per pollution type (air, water, land, noise, light), each with origins, examples, and stats; green callout boxes and action items
Risk Assessment and Management
Environmental Services & Sustainability
This slide addresses five pollution categories beyond GHGs, such as air, water, and noise, emphasizing their environmental and health impacts. It presents alarming statistics and suggests targeted pollution mitigation strategies like banning harmful pollutants and improving infrastructure.
pollution types, air pollution, water pollution, health impacts, noise, mitigation, WHO data
false
Risk Assessment and Management
Environmental Services & Sustainability
Table
Roland Berger
Add to my slides
Remove from favorites
This slide includes a large pie chart illustrating sales distribution among various business segments, enhanced by imagery representing each segment. It details the percentage of sales, main drivers, and notes the impact of the FCG acquisition. The slide includes various icons and a dotted line highlighting cyclicality levels for different segments, accompanied by the Michelin logo.
Product and Service Analysis
Industrial & Manufacturing
It conveys information on sales distribution across different business segments post-FCG acquisition, emphasizing the strengthening of premium positioning across tire businesses. It is potentially used to present growth strategies, market positioning, and the impact of acquisitions to stakeholders or in business development meetings.
polymer, composite, growth, sales, FCG, Michelin, acquisition, market, segmentation, strategy
false
Product and Service Analysis
Industrial & Manufacturing
Single Chart
Morgan Stanley
Add to my slides
Remove from favorites
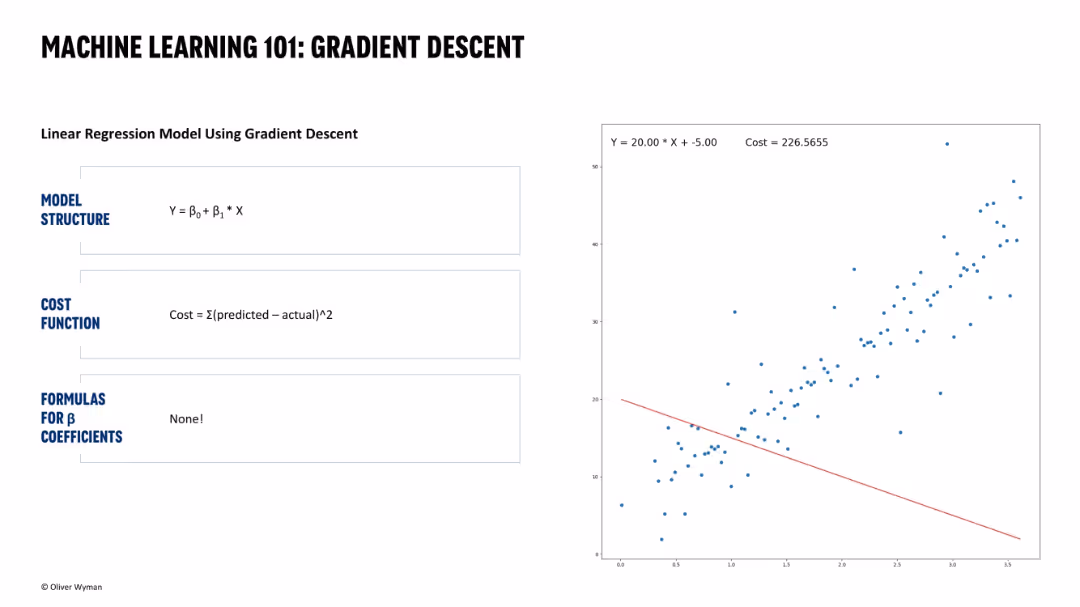
Same layout. Text explains model and cost function. Scatter plot shows a poor-fit regression line with high cost value (226.5655).
Technology and Digital Transformation
Artificial Intelligence
Illustrates an early stage of gradient descent where the regression line is poorly aligned with the data. High cost indicates the need for further optimization.
poor fit, high cost, gradient descent, regression line, model training, machine learning, data science, optimization, early iteration
false
Technology and Digital Transformation
Artificial Intelligence
Single Chart
Oliver Wyman
Add to my slides
Remove from favorites
Slide includes column chart comparing population figures from 2020 to 2050 by continent, alongside lists of countries with notable population sizes in 2050.
Market Analysis and Trends
Government & Public Sector
Analyzes population changes on a continental level, projecting significant increases in Africa and Asia. Discusses demographic shifts that will influence global economic, social, and political trends over the next three decades.
population, Africa, Asia, growth, demographics
false
Market Analysis and Trends
Government & Public Sector
Mixed Chart
Roland Berger
Add to my slides
Remove from favorites
The slide includes multiple data visualizations and text blocks explaining population trends towards 2050, with a focus on changes in global demographics, emphasizing less developed countries.
Market Analysis and Trends
Government & Public Sector
This slide elaborates on future population trends, emphasizing growth in less developed countries and aging populations in developed ones. It includes specific projections for regions like Sub-Saharan Africa and demographic shifts by 2050.
population, aging, development, Africa, demographics
false
Market Analysis and Trends
Government & Public Sector
Linear Flow
Roland Berger
Add to my slides
Remove from favorites
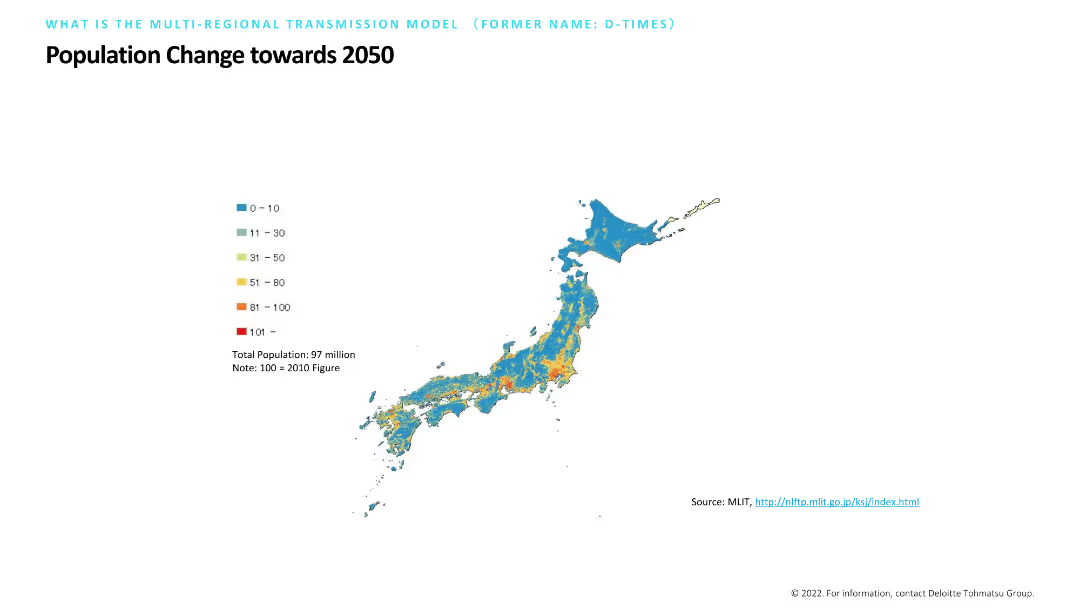
The slide shows a map of Japan with regions color-coded to indicate population change by 2050. Colors range from blue (0-10) to red (101+), providing a visual representation of demographic shifts over time.
Market Analysis and Trends
Government & Public Sector
The slide projects population changes in Japan towards 2050, showing areas of growth and decline. This is useful for urban planning and resource allocation in public sector projects.
Population change, 2050, Japan, demographic shifts, map
false
Market Analysis and Trends
Government & Public Sector
Graphic
Deloitte
Add to my slides
Remove from favorites
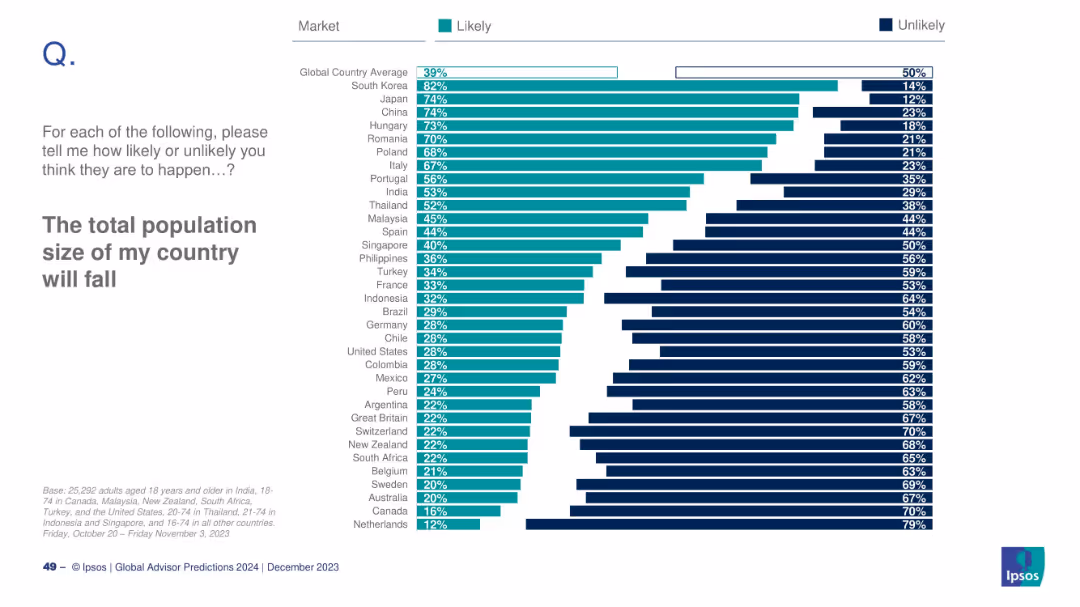
Horizontal bar chart showing perceived likelihood across countries; teal and dark blue bars; global average included.
Market Analysis and Trends
Government & Public Sector
This slide reveals varying national perceptions of population decline. South Korea (82%) expresses the highest concern. The global average is 39%. The slide reflects awareness of demographic challenges, aging populations, and fertility trends.
population decline, demographics, birth rate, aging society, public perception, Ipsos, 2024, fertility, global opinion, migration
false
Market Analysis and Trends
Government & Public Sector
Mixed Chart
IPSOS
Add to my slides
Remove from favorites
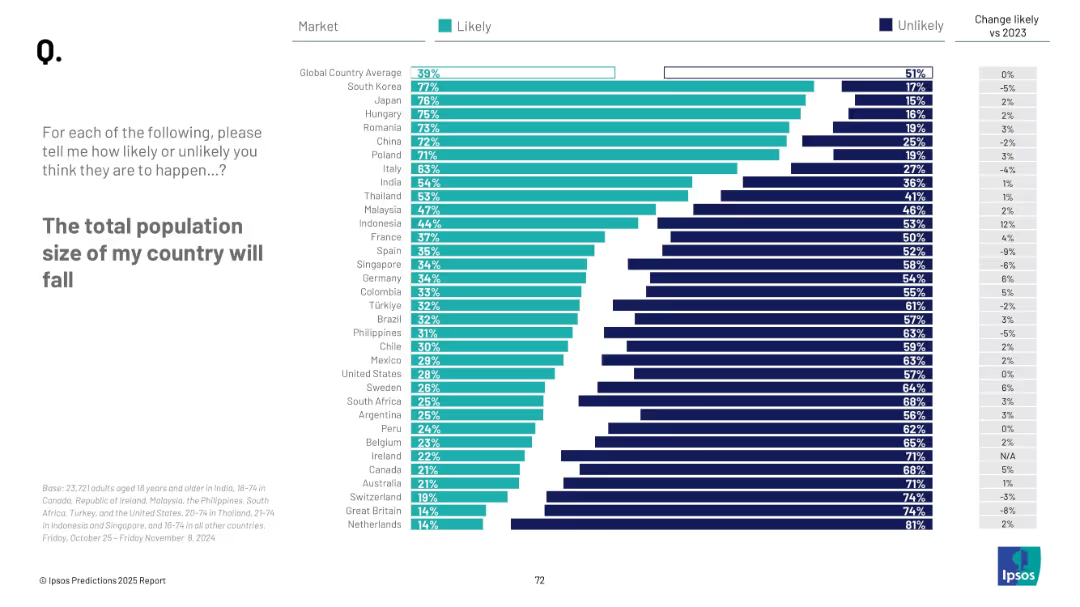
Horizontal bar chart by country showing % who think population will fall; Unlikely vs. Likely comparison; change vs. 2023 included.
Market Analysis and Trends
Government & Public Sector
The slide ranks countries by the perceived likelihood of population decline. East Asian countries like South Korea and Japan rank highest in concern. Global average is 39%, indicating moderate concern. Trend shifts from 2023 are also noted.
population decline, demographics, Ipsos, global sentiment, aging society, fertility, forecast, public perception, 2025 predictions
false
Market Analysis and Trends
Government & Public Sector
Mixed Chart
IPSOS
Add to my slides
Remove from favorites
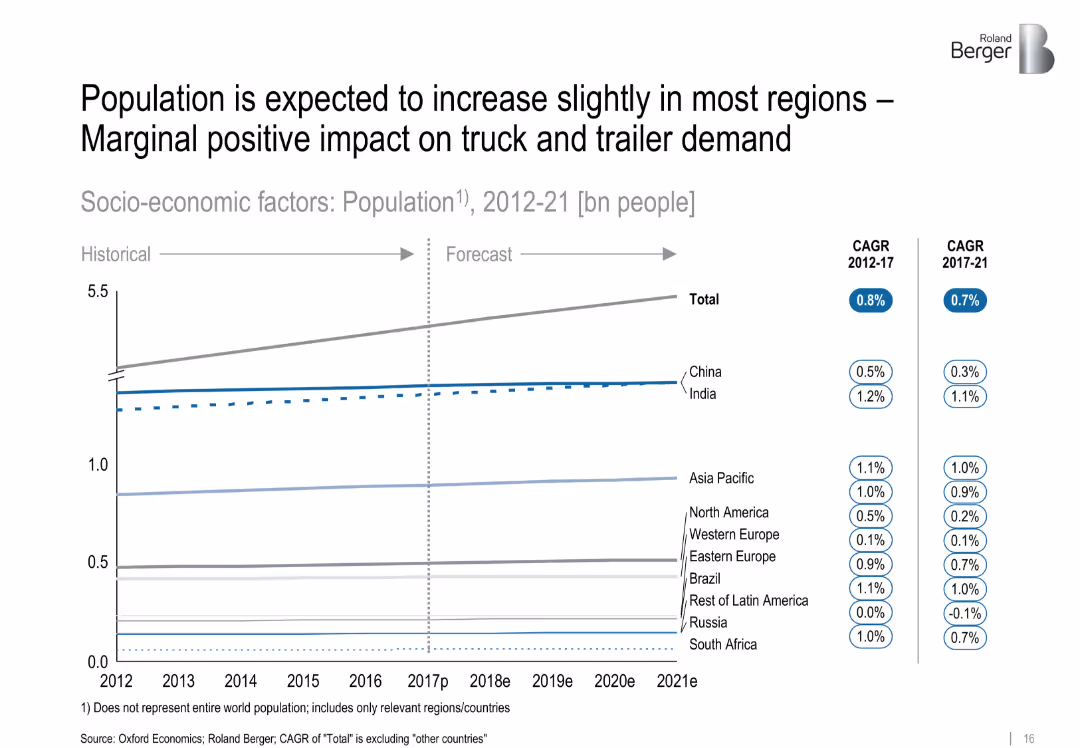
Line chart displaying population growth trends by region from 2012–2021, with CAGR metrics. Organized by country/region, clean layout.
Market Analysis and Trends
Government & Public Sector
The slide projects population growth across various regions, noting modest increases. The implication is a marginal positive effect on logistics and truck/trailer demand due to expanding consumer bases.
['population', 'demographics', 'growth trend', 'logistics impact', 'market drivers', 'regional analysis', 'forecast']
false
Market Analysis and Trends
Government & Public Sector
Single Chart
Roland Berger
Add to my slides
Remove from favorites
This slide is split into two parts, each featuring column charts. The left part displays population characteristics across several Indonesian islands with a focus on urban versus rural population. The right part shows the number of schools and students per school across different regions, highlighting differences in educational infrastructure relative to population density.
Market Analysis and Trends
Education & Training
The slide compares population density and school distribution across Indonesian islands, illustrating how demographic factors influence educational infrastructure.
population density, education, Indonesia, schools, students per school, urban, rural
false
Market Analysis and Trends
Education & Training
Multiple Chart
BCG
Add to my slides
Remove from favorites
Heatmap-style ZIP code map showing population per square mile with a pink-to-purple gradient, paired with text commentary.
Market Analysis and Trends
Government & Public Sector
Highlights that Colorado’s urban centers lie adjacent to high wildfire risk areas. The map emphasizes potential insurance impacts on populated regions like Denver and Colorado Springs.
population density, wildfire adjacency, Denver, Colorado Springs, urban risk
false
Market Analysis and Trends
Government & Public Sector
Mixed Chart
Oliver Wyman
Add to my slides
Remove from favorites
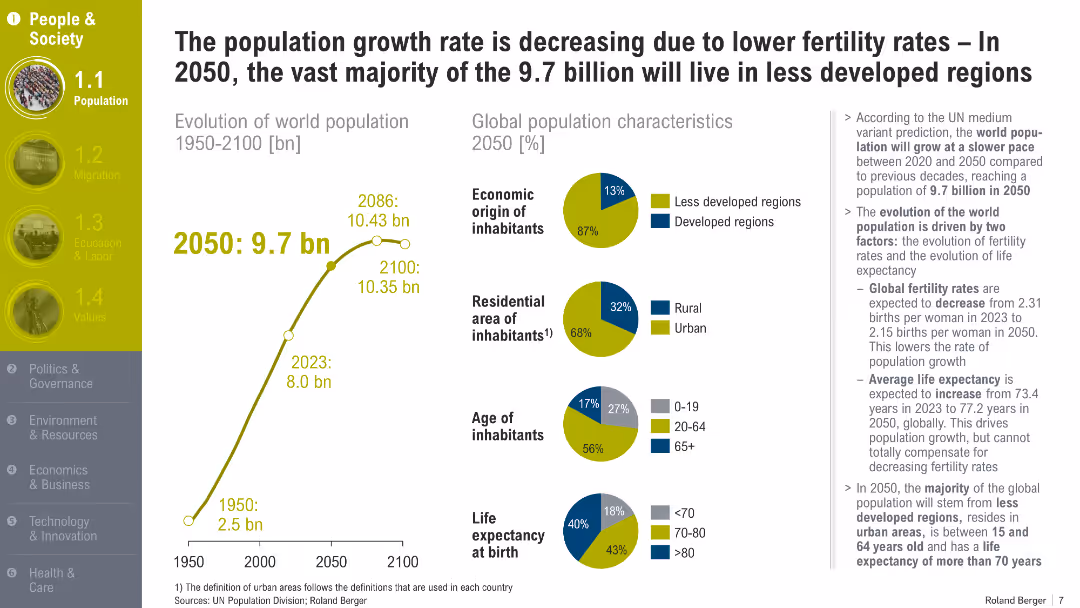
Features a line graph showing world population estimates from 1950 to 2100, and several pie charts detailing global population characteristics in 2050 such as economic origin, residential area, and age distribution.
Market Analysis and Trends
Government & Public Sector
Slide discusses the declining rate of population growth due to lower fertility rates and its larger impact on less developed regions. Key points include the expected urbanization and the median age increase, reflecting broader demographic shifts.
population, fertility, urbanization, aging, development
false
Market Analysis and Trends
Government & Public Sector
Multiple Chart
Roland Berger
Add to my slides
Remove from favorites
Bar chart of population by continent (2023 vs. 2050) and table listing top 5 populous countries by region; clear color-coding
Market Analysis and Trends
Government & Public Sector
The slide shows global population growth trends, highlighting a significant increase in Africa's population and continued dominance by Asia. It details population growth rates and identifies key countries driving regional changes by 2050.
Population Growth, Africa, Asia, 2050, Regional Trends, Demographics, Global Distribution
false
Market Analysis and Trends
Government & Public Sector
Mixed Chart
Roland Berger
Add to my slides
Remove from favorites
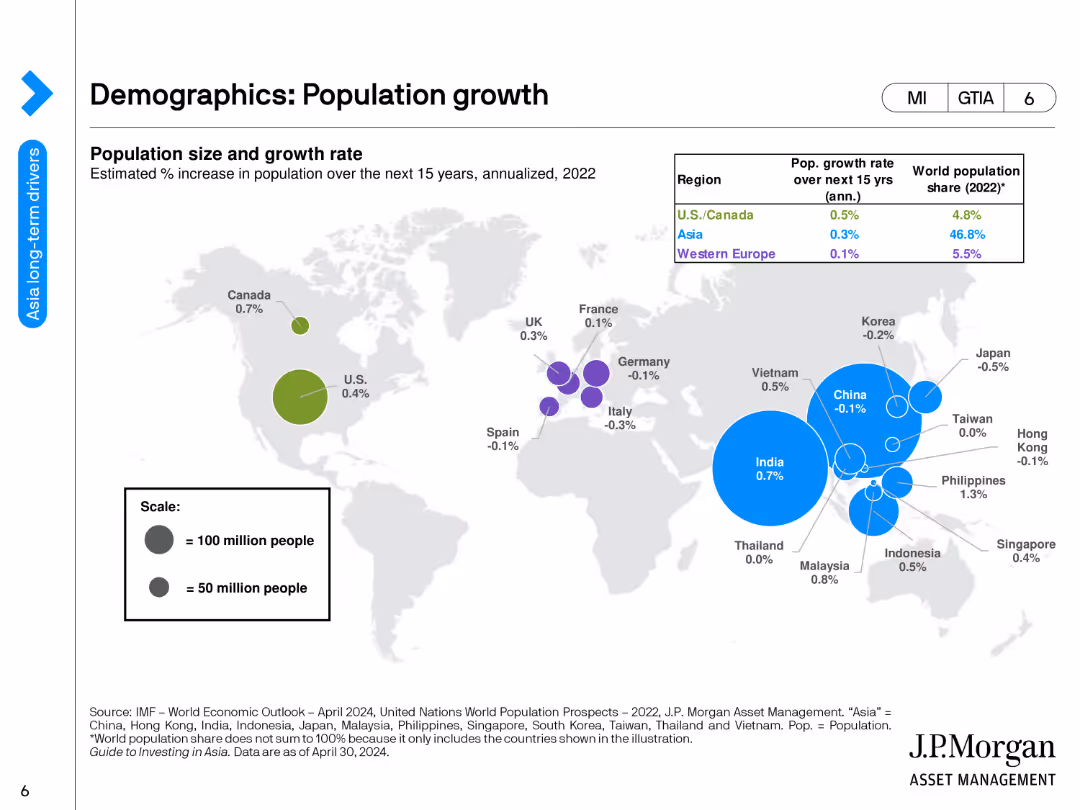
The slide includes a world map showing population size and growth rates by region for the next 15 years, along with a table listing population growth rates and world population shares.
Market Analysis and Trends
Financial Services
This slide examines global population growth trends, identifying key regions of growth and their implications for future economic development. It provides a visual and tabular representation of demographic changes.
Population Growth, Demographics, World Regions, Economic Development, Trends
false
Market Analysis and Trends
Financial Services
Single Chart
JP Morgan
Add to my slides
Remove from favorites
Bar chart and text comparison of developed vs. developing population growth from 2015 to 2030.
Market Analysis and Trends
Government & Public Sector
Projects that nearly all global population growth through 2030 will occur in developing countries, emphasizing the need for infrastructure and services in those regions.
population growth, developing countries, demographics, infrastructure
false
Market Analysis and Trends
Government & Public Sector
Mixed Chart
Roland Berger
Add to my slides
Remove from favorites
Split layout with population growth chart (1950–2100) and pie charts for population characteristics in 2050; includes key demographic insights
Market Analysis and Trends
Government & Public Sector
This slide discusses slowing population growth due to declining fertility rates and increasing life expectancy. It forecasts that by 2050, most of the 9.7 billion global population will live in less developed regions and be primarily urban.
Population Growth, Fertility Rate, Demographics, 2050, Urbanization, Global Trends, Life Expectancy
false
Market Analysis and Trends
Government & Public Sector
Multiple Chart
Roland Berger
Add to my slides
Remove from favorites
The slide contains multiple line charts showing trends in population growth and increases in global food calorie requirements, represented through 2030 and 2050 projections. It also features a shopping basket icon to symbolize rising food demand. Key data points include population figures from 2015 and projections for 2030 and 2050, along with percentages illustrating the increase in required food calories.
Market Analysis and Trends
Agriculture & Food Production
This slide analyzes the relationship between population growth, rising per capita food consumption, and the consequent increase in global food demand. It uses projections to highlight how food calorie requirements will escalate due to these factors, emphasizing the urgency of addressing food security.
population growth, food demand, calorie intake, economic development, future projections, developed countries, developing countries, food security, sustainability, consumption patterns
false
Market Analysis and Trends
Agriculture & Food Production
Multiple Chart
Roland Berger
Add to my slides
Remove from favorites
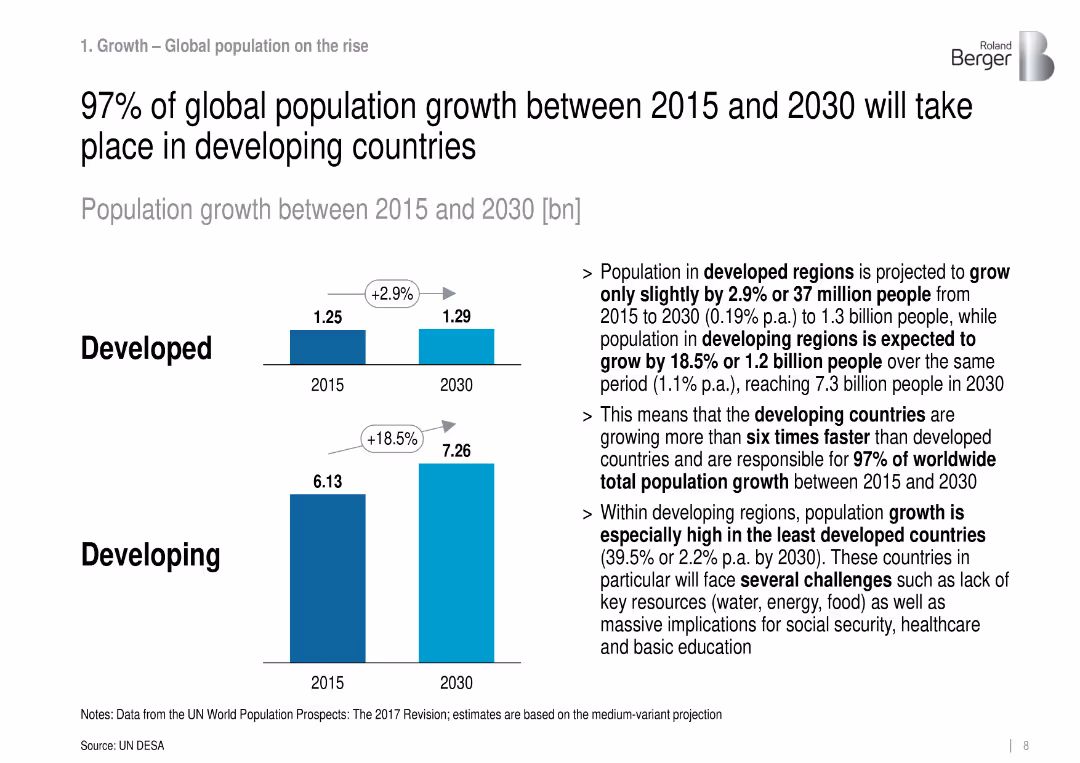
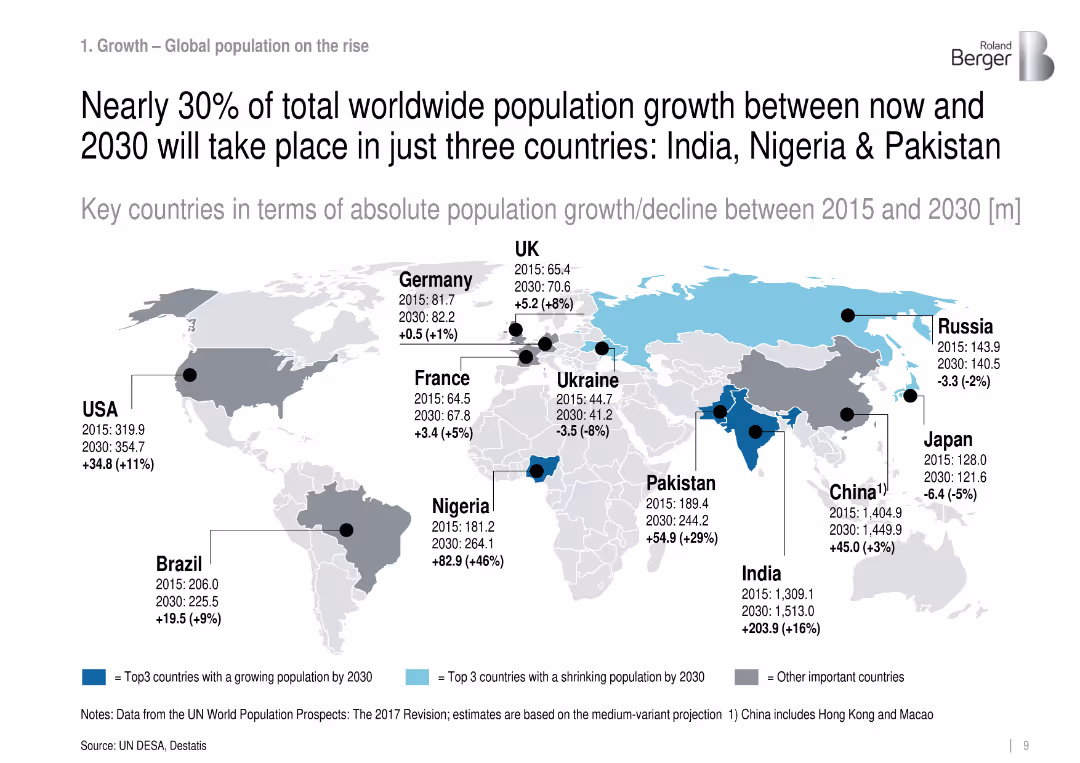
World map with black/blue circle markers indicating population growth/decline per country from 2015 to 2030.
Market Analysis and Trends
Government & Public Sector
The slide visualizes absolute population growth from 2015 to 2030 by country, showing that India, Nigeria, and Pakistan will contribute nearly 30% of global growth. It includes current and projected population figures and percentage change.
population growth, India, Nigeria, Pakistan, demographics, global trends, UN projections, 2030, population distribution
false
Market Analysis and Trends
Government & Public Sector
Single Chart
Roland Berger
Add to my slides
Remove from favorites
This slide contains several columns and textual analysis divided into multiple sections. It uses a two-column layout with icons representing population and migration.
Market Analysis and Trends
Professional Services
This slide discusses strategies for entering growing markets, addressing older demographics, and using city developments as business opportunities. Intended for strategic business reviews.
population growth, market entry, older demographics, city development, strategic planning
false
Market Analysis and Trends
Professional Services
Header Vertical
Roland Berger
Add to my slides
Remove from favorites
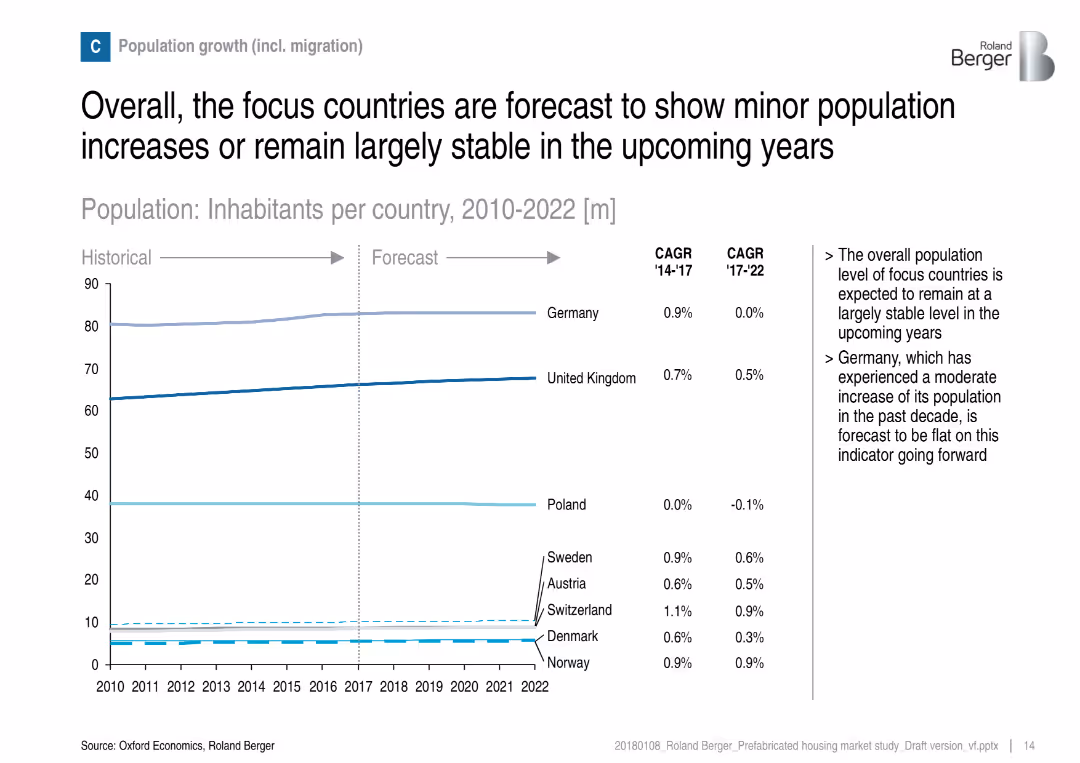
Line graph showing population forecasts by country from 2010–2022, with CAGR statistics and commentary.
Strategic Planning
Real Estate & Construction
The slide discusses demographic stability in focus countries and its implication on housing demand. It shows minor changes in population growth across countries like Germany, UK, and Poland, suggesting stable but modest housing market expansion.
population growth, migration, housing demand, stability, demographics, forecast, Germany, UK, Poland
false
Strategic Planning
Real Estate & Construction
Mixed Chart
Roland Berger
Add to my slides
Remove from favorites
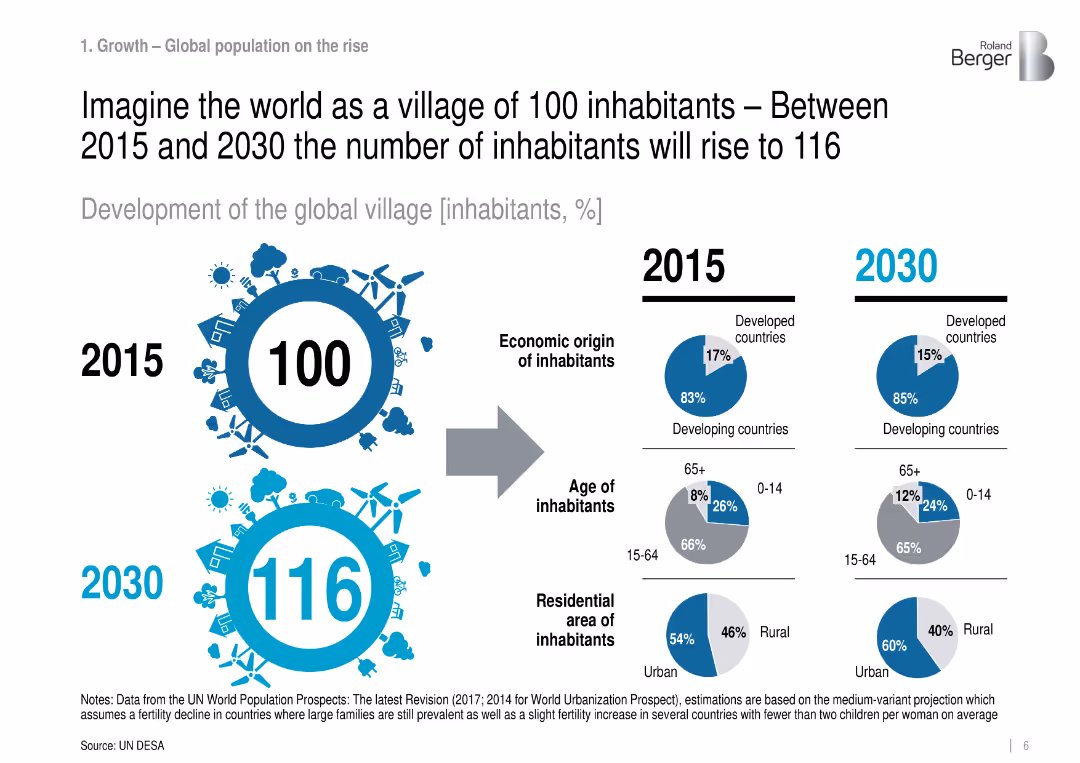
Infographic comparing 2015 vs. 2030: population structure by region, age, and residence.
Industry Overview
Government & Public Sector
Visualizes global demographic changes in a simplified 100-person village analogy, projecting more urbanization and aging population, especially in developing countries.
population growth, urbanization, demographics, global trends
false
Industry Overview
Government & Public Sector
Mixed Chart
Roland Berger
Add to my slides
Remove from favorites
This slide combines maps and inset data points to compare population growth and decline across various countries, emphasizing changes in countries like India, Nigeria, and Pakistan.
Market Analysis and Trends
Government & Public Sector
Provides detailed projections of population changes in key countries from 2020 to 2050. It includes comparative analysis highlighting countries with the highest growth and those with declines, such as China and Germany.
population, India, Nigeria, China, growth
false
Market Analysis and Trends
Government & Public Sector
Graphic
Roland Berger
Add to my slides
Remove from favorites
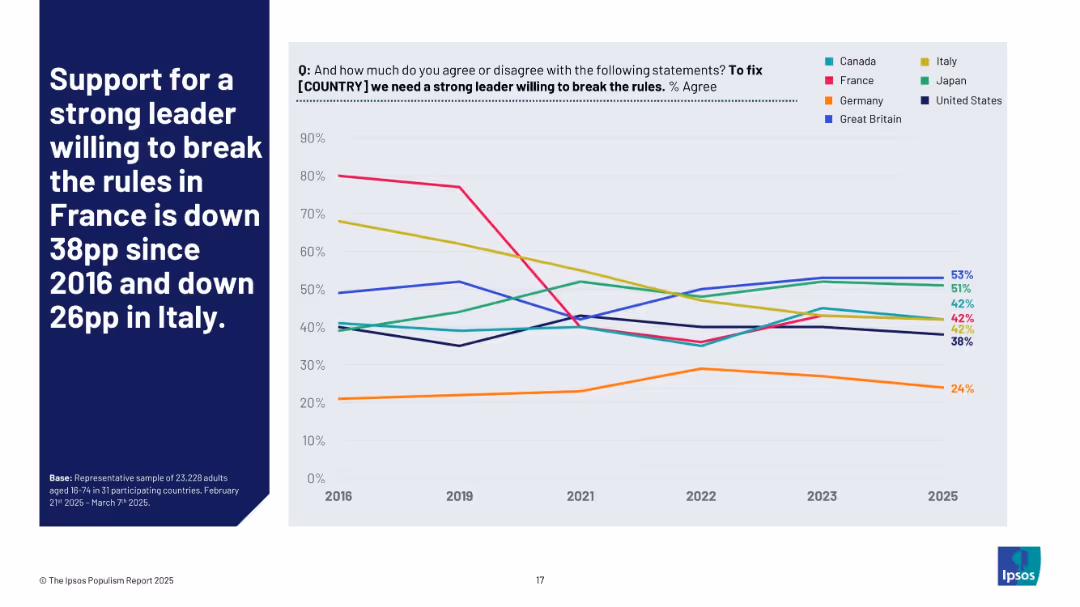
Line chart showing trends from 2016 to 2025 in agreement with the “strong leader willing to break rules” statement across selected countries. Each country is represented by a distinct colored line.
Strategic Planning
Government & Public Sector
This chart visually represents how support for strong leadership has evolved in several countries. Notably, France and Italy have seen major drops in support over the past decade, reflecting shifts in political tolerance or trust in rule-bending solutions.
populism, authoritarianism, leadership, Ipsos trend, France, Italy, political change, international opinion
false
Strategic Planning
Government & Public Sector
Mixed Chart
IPSOS
Add to my slides
Remove from favorites
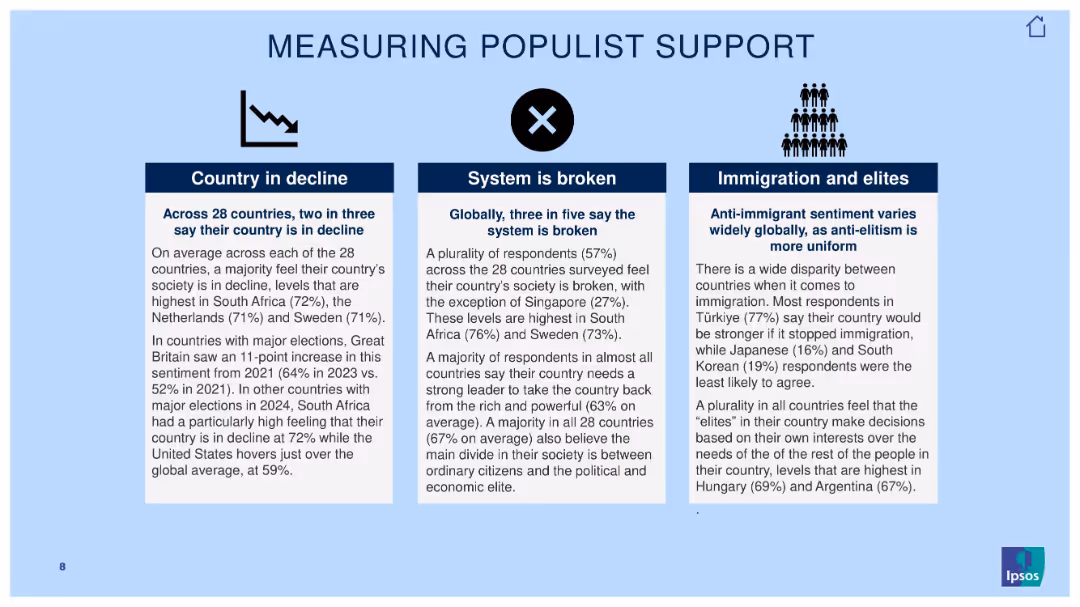
Three-column text slide with icons and bold subheadings over light blue background.
Market Analysis and Trends
Government & Public Sector
This slide outlines findings related to populist sentiment. It categorizes beliefs into three pillars: country in decline, broken systems, and views on immigration and elites. Key figures from 28-country averages support insights on political unrest.
populism, elite distrust, societal decline, Ipsos data, global opinion, political perception, immigration sentiment, broken system
false
Market Analysis and Trends
Government & Public Sector
Pillar
IPSOS
Add to my slides
Remove from favorites
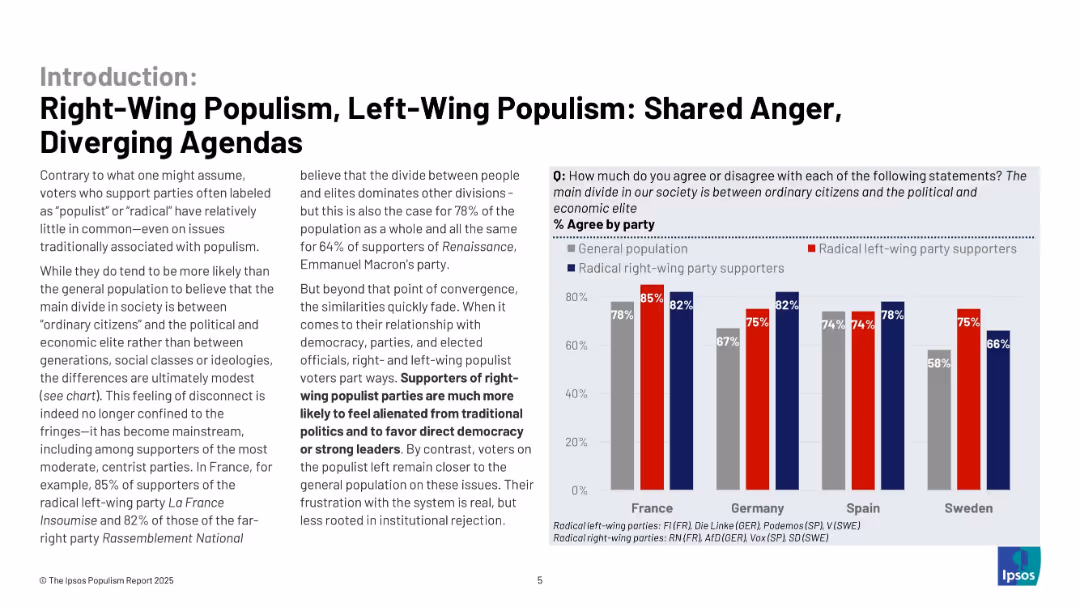
Text and bar chart comparing belief in a society divided between elites and ordinary citizens by political ideology and country.
Customer and Market Segmentation
Government & Public Sector
The slide compares agreement levels with the belief that society is divided between elites and citizens across France, Germany, Spain, and Sweden, broken down by political orientation. Both radical right and left show high agreement.
populism, elites, democracy, left-wing, right-wing, public sentiment
false
Customer and Market Segmentation
Government & Public Sector
Mixed Chart
IPSOS
Add to my slides
Remove from favorites
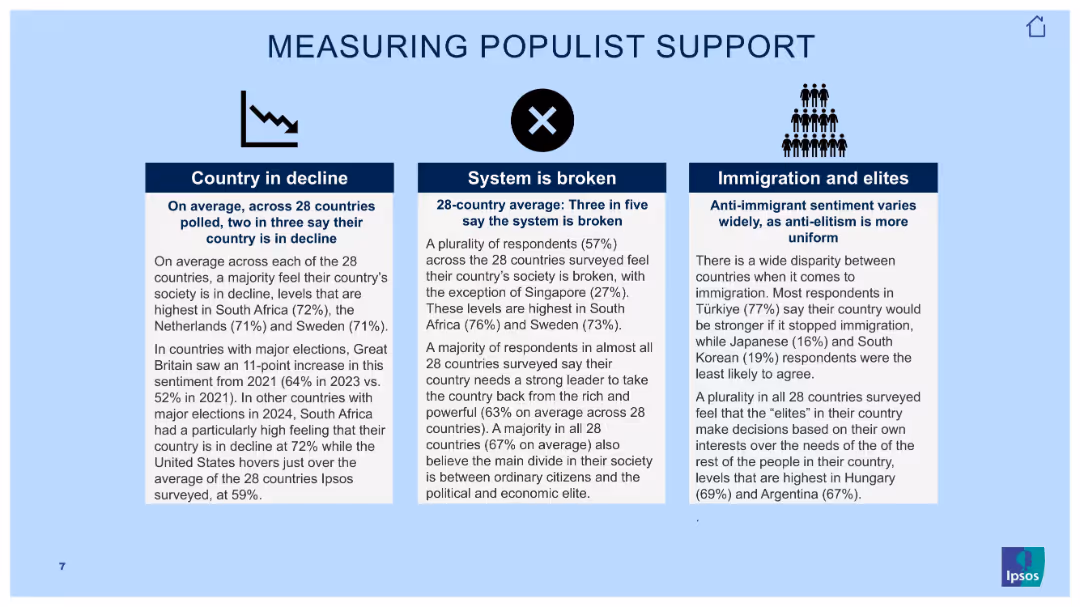
Three-column layout on pale blue background with icons and text describing three metrics: country decline, broken system, and immigration/elite sentiments.
Strategic Planning
Government & Public Sector
Explains indicators of populist sentiment across 28 countries, covering belief in national decline, systemic dysfunction, and anti-elite/anti-immigrant attitudes, with examples of countries with strongest sentiments.
populism, elites, immigration, system distrust, perception, Ipsos, decline, sentiment
false
Strategic Planning
Government & Public Sector
Pillar
IPSOS
Add to my slides
Remove from favorites
Slide includes a mix of text, tables, and a pie chart, detailing the IPO of Porsche AG, including pricing details, market cap, and investor allocation. The design integrates both quantitative data and qualitative analysis.
Investment Analysis
Financial Services
Highlights the financial and strategic details of Porsche AG's IPO, discussing the company's rationale for going public, transaction highlights, and investor responses.
Porsche IPO, financial analysis, market cap, investor allocation, 2022, automotive industry, strategic planning, public offering
false
Investment Analysis
Financial Services
Mixed Chart
PwC/Strategy&
Add to my slides
Remove from favorites
The slide features a column chart showing port costs by component across different Australian states and countries, with annotations on utilization and cost factors.
Operational Efficiency
Transportation & Logistics
The slide examines the port terminal costs in Australia compared to Canada, highlighting the impact of dispersed facilities on utilization and costs, with detailed notes on efficiency and infrastructure.
Port costs, Australia, Canada, port terminal, transportation, logistics, cost analysis, utilization, operational efficiency
false
Operational Efficiency
Transportation & Logistics
Mixed Chart
LEK
Add to my slides
Remove from favorites
This slide includes a column chart comparing port costs in Australia, the US, and France, with bullet points discussing various factors affecting port costs and their implications for supply chains.
Market Analysis and Trends
Transportation & Logistics
It evaluates the direct port costs in Australia compared to the US and France, highlighting factors that influence these costs and the competitive position of Australian ports within the global market.
port costs, Australia, US, France, supply chain, comparison
false
Market Analysis and Trends
Transportation & Logistics
Mixed Chart
LEK
Add to my slides
Remove from favorites
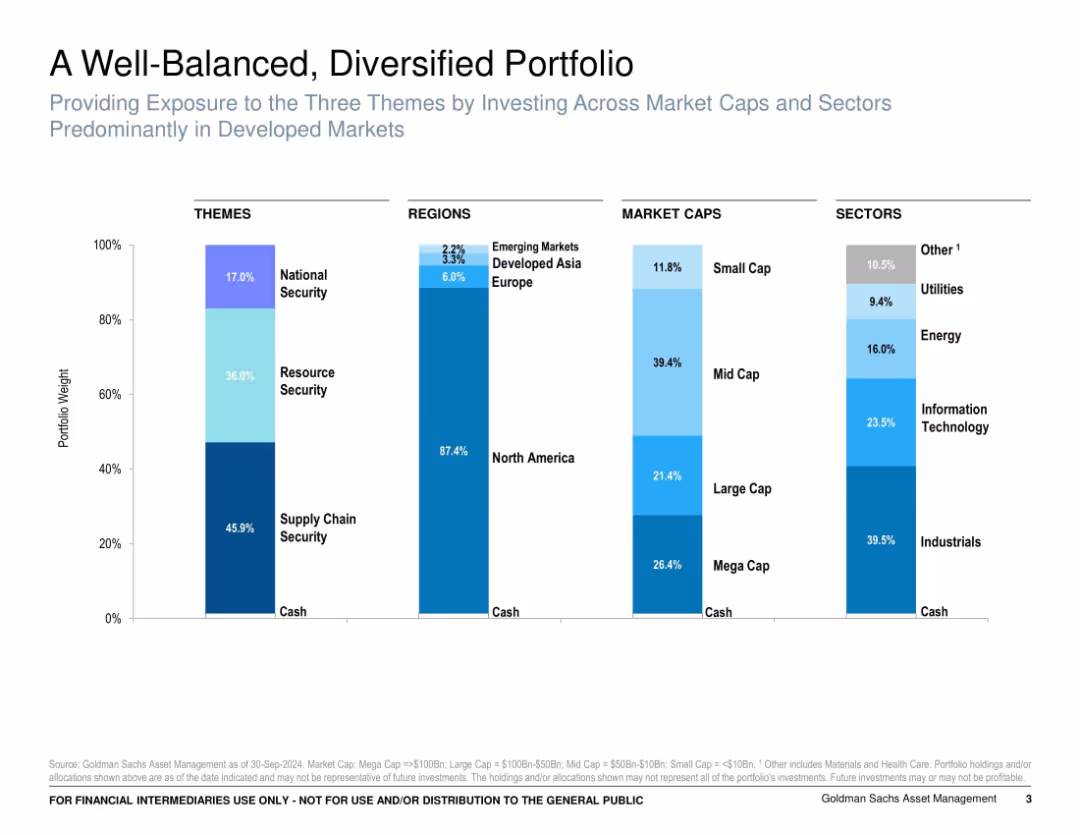
Four vertical stacked bar charts showing weightings by theme, region, market cap, and sector. Light blue color scheme.
Investment Analysis
Financial Services
Breaks down a diversified portfolio by thematic exposure, geographic allocation, market capitalization, and sector. Shows emphasis on North America, supply chain security, and industrials. Indicates strategic portfolio structure across economic and security priorities.
portfolio allocation, diversification, market cap, sector exposure, supply chain, investment strategy, financial planning
false
Investment Analysis
Financial Services
Single Chart
Goldman Sachs
Add to my slides
Remove from favorites
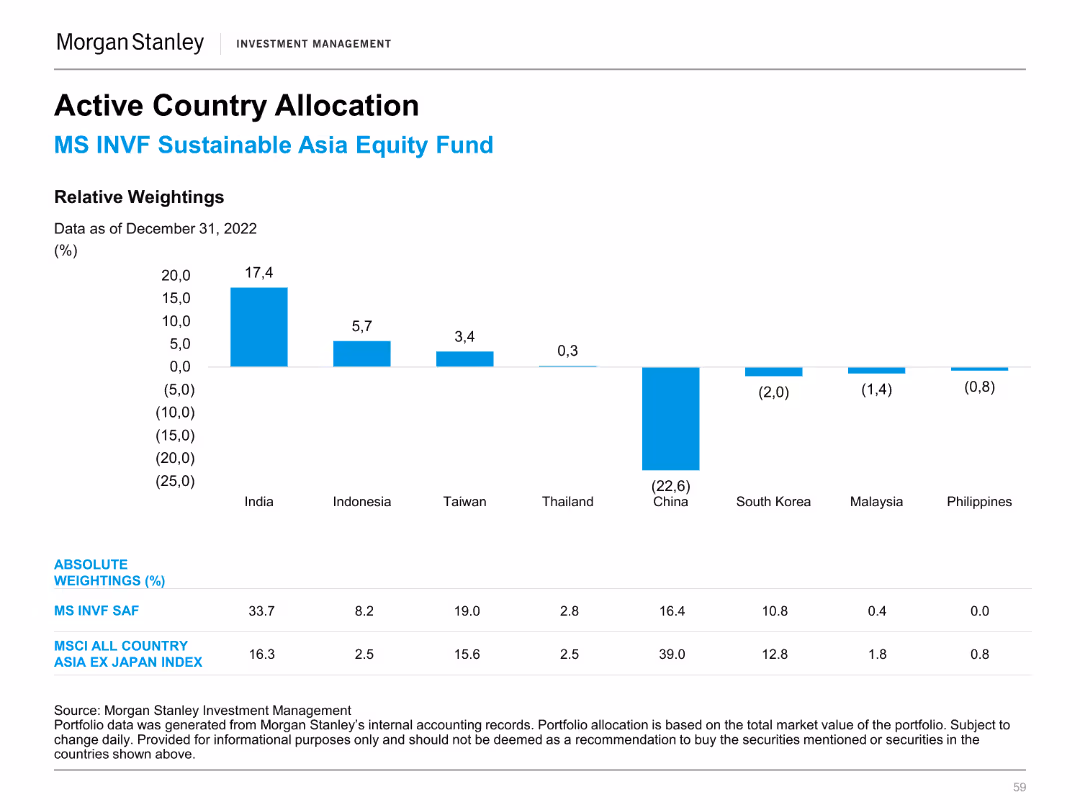
A column chart depicting the weightings of countries in the MS INVF Sustainable Asia Equity Fund as of December 31, 2022.
Market Analysis and Trends
Financial Services
Shows the fund's allocations versus the MSCI All Country Asia ex Japan Index, indicating notable over/under-weights.
Portfolio, Asia, weightings, fund, equity
false
Market Analysis and Trends
Financial Services
Mixed Chart
Morgan Stanley
Add to my slides
Remove from favorites
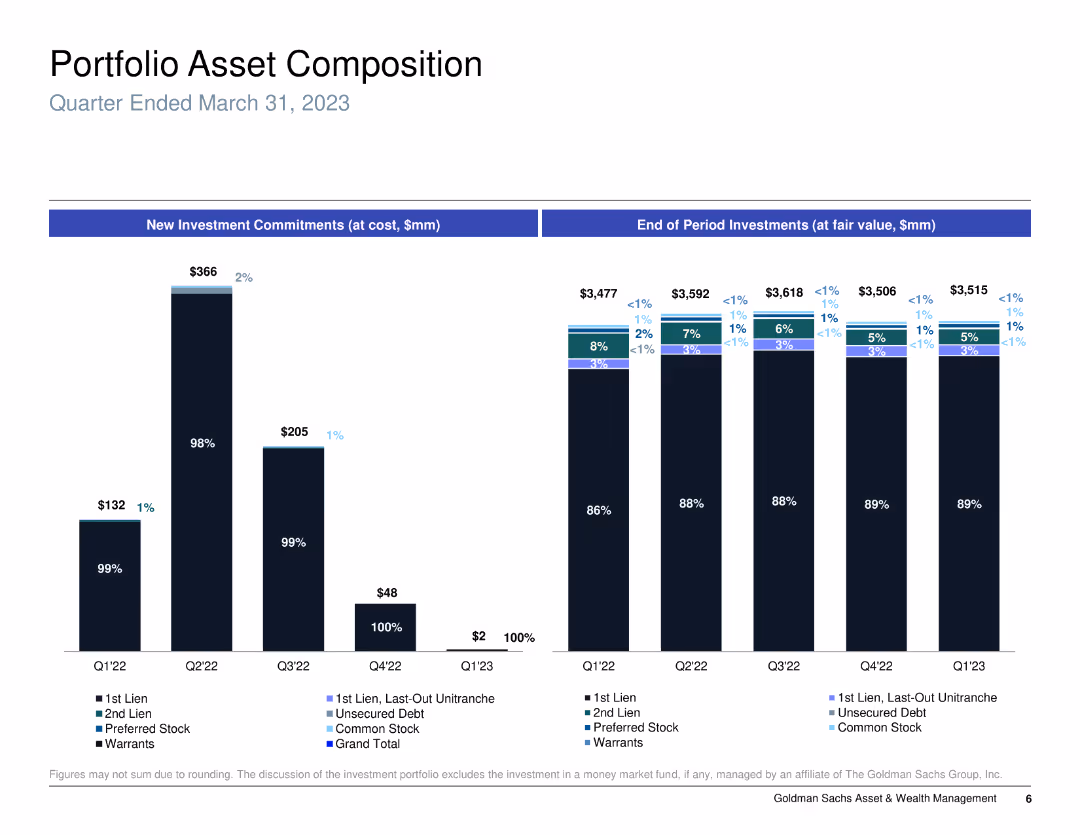
Column chart showing new investment commitments and end of period investments, categorized by type of asset.
Investment Analysis
Financial Services
Analyzes the portfolio asset composition for a specific period, detailing types of investments and their changes over time.
portfolio, assets, investment, commitments
false
Investment Analysis
Financial Services
Multiple Chart
Goldman Sachs
Add to my slides
Remove from favorites
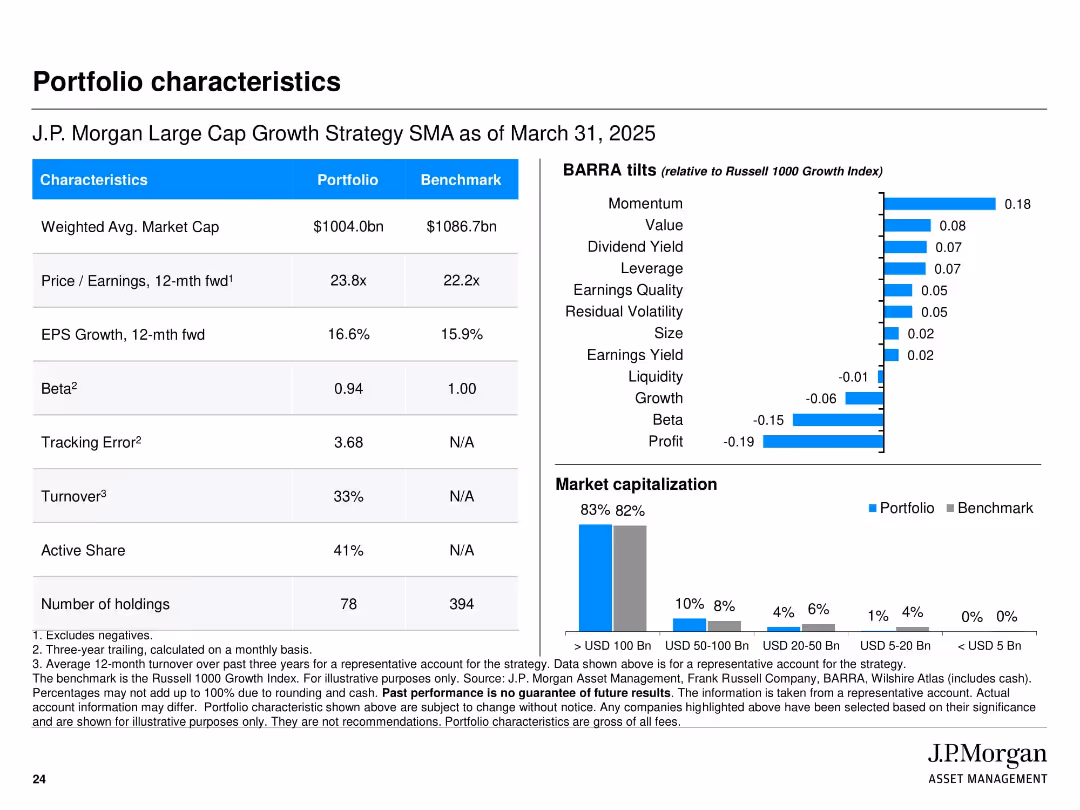
Split table and bar chart layout; left side contains metrics vs benchmark, right side has BARRA tilt indicators and market cap breakdown
Investment Analysis
Financial Services
Compares portfolio and benchmark characteristics, such as market cap, P/E ratio, EPS growth, beta, turnover, and tracking error. Also includes BARRA factor tilts and market cap exposure bars to highlight the portfolio’s structural and style differences versus the Russell 1000 Growth Index.
portfolio, benchmark, characteristics, market cap, BARRA, tilts, beta, P/E, J.P. Morgan
false
Investment Analysis
Financial Services
Multiple Chart
JP Morgan
Add to my slides
Remove from favorites
Four distinct categories with associated images and lists
Strategic Planning
Industrial & Manufacturing
Overview of LANXESS's business portfolio and strengths
Portfolio, Business, Resilience, Cash Generation, Growth
false
Strategic Planning
Industrial & Manufacturing
Table
Morgan Stanley
Add to my slides
Remove from favorites
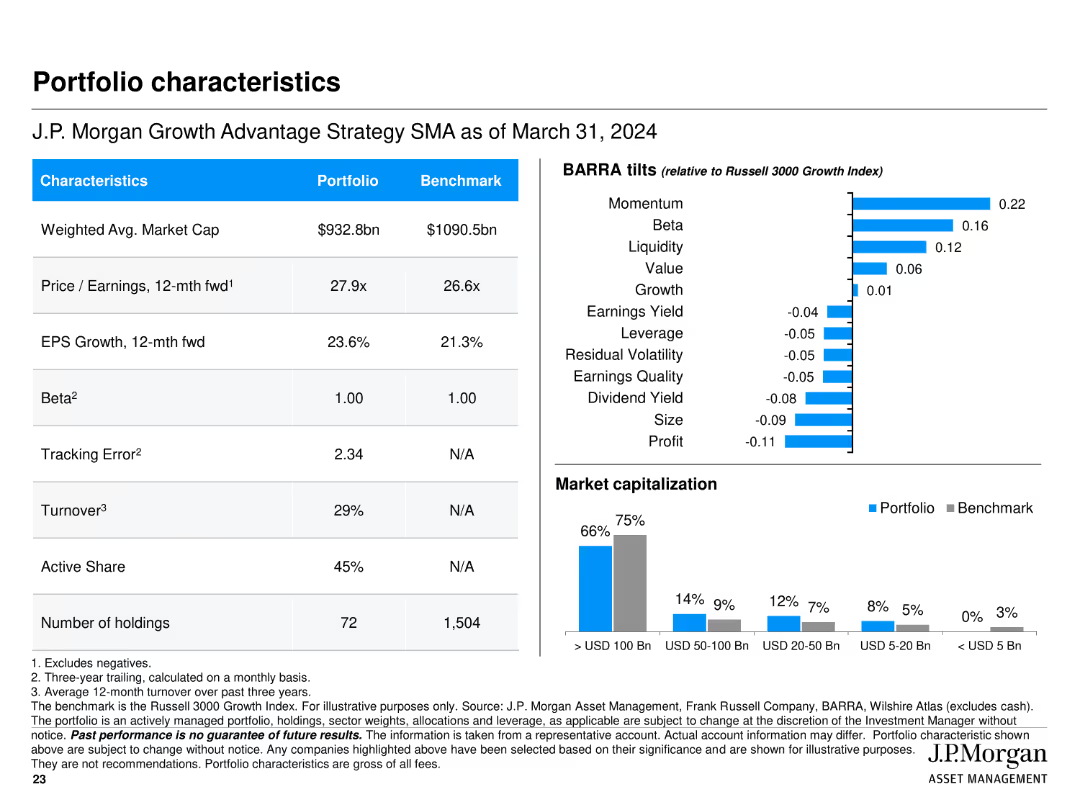
Features multiple tables and bar charts presenting portfolio characteristics such as market cap, P/E ratio, EPS growth, BARRA tilts, and market capitalization breakdown.
Financial Performance
Financial Services
Summarizes key characteristics of J.P. Morgan Growth Advantage Strategy, including market cap, P/E ratio, and EPS growth, along with comparisons to the benchmark.
portfolio, characteristics, market cap, P/E ratio, EPS growth, bar chart, table
false
Financial Performance
Financial Services
Multiple Chart
JP Morgan
Add to my slides
Remove from favorites
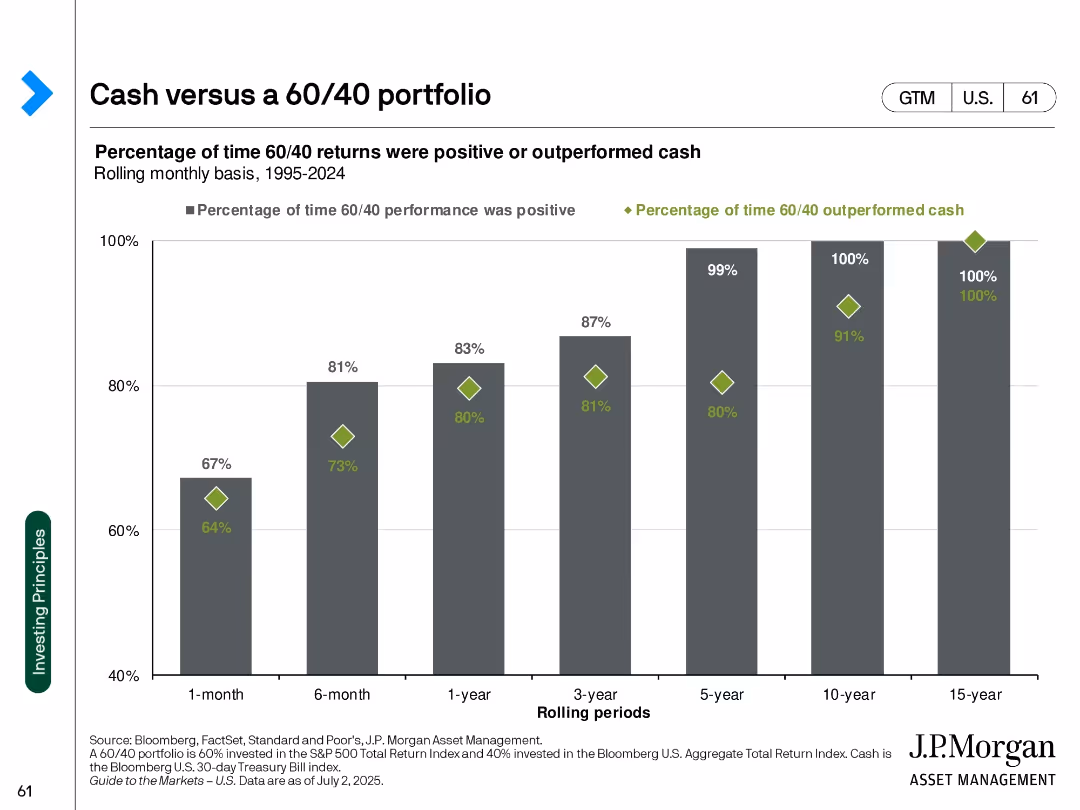
Bar chart showing percentages over different rolling periods; green diamonds and gray bars used
Investment Analysis
Financial Services
Illustrates frequency of positive performance and outperformance of a 60/40 portfolio relative to cash between 1995–2024. Shows increased consistency over longer holding periods.
portfolio comparison, 60/40 strategy, cash, rolling returns, performance probability, asset allocation, time horizon
false
Investment Analysis
Financial Services
Single Chart
JP Morgan
Add to my slides
Remove from favorites
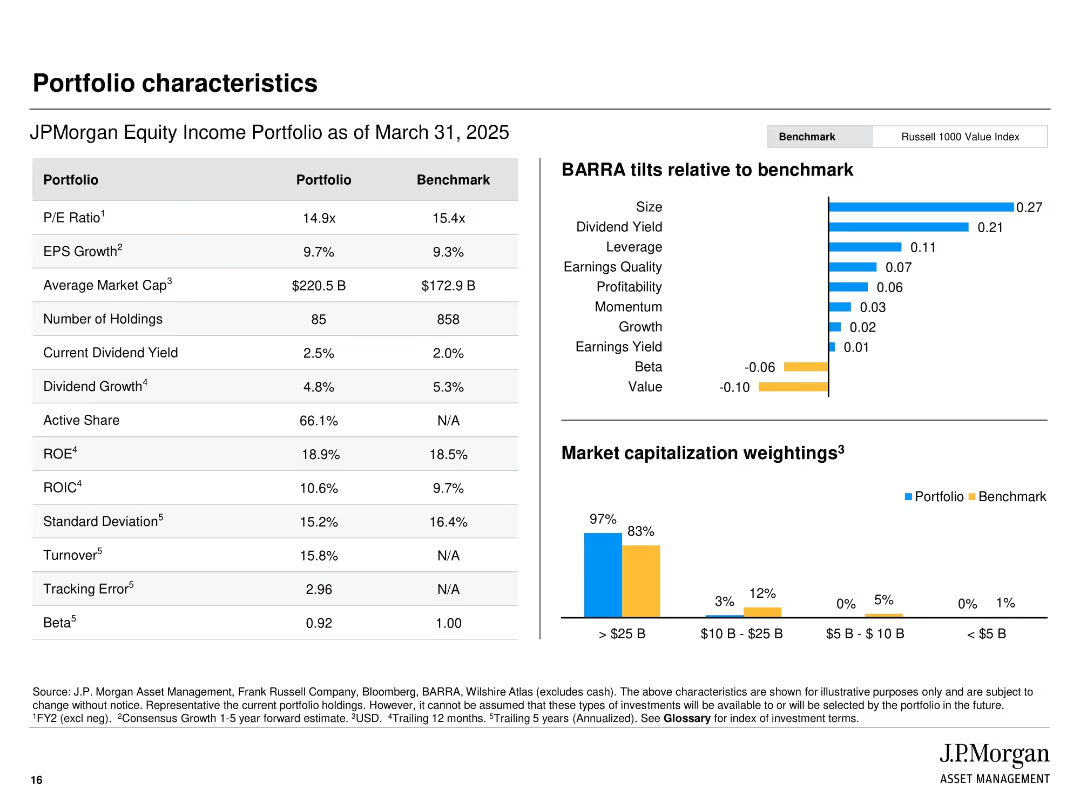
Side-by-side comparison table of portfolio vs benchmark; right section shows BARRA factor tilts and market cap breakdown.
Financial Performance
Financial Services
Compares JPMorgan’s Equity Income Portfolio with the Russell 1000 Value Index on metrics such as P/E, ROE, and dividend yield. BARRA tilts show factor exposures. A bar chart visualizes market cap breakdown, showing a bias toward large-cap holdings.
portfolio comparison, BARRA tilts, market cap, dividend yield, PE ratio, financial metrics, benchmark
false
Financial Performance
Financial Services
Multiple Chart
JP Morgan
Add to my slides
Remove from favorites
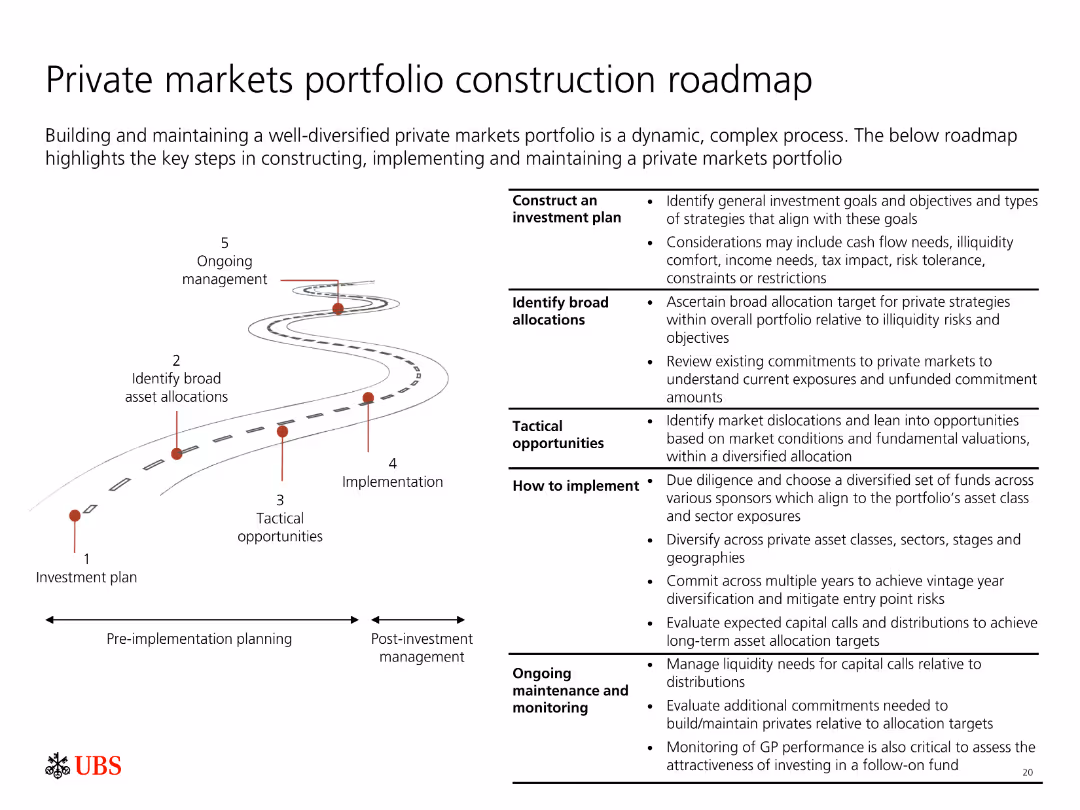
Depicts a roadmap with five key steps for constructing and maintaining a diversified private markets portfolio, from investment plan to ongoing management.
Strategic Planning
Financial Services
Outlines the process of building a private markets portfolio, including investment planning, asset allocation, tactical opportunities, implementation, and management.
Portfolio construction, private markets, roadmap, investment planning, management
false
Strategic Planning
Financial Services
Linear Flow
UBS
Add to my slides
Remove from favorites
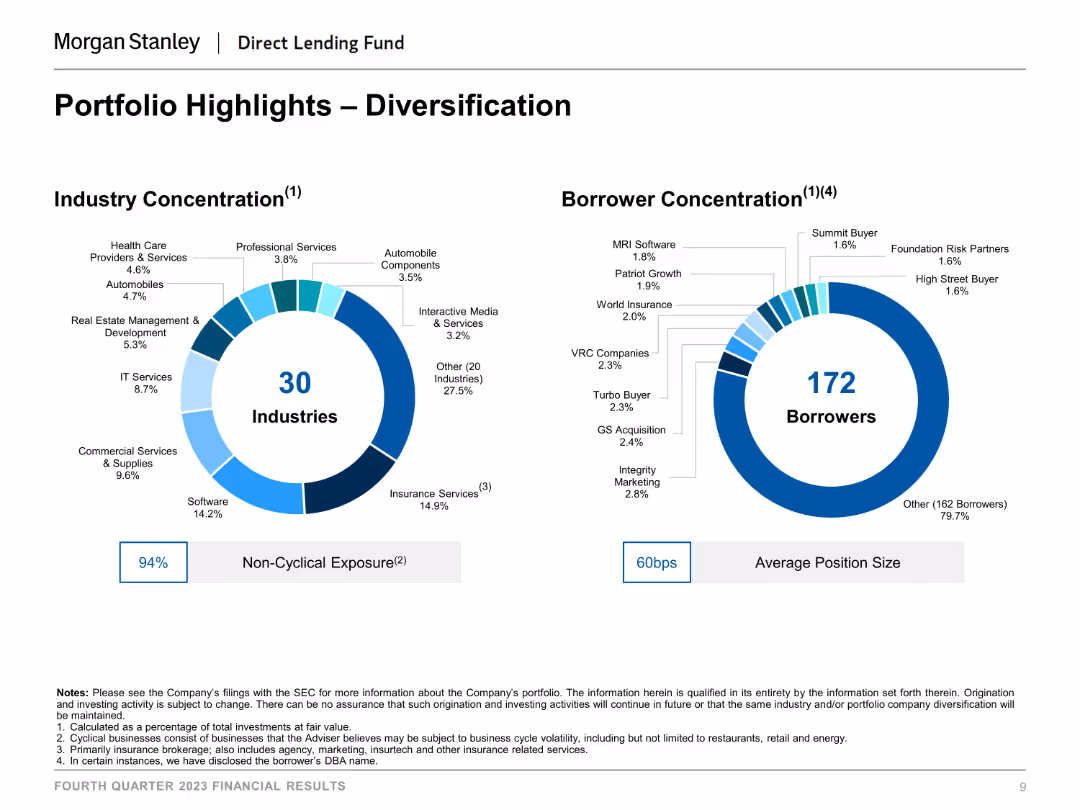
This slide features two doughnut charts illustrating industry and borrower concentration within a portfolio. The charts use different colors to represent various industries and borrower groups, with percentages indicating their respective shares.
Investment Analysis
Financial Services
The slide highlights the diversification of a portfolio by showing the distribution of investments across different industries and borrower groups, useful for understanding portfolio exposure and risk management strategies.
portfolio diversification, industry concentration, borrower concentration, investment analysis, financial services
false
Investment Analysis
Financial Services
Multiple Chart
Morgan Stanley
Add to my slides
Remove from favorites
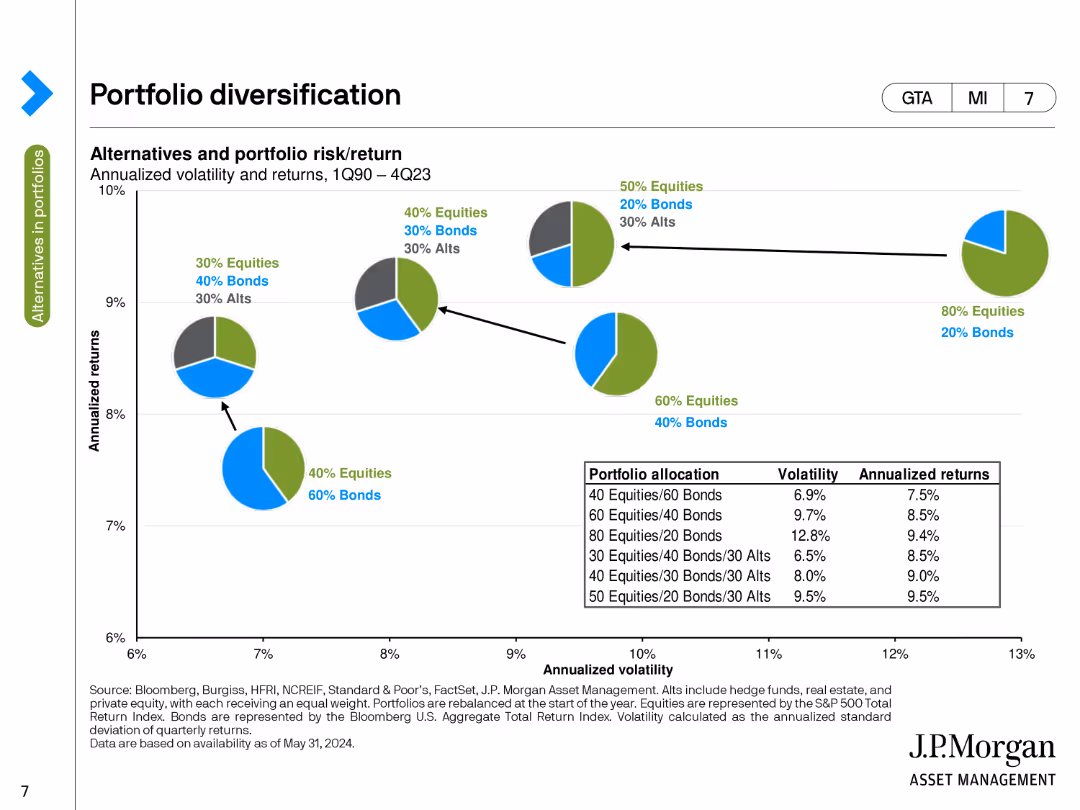
The slide features a scatter plot with pie charts showing different portfolio allocations, annualized returns, and volatility. The data is displayed on a white background with green and blue colors highlighting equities, bonds, and alternatives.
Investment Analysis
Financial Services
This slide illustrates the annualized returns and volatility for various portfolio allocations, focusing on equities, bonds, and alternatives from 1Q90 to 4Q23. It aims to show the risk/return profiles for different asset mixes to aid in investment decision-making.
Portfolio, Equities, Bonds, Alternatives, Risk/Return
false
Investment Analysis
Financial Services
Multiple Chart
JP Morgan
Add to my slides
Remove from favorites
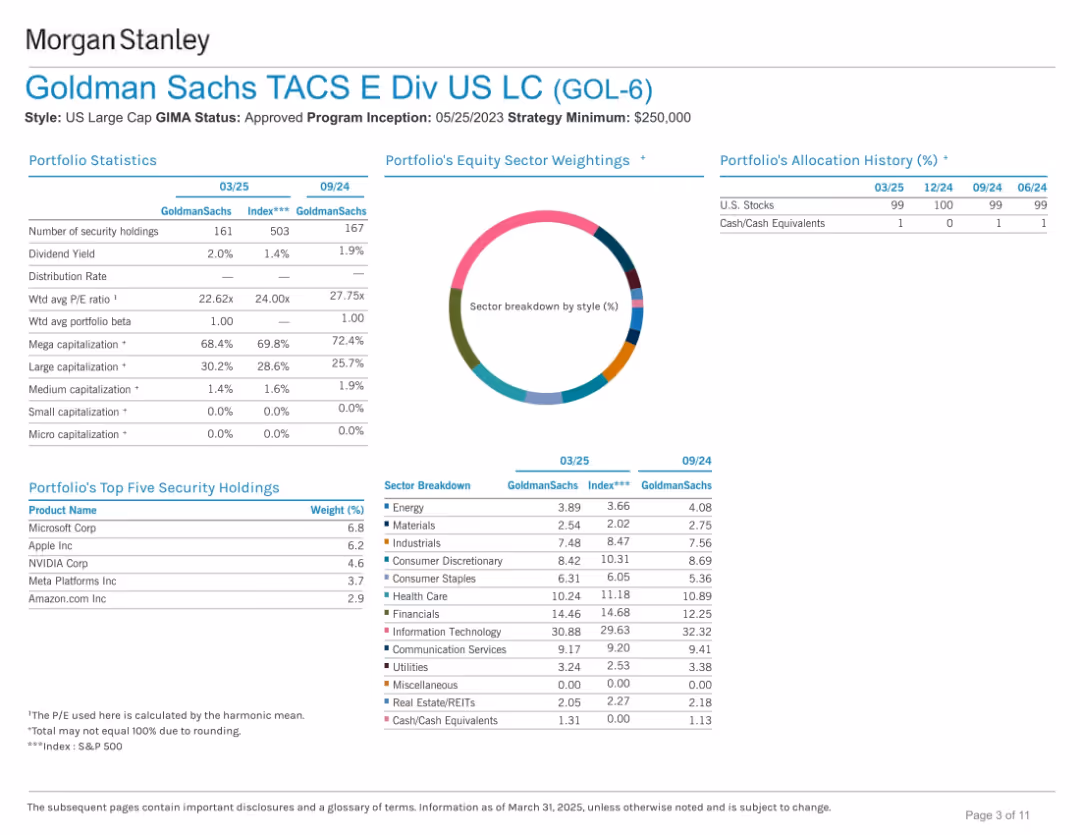
Structured dashboard layout: tables with portfolio stats, sector weighting donut chart, top holdings, and historical allocation. White background, organized layout.
Investment Analysis
Financial Services
This portfolio overview slide summarizes key statistics such as sector exposure, top holdings, and capitalization. It compares current and projected allocations, and sector weights across two quarters. Emphasis is on mega-cap equity exposure and dividend yield.
portfolio, equity, sector allocation, Goldman Sachs, US large cap, holdings, diversification, yield
false
Investment Analysis
Financial Services
Mixed Chart
Goldman Sachs
Add to my slides
Remove from favorites
The slide includes a column chart and other graphical elements to show the projected growth of balances and changes in net interest margin. It uses a straightforward layout with clear labeling and a cohesive color scheme to aid in the understanding of projected financial outcomes.
Strategic Planning
Financial Services
Details strategies for growing balances and optimizing the portfolio mix to enhance financial margins, emphasizing adaptations to new pricing strategies and funding costs.
portfolio growth, financial margins, pricing strategy, net interest
false
Strategic Planning
Financial Services
Mixed Chart
Barclays
Add to my slides
Remove from favorites
Previous
Next
You don't have any favorites yet.
Please wait loading your favorites slides...
Create a FREE account to continue browsing
Receive Instant Access to 1,000+ slides from companies like McKinsey, Google, and Goldman Sachs
First Name
Last Name
Email
Password
I agree to all
Terms & Privacy Policy
Thank you! Your submission has been received!
Oops! Something went wrong while submitting the form.
Have an account?
Sign in
Upgrade to PRO to Save slides
Advanced Search and Filters
Access to 15,000+ slides
Access to Category Pages
Save/Bookmark Slides
PowerPoint Template Library
Pick a Plan
MONTHLY
$12/month
Billed every month, Cancel anytime.
YEARLY
$9/year
Billed $108 annually, Cancel anytime.
Checkout for $12/month
Checkout for $108/yr
Secured by Stripe | AES-256 bit encryption