My Account
My Slides
Search by Category
Pricing
Templates
View All Templates
Download Template Slides
✦ AI Search
Feedback
Login
Logout
Get Started
Browse all Slides
Browse all Slides
Create a FREE Account
Instant access to 1,000+ real slides from top companies like McKinsey, BCG, Goldman Sachs, Google and many more!
First Name
Last Name
Email
Password
I agree to all
Terms & Privacy Policy
Thank you! Your submission has been received!
Oops! Something went wrong while submitting the form.
Have an account?
Sign in
Saved Slides
Total No. of slides saved
0
↻ Refresh
✖ Clear all
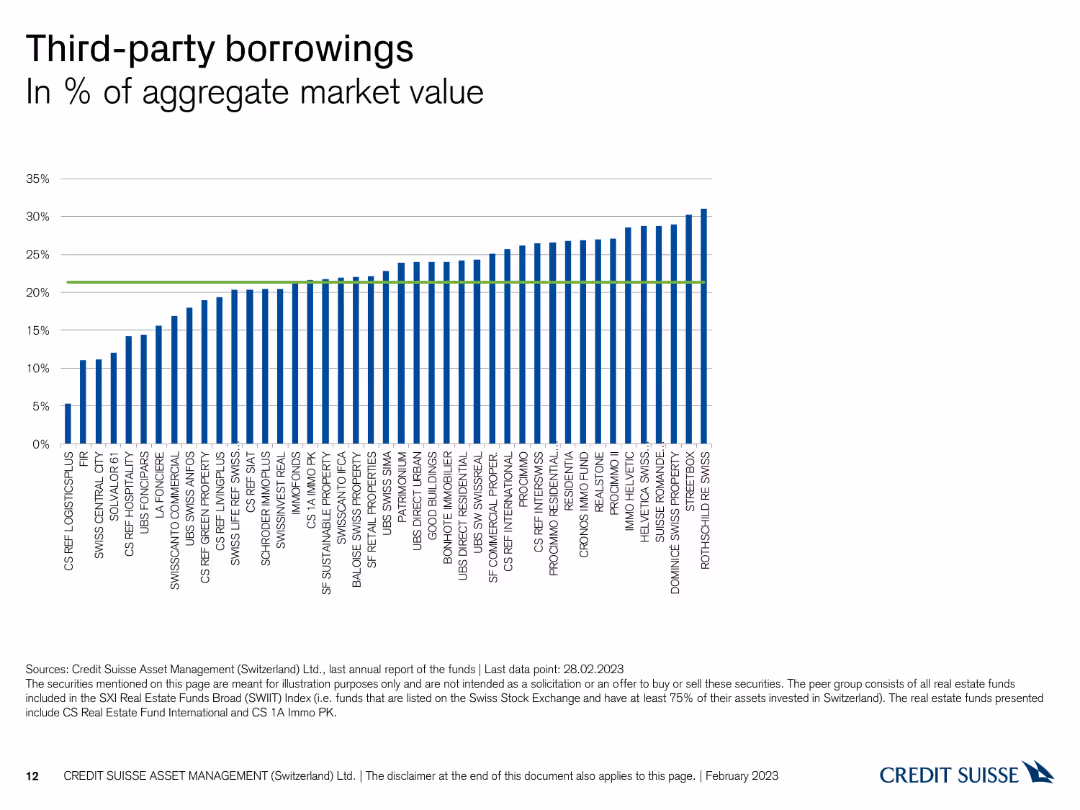
This slide displays a column chart showing third-party borrowings as a percentage of aggregate market value for different Swiss real estate funds, with a green reference line for comparison.
Financial Performance
Real Estate & Construction
The slide illustrates the level of third-party borrowings among Swiss real estate funds, indicating their leverage. It is used for assessing financial risk and leverage ratios of funds.
Real estate, borrowings, market value, leverage, comparison
false
Financial Performance
Real Estate & Construction
Single Chart
Credit Suisse
Add to my slides
Remove from favorites
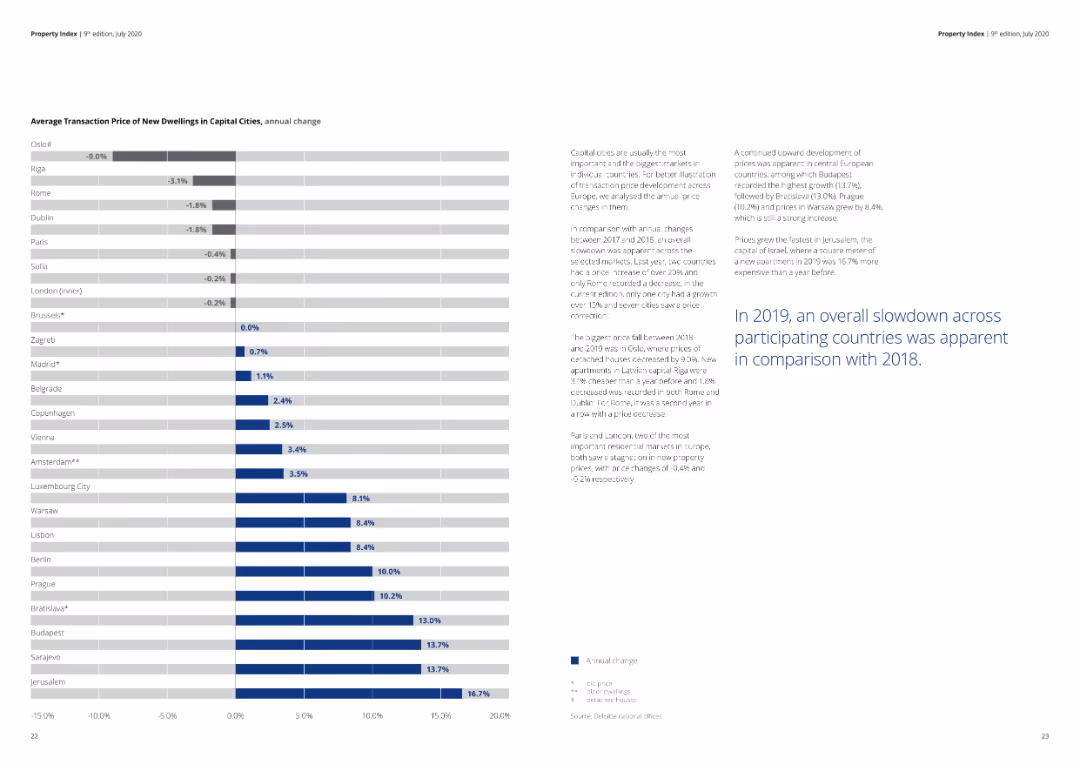
A detailed column chart illustrating the average transaction prices and annual changes in capital cities.
Market Analysis and Trends
Real Estate & Construction
The slide shows the average transaction prices and their annual change for new dwellings in various capital cities, indicating market trends.
real estate, capital cities, housing prices, transaction, annual change, market analysis
false
Market Analysis and Trends
Real Estate & Construction
Mixed Chart
Deloitte
Add to my slides
Remove from favorites
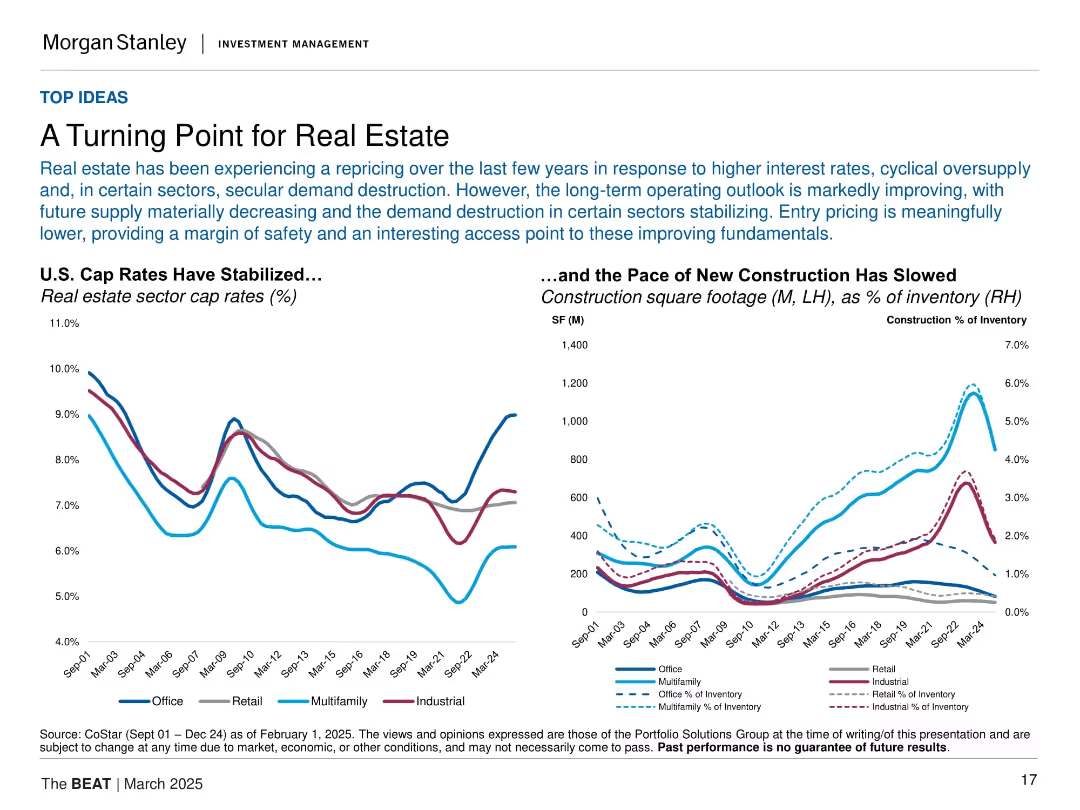
Split into two main chart sections with titles. Left chart shows sector cap rates over time; right chart shows construction volume and inventory percentages. Uses multi-color lines and dotted indicators, clean layout.
Market Analysis and Trends
Real Estate & Construction
The slide argues that real estate may be stabilizing after repricing due to rising rates and oversupply. It highlights falling construction rates and stabilized cap rates, suggesting an improving fundamental outlook and favorable entry points for investment.
real estate, cap rates, construction slowdown, inventory, pricing, investment outlook, commercial property, macroeconomic effects, U.S. real estate
false
Market Analysis and Trends
Real Estate & Construction
Multiple Chart
Morgan Stanley
Add to my slides
Remove from favorites
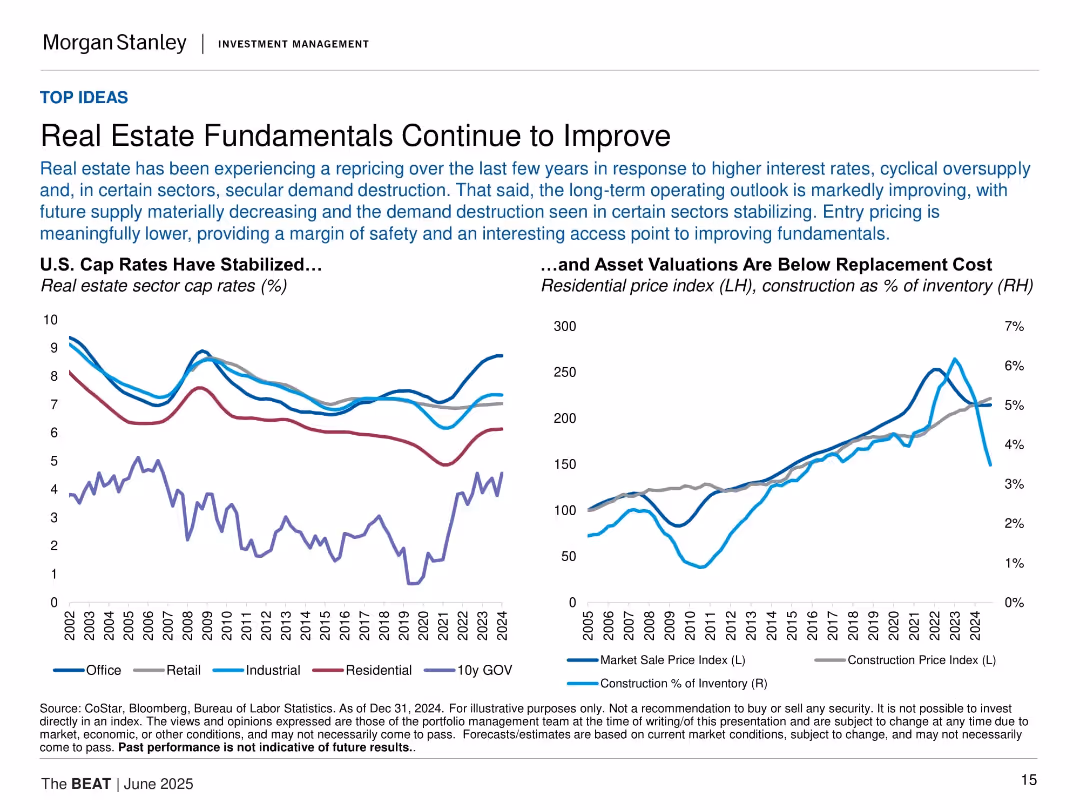
Two line charts: one for cap rates by sector, another for price and construction metrics; stylized and dual-axis.
Market Analysis and Trends
Real Estate & Construction
This slide describes improving real estate fundamentals due to pricing adjustments and shrinking supply. It includes charts on sector cap rates and residential asset valuations compared to replacement cost metrics.
real estate, cap rates, pricing, supply, valuation, fundamentals, market sale index, construction, investment
false
Market Analysis and Trends
Real Estate & Construction
Multiple Chart
Morgan Stanley
Add to my slides
Remove from favorites
The slide includes a large pie chart in two shades of blue, with segments labeled with percentages and real estate sectors, and a smaller pie chart. There's a bulleted list to the left.
Financial Performance
Real Estate & Construction
This slide showcases CEREIT's asset allocation in different real estate sectors, emphasizing the proportion of light industrial/logistics acquisitions. It serves to illustrate the strategic direction towards logistics and asset diversification as well as investment performance.
Real Estate, CEREIT, Portfolio, Acquisition, Industrial, Logistics, Investment, Asset Allocation, Performance
false
Financial Performance
Real Estate & Construction
Mixed Chart
Morgan Stanley
Add to my slides
Remove from favorites
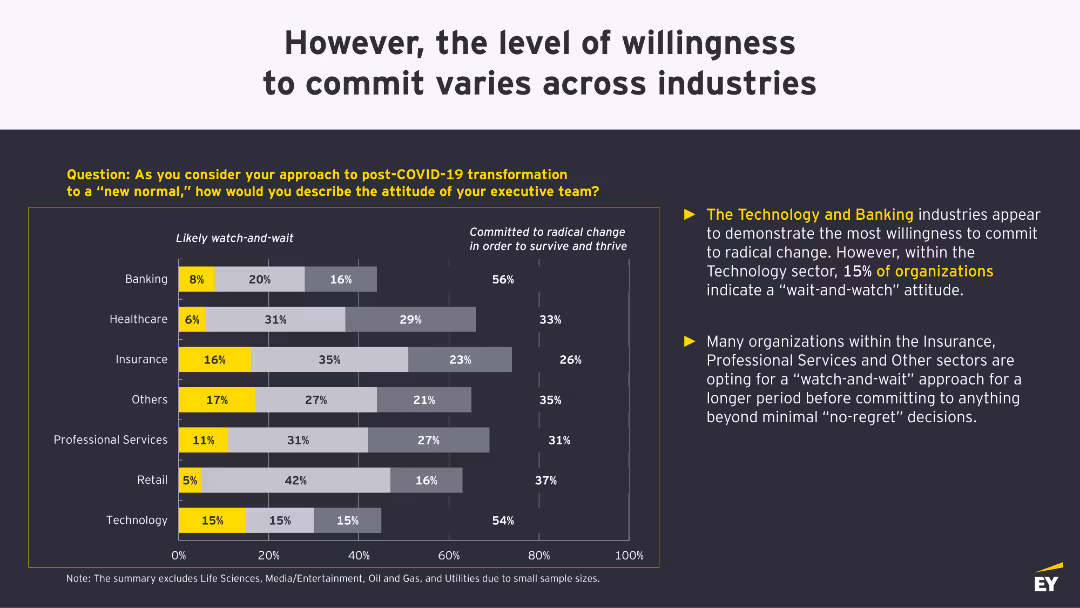
The slide presents a pie chart and bar charts, showing planned changes in workplace real estate strategies post-COVID-19, with a focus on different areas such as redesigning offices and measuring remote work productivity.
Market Analysis and Trends
Real Estate & Construction
The slide details how employers plan to change their workplace real estate strategies post-COVID-19, emphasizing the need to redesign offices, measure remote work productivity, and give employees choice in remote vs. in-office work.
real estate, changes, COVID-19, workplace, strategies
false
Market Analysis and Trends
Real Estate & Construction
Mixed Chart
EY
Add to my slides
Remove from favorites
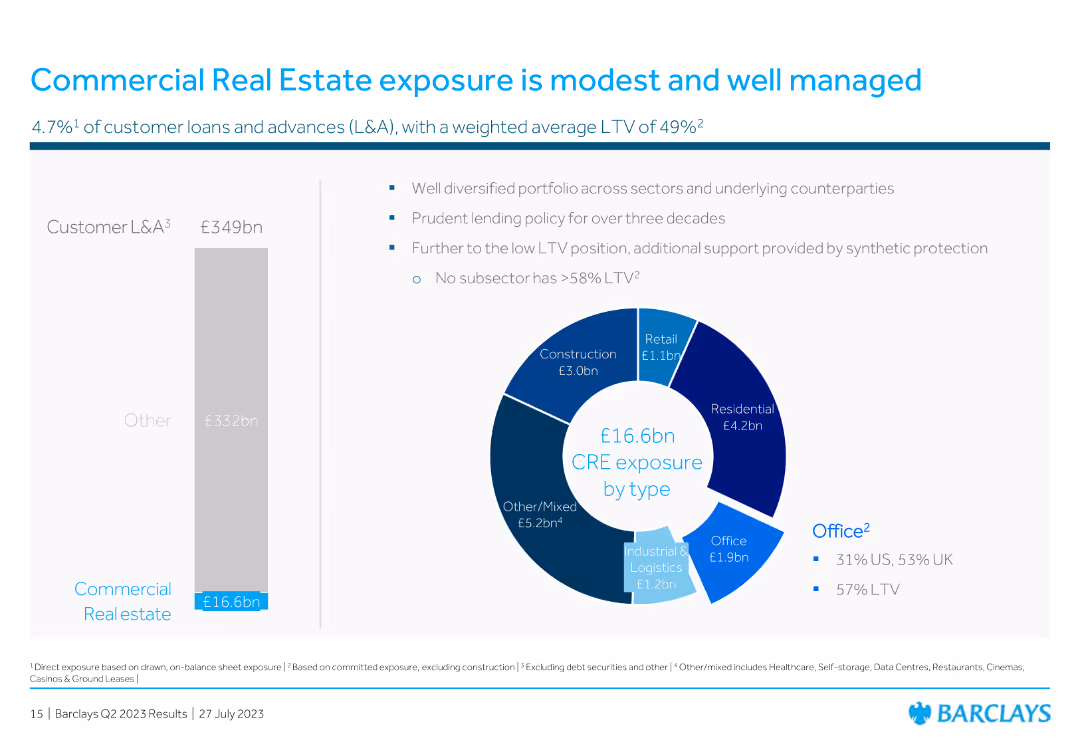
The slide features a pie chart showing exposure by type within the commercial real estate sector and a bar chart on customer loans.
Risk Assessment and Management
Real Estate & Construction
This slide details the exposure to commercial real estate, demonstrating a modest and well-managed portfolio with specific breakdowns by property type and average LTV.
real estate, commercial, exposure, loans, LTV, portfolio, financial, pie chart, bar chart, management
false
Risk Assessment and Management
Real Estate & Construction
Multiple Chart
Barclays
Add to my slides
Remove from favorites
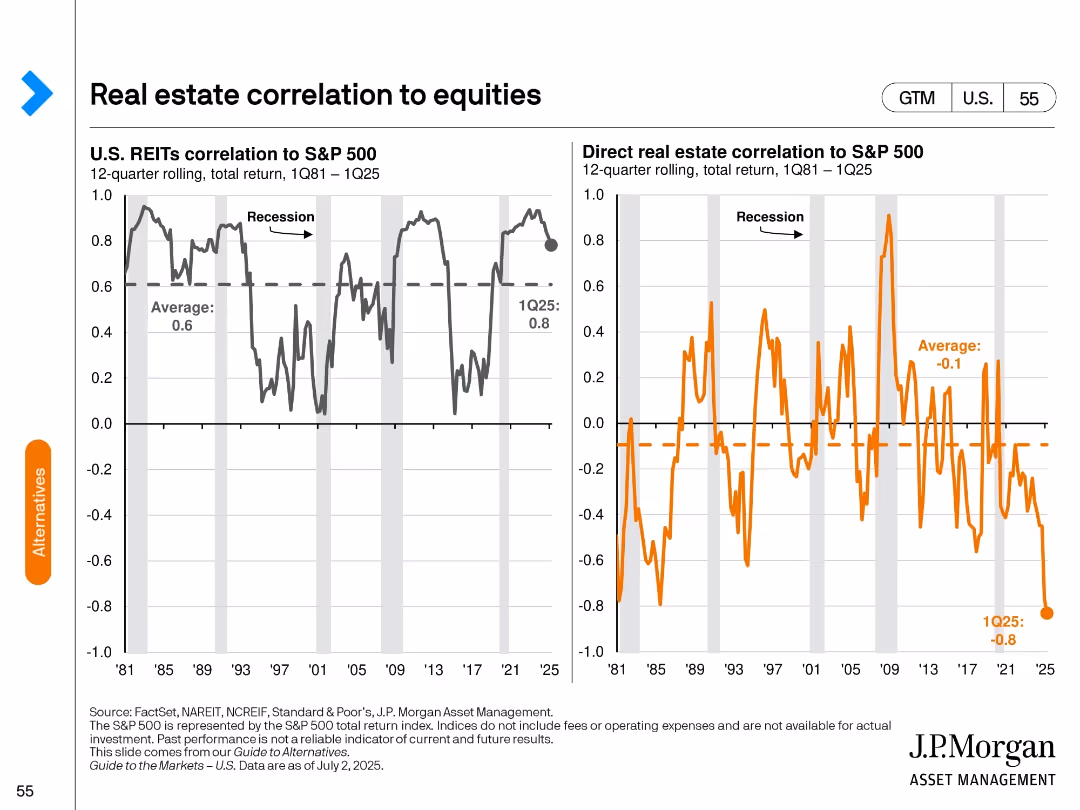
Two line charts: Left—U.S. REITs vs. S&P 500; Right—Direct real estate vs. S&P 500; showing 12-quarter rolling correlations.
Risk Assessment and Management
Real Estate & Construction
Highlights the correlation between real estate (REITs and direct) and equities over time. Emphasizes the low or negative correlation of direct real estate, with implications for diversification in portfolios.
real estate, correlation, REITs, diversification, equity market, risk management
false
Risk Assessment and Management
Real Estate & Construction
Multiple Chart
JP Morgan
Add to my slides
Remove from favorites
Features pie charts and column charts analyzing commercial real estate loan risk and modifications.
Market Analysis and Trends
Real Estate & Construction
Provides a detailed look at commercial real estate loan risks and modifications over recent quarters, useful for risk assessment in real estate finance.
real estate, CRE, loan risk, market analysis, modifications
false
Market Analysis and Trends
Real Estate & Construction
Multiple Chart
Deutsche Bank
Add to my slides
Remove from favorites
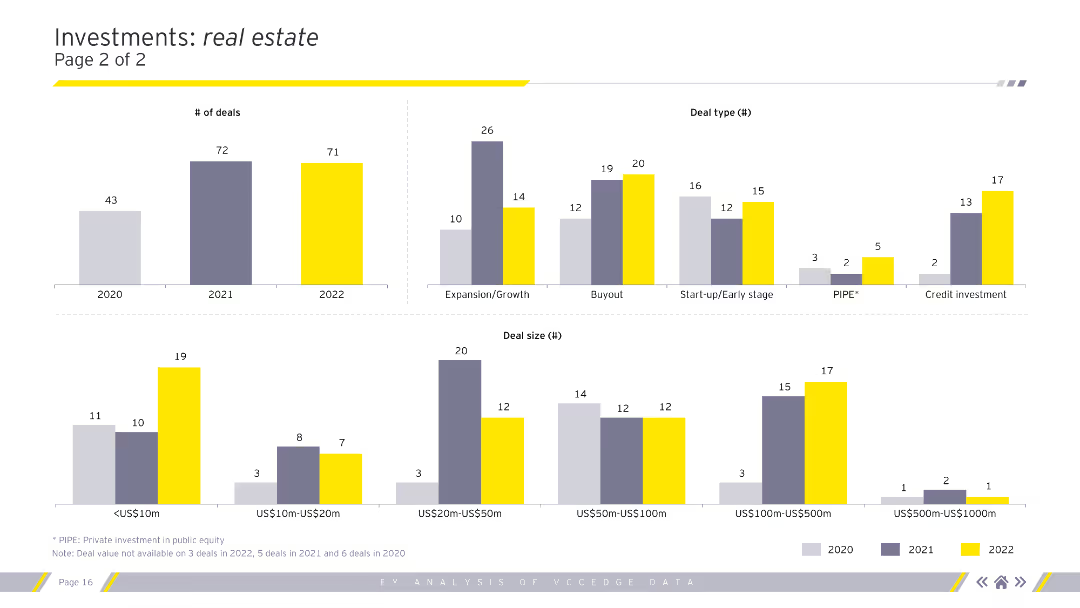
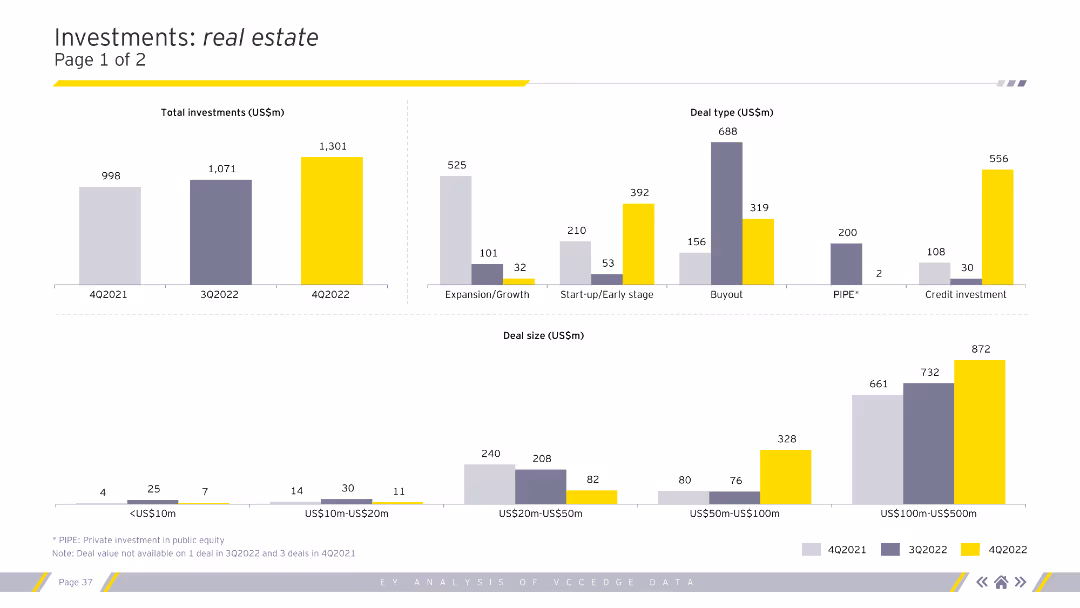
Column charts showing the number of deals, deal types, and deal sizes in the real estate sector for 2020-2022.
Market Analysis and Trends
Real Estate & Construction
Continued analysis of investment types, sizes, and segments within the real estate sector.
real estate, deals, deal types, deal sizes, analysis
false
Market Analysis and Trends
Real Estate & Construction
Multiple Chart
EY
Add to my slides
Remove from favorites
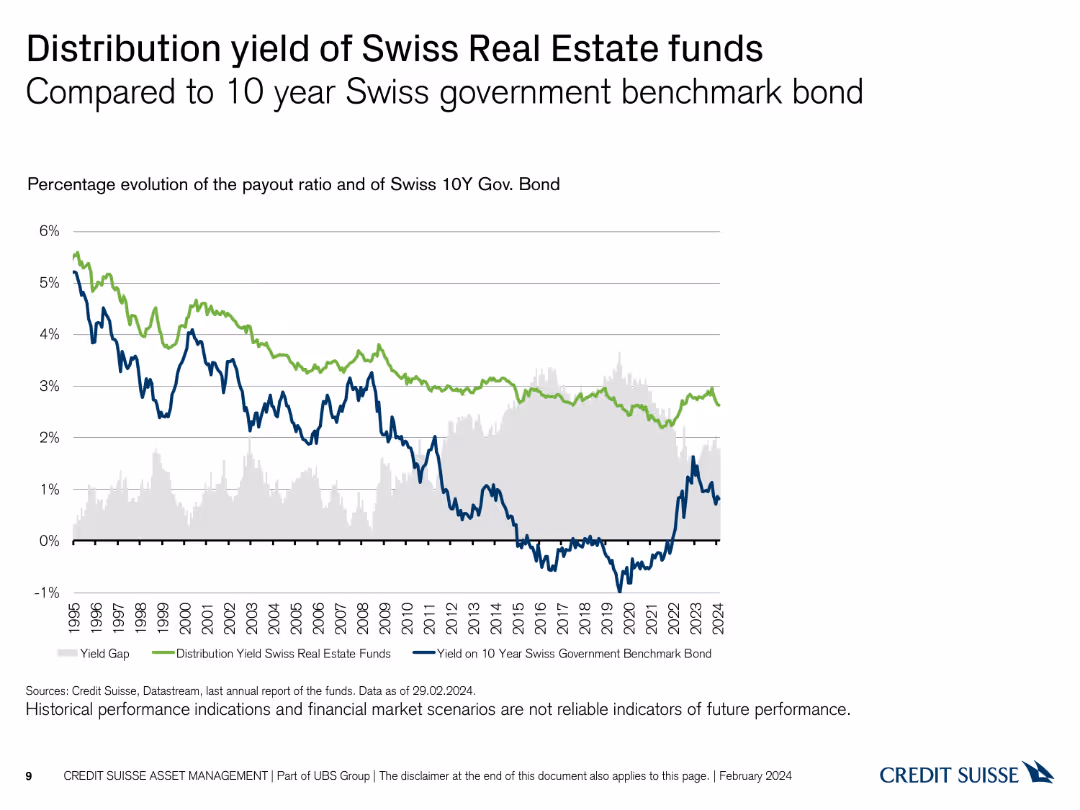
Line chart comparing the payout ratio and Swiss 10-year government bond yield.
Financial Performance
Real Estate & Construction
Analyzes the distribution yield of Swiss real estate funds relative to the 10-year Swiss government bond yield.
real estate, distribution yield, government bond, comparison
false
Financial Performance
Real Estate & Construction
Single Chart
Credit Suisse
Add to my slides
Remove from favorites
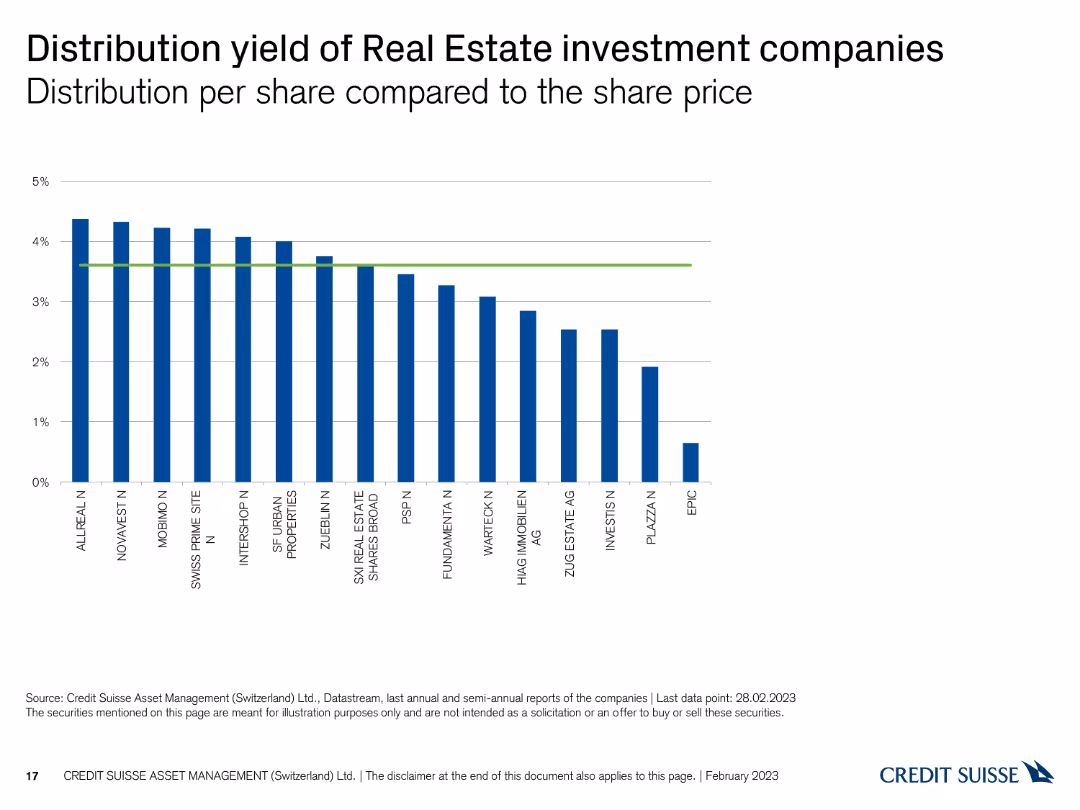
This slide displays a column chart showing the distribution yield per share for Swiss real estate investment companies, with vertical bars representing yield percentages and a green reference line.
Financial Performance
Real Estate & Construction
The slide presents the distribution yields of real estate investment companies, comparing their returns. It is used for evaluating income potential and investment performance.
Real estate, distribution yield, investment companies, returns, comparison
false
Financial Performance
Real Estate & Construction
Single Chart
Credit Suisse
Add to my slides
Remove from favorites
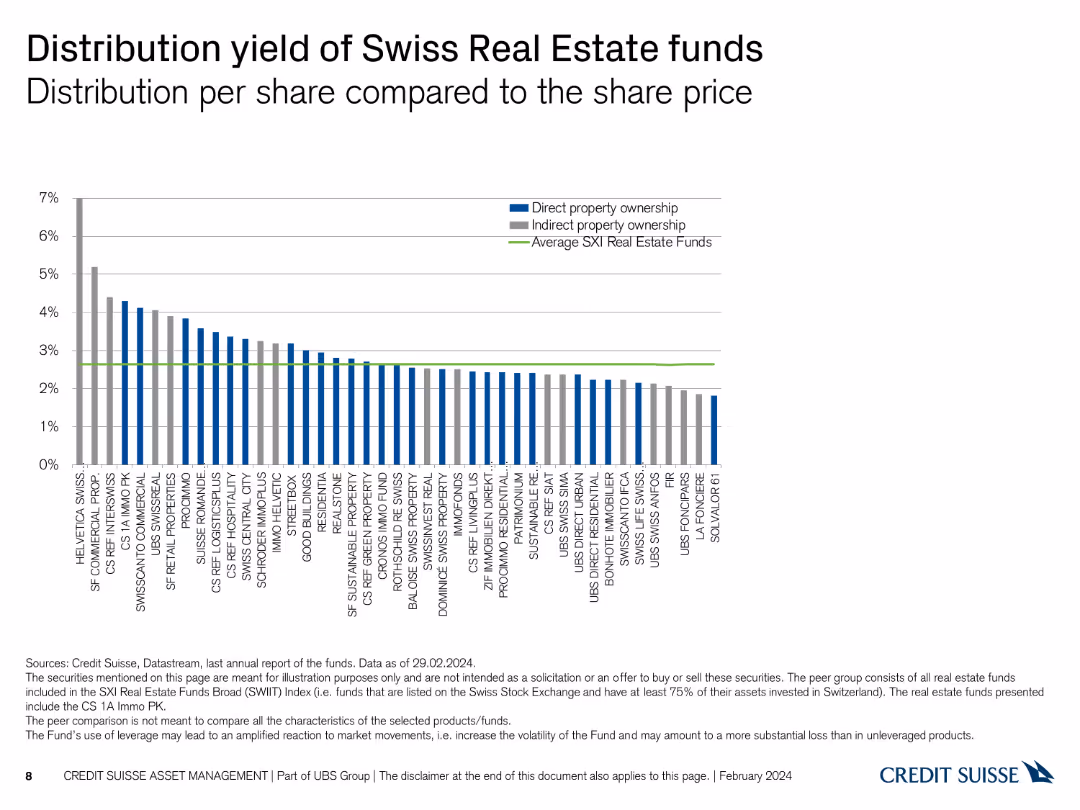
Column chart comparing distribution yields per share with share prices across Swiss real estate funds.
Financial Performance
Real Estate & Construction
Compares the distribution yield per share with the share prices of various Swiss real estate funds.
real estate, distribution yield, share price, comparison, funds
false
Financial Performance
Real Estate & Construction
Single Chart
Credit Suisse
Add to my slides
Remove from favorites
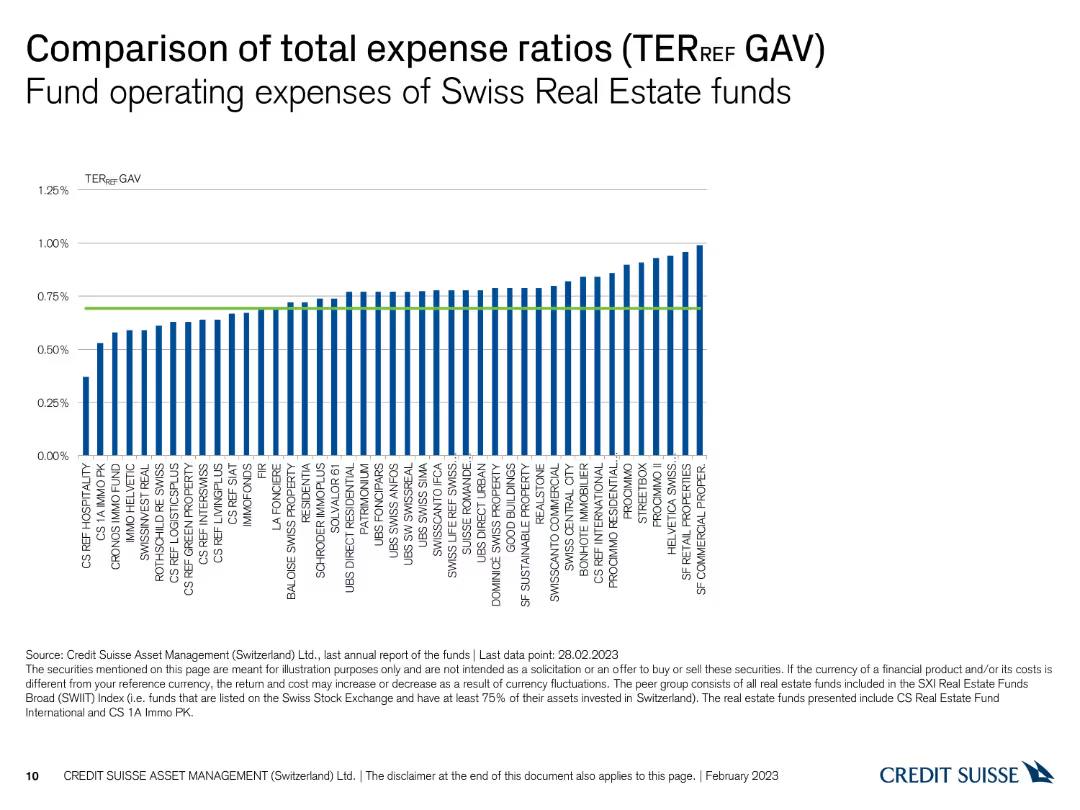
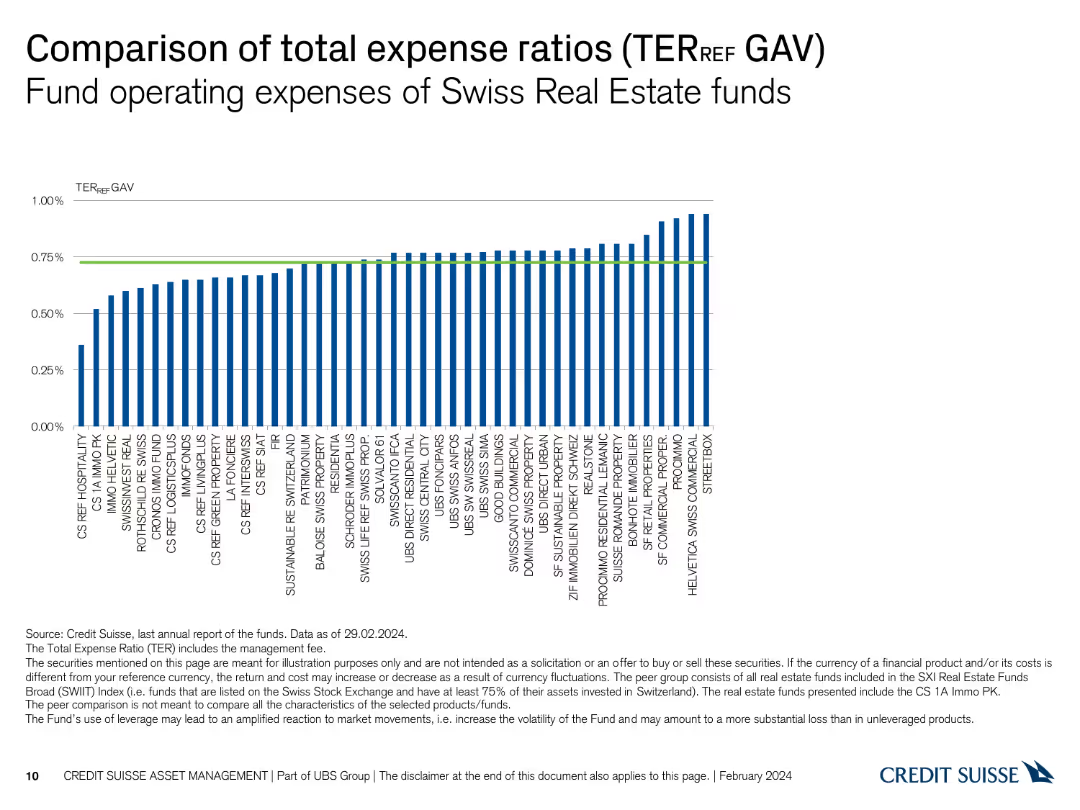
This slide contains a column chart comparing the total expense ratios (TER) of various Swiss real estate funds. The chart has vertical bars representing different funds, with a green horizontal line for reference.
Financial Performance
Real Estate & Construction
The slide shows the fund operating expenses for Swiss real estate funds, helping to analyze cost efficiency across different funds. It is used for evaluating and comparing fund performance.
Real estate, expense ratios, funds, TER, comparison
false
Financial Performance
Real Estate & Construction
Single Chart
Credit Suisse
Add to my slides
Remove from favorites
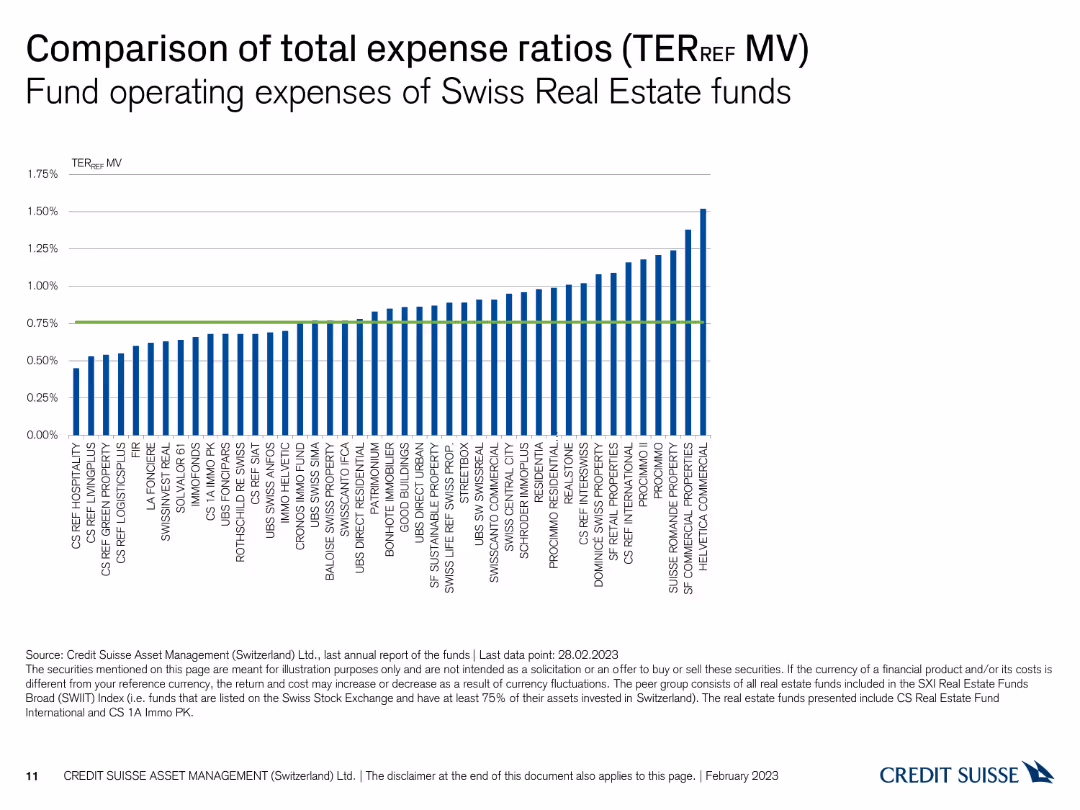
This slide features a column chart illustrating the total expense ratios (TER) for Swiss real estate funds, with vertical bars representing different funds and a green reference line.
Financial Performance
Real Estate & Construction
The slide presents operating expenses for Swiss real estate funds based on TER_REF MV, aiding in cost comparison among various funds. It is useful for performance evaluation and benchmarking.
Real estate, expense ratios, funds, TER, comparison
false
Financial Performance
Real Estate & Construction
Single Chart
Credit Suisse
Add to my slides
Remove from favorites
Column chart comparing total expense ratios (TER) for various Swiss real estate funds.
Financial Performance
Real Estate & Construction
Compares the total expense ratios (TER) for different Swiss real estate funds, showing operational expenses.
real estate, expense ratios, TER, operational expenses, comparison
false
Financial Performance
Real Estate & Construction
Single Chart
Credit Suisse
Add to my slides
Remove from favorites
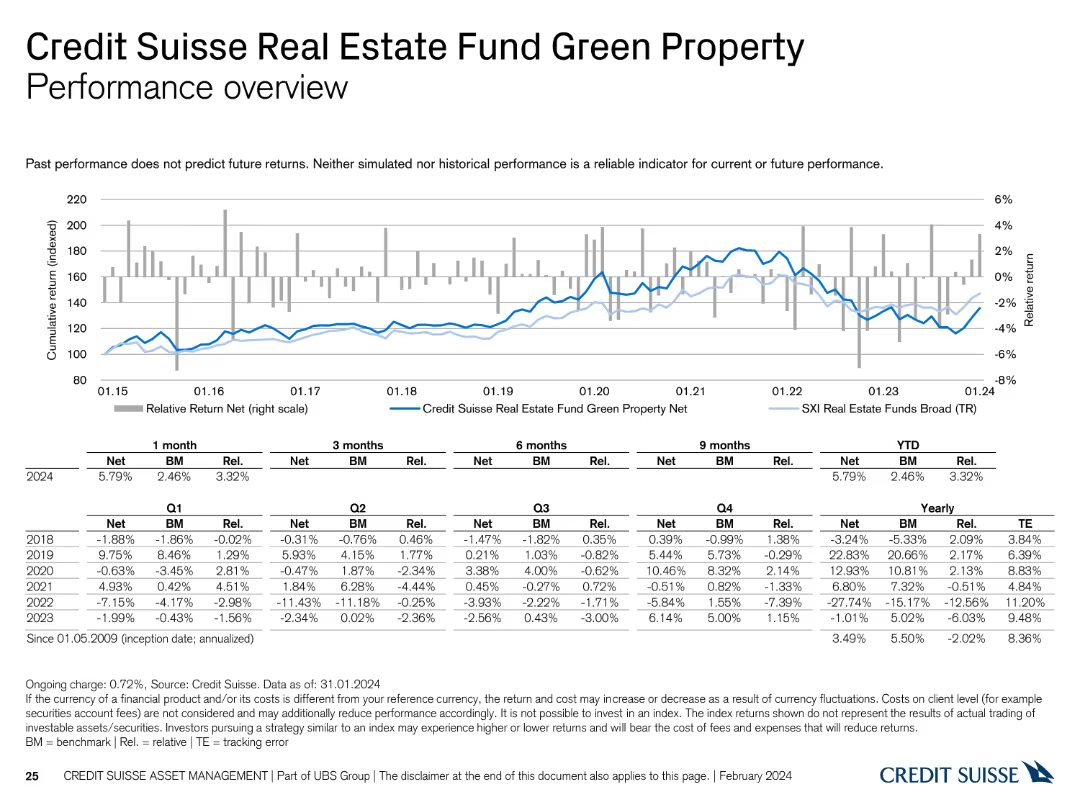
The slide displays a line chart illustrating the performance of the Credit Suisse Real Estate Fund Green Property from 2015 to 2024, with tables showing detailed return metrics.
Financial Performance
Real Estate & Construction
This slide analyzes the performance of the Credit Suisse Real Estate Fund Green Property, providing comprehensive return data over different timeframes.
real estate fund, Green Property, performance, returns, Credit Suisse
false
Financial Performance
Real Estate & Construction
Mixed Chart
Credit Suisse
Add to my slides
Remove from favorites
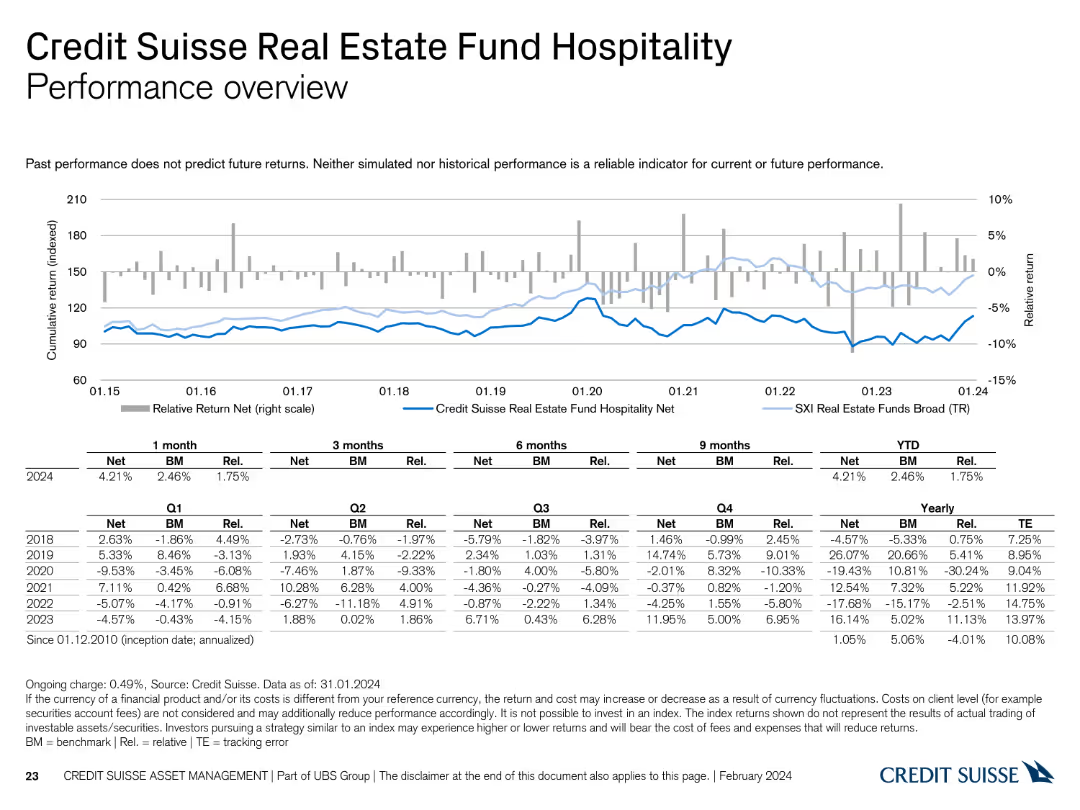
The slide features a line chart showing the performance of the Credit Suisse Real Estate Fund Hospitality from 2015 to 2024, with tables detailing returns over different periods.
Financial Performance
Real Estate & Construction
This slide reviews the performance of the Credit Suisse Real Estate Fund Hospitality, providing detailed return data over various periods.
real estate fund, hospitality, performance, returns, Credit Suisse
false
Financial Performance
Real Estate & Construction
Mixed Chart
Credit Suisse
Add to my slides
Remove from favorites
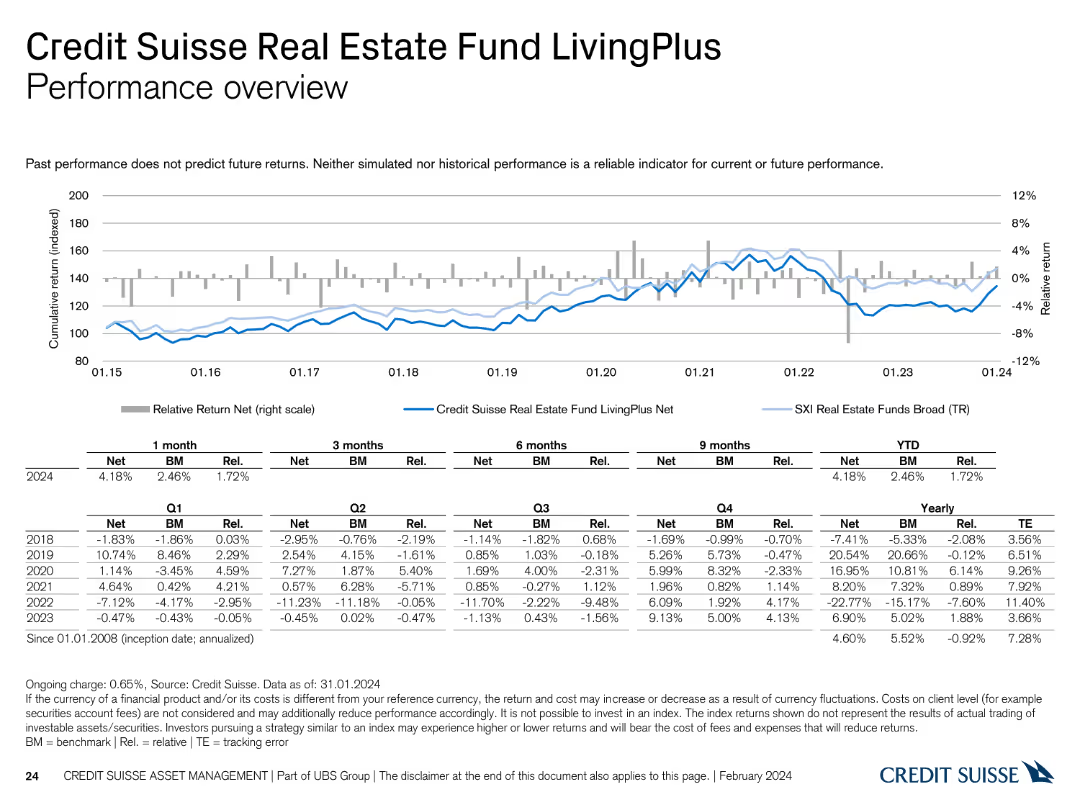
The slide includes a line chart showing the performance of the Credit Suisse Real Estate Fund LivingPlus from 2015 to 2024, accompanied by tables with return data.
Financial Performance
Real Estate & Construction
This slide evaluates the performance of the Credit Suisse Real Estate Fund LivingPlus, offering detailed return figures across multiple periods.
real estate fund, LivingPlus, performance, returns, Credit Suisse
false
Financial Performance
Real Estate & Construction
Mixed Chart
Credit Suisse
Add to my slides
Remove from favorites
The slide features two column charts side by side. The left chart displays year-on-year house prices for Australia, Sydney, and Melbourne, while the right chart shows auction clearance rates and house prices as a 3-month moving average. It has a moderate level of visual complexity.
Market Analysis and Trends
Real Estate & Construction
The slide analyzes trends in residential real estate prices in Australia, comparing house prices in Australia, Sydney, and Melbourne over time. It also examines auction clearance rates.
Real estate, house prices, auction rates, Australia, Sydney, Melbourne, trends, data analysis
false
Market Analysis and Trends
Real Estate & Construction
Multiple Chart
JP Morgan
Add to my slides
Remove from favorites
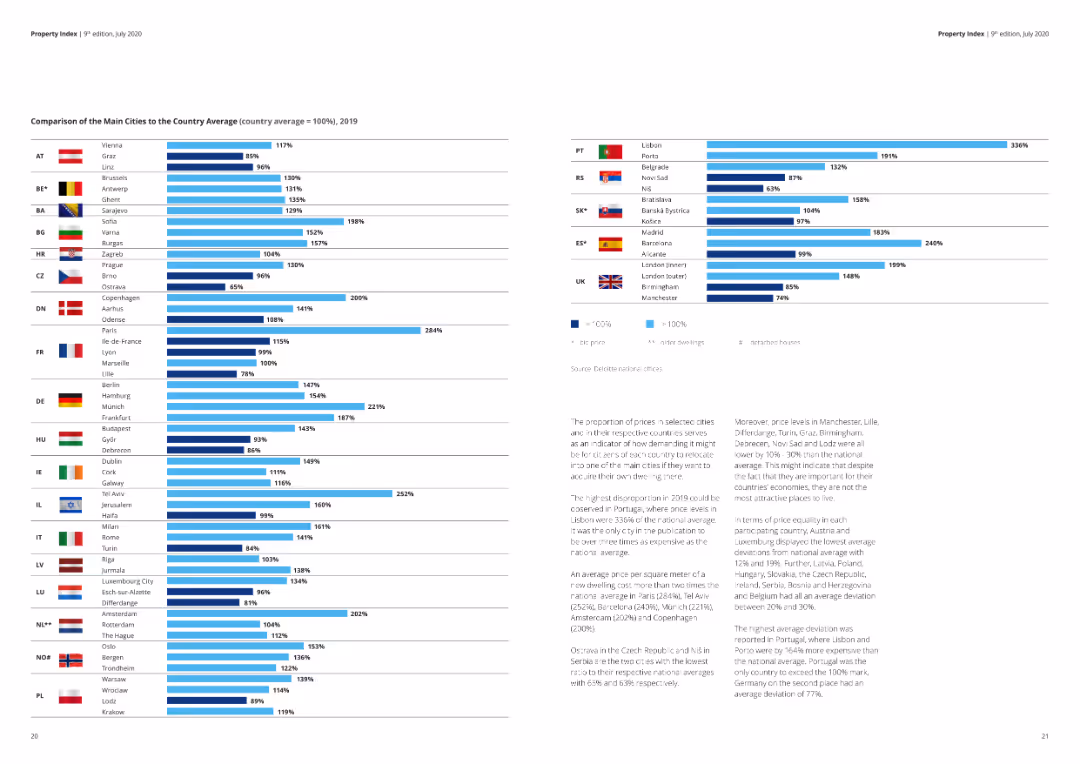
A column chart comparing the main cities' average transaction prices to the country average in 2019.
Market Analysis and Trends
Real Estate & Construction
This slide compares the average housing prices in main cities to their respective country averages, highlighting significant disparities.
real estate, housing prices, city comparison, country average, market trends, 2019
false
Market Analysis and Trends
Real Estate & Construction
Multiple Chart
Deloitte
Add to my slides
Remove from favorites
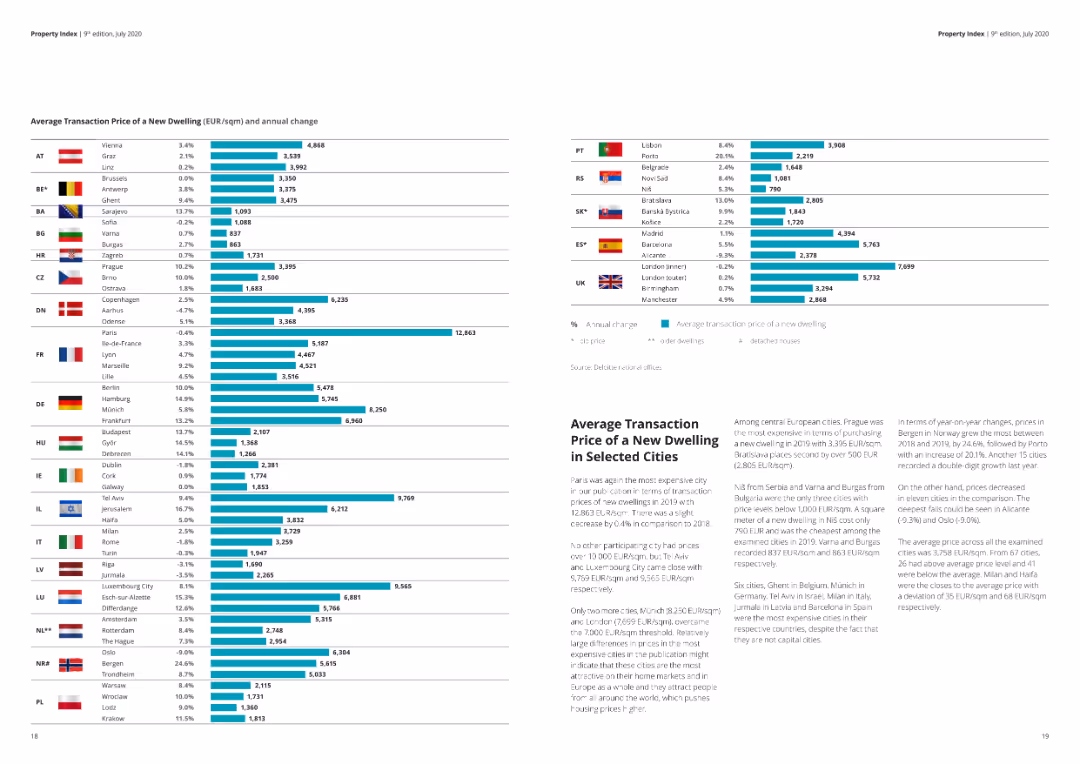
A detailed column chart showing average transaction prices of new dwellings across various cities, including percentage changes.
Market Analysis and Trends
Real Estate & Construction
The slide presents average transaction prices and annual changes for new dwellings in different cities. Useful for market comparison.
Real estate, housing prices, transaction, cities, market analysis, annual change
false
Market Analysis and Trends
Real Estate & Construction
Multiple Chart
Deloitte
Add to my slides
Remove from favorites
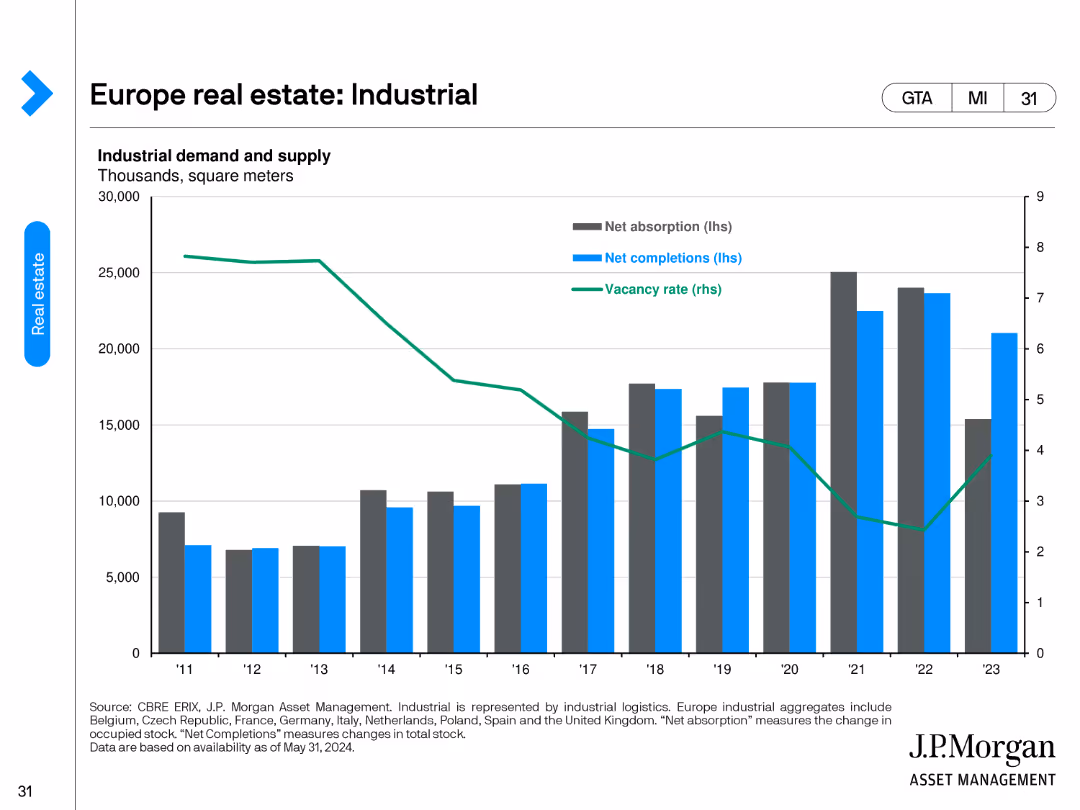
The slide includes a column chart showing net absorption, net completions, and vacancy rate trends in thousands of square meters for industrial demand.
Market Analysis and Trends
Real Estate & Construction
It examines industrial demand and supply metrics, illustrating trends in net absorption, net completions, and vacancy rates, useful for market trends.
real estate, industrial, demand, supply, net absorption, completions, vacancy rate, trends
false
Market Analysis and Trends
Real Estate & Construction
Single Chart
JP Morgan
Add to my slides
Remove from favorites
Features pie charts and bullet points detailing real estate investment distributions by type and region. Clean and structured layout with annotations.
Investment Analysis
Real Estate & Construction
Discusses the real estate portfolio's distribution and risk, useful for investment analysis and decision-making in real estate.
real estate, investment, risk analysis, portfolio distribution, CRE
false
Investment Analysis
Real Estate & Construction
Multiple Chart
Deutsche Bank
Add to my slides
Remove from favorites
The slide features column charts displaying total investments, deal types, and deal sizes within the real estate sector across different quarters. The charts use distinct colors to differentiate quarters.
Market Analysis and Trends
Financial Services
This slide focuses on real estate investments, providing detailed information on total invested amounts, types of deals, and sizes, essential for analyzing real estate investment trends.
Real estate, investments, deal types, deal sizes
false
Market Analysis and Trends
Financial Services
Multiple Chart
EY
Add to my slides
Remove from favorites
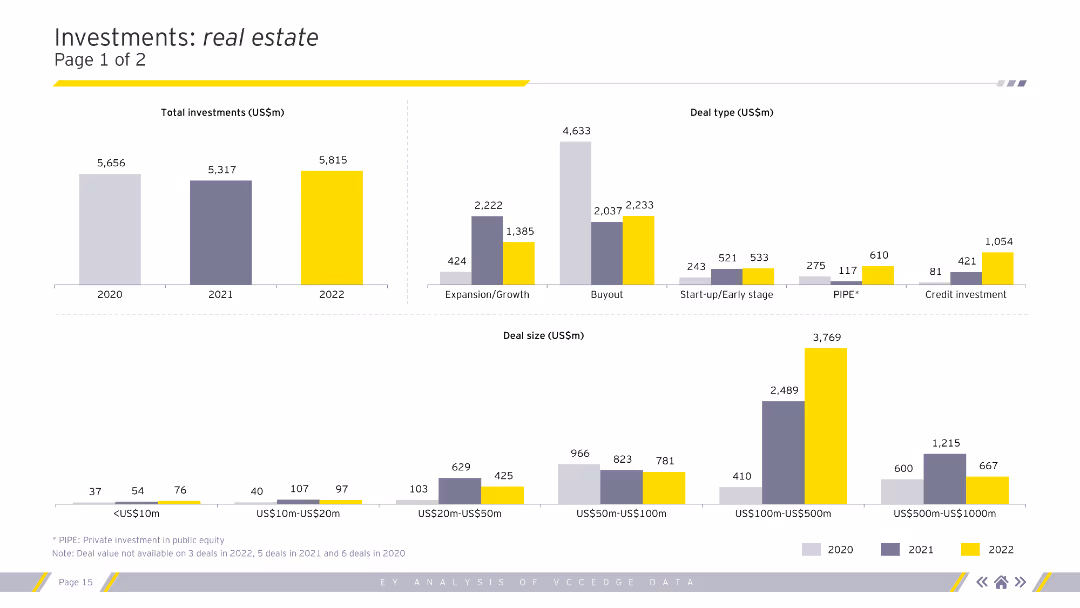
Column charts showing total investments, deal types, and deal sizes in the real estate sector for 2020-2022.
Market Analysis and Trends
Real Estate & Construction
Analysis of investment types, sizes, and segments within the real estate sector.
real estate, investments, deal types, deal sizes, analysis
false
Market Analysis and Trends
Real Estate & Construction
Multiple Chart
EY
Add to my slides
Remove from favorites
Detailed slide with several data blocks and graphs, including data metrics, and textual information.
Technology and Digital Transformation
Financial Services
The slide presents JPMorgan Chase's client solutions, focusing on real estate lending, housing, and payments with specific metrics and capabilities.
Real estate, lending, payments, solutions, client franchise, market opportunity, digital, banking, clients
false
Technology and Digital Transformation
Financial Services
Header Vertical
JP Morgan
Add to my slides
Remove from favorites
Pie chart and column chart displaying commercial real estate exposures and customer loan statistics.
Market Analysis and Trends
Real Estate & Construction
Evaluates commercial real estate exposure, focusing on loan distribution and LTV assessments.
real estate, loans, exposure, LTV, market analysis
false
Market Analysis and Trends
Real Estate & Construction
Multiple Chart
Barclays
Add to my slides
Remove from favorites
Features multiple pie charts and bullet points detailing aspects of the non-recourse real estate portfolio by region and type, such as APAC and US, and sector like office and retail.
Investment Analysis
Real Estate & Construction
Discusses the specifics of the commercial real estate loans, their distribution by region and type, and financial risk associated with them, particularly under stress conditions.
real estate, loans, risk, investment, CRE
false
Investment Analysis
Real Estate & Construction
Multiple Chart
Deutsche Bank
Add to my slides
Remove from favorites
Slide includes column chart for portfolio loans, pie charts for mortgage and construction balance by type. Clear and color-coded for easy comprehension.
Market Analysis and Trends
Real Estate & Construction
This slide analyzes the commercial real estate loan portfolio, showing trends in lending and the composition of loans by property type. Ideal for real estate market analysis and understanding sector-specific financial exposure.
Real Estate, Market, Trends, Finance, Loans
false
Market Analysis and Trends
Real Estate & Construction
Multiple Chart
Morgan Stanley
Add to my slides
Remove from favorites
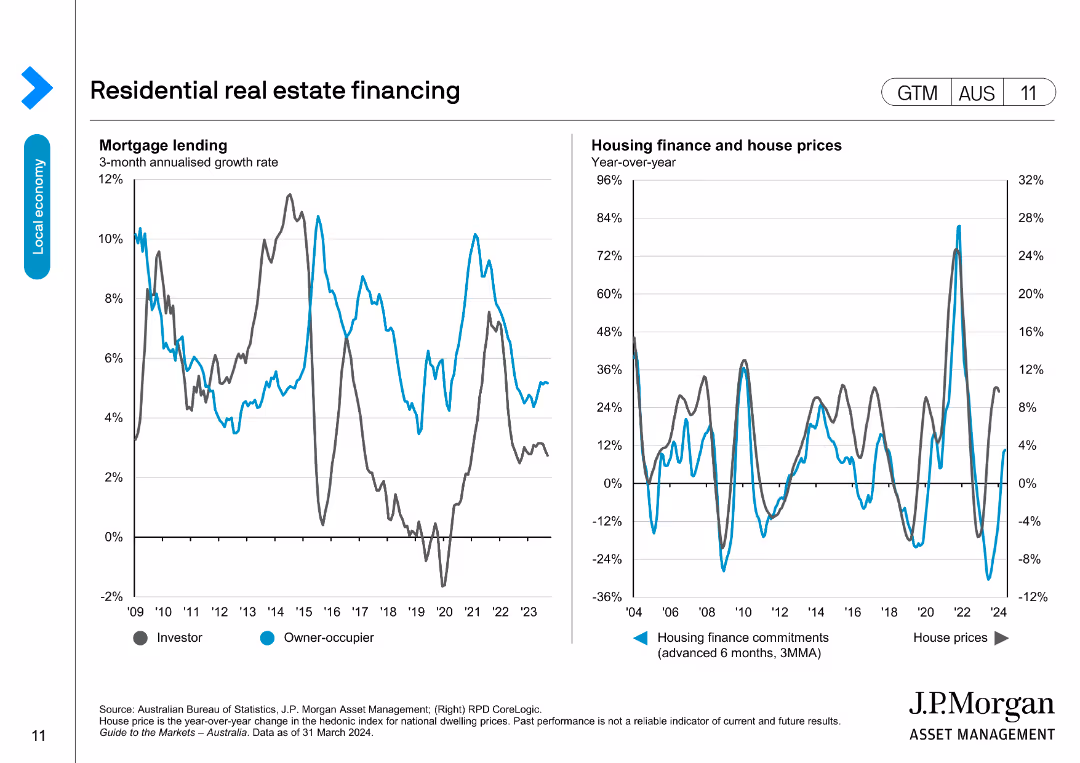
The slide presents two line charts: one on mortgage lending growth rates for investors and owner-occupiers, and the other on housing finance commitments and house prices.
Market Analysis and Trends
Real Estate & Construction
Analyzes trends in residential real estate financing, focusing on mortgage lending and housing finance metrics, useful for real estate market insights.
real estate, mortgage, housing finance, house prices, lending
false
Market Analysis and Trends
Real Estate & Construction
Multiple Chart
JP Morgan
Add to my slides
Remove from favorites
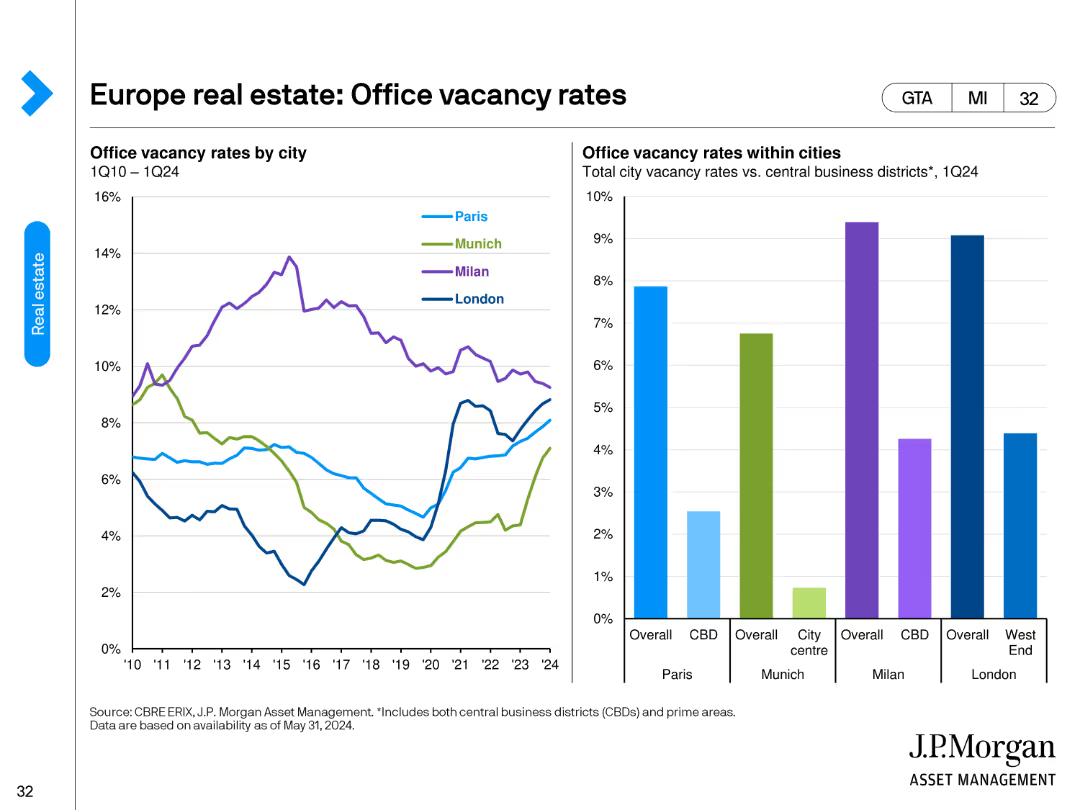
This slide features two column charts. The left chart shows office vacancy rates by city, and the right chart compares city center to CBD vacancy rates.
Market Analysis and Trends
Real Estate & Construction
It analyzes office vacancy rates in major European cities, highlighting differences between overall city and central business districts (CBD).
real estate, office, vacancy rates, city, CBD, Paris, Munich, Milan, London
false
Market Analysis and Trends
Real Estate & Construction
Multiple Chart
JP Morgan
Add to my slides
Remove from favorites
Slide with multiple data presentations including tables and icons on Manila vacancy rates and a new supply of real property. Also includes text sections on competitive landscape.
Investment Analysis
Real Estate & Construction
Analysis of the real estate market in the Philippines, focusing on vacancy rates, new developments, and investment opportunities in the sector.
real estate, Philippines, market, investment, vacancy
false
Investment Analysis
Real Estate & Construction
Table
Deloitte
Add to my slides
Remove from favorites
This slide has a map of Europe with highlighted countries, and to the left, a series of mini-tables with property details per country.
Market Analysis and Trends
Real Estate & Construction
The slide provides an overview of CEREIT's real estate portfolio by country in Europe as of a specific date. It is useful for analyzing geographical diversification, property valuation, and occupancy rates across various European markets.
Real Estate, Portfolio, Europe, Valuation, Occupancy, Yield, Diversification, Property, Country
false
Market Analysis and Trends
Real Estate & Construction
Graphic
Morgan Stanley
Add to my slides
Remove from favorites
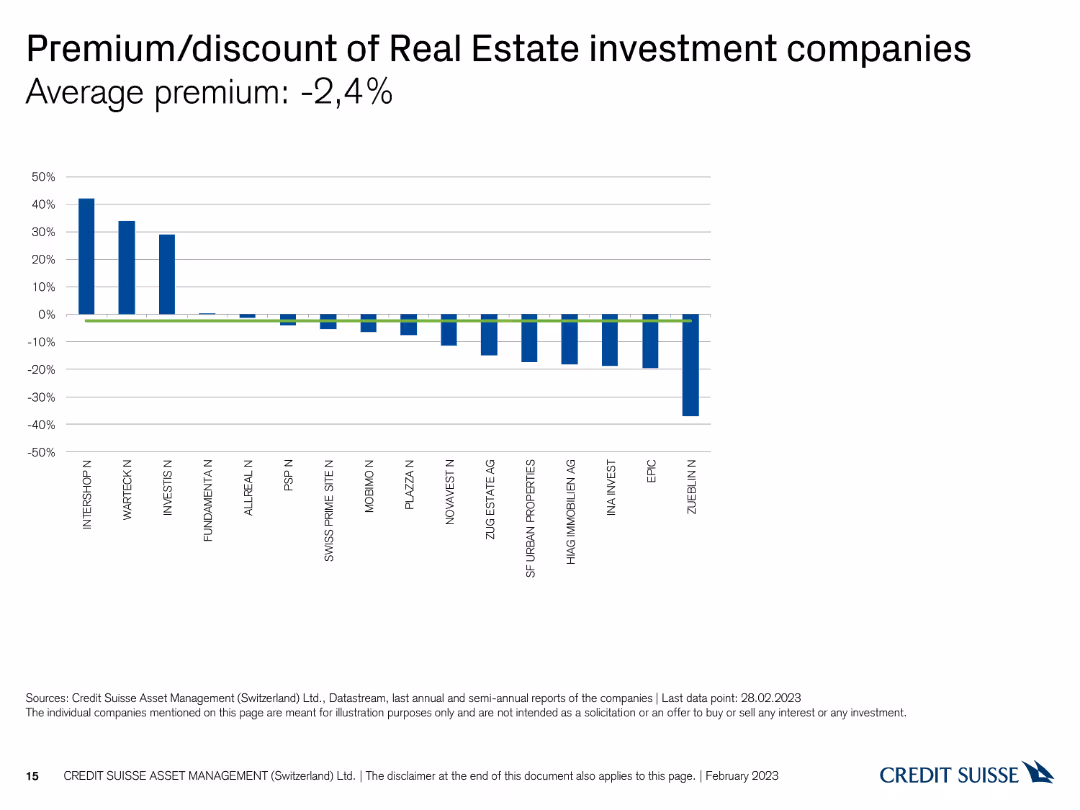
This slide contains a column chart depicting the premium or discount of Swiss real estate investment companies, with bars indicating the percentage difference from the average premium.
Financial Performance
Real Estate & Construction
The slide shows the average premium or discount for real estate investment companies, helping to assess market valuation trends. It is useful for investment analysis and valuation.
Real estate, premium, discount, valuation, comparison
false
Financial Performance
Real Estate & Construction
Single Chart
Credit Suisse
Add to my slides
Remove from favorites
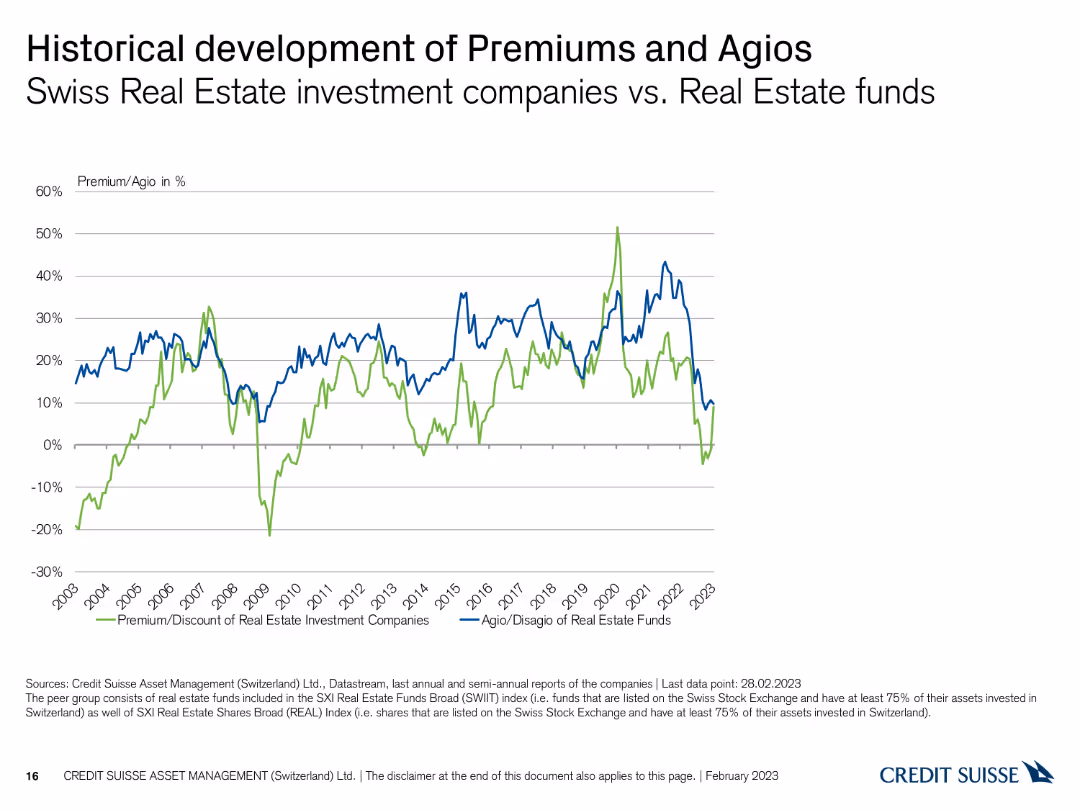
This slide features a line chart comparing the historical development of premiums and agios for Swiss real estate investment companies and funds from 2003 to 2023, with two lines in different colors.
Market Analysis and Trends
Real Estate & Construction
The slide tracks the historical trends of premiums and agios for real estate investments, providing insights into market performance over time. It is used for trend analysis and historical comparison.
Real estate, premiums, agios, historical trends, market performance
false
Market Analysis and Trends
Real Estate & Construction
Single Chart
Credit Suisse
Add to my slides
Remove from favorites
The slide features two column charts. The left chart shows global online retail sales, and the right chart displays retail real estate per capita by region.
Market Analysis and Trends
Real Estate & Construction
It compares global online retail sales percentages and retail real estate space per capita across different regions, useful for market analysis.
real estate, retail, global, online sales, per capita, region, North America, Asia Pacific, Europe
false
Market Analysis and Trends
Real Estate & Construction
Multiple Chart
JP Morgan
Add to my slides
Remove from favorites
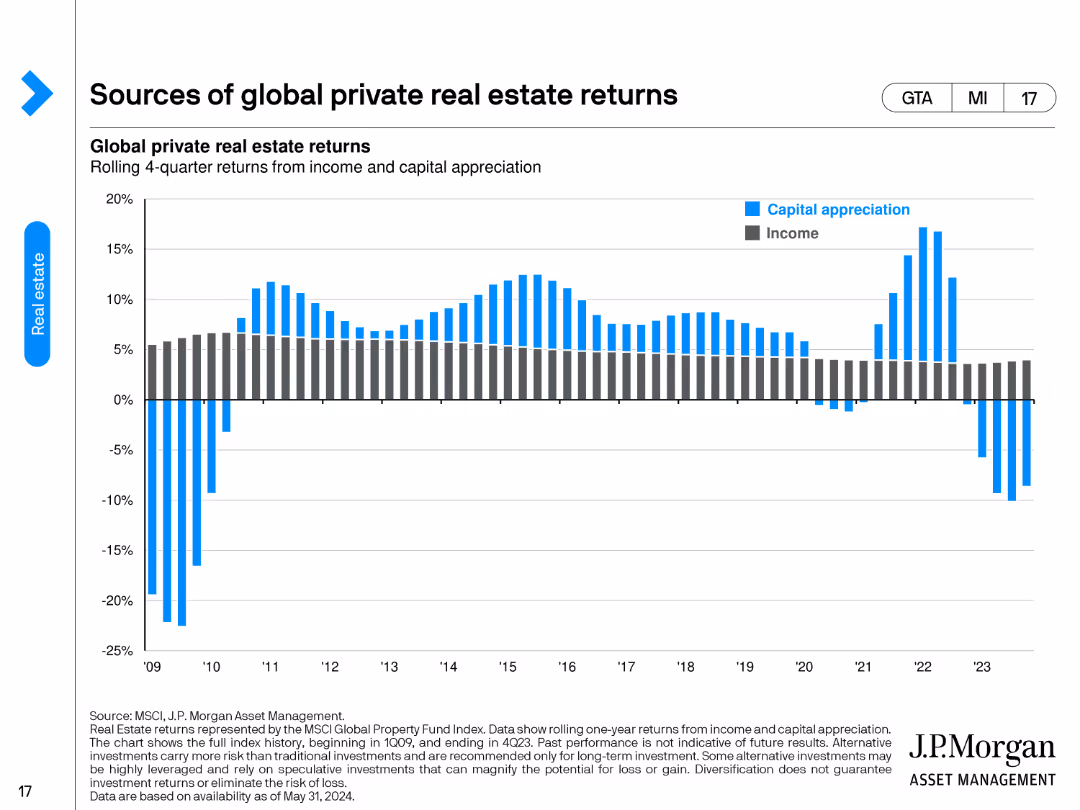
The slide includes a dual-axis column chart showing the rolling 4-quarter returns from income and capital appreciation for global private real estate from 2009 to 2024. The chart uses blue for capital appreciation and grey for income.
Performance Metrics and KPIs
Real Estate & Construction
This slide examines the sources of returns for global private real estate, breaking down the contributions from income and capital appreciation over time, presented in a rolling 4-quarter format from 2009 to 2024.
Real Estate, Returns, Income, Capital Appreciation, Global
false
Performance Metrics and KPIs
Real Estate & Construction
Single Chart
JP Morgan
Add to my slides
Remove from favorites
Three sections with images and accompanying text, each highlighting different aspects of real estate services. Green, blue, and red color highlights for revenue numbers.
Financial Performance
Real Estate & Construction
The slide compares strategies in commercial real estate services, including term lending, community development banking, and real estate banking, focusing on performance and strategic approaches.
Real Estate, Strategy, Lending, Banking, Performance
false
Financial Performance
Real Estate & Construction
Header Vertical
JP Morgan
Add to my slides
Remove from favorites
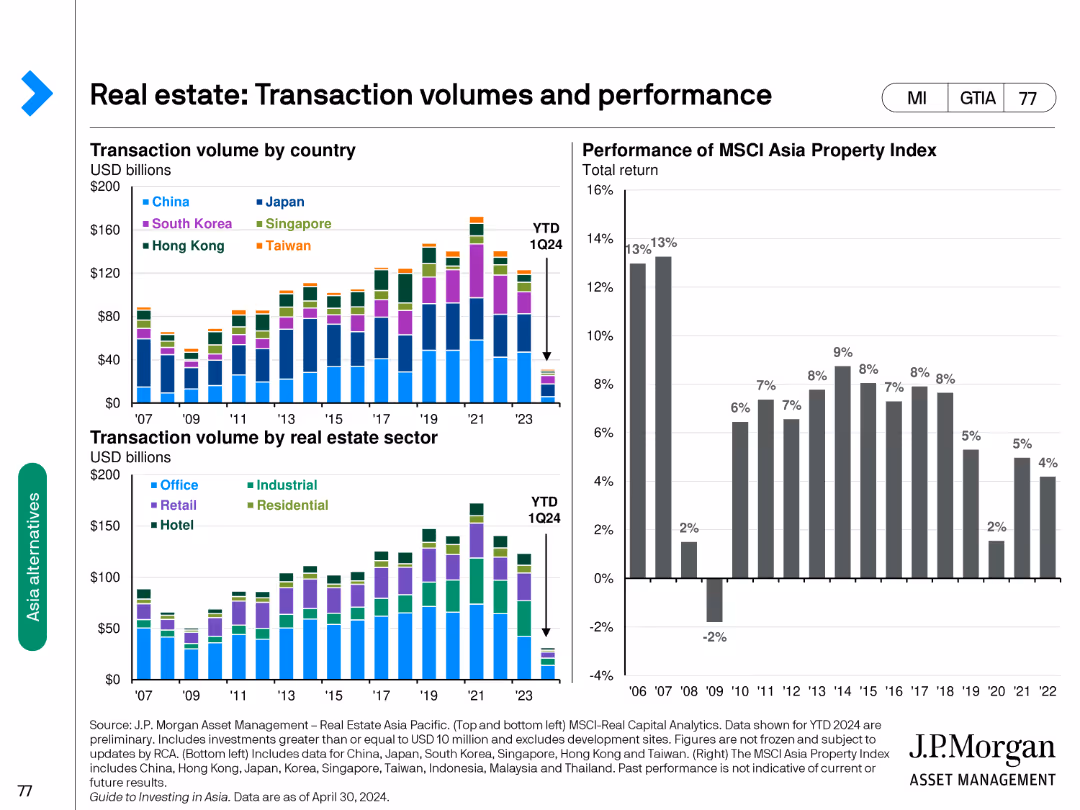
The slide has column charts showing transaction volumes by country and sector and a performance chart of the MSCI Asia Property Index.
Market Analysis and Trends
Real Estate & Construction
Examines real estate transaction volumes across countries and sectors and tracks the performance of the MSCI Asia Property Index.
real estate, transaction, volumes, performance, sectors
false
Market Analysis and Trends
Real Estate & Construction
Multiple Chart
JP Morgan
Add to my slides
Remove from favorites
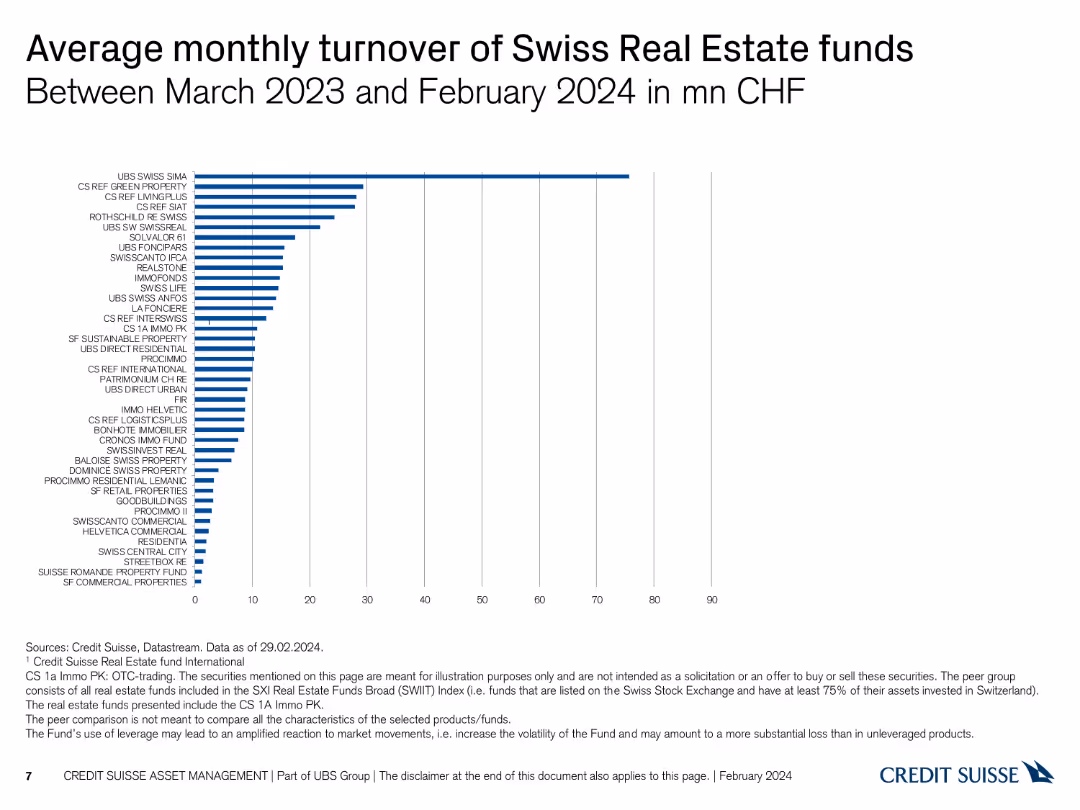
Column chart showing average monthly turnover of various Swiss real estate funds in CHF.
Market Analysis and Trends
Real Estate & Construction
Presents the average monthly turnover of different Swiss real estate funds, measured in CHF, for a one-year period.
real estate, turnover, monthly average, CHF, funds
false
Market Analysis and Trends
Real Estate & Construction
Single Chart
Credit Suisse
Add to my slides
Remove from favorites
The slide contains two column charts. The left chart shows prime yield by property type, and the right chart displays prime rent growth by property type.
Financial Performance
Real Estate & Construction
It presents prime yields and year-over-year rent growth for industrial, office, and retail properties from 4Q87 to 1Q24, aiding financial decisions.
real estate, yield, income, property, prime, growth, rent, financial, industrial, office
false
Financial Performance
Real Estate & Construction
Multiple Chart
JP Morgan
Add to my slides
Remove from favorites
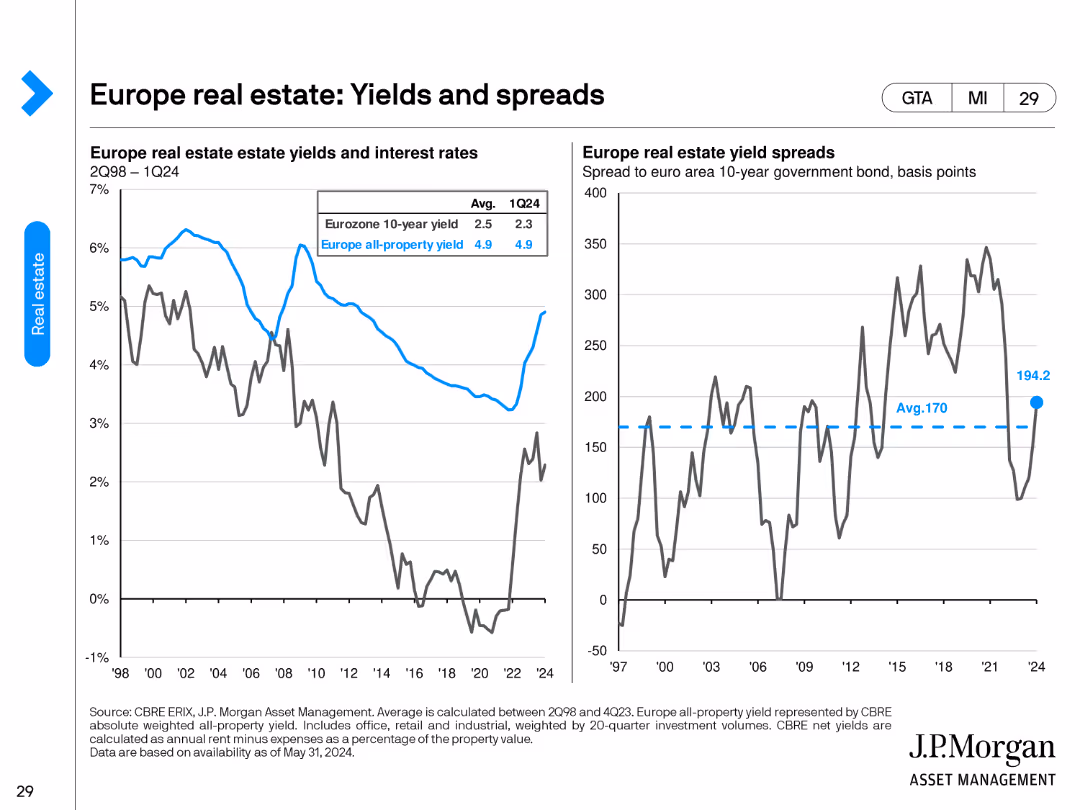
This slide features two column charts. The left chart compares Eurozone 10-year yield with all-property yield, while the right chart shows yield spreads.
Financial Performance
Real Estate & Construction
It compares Eurozone 10-year government bond yields with all-property yields, highlighting trends from 2Q98 to 1Q24, useful for investment analysis.
real estate, yields, spreads, Eurozone, investment, property, trends, analysis
false
Financial Performance
Real Estate & Construction
Multiple Chart
JP Morgan
Add to my slides
Remove from favorites
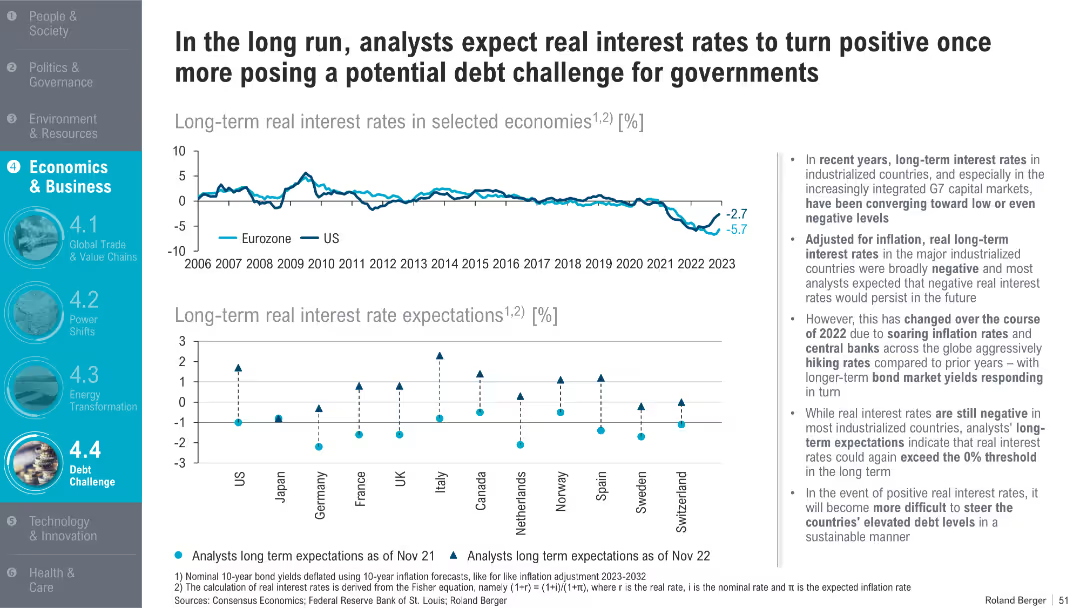
Two-part chart: top shows long-term real interest rates for Eurozone & US; bottom visualizes expectations for major economies; right panel provides analysis
Financial Performance
Government & Public Sector
This slide outlines the shift in real interest rate expectations following inflationary pressures and central bank interventions in 2022. It discusses the implications for managing public debt under higher real rates.
real interest rates, inflation, central banks, public debt, monetary policy, forecasts, G7, long-term yields
false
Financial Performance
Government & Public Sector
Multiple Chart
Roland Berger
Add to my slides
Remove from favorites
The slide shows a column chart representing the connected population in different countries.
Customer and Market Segmentation
Media & Entertainment
The slide illustrates the necessity of speaking to people in real life despite high levels of internet connectivity.
real life, internet connectivity, countries, necessity, communication, World Bank
false
Customer and Market Segmentation
Media & Entertainment
Single Chart
IPSOS
Add to my slides
Remove from favorites
A line graph illustrating transaction growth with milestones beneath, detailing the development and integration phases of real-time payments, with text annotations.
Strategic Planning
Financial Services
Used to present the growth and strategic rollout of real-time payment services in the U.S., including key use cases and the acceleration phase, useful for illustrating market adoption and product development strategies.
Real-Time Payments, Growth, Strategy, Integration, U.S. Market
false
Strategic Planning
Financial Services
Mixed Chart
JP Morgan
Add to my slides
Remove from favorites
This slide features column charts comparing real wage growth in the US, UK, and Euro area from 2019 to 2023. The charts show year-over-year changes in real wages and contributions from nominal wage growth and inflation. Commentary provides context.
Financial Performance
Financial Services
The slide examines real wage growth trends, highlighting positive growth in the US amid easing inflation, contrasted with persistently negative growth in the UK and Euro area. It illustrates the impact of nominal wage growth and inflation on overall wage trends.
real wage growth, US, UK, Euro area, inflation, trends
false
Financial Performance
Financial Services
Multiple Chart
Accenture
Add to my slides
Remove from favorites
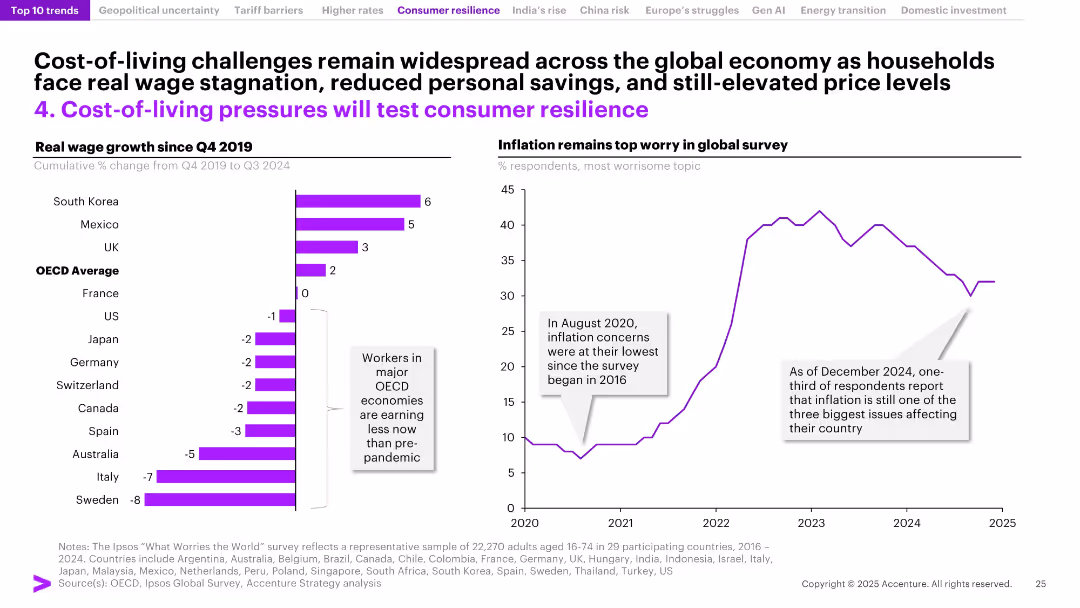
Dual-panel slide with bar chart of wage growth across countries and line chart of global inflation concern trends; uses purple for emphasis.
Strategic Planning
Consumer Goods
The slide examines declining real wages in OECD countries since 2019 and high global inflation concerns. Despite nominal growth in some regions, many major economies are experiencing wage stagnation, fueling consumer anxiety. It highlights inflation as a persistent concern and a significant test of consumer resilience.
real wages, cost of living, inflation, OECD, consumer resilience, income stagnation, savings decline, global concern, wage growth, economic pressure
false
Strategic Planning
Consumer Goods
Multiple Chart
Accenture
Add to my slides
Remove from favorites
Featuring bar charts, the slide shows the reasons for purchasing crypto investment funds, comparing data from 2023 and 2022, and detailing specific motivations for investment.
Market Analysis and Trends
Financial Services
It explains the reasons behind purchasing crypto investment funds, such as making more money than in a savings account, speculative investment, and diversification, with trends from 2022 to 2023.
reasons, crypto investment funds, purchase, motivations, comparison
false
Market Analysis and Trends
Financial Services
Multiple Chart
IPSOS
Add to my slides
Remove from favorites
The slide contains a column chart detailing various reasons for returns, such as incorrect size and fit, unmet quality expectations, and misleading product display.
Market Analysis and Trends
Retail & E-commerce
Presents survey data on the top reasons for returns in the fashion industry, highlighting size and fit issues, quality expectations, and other key factors influencing returns.
Reasons for returns, Size & fit, Quality expectations, Survey data, Fashion industry
false
Market Analysis and Trends
Retail & E-commerce
Mixed Chart
Roland Berger
Add to my slides
Remove from favorites
The slide presents horizontal bar charts to display the various reasons Canadians purchased crypto assets, comparing data from 2023 and 2022, with detailed breakdowns of each reason.
Market Analysis and Trends
Financial Services
This slide outlines the main reasons Canadians purchased crypto assets, highlighting trends and changes in motivations from 2022 to 2023, such as speculative investment, diversification, and quick profits.
reasons, purchasing, crypto assets, motivations, comparison
false
Market Analysis and Trends
Financial Services
Multiple Chart
IPSOS
Add to my slides
Remove from favorites
Contains two column charts: one showing GVA growth in UK regions for 2023 and another showing GVA growth by sector.
Market Analysis and Trends
Government & Public Sector
Discusses the expected recession in 2023, detailing forecasted declines in GVA growth across UK regions and sectors, driven by consumer spending declines.
recession, 2023, GVA growth, UK regions, sectors, column chart
false
Market Analysis and Trends
Government & Public Sector
Multiple Chart
EY
Add to my slides
Remove from favorites
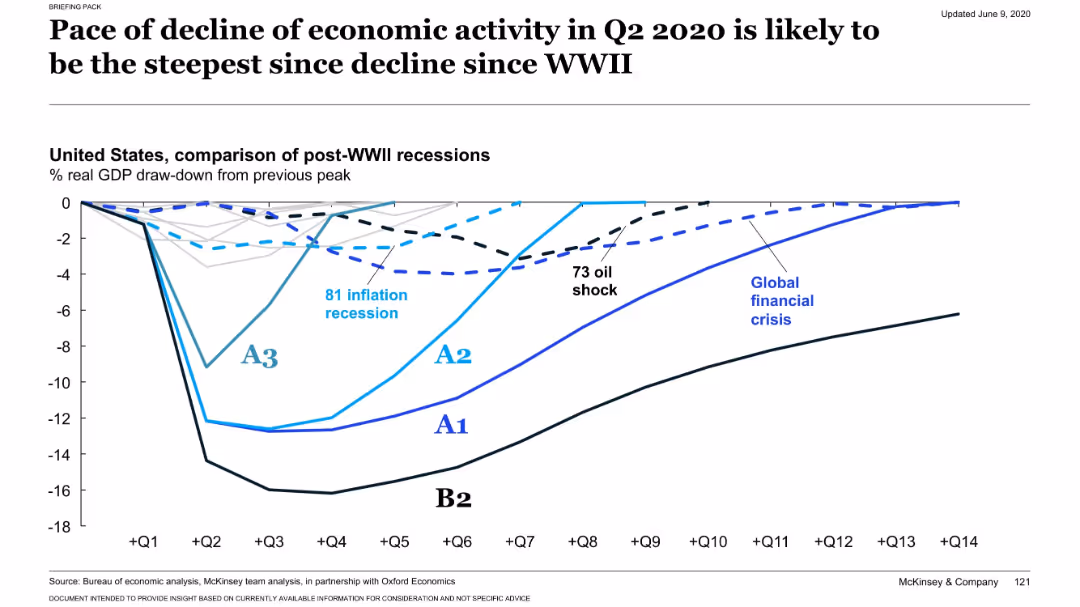
Line chart comparing post-WWII US recessions by GDP draw-down. COVID-19 scenarios (A1–B2) are overlaid on historical downturns.
Risk Assessment and Management
Financial Services
Shows the severity and steepness of US GDP decline in Q2 2020 across multiple scenarios compared to historical recessions (e.g., 1981, 1973 oil shock, global financial crisis). Scenario B2 shows the deepest and most prolonged downturn.
recession comparison, economic shock, COVID-19, historical data, GDP trend
false
Risk Assessment and Management
Financial Services
Single Chart
McKinsey
Add to my slides
Remove from favorites
The slide is a mix of data visualizations including pie charts for recession concerns and views on the economy, and bar graphs for profit expectations and AI use, complemented by descriptive sections.
Operational Efficiency
Financial Services
Summarizes key economic insights from business leaders, covering topics from recession prospects to profit expectations, and the application of AI in business, providing a broad overview of the business climate.
Recession, Economy, Profit, AI, Workforce
false
Operational Efficiency
Financial Services
Multiple Chart
JP Morgan
Add to my slides
Remove from favorites
The slide features a balance of text and imagery, including a pie chart and percentage graphics. Two sections with green headers present statistics in bold, accompanied by icons—a head silhouette, a clock, and a trending arrow. It's a well-structured, clean layout.
Market Analysis and Trends
Financial Services
This slide presents statistics on companies retracting employee benefits in anticipation of a recession. It visualizes data on how frequently companies and HR leaders are engaging with benefits that their competitors do not offer. It's likely used for financial or HR industry analyses.
recession, employee benefits, HR leaders, companies, statistics
false
Market Analysis and Trends
Financial Services
Mixed Chart
Goldman Sachs
Add to my slides
Remove from favorites
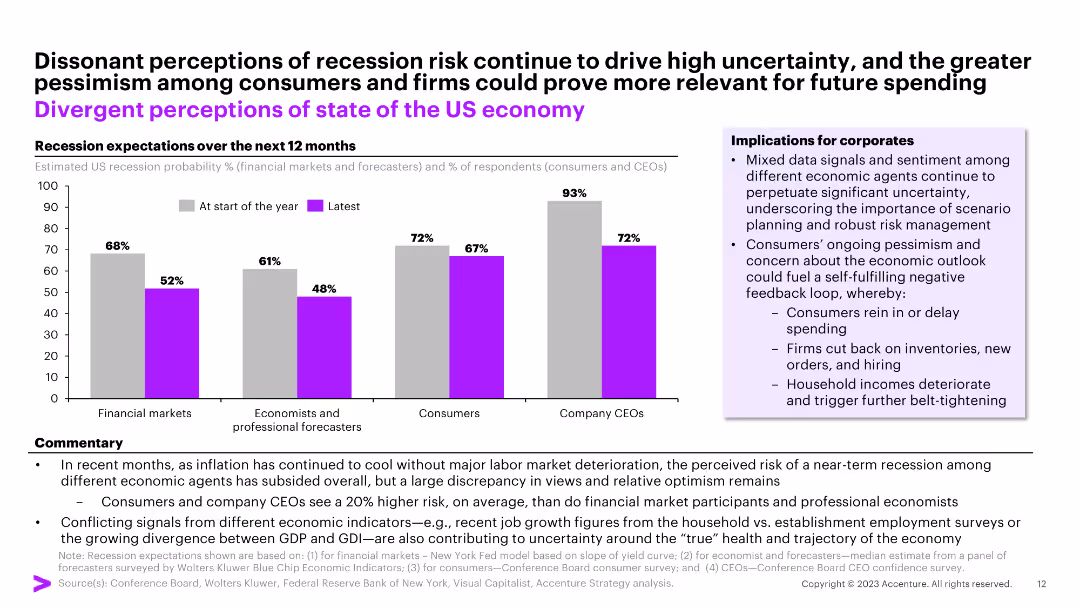
The slide shows a column chart comparing recession expectations over the next 12 months among different economic agents. It includes commentary and implications for corporates.
Market Analysis and Trends
Financial Services
The slide highlights differing recession expectations among financial markets, economists, consumers, and CEOs. It discusses potential impacts on corporate planning and risk management.
recession expectations, economic outlook, financial services, market analysis, corporate implications
false
Market Analysis and Trends
Financial Services
Mixed Chart
Accenture
Add to my slides
Remove from favorites
Balanced layout with a circular chart on the left (Australia recession outlook) and a bar chart on the right (inflation and interest rate expectations); includes textual summary; blue-toned visual theme.
Market Analysis and Trends
Financial Services
This slide explores economic sentiment in Australia, where 37% expect a recession in the next 12 months. Inflation and interest rates are anticipated to slightly decline. The data reflects cautious optimism with inflation expected to stay high. Survey responses are segmented by recession likelihood and expected changes in macroeconomic indicators over the next 12 months.
recession forecast, Australia, interest rates, inflation, survey, economic sentiment, Alvarez & Marsal, macro trends, business outlook, 2024 outlook
false
Market Analysis and Trends
Financial Services
Multiple Chart
Alvarez & Marsal
Add to my slides
Remove from favorites
Dual-section layout with bar chart on recession impact across three restructuring areas and a multicolor stacked bar on sector-specific challenges; textual summary and expert quote included.
Strategic Planning
Professional Services
This slide discusses the potential impact of a recession on three key areas: operational turnaround, financial restructuring, and insolvency. It also identifies the top challenges for various sectors, with cost inflation being the most cited issue. The chart reveals significant stress expectations in construction, hospitality, and retail sectors.
recession impact, turnaround, insolvency, restructuring, sector stress, Alvarez & Marsal, inflation, market challenges, Australia
false
Strategic Planning
Professional Services
Multiple Chart
Alvarez & Marsal
Add to my slides
Remove from favorites
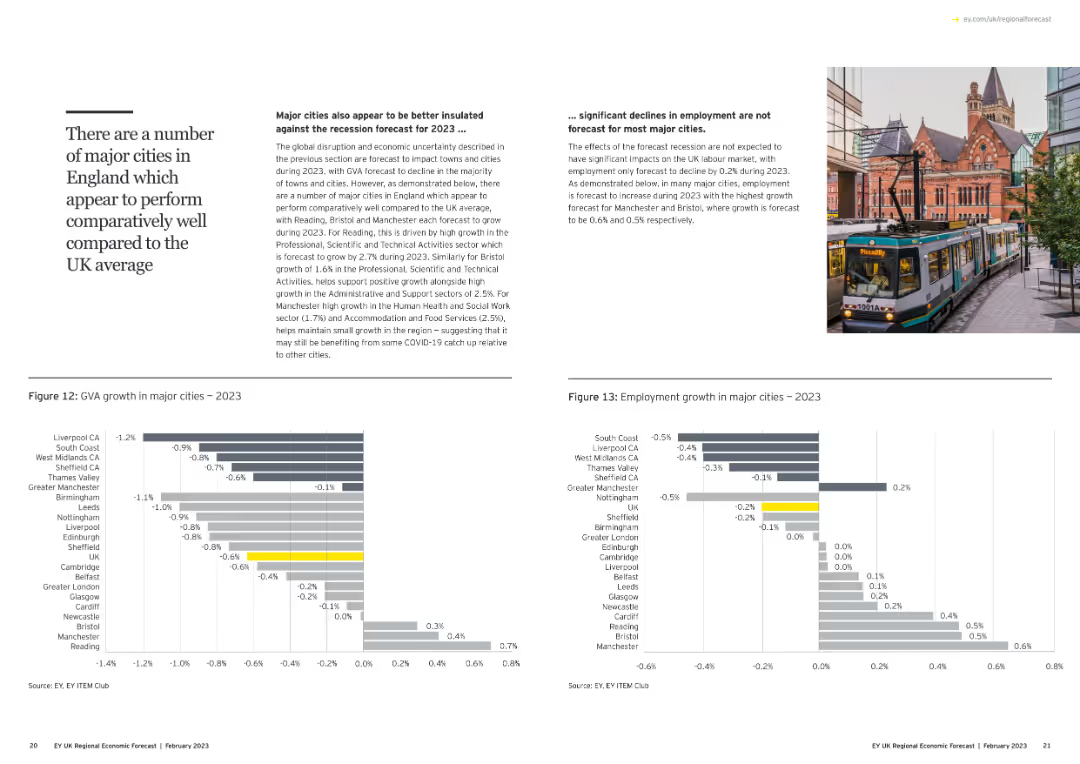
Features two column charts: one showing GVA growth in major cities for 2023 and another showing employment growth in these cities.
Risk Assessment and Management
Government & Public Sector
Discusses how major cities are insulated against recession, analyzing growth forecasts for 2023 and highlighting resilient sectors and cities.
recession insulation, major cities, GVA growth, employment, column chart
false
Risk Assessment and Management
Government & Public Sector
Multiple Chart
EY
Add to my slides
Remove from favorites
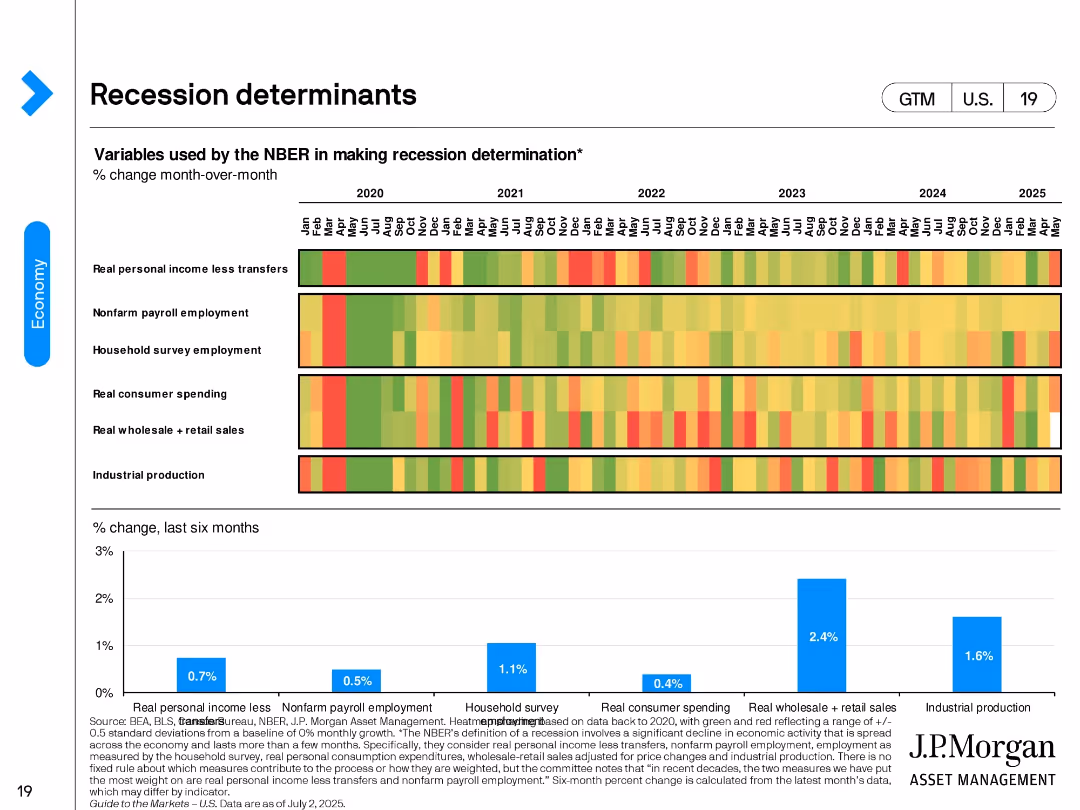
The slide includes a heatmap of various economic indicators used by NBER to determine recessions, along with a bar chart showing percent change over the last six months for specific metrics like real personal income and industrial production.
Risk Assessment and Management
Financial Services
This slide identifies key economic indicators used to determine recessions, presenting a detailed month-over-month change analysis. Useful for risk management and economic forecasting.
recession, NBER, economic indicators, risk management, personal income, industrial production
false
Risk Assessment and Management
Financial Services
Mixed Chart
JP Morgan
Add to my slides
Remove from favorites
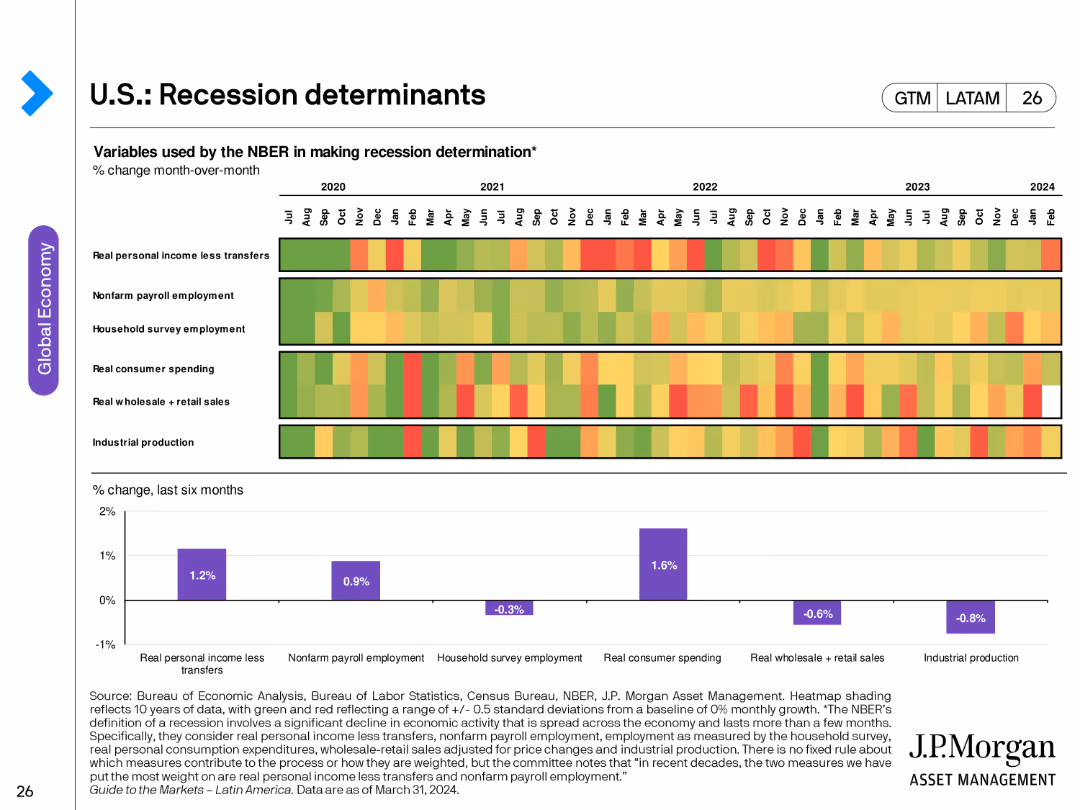
Heatmap showing monthly changes across six economic indicators from 2020–2025. The bottom bar graph summarizes 6-month percentage changes for each variable. Uses color coding (red, yellow, green) to indicate strength/weakness.
Risk Assessment and Management
Financial Services
Analyzes variables used by the NBER to determine U.S. recessions, such as employment, income, and industrial production. The slide helps assess economic health via color-coded trends and highlights relatively strong wholesale and industrial indicators.
recession, NBER, employment, production, consumer spending, income, indicators, heatmap, risk, economic decline
false
Risk Assessment and Management
Financial Services
Multiple Chart
JP Morgan
Add to my slides
Remove from favorites
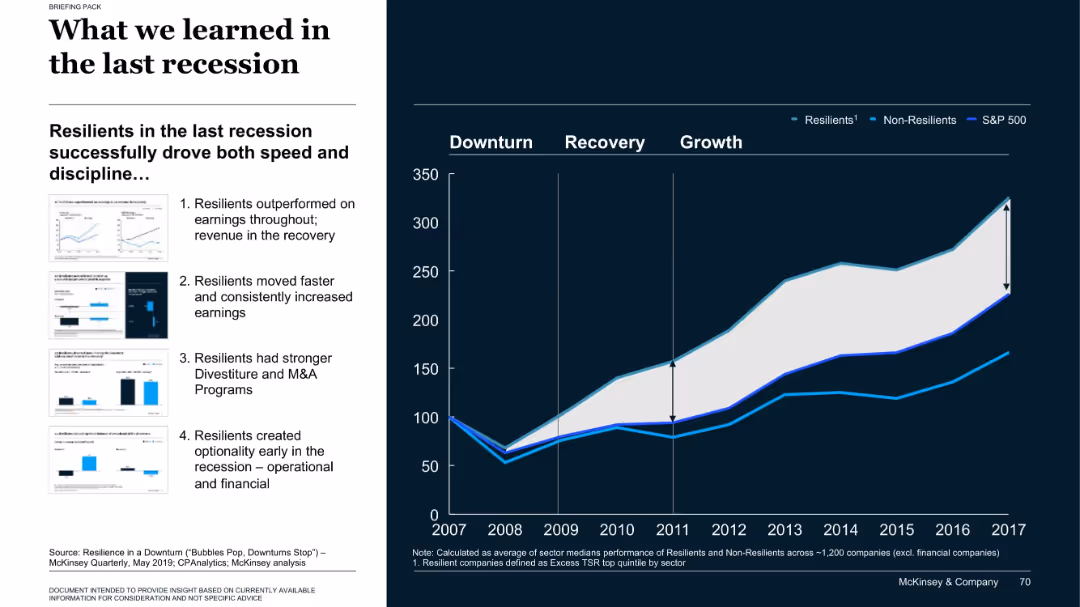
Left side text and thumbnails; right side line chart comparing company performance categories post-2008
Strategic Planning
Professional Services
The slide compares resilient vs. non-resilient companies during the 2008 recession, showing how resilient firms recovered faster and achieved higher long-term returns. Four key behaviors are outlined on the left that contributed to resilience.
recession, resilience, M&A, company performance, S&P 500
false
Strategic Planning
Professional Services
Mixed Chart
McKinsey
Add to my slides
Remove from favorites
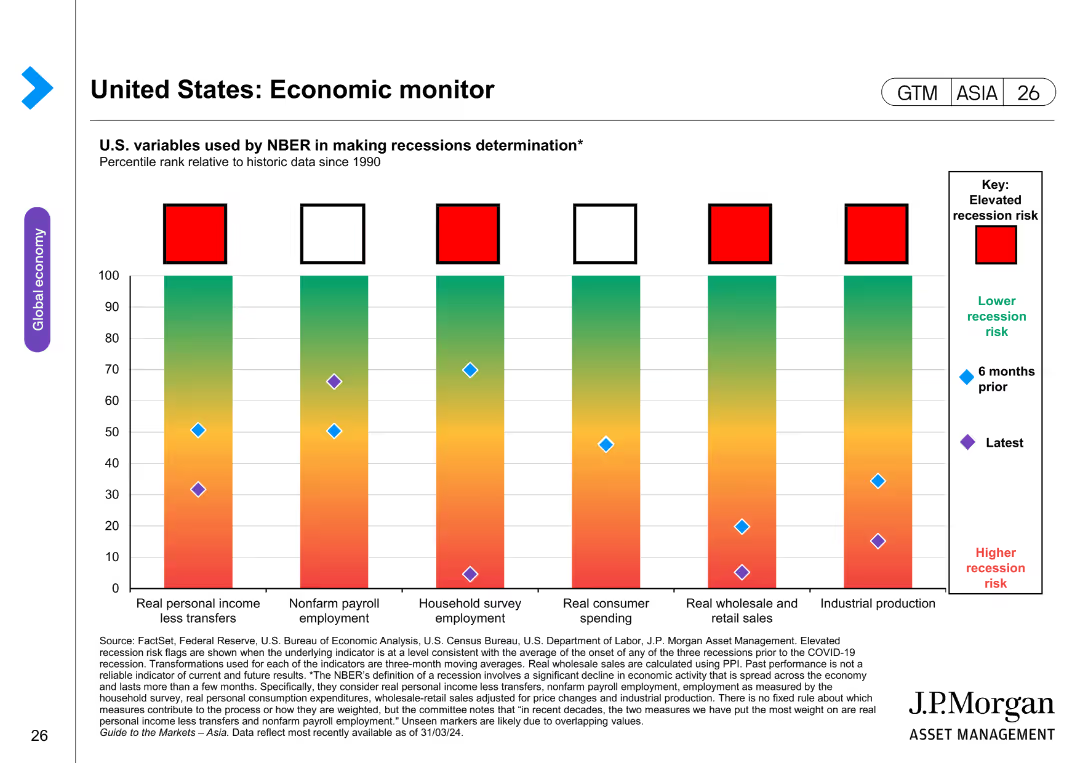
The slide includes a bar chart with color-coded bars indicating recession risks for various economic variables. The layout is detailed and moderately complex.
Risk Assessment and Management
Financial Services
The slide presents the risk levels of potential recession using various economic indicators, comparing current data with historical trends to assess economic stability.
recession risk, economic indicators, historical trends, risk levels, economic stability
false
Risk Assessment and Management
Financial Services
Single Chart
JP Morgan
Add to my slides
Remove from favorites
Features side-by-side area charts comparing the economic impacts of the Great Recession, 9/11, and COVID-19 on New York's GDP. Each recession is color-coded for clarity, with detailed annotations explaining the economic trends and recovery phases.
Financial Performance
Financial Services
Examines the severity and recovery trajectories of past and current economic recessions, with a focus on the unprecedented impact of COVID-19. Essential for financial presentations and discussions on economic recovery planning.
recessions, economic impact, GDP, New York, COVID-19, Great Recession, 9/11, recovery planning
false
Financial Performance
Financial Services
Multiple Chart
BCG
Add to my slides
Remove from favorites
Utilizes normalized area charts to compare the impact of major economic downturns (Great Depression, post-WWII, 9/11) on New York’s GDP with the COVID-19 recession. Each chart includes annotations and color distinctions to highlight differences in GDP impact percentages.
Strategic Planning
Government & Public Sector
Provides a comparative analysis of New York’s economic resilience across various recessions, emphasizing the unique challenges and recovery patterns presented by COVID-19. Useful for economic studies and policy-making.
recessions, GDP, New York, comparative analysis, economic impact, COVID-19, policy-making
false
Strategic Planning
Government & Public Sector
Multiple Chart
BCG
Add to my slides
Remove from favorites
Detailed line graph comparing the decline rates of US GDP across various recessions with projected COVID-19 impacts.
Competitive Landscape
Financial Services
Slide compares current economic downturns with historical recessions, highlighting the severity of COVID-19’s economic impact.
Recessions, GDP, US, COVID-19, Comparison
false
Competitive Landscape
Financial Services
Single Chart
McKinsey
Add to my slides
Remove from favorites
The slide features a pie chart outlining leaders' expectations for a 2023 recession and colored blocks indicating strategies to mitigate economic downturns.
Risk Assessment and Management
Financial Services
Offers insights into the anticipated economic climate for 2023 with a focus on recession expectation and strategic responses, emphasizing risk management and financial planning.
Recession, Strategy, Risk Management, 2023
false
Risk Assessment and Management
Financial Services
Mixed Chart
JP Morgan
Add to my slides
Remove from favorites
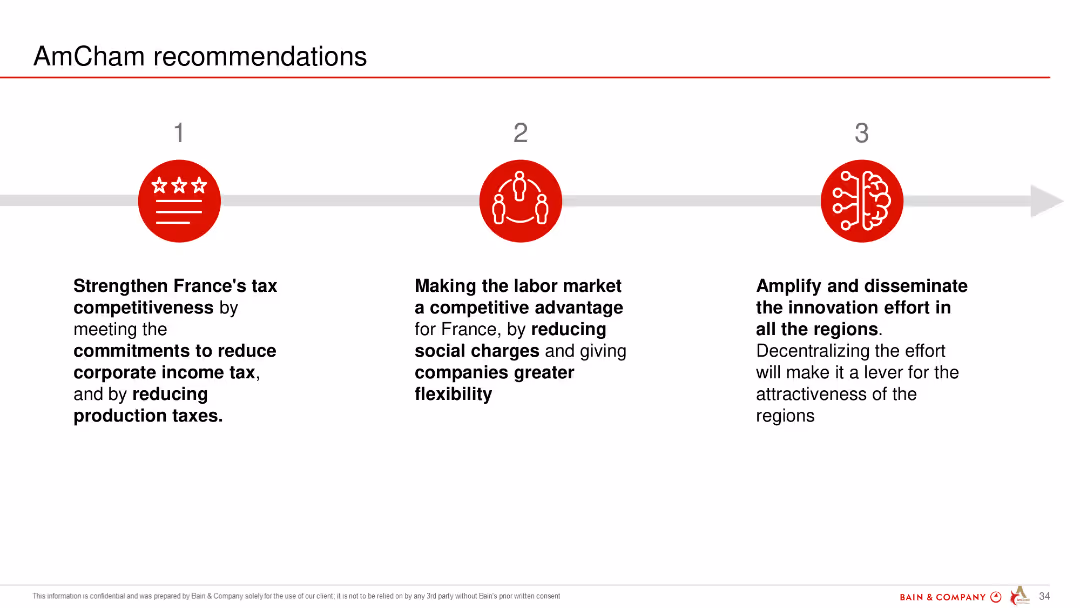
This slide uses a simple layout with three key recommendations for strengthening France's competitiveness, each with an icon and brief description.
Strategic Planning
Professional Services
The slide outlines AmCham's three main recommendations for France: improving tax competitiveness, making the labor market more flexible, and amplifying innovation efforts.
recommendations, AmCham, competitiveness, tax, labor market, innovation
false
Strategic Planning
Professional Services
Linear Flow
Bain
Add to my slides
Remove from favorites
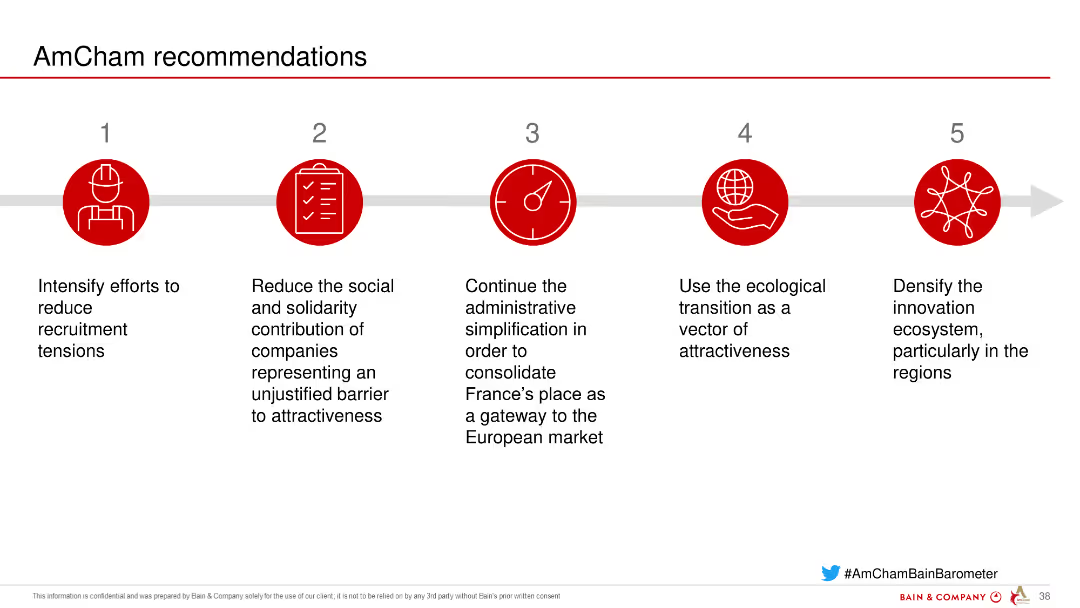
Icons and text describing five key recommendations from AmCham to improve attractiveness and reduce barriers for companies in France.
Strategic Planning
Professional Services
Outlines recommendations to enhance the attractiveness of France for businesses, including reducing recruitment tensions and promoting ecological transition.
recommendations, AmCham, France, attractiveness, barriers
false
Strategic Planning
Professional Services
Linear Flow
Bain
Add to my slides
Remove from favorites
Slide presents five key recommendations with associated icons: leaf, helmet, light bulb, brain, graduation cap. Red accent colors on a white background.
Strategic Planning
Professional Services
Outlines strategic recommendations by AmCham France for maintaining business dynamics, reindustrialization, capitalizing on R&D, AI deployment, and addressing labor shortages.
recommendations, AmCham France, business dynamics, reindustrialization, AI, labor shortages, R&D, strategic planning
false
Strategic Planning
Professional Services
Linear Flow
Bain
Add to my slides
Remove from favorites
Featuring pie charts and bar charts, the slide shows the percentage of Canadians who received recommendations from financial advisors to purchase crypto assets, comparing data from 2023 and 2022.
Market Analysis and Trends
Financial Services
It details the recommendations from financial advisors regarding purchasing crypto assets, including how often these recommendations were made and how they have changed from 2022 to 2023.
recommendations, financial advisor, crypto assets, purchase, comparison
false
Market Analysis and Trends
Financial Services
Multiple Chart
IPSOS
Add to my slides
Remove from favorites
The slide uses pie charts and bar charts to show the percentage of Canadians who received recommendations from financial advisors to purchase crypto funds, comparing data from 2023 and 2022.
Market Analysis and Trends
Financial Services
It details recommendations from financial advisors regarding purchasing crypto funds, including the frequency and nature of these recommendations and changes from 2022 to 2023.
recommendations, financial advisor, crypto funds, purchase, comparison
false
Market Analysis and Trends
Financial Services
Multiple Chart
IPSOS
Add to my slides
Remove from favorites
This slide features no visual data but offers a text-heavy approach with bulleted lists for clarity on recommendations related to gender equality in the workplace.
Strategic Planning
Professional Services
Provides a summary of recommendations for organizations to improve gender equality, focusing on core enablers. It could be used as a closing slide in strategic meetings focused on diversity and inclusion or as a standalone reference in educational settings on corporate governance.
recommendations, gender equality, workplace, strategy
false
Strategic Planning
Professional Services
Multiple Chart
Deloitte
Add to my slides
Remove from favorites
The slide uses a simple design with text and icons. It presents key recommendations for marketers to improve measurement confidence, such as leveraging technology and staying agile.
Strategic Planning
Professional Services
This slide provides actionable recommendations for marketers to enhance measurement confidence by using technology, remaining agile, and optimizing throughout the marketing funnel.
recommendations, marketers, measurement, confidence, strategy
false
Strategic Planning
Professional Services
Header Vertical
Nielsen
Add to my slides
Remove from favorites
The slide has a text box with key recommendations, each accompanied by a relevant icon. The background is green with white text.
Strategic Planning
Professional Services
The slide offers strategic recommendations for marketers, emphasizing consumer trust, the power of influencers, and brand safety in their marketing strategies.
recommendations, marketers, strategy, influencers, brand safety
false
Strategic Planning
Professional Services
Header Vertical
Nielsen
Add to my slides
Remove from favorites
A slide with a bold, purple background containing three key recommendations for marketers to build brand awareness. Each recommendation is supported by an icon and brief text description.
Strategic Planning
Media & Entertainment
This slide provides three key recommendations for marketers to enhance brand awareness: align marketing strategies with KPIs, stay top-of-mind with consumers, and leverage digital channels for long-term engagement and reach.
Recommendations, Marketing, Brand, Awareness, Strategy
false
Strategic Planning
Media & Entertainment
Header Vertical
Nielsen
Add to my slides
Remove from favorites
The slide presents two column charts comparing the environmental impact of new vs. used clothing and the footprint reduction for rented clothing.
Operational Efficiency
Retail & E-commerce
This slide compares the environmental impacts of recommerce and rental models in the fashion industry, highlighting carbon emissions and water use.
recommerce, rental, environmental impact, carbon emissions, water usage
false
Operational Efficiency
Retail & E-commerce
Multiple Chart
Roland Berger
Add to my slides
Remove from favorites
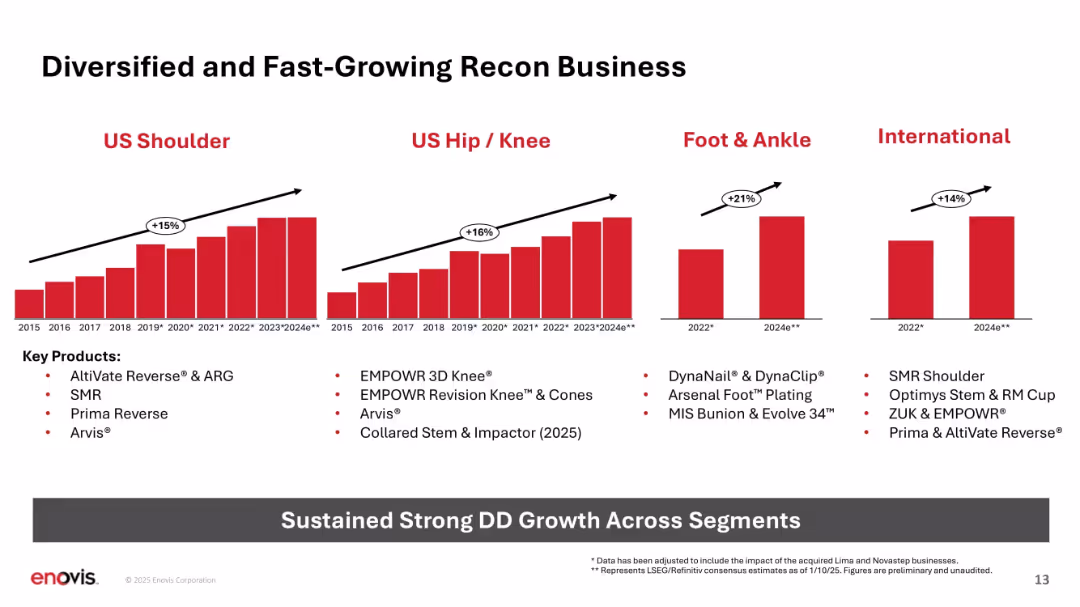
Four bar chart panels by anatomical segment; growth rates annotated; product list below.
Performance Metrics and KPIs
Healthcare & Pharmaceuticals
Shows double-digit growth in US Shoulder, Hip/Knee, Foot & Ankle, and International segments from 2015–2024e. Lists key contributing products and reinforces strong sustained performance across segments.
Recon, growth, segments, shoulder, hip, foot, ankle, KPIs, products
false
Performance Metrics and KPIs
Healthcare & Pharmaceuticals
Multiple Chart
JP Morgan
Add to my slides
Remove from favorites
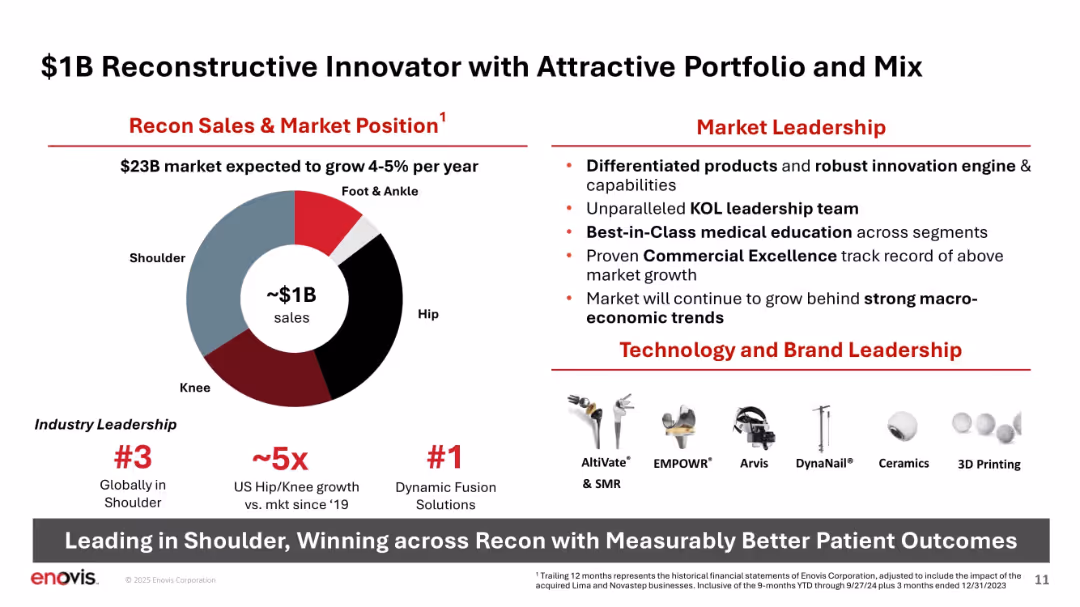
Donut chart for sales distribution; bulleted leadership traits and product visuals; bold typography.
Product and Service Analysis
Healthcare & Pharmaceuticals
Breaks down Recon’s ~$1B sales across anatomical segments (e.g., shoulder, hip), highlights market leadership, differentiated technology, and portfolio strength. Emphasizes innovation and strong competitive position in orthopedic reconstructive.
Recon, portfolio, innovation, sales mix, leadership, shoulder, hip, knee, products
false
Product and Service Analysis
Healthcare & Pharmaceuticals
Mixed Chart
JP Morgan
Add to my slides
Remove from favorites
Features multiple line graphs to compare year-on-year growth rates across various segments and regions.
Market Analysis and Trends
Media & Entertainment
Examines the recovery patterns in the entertainment and media sector across different regions with a focus on live music and cinema.
recovery, E&M sector, COVID-19, global, China
false
Market Analysis and Trends
Media & Entertainment
Multiple Chart
PwC/Strategy&
Add to my slides
Remove from favorites
Features a line graph charting the projected recovery of global luxury markets from 2010 to 2025, focusing on personal and experience-based goods. The slide includes future predictions with visual markers for expected recovery timelines.
Market Analysis and Trends
Consumer Goods
This slide forecasts the recovery trajectory of global luxury markets post-COVID-19, with a specific focus on the rebound of personal and experience-based luxury goods. It uses historical data to project future market recovery, providing a timeline and visual depiction of when various sectors might return to pre-pandemic levels.
recovery forecast, luxury markets, post-COVID, market projection, experience-based goods
false
Market Analysis and Trends
Consumer Goods
Mixed Chart
Bain
Add to my slides
Remove from favorites
The slide includes a world map with arrows indicating expected recovery rates for different regions, along with textual analysis on recovery insights by geography.
Market Analysis and Trends
Retail & E-commerce
Discusses expected recovery rates for the luxury market by geographical area post-COVID, highlighting variations in recovery speed and market segments.
recovery, geographical area, luxury, market, post-COVID, retail, e-commerce, regions, analysis
false
Market Analysis and Trends
Retail & E-commerce
Mixed Chart
Deloitte
Add to my slides
Remove from favorites
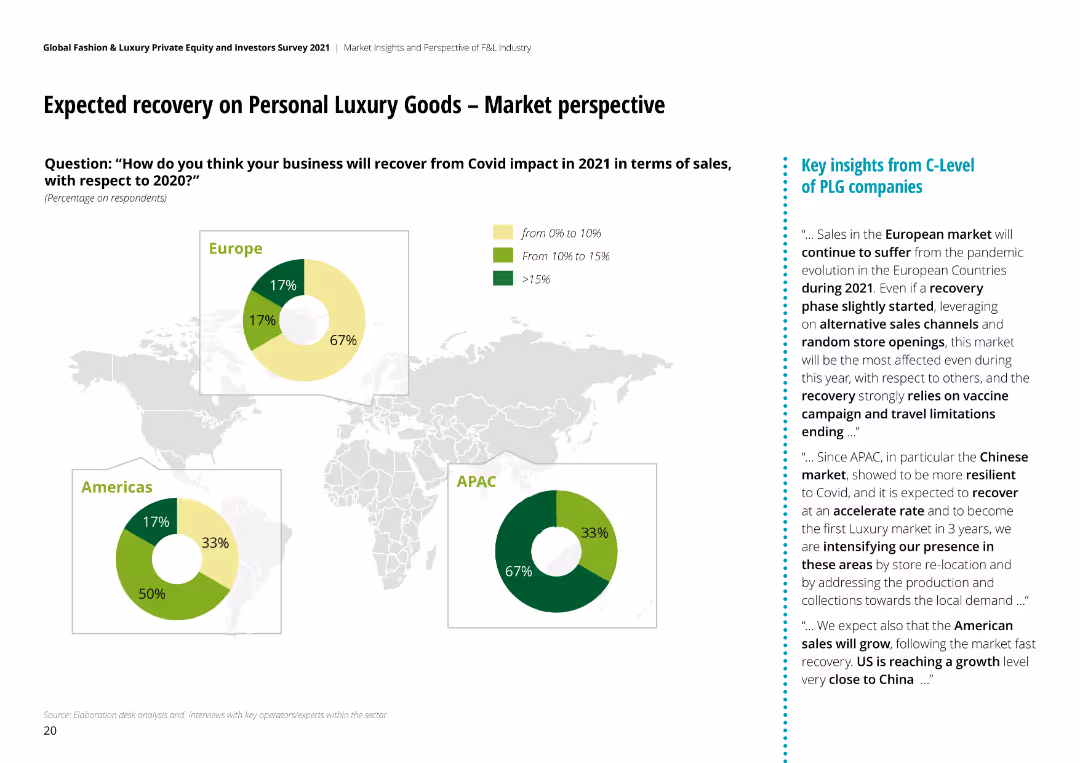
The slide contains a world map with three pie charts representing Europe, Americas, and APAC. Each pie chart shows percentage recovery expectations.
Market Analysis and Trends
Consumer Goods
It discusses the expected recovery of personal luxury goods across different regions, with key insights from C-Level executives highlighted on the right.
Recovery, Luxury Goods, Europe, Americas, APAC, Covid
false
Market Analysis and Trends
Consumer Goods
Multiple Chart
Deloitte
Add to my slides
Remove from favorites
Features a scatter plot overlaid with trend lines to depict sector-specific recovery forecasts post-2019. Segments are represented by circles of varying sizes, indicating market size, with colors illustrating different rates of growth or decline across sectors such as OTT, cinema, and TV advertising.
Strategic Planning
Media & Entertainment
The slide provides insights into the disparate recovery paths expected in various segments of the E&M market, identifying which will likely experience growth versus those facing decline. It is essential for strategic discussions on resource allocation, risk management, and potential growth opportunities in the post-pandemic market landscape.
recovery, market trends, E&M, segmentation
false
Strategic Planning
Media & Entertainment
Multiple Chart
PwC/Strategy&
Add to my slides
Remove from favorites
The slide contains quotes, bar graphs, and icons. It discusses the challenges companies face in attracting the right talent and the extent of these challenges across company stages.
Human Resources and Talent Management
Professional Services
Details the difficulties companies, especially startups, encounter when recruiting, including compensation and branding issues. It's used for talent acquisition strategy sessions.
recruiting challenges, compensation, branding, talent acquisition, startups, employer branding
false
Human Resources and Talent Management
Professional Services
Header Vertical
Kearney
Add to my slides
Remove from favorites
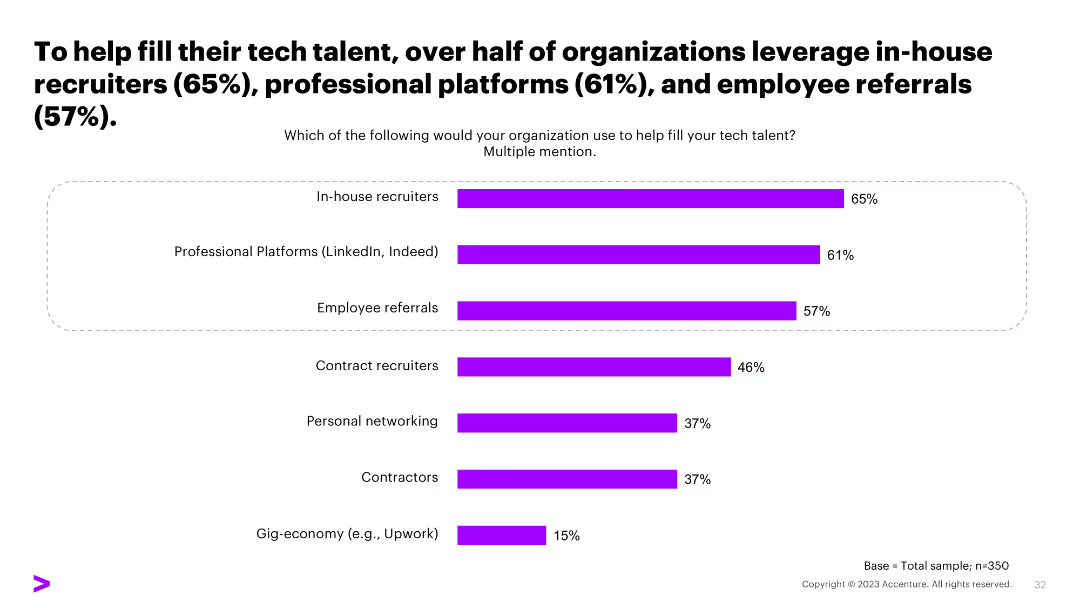
A column chart listing methods organizations use to fill tech talent roles, including in-house recruiters, professional platforms, and employee referrals, with percentages.
Human Resources and Talent Management
Professional Services
The slide outlines the primary methods organizations use to recruit tech talent, emphasizing the reliance on in-house recruiters and professional platforms.
recruitment methods, in-house recruiters, professional platforms, employee referrals
false
Human Resources and Talent Management
Professional Services
Single Chart
Accenture
Add to my slides
Remove from favorites
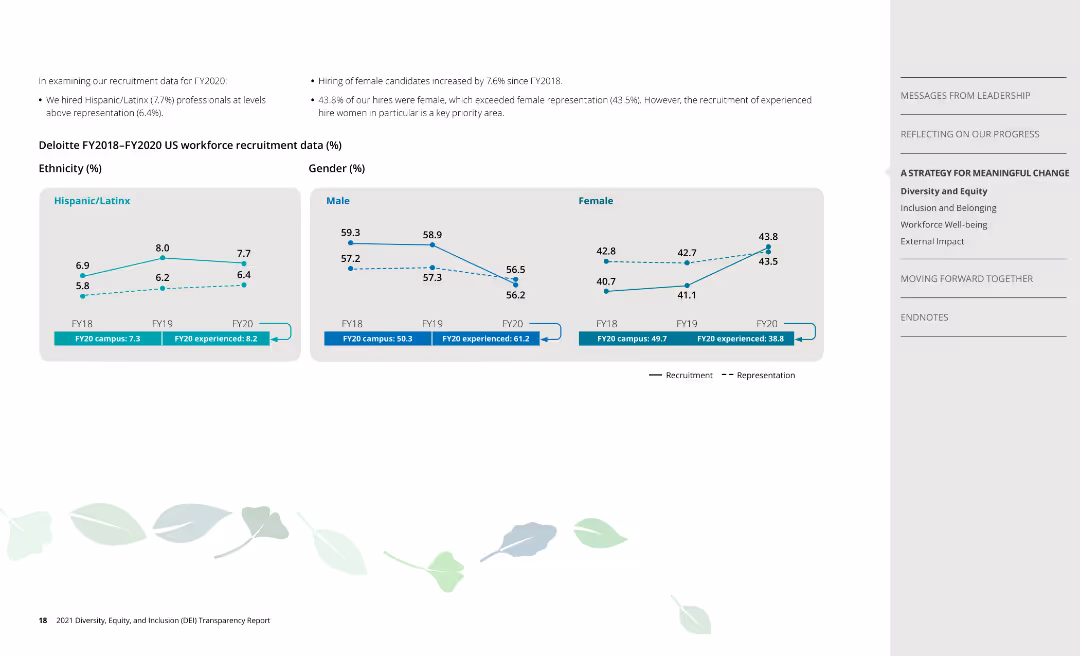
Line charts show recruitment and representation data by ethnicity and gender from FY2018 to FY2020.
Human Resources and Talent Management
Professional Services
Analyzes recruitment trends over three years, highlighting progress and areas for improvement in diversity.
recruitment, representation, ethnicity, gender
false
Human Resources and Talent Management
Professional Services
Multiple Chart
Deloitte
Add to my slides
Remove from favorites
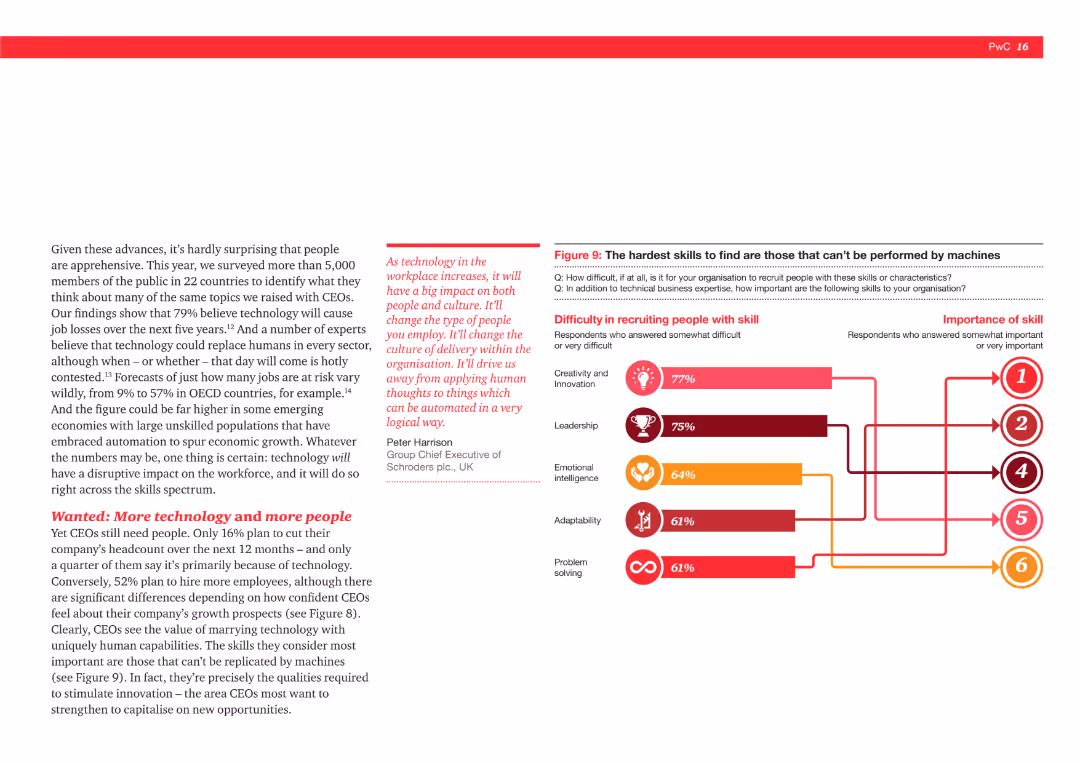
The slide includes a column chart showing the difficulty in recruiting various skills such as creativity (77%), leadership (75%), and emotional intelligence (64%). It also shows the importance of these skills.
Human Resources and Talent Management
Professional Services
This slide addresses the challenges CEOs face in recruiting skills that cannot be automated. It lists creativity, leadership, and emotional intelligence as the most difficult to find, alongside their importance to organizations.
Recruitment, skills, automation, creativity, leadership, emotional intelligence, CEOs, HR challenges
false
Human Resources and Talent Management
Professional Services
Mixed Chart
PwC/Strategy&
Add to my slides
Remove from favorites
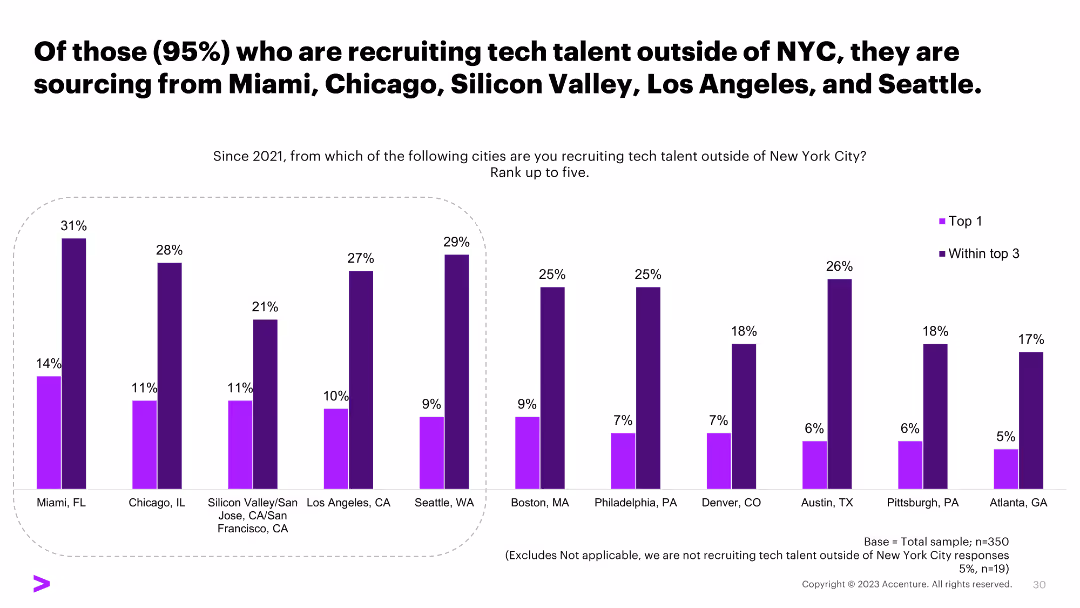
A column chart showing the top cities organizations are recruiting tech talent from outside of NYC, including Miami, Chicago, and others, with percentage values.
Human Resources and Talent Management
Professional Services
The slide indicates the cities where organizations are sourcing tech talent from outside of NYC, providing insights into geographic recruitment strategies.
recruitment, tech talent, NYC, sourcing cities, survey
false
Human Resources and Talent Management
Professional Services
Single Chart
Accenture
Add to my slides
Remove from favorites
Features a column chart illustrating revenue growth from 2015 to 3Q19 and a bar chart showing the targeted deployment of risk-weighted assets.
Financial Performance
Financial Services
The slide focuses on growing recurring management fees, highlighting revenue growth and strategic deployment of risk-weighted assets to enhance financial stability.
Recurring Fees, Management Fees, Revenue Growth, RWA, Financial Stability
false
Financial Performance
Financial Services
Multiple Chart
Credit Suisse
Add to my slides
Remove from favorites
Multi-panel layout: text box at top left, visuals of consumables to the right, bar charts for installed base at bottom left, pie chart for sales split.
Performance Metrics and KPIs
Healthcare & Pharmaceuticals
Emphasizes STRATEC’s recurring revenue from service parts and consumables, which account for 37% of sales. Includes product visuals and installed base growth from 2020–2023. Notes complexity growth in systems and showcases 2023 revenue distribution by category.
recurring revenue, consumables, smart consumables, installed base, instrumentation, diagnostics, sales mix, STRATEC, KPIs
false
Performance Metrics and KPIs
Healthcare & Pharmaceuticals
Multiple Chart
Goldman Sachs
Add to my slides
Remove from favorites
The slide uses a central node labeled "Free Cash Flow" connected to several contributing factors in boxes, indicating drivers and uses of free cash flow.
Financial Performance
Financial Services
The slide explains the business model's impact on free cash flow, highlighting factors like recurring revenue, high renewal rates, and share repurchases.
Recurring Revenue, High Renewal Rates, Contribution Margins, Upfront Invoicing, Low Capital Intensity, Reinvestments for Growth
false
Financial Performance
Financial Services
Diagram
Gartner
Add to my slides
Remove from favorites
The slide presents a column chart with four vertical bars depicting revenue growth over time, from 2017 to a long-term target. The bars are segmented into two parts indicating different revenue sources. To the right, there are three text boxes with additional insights into revenue trends.
Market Analysis and Trends
Financial Services
This slide discusses the growth in recurring revenues, with a focus on management services and revenue goals. It details revenue increases over years, comparison with industry averages, and growth strategy. It’s useful for financial analysts and investors to understand company performance and strategic positioning.
Recurring Revenues, Growth, Management Services, Strategic Goals, CAGR, Competitor Analysis
false
Market Analysis and Trends
Financial Services
Mixed Chart
Goldman Sachs
Add to my slides
Remove from favorites
This slide features a tripartite layout with three content blocks, each with an icon, title, and bullet points describing strategies for increasing recurring revenues. The layout is balanced with equal spacing and a minimalist design.
Strategic Planning
Financial Services
The slide details strategies to increase recurring revenues, focusing on property management business, global corporate services, and investing in predictable businesses. It's aimed at stakeholders interested in understanding and evaluating the company's growth strategies and potential for scaling.
Recurring Revenues, Strategy, Property Management, Global Services, Investment
false
Strategic Planning
Financial Services
Pillar
Goldman Sachs
Add to my slides
Remove from favorites
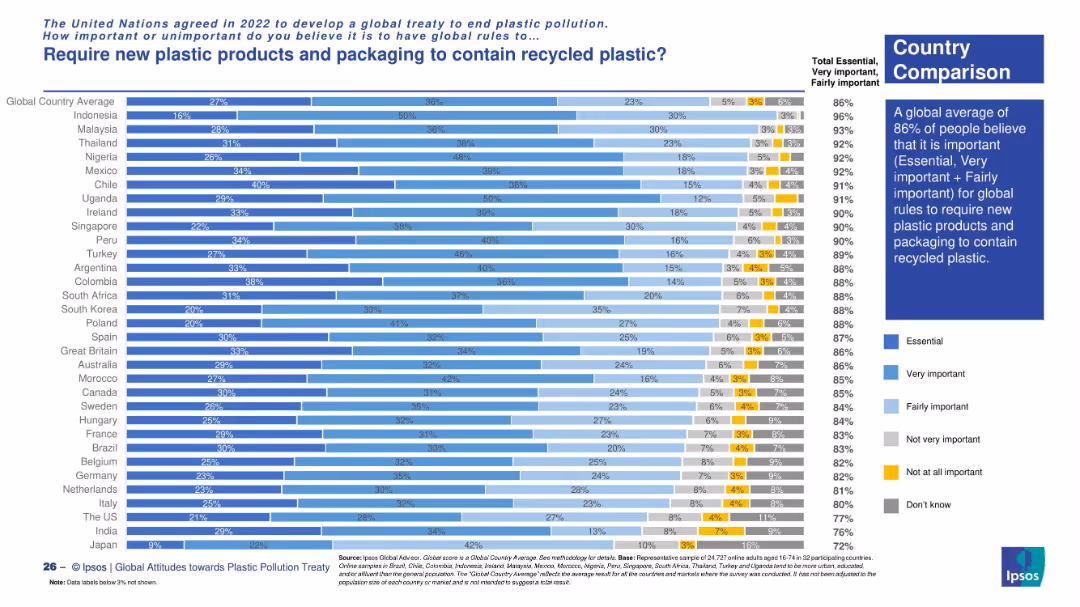
Vertical bar chart with country-level comparison. Bars are segmented by importance level using color gradients. Sidebar summarizes global average opinion and highlights key insights.
Market Analysis and Trends
Environmental Services & Sustainability
This slide displays a country-wise comparison of public support for requiring recycled plastic in new products. It highlights that a global average of 86% consider it important. Countries like Indonesia, Malaysia, and Nigeria show the strongest support for this regulation.
recycled plastic, packaging, consumer views, plastic regulation, sustainability, global treaty, Ipsos survey, country comparison, environmental concern
false
Market Analysis and Trends
Environmental Services & Sustainability
Mixed Chart
IPSOS
Add to my slides
Remove from favorites
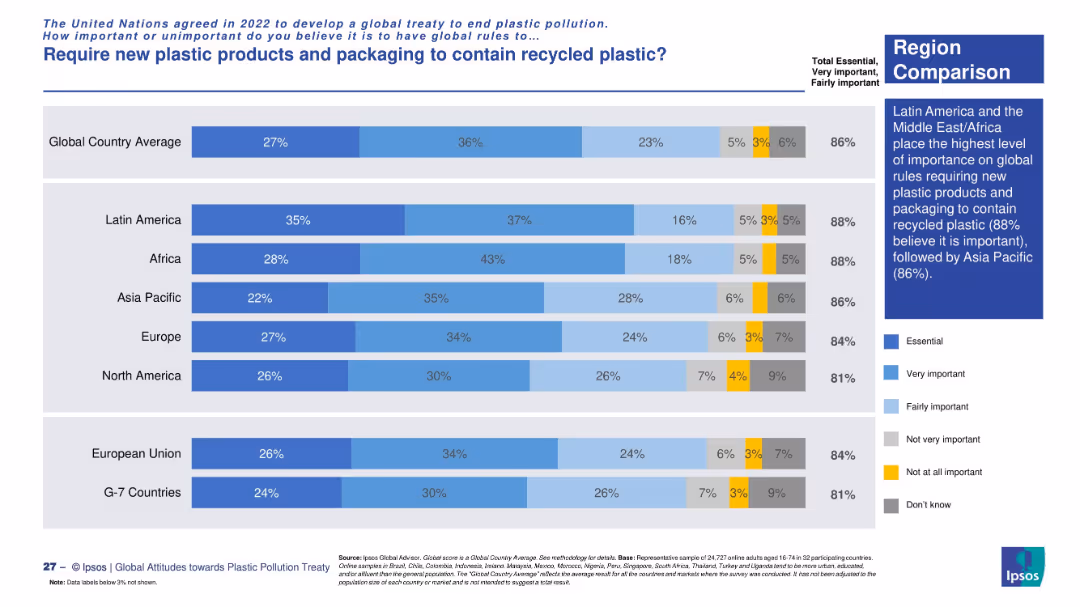
Horizontal stacked bar chart comparing regions. Shades of blue, yellow, and gray represent levels of importance and uncertainty. Side panel emphasizes regional support levels.
Market Analysis and Trends
Environmental Services & Sustainability
This slide shows how different regions value global rules on including recycled plastic in packaging. Latin America and Africa have the highest support (88%), with the Asia Pacific region closely behind. The chart aggregates survey responses into five importance levels.
recycled plastic, sustainability, regional views, plastic regulation, global rules, survey data, Ipsos, Latin America, Africa, Asia Pacific
false
Market Analysis and Trends
Environmental Services & Sustainability
Mixed Chart
IPSOS
Add to my slides
Remove from favorites
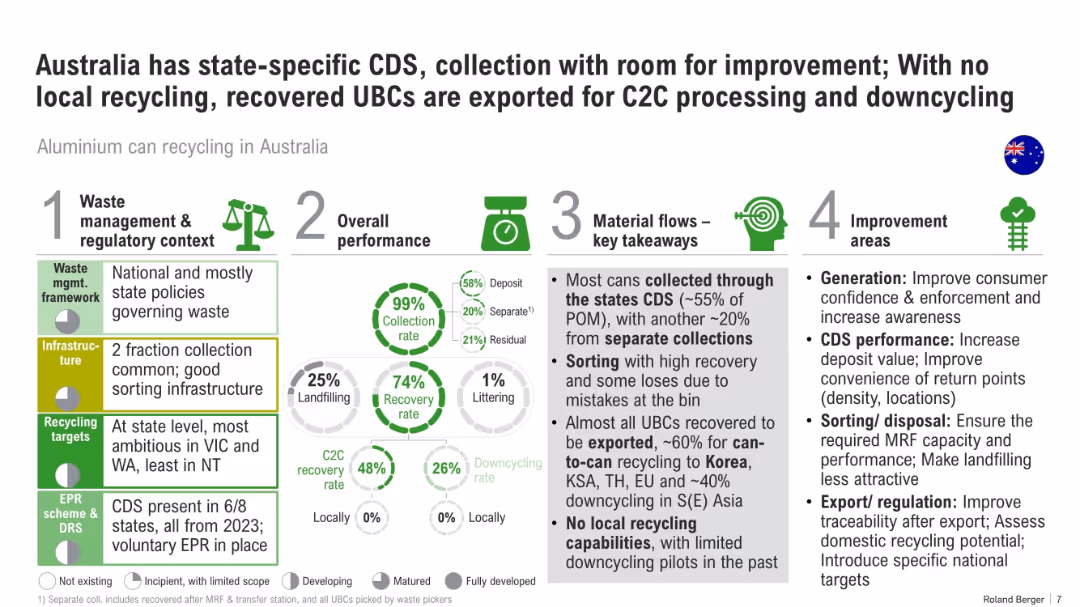
Infographic layout with four vertical blocks: policy, performance, material flow, and improvement. Includes percentages and pie charts.
Regulatory and Compliance
Environmental Services & Sustainability
This slide critiques Australia’s recycling system for aluminum cans. It notes high collection but low local processing, with most material exported. It outlines regulatory structures and areas needing improvement like infrastructure and sorting.
recycling, Australia, CDS, aluminum, policy, downcycling, C2C, export, waste management
false
Regulatory and Compliance
Environmental Services & Sustainability
Multiple Chart
Roland Berger
Add to my slides
Remove from favorites
This slide presents the projected gross value added (GVA) of different segments of Australia's battery industry under a scenario of increased recycling. It uses a bar graph to display the values for mining, refining, active materials, and other stages. Each segment is color-coded, and the graph is complemented by bullet points explaining the significance of recycling in each segment.
Competitive Landscape
Energy & Utilities
Outlines the growth potential in Australia's battery recycling sector, highlighting limited short-term opportunities but significant long-term benefits as domestic battery production increases.
recycling, batteries, Australia, industry growth, gross value added, mining, refining, active materials, long-term potential, environmental sustainability
false
Competitive Landscape
Energy & Utilities
Mixed Chart
Accenture
Add to my slides
Remove from favorites
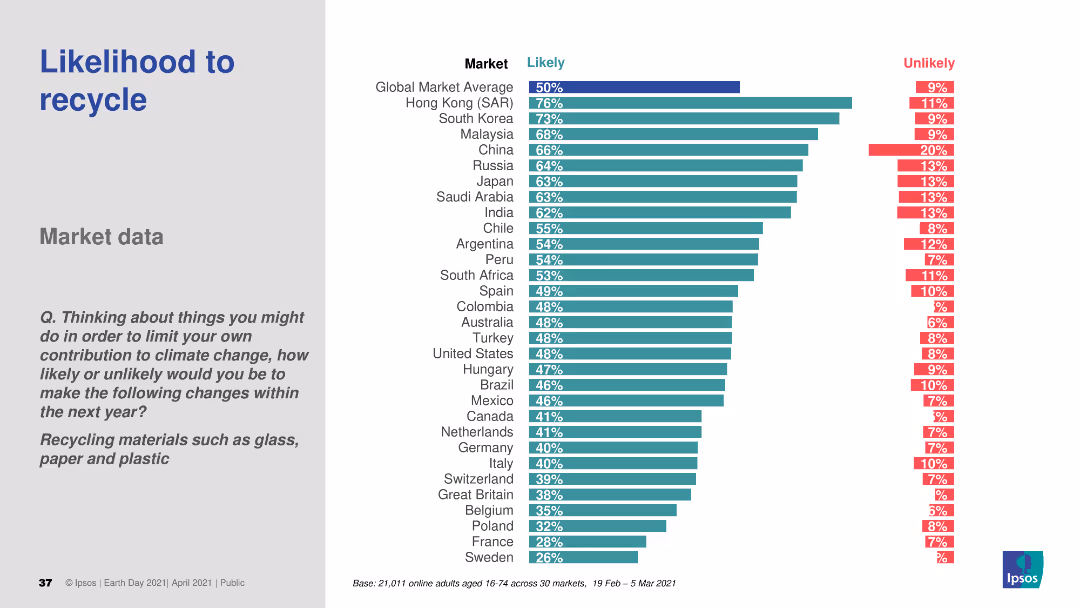
A bar chart (horizontal) illustrating the likelihood of recycling behaviors across various countries. Different colors represent likely and unlikely responses.
Market Analysis and Trends
Environmental Services & Sustainability
This slide provides a comparative analysis of consumer recycling behaviors. It highlights the likelihood of recycling materials like glass, paper, and plastic, offering insights into environmental awareness and practices.
recycling, consumer behavior, sustainability, environmental awareness, comparative data
false
Market Analysis and Trends
Environmental Services & Sustainability
Multiple Chart
IPSOS
Add to my slides
Remove from favorites
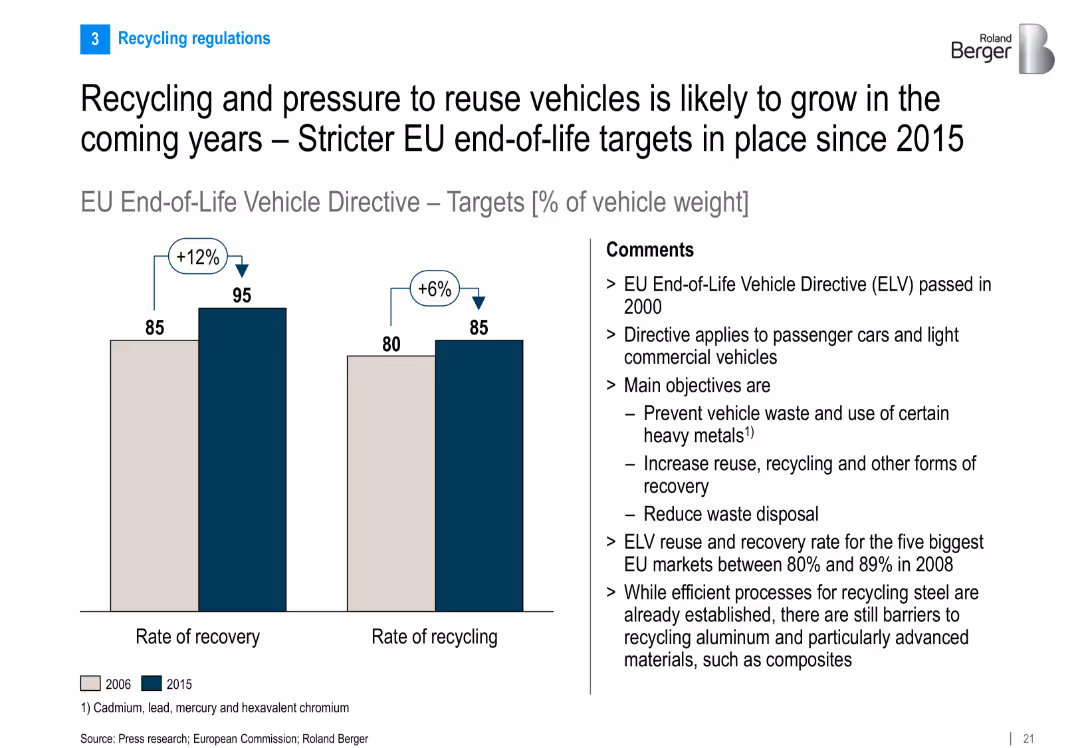
Bar chart compares 2006 vs. 2015 recovery and recycling rates per EU directive; comments discuss policy goals and challenges
Regulatory and Compliance
Industrial & Manufacturing
Discusses EU End-of-Life Vehicle Directive and its targets for recovery and recycling of vehicle weight. Highlights improvements over time and ongoing challenges, particularly with advanced materials.
recycling, ELV directive, EU regulation, vehicle reuse, sustainability, recovery rate, automotive waste
false
Regulatory and Compliance
Industrial & Manufacturing
Mixed Chart
Roland Berger
Add to my slides
Remove from favorites
Previous
Next
You don't have any favorites yet.
Please wait loading your favorites slides...
Create a FREE account to continue browsing
Receive Instant Access to 1,000+ slides from companies like McKinsey, Google, and Goldman Sachs
First Name
Last Name
Email
Password
I agree to all
Terms & Privacy Policy
Thank you! Your submission has been received!
Oops! Something went wrong while submitting the form.
Have an account?
Sign in
Upgrade to PRO to Save slides
Advanced Search and Filters
Access to 15,000+ slides
Access to Category Pages
Save/Bookmark Slides
PowerPoint Template Library
Pick a Plan
MONTHLY
$12/month
Billed every month, Cancel anytime.
YEARLY
$9/year
Billed $108 annually, Cancel anytime.
Checkout for $12/month
Checkout for $108/yr
Secured by Stripe | AES-256 bit encryption