My Account
My Slides
Search by Category
Pricing
Templates
View All Templates
Download Template Slides
✦ AI Search
Feedback
Login
Logout
Get Started
Browse all Slides
Browse all Slides
Create a FREE Account
Instant access to 1,000+ real slides from top companies like McKinsey, BCG, Goldman Sachs, Google and many more!
First Name
Last Name
Email
Password
I agree to all
Terms & Privacy Policy
Thank you! Your submission has been received!
Oops! Something went wrong while submitting the form.
Have an account?
Sign in
Saved Slides
Total No. of slides saved
0
↻ Refresh
✖ Clear all
The slide has a green background with white text and includes icons representing different recyclable materials like paper, glass, plastic, and clothes. Below, it shows icons for e-waste items like washing machines, large kitchen appliances, etc., each with a percentage indicating knowledge on recycling.
Market Analysis and Trends
Environmental Services & Sustainability
This slide highlights that respondents know more about recycling common materials than e-waste, with percentages for various materials and e-waste items. It emphasizes the need for better e-waste recycling knowledge.
recycling, e-waste, knowledge, survey, materials
false
Market Analysis and Trends
Environmental Services & Sustainability
Multiple Chart
Oliver Wyman
Add to my slides
Remove from favorites
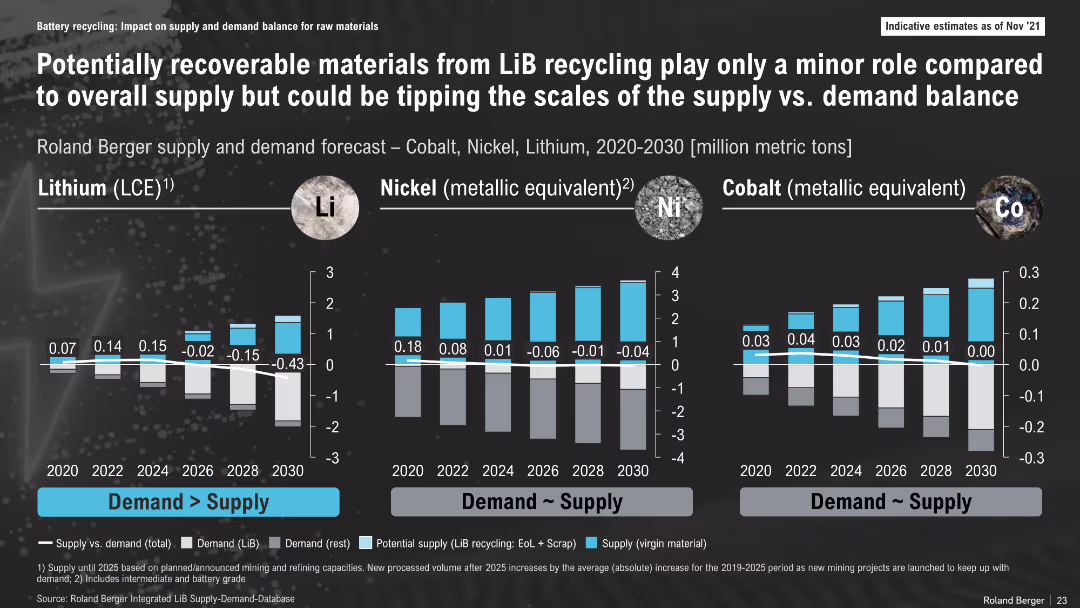
Bar charts for lithium, nickel, and cobalt showing impact of recycled material inclusion in supply forecast; structured similarly to Slide 15391
Risk Assessment and Management
Energy & Utilities
The slide highlights how including recycling contributions narrows the supply-demand gap for critical metals. While still limited in volume, recycled materials can tip the balance toward equilibrium in key markets, notably nickel and cobalt.
Recycling Impact, Supply-Demand, Lithium, Nickel, Cobalt, Battery Recycling, Forecast, Sustainability
false
Risk Assessment and Management
Energy & Utilities
Multiple Chart
Roland Berger
Add to my slides
Remove from favorites
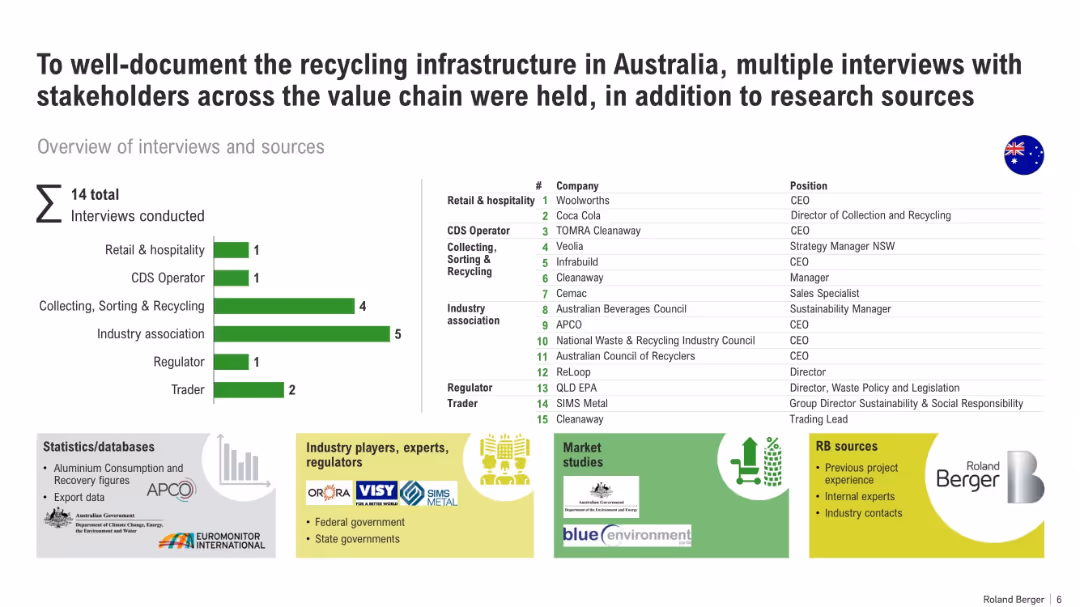
Mixed layout with bar graph (interviews by category), table (company list), and icons representing data sources.
Market Analysis and Trends
Environmental Services & Sustainability
The slide summarizes a stakeholder research effort on Australia's recycling infrastructure. It details interview categories and organizations, data sources, and research methodologies used in mapping the value chain.
recycling, stakeholder interviews, Australia, infrastructure, waste management, data sources, research
false
Market Analysis and Trends
Environmental Services & Sustainability
Mixed Chart
Roland Berger
Add to my slides
Remove from favorites
This slide presents three column charts comparing waste recycling, product take-back, and recycling percentages at the end of life. The charts are color-coded in blue, distributed evenly across the slide.
Operational Efficiency
Environmental Services & Sustainability
The slide examines the recycling inefficiencies in production and end-of-life product management, emphasizing waste in production, product take-back, and recycling rates. It is likely used for sustainability assessments.
recycling, sustainability, waste management, production, end-of-life, inefficiency, take-back, environmental
false
Operational Efficiency
Environmental Services & Sustainability
Multiple Chart
Accenture
Add to my slides
Remove from favorites
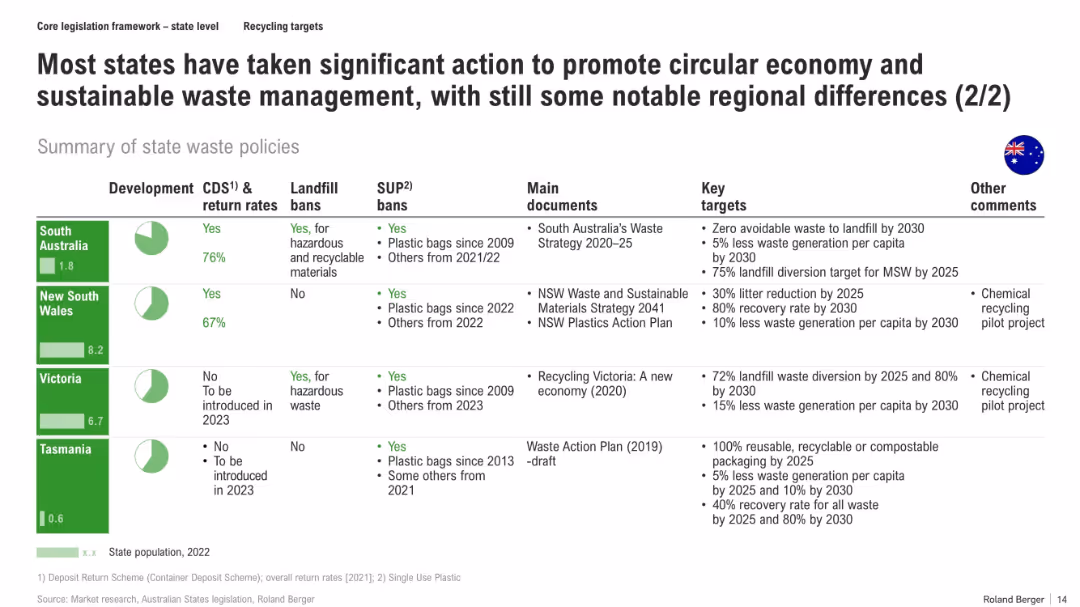
Tabular layout summarizing policies across four states with icons, colored headers, and key targets and comments for each
Regulatory and Compliance
Environmental Services & Sustainability
The slide summarizes waste management developments for South Australia, NSW, Victoria, and Tasmania, including CDS implementation, bans, strategic documents, and ambitious waste diversion/reduction targets. It highlights regional variations and the progressive steps each state has taken.
recycling targets, landfill bans, plastic bag bans, state policies, CDS, circular economy, Australia
false
Regulatory and Compliance
Environmental Services & Sustainability
Mixed Chart
Roland Berger
Add to my slides
Remove from favorites
Column chart showing the number of issuances and redemptions, accompanied by a table with details of 9M23 redemptions including ISIN, instrument, and more.
Financial Performance
Financial Services
Details the bond redemptions by UBS in 2023, providing specific data points for financial analysis and performance review.
Redemptions, Bonds, Financial Data, UBS, 2023
false
Financial Performance
Financial Services
Mixed Chart
UBS
Add to my slides
Remove from favorites
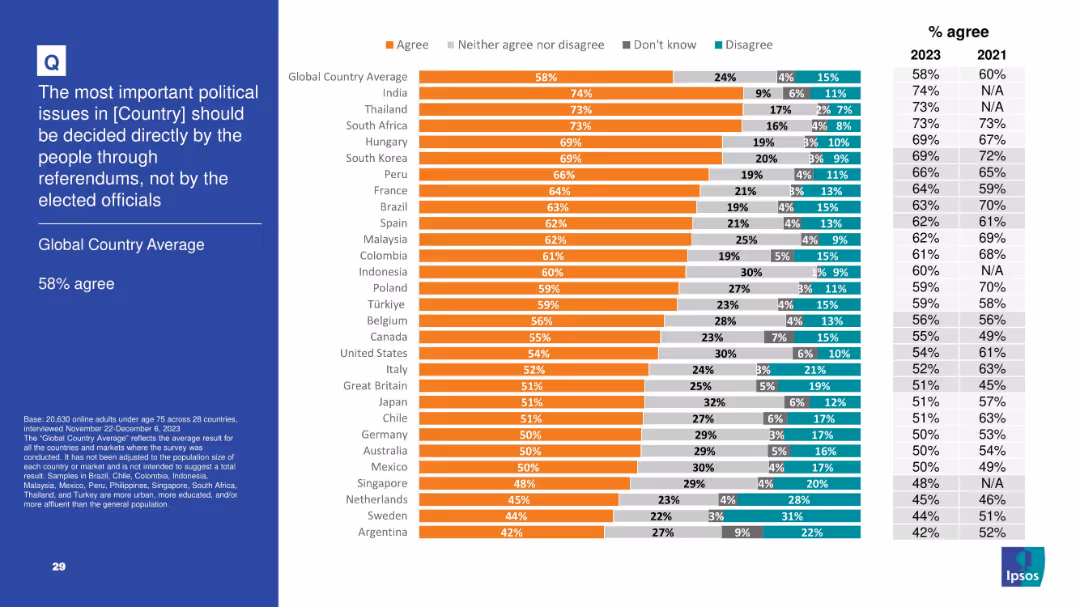
Slide presents bar chart and trend data on agreement with citizen-led decision-making via referendums; left panel contains title and global average.
Regulatory and Compliance
Government & Public Sector
This slide reveals a 58% global average agreeing that political decisions should be made directly by the people rather than elected officials. It illustrates global democratic participation attitudes, with India and Thailand expressing especially strong support for referendums. This trend supports a rise in interest toward direct democracy mechanisms over representative systems.
referendums, democracy, political reform, public decision, governance, Ipsos, civic engagement
false
Regulatory and Compliance
Government & Public Sector
Mixed Chart
IPSOS
Add to my slides
Remove from favorites
Layout consistent with other Ipsos slides, combining chart and sidebar info.
Regulatory and Compliance
Government & Public Sector
This slide reflects populist democratic sentiment, with 58% average agreement favoring referendums over elected officials. India, Thailand, and South Africa have the highest agreement, showing demand for direct civic engagement.
referendums, direct democracy, political issues, governance, civic trust
false
Regulatory and Compliance
Government & Public Sector
Mixed Chart
IPSOS
Add to my slides
Remove from favorites
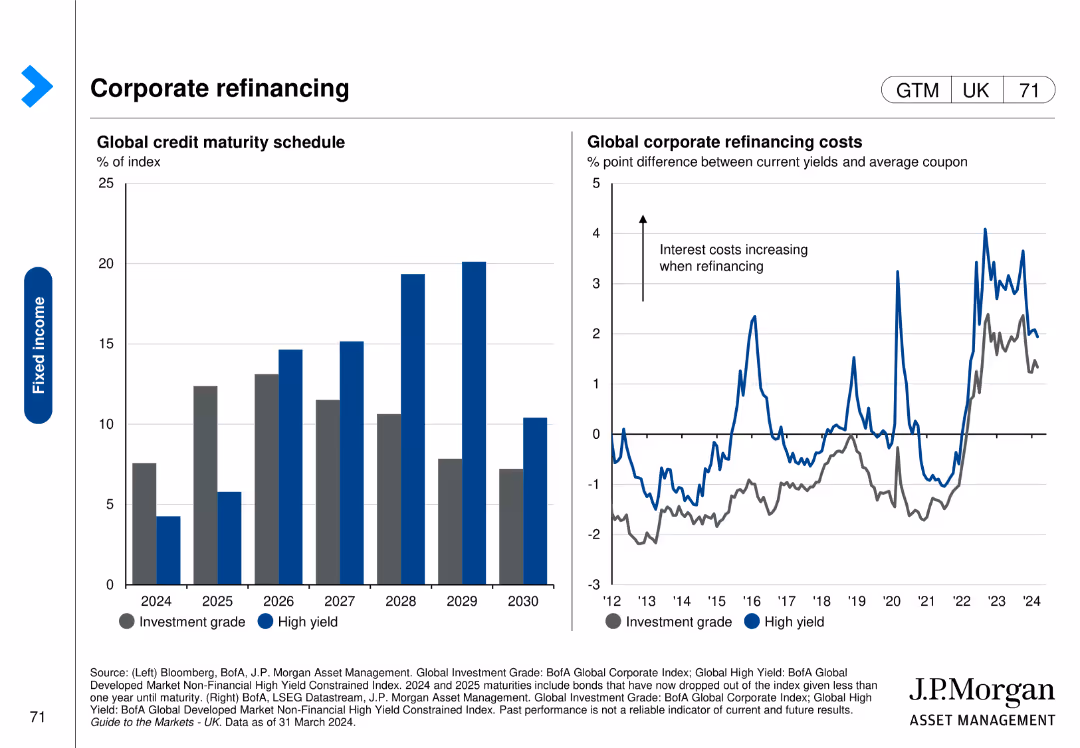
This slide includes a column chart on the left showing the global credit maturity schedule and a line chart on the right detailing global corporate refinancing costs over time.
Risk Assessment and Management
Financial Services
The slide examines the global corporate refinancing landscape, focusing on the maturity schedule of credit and the impact on refinancing costs.
refinancing, corporate, credit, maturity schedule, costs
false
Risk Assessment and Management
Financial Services
Multiple Chart
JP Morgan
Add to my slides
Remove from favorites
Slide includes bar charts comparing potential production costs for refining and producing active materials in different cities, focusing on cost advantages in Australia.
Financial Performance
Financial Services
Compares production costs for refining and active materials in various global locations, highlighting Perth and Brisbane as potential low-cost producers if mining and refining are integrated.
refining costs, production costs, global comparison, Australia
false
Financial Performance
Financial Services
Multiple Chart
Accenture
Add to my slides
Remove from favorites
A collection of column charts and feedback statements evaluating the pace of governmental reforms and sentiments towards governmental actions in France.
Regulatory and Compliance
Government & Public Sector
Analyzes opinions on the pace and effectiveness of governmental reforms in France, including insights into public sentiment and expectations from business leaders.
reforms, France, government, pace, public opinion
false
Regulatory and Compliance
Government & Public Sector
Multiple Chart
Bain
Add to my slides
Remove from favorites
The slide features a circular segmented diagram in red and yellow shades, each segment titled with a different reform area like 'Small Business Tax Registration' and 'Post Tax Amnesty'.
Regulatory and Compliance
Government & Public Sector
Outlines various governmental reforms in areas such as tax amnesty, small business registration, and transfer pricing, targeting an audience interested in the broader scope of Namibia's fiscal policy changes in 2018.
reforms, tax, government, Namibia, 2018, transfer pricing, amnesty, registration
false
Regulatory and Compliance
Government & Public Sector
Linear Flow
PwC/Strategy&
Add to my slides
Remove from favorites
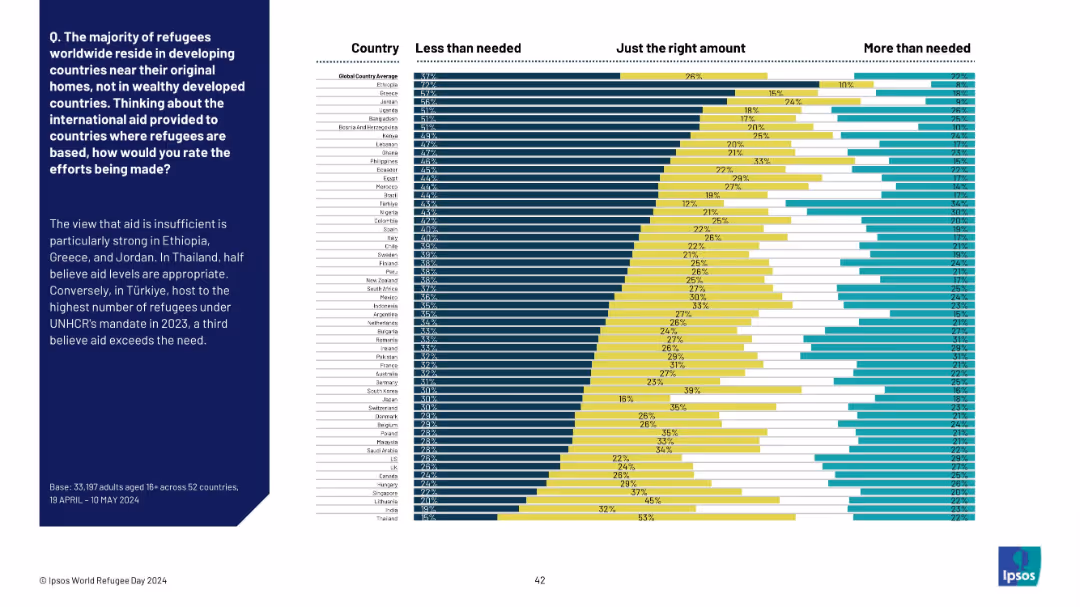
Vertical country-by-country bar chart with three response segments (less than needed, just right, more than needed). Left-hand sidebar with summary insights.
Risk Assessment and Management
Government & Public Sector
This slide breaks down opinions by country on whether international aid for refugees is sufficient. It shows which countries perceive the aid as insufficient, adequate, or excessive, highlighting trends and outliers.
refugee aid, global attitudes, country comparison, public opinion, sufficiency, Ipsos, international support, humanitarian response
false
Risk Assessment and Management
Government & Public Sector
Mixed Chart
IPSOS
Add to my slides
Remove from favorites
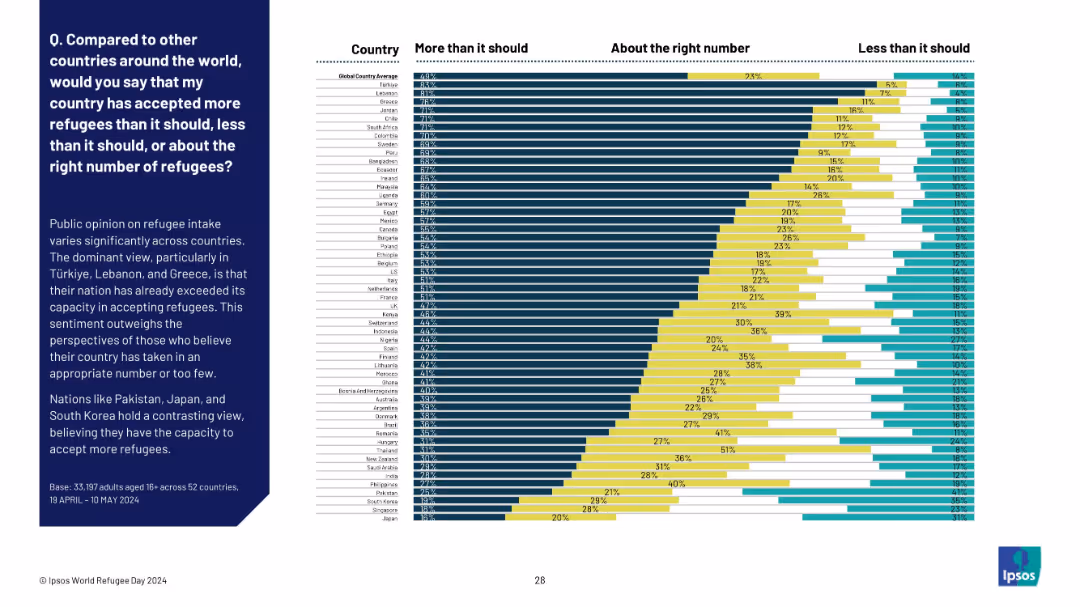
Country-by-country horizontal stacked bar chart
Market Analysis and Trends
Government & Public Sector
Similar to slide 19908 but at the country level, this visualization shows national attitudes toward refugee intake. Türkiye and Lebanon top the list for believing their countries have exceeded capacity, while Japan and South Korea indicate room for increased acceptance.
refugee capacity, country comparison, Ipsos, over-intake, under-intake, perceptions
false
Market Analysis and Trends
Government & Public Sector
Mixed Chart
IPSOS
Add to my slides
Remove from favorites
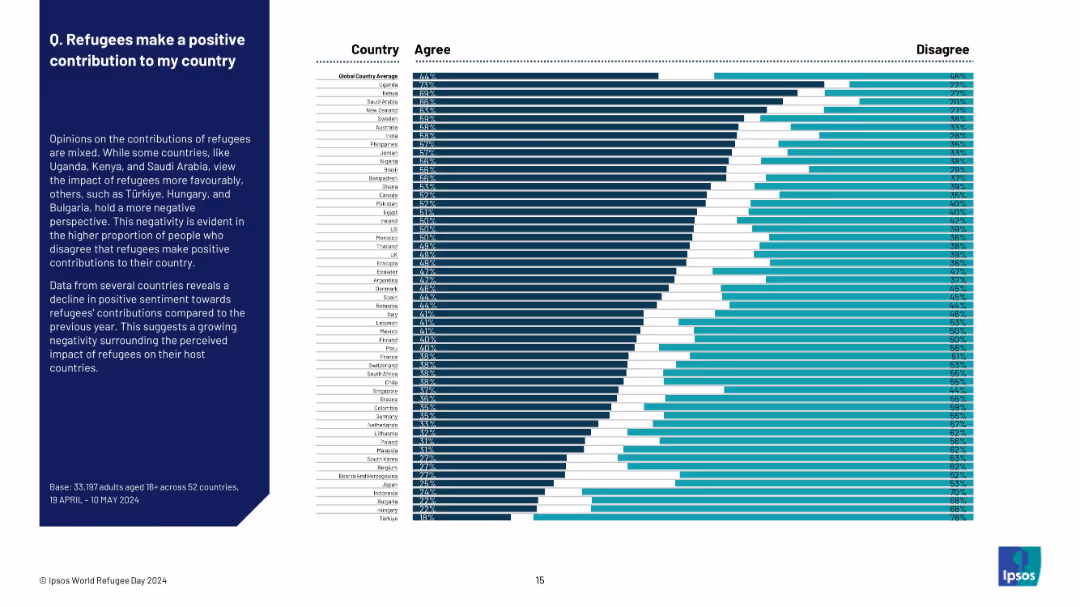
Horizontal bar chart by country showing agreement and disagreement. Explanatory paragraph on left, data on right. Title in bold, structured layout.
Regulatory and Compliance
Government & Public Sector
This slide examines the belief that refugees positively contribute to their host countries. Uganda and Kenya show highest agreement (67%), while Türkiye and Hungary show the least (under 20%). Overall global average agreement is 44%, indicating relatively low positive sentiment. The chart also suggests declining optimism compared to previous years.
refugee contribution, societal benefit, negative sentiment, Ipsos, immigration, public opinion, global attitudes, national rankings
false
Regulatory and Compliance
Government & Public Sector
Mixed Chart
IPSOS
Add to my slides
Remove from favorites
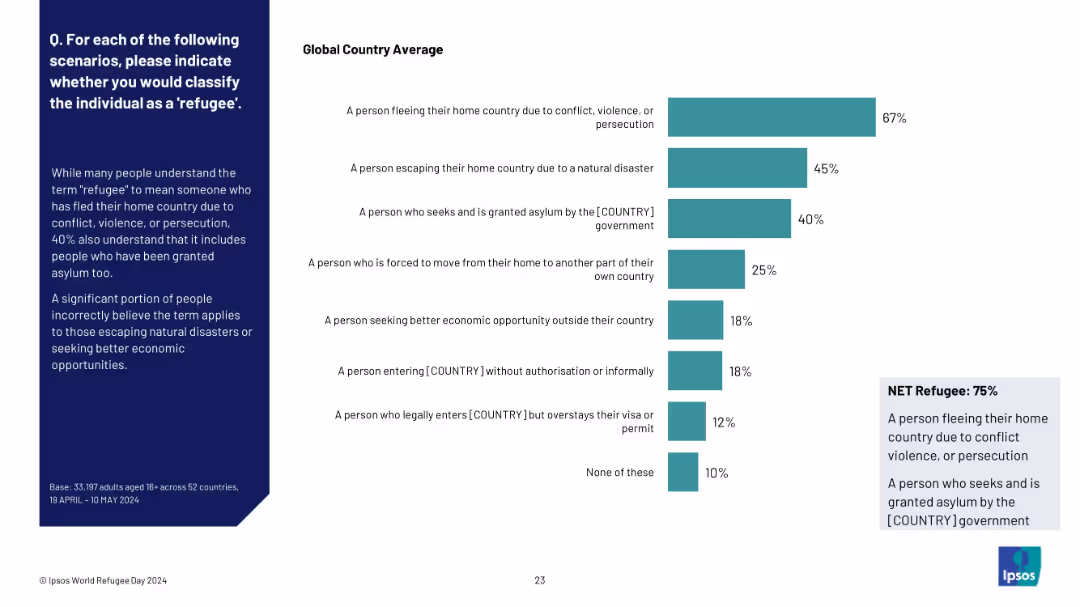
Side-by-side layout with a classification bar chart showing varying understandings of "refugee"
Regulatory and Compliance
Government & Public Sector
The slide evaluates public understanding of who qualifies as a refugee. Most correctly identify those fleeing violence/persecution or granted asylum, but many also incorrectly include those fleeing disasters or seeking better jobs. The "Net Refugee" figure is 75%.
refugee definition, public understanding, asylum, classification, migration types, Ipsos, global perception
false
Regulatory and Compliance
Government & Public Sector
Mixed Chart
IPSOS
Add to my slides
Remove from favorites
Matrix-style bar chart with five national domains across three sentiment categories
Risk Assessment and Management
Government & Public Sector
The slide presents predicted impacts of refugees on labor, culture, economy, public services, and security. While opinions are mixed, concern outweighs optimism, particularly for national security and public services. Around a third anticipate positive impact across domains.
refugee impact, future outlook, national security, public services, Ipsos, labor market, sentiment analysis
false
Risk Assessment and Management
Government & Public Sector
Mixed Chart
IPSOS
Add to my slides
Remove from favorites
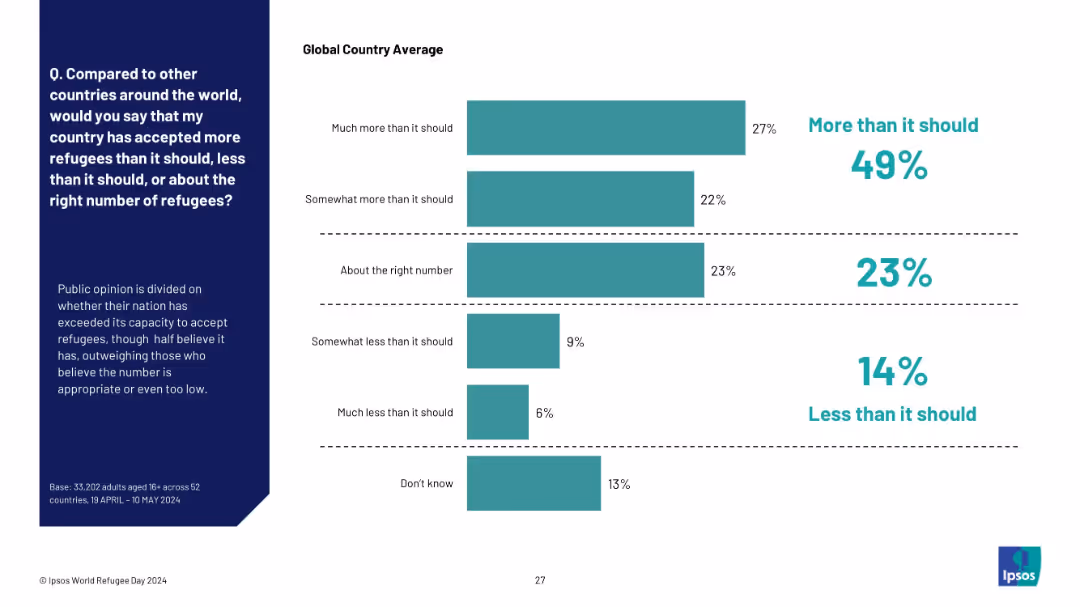
Horizontal bar chart showing opinion distribution across five response categories
Market Analysis and Trends
Government & Public Sector
This slide captures public perception of refugee intake adequacy. Nearly half believe their country has accepted more refugees than it should, while only 14% say less and 23% feel it is about right. The data reflects perceived national capacity and sentiment toward refugee volumes.
refugee intake, capacity perception, Ipsos, global opinion, immigration, volume judgment
false
Market Analysis and Trends
Government & Public Sector
Mixed Chart
IPSOS
Add to my slides
Remove from favorites
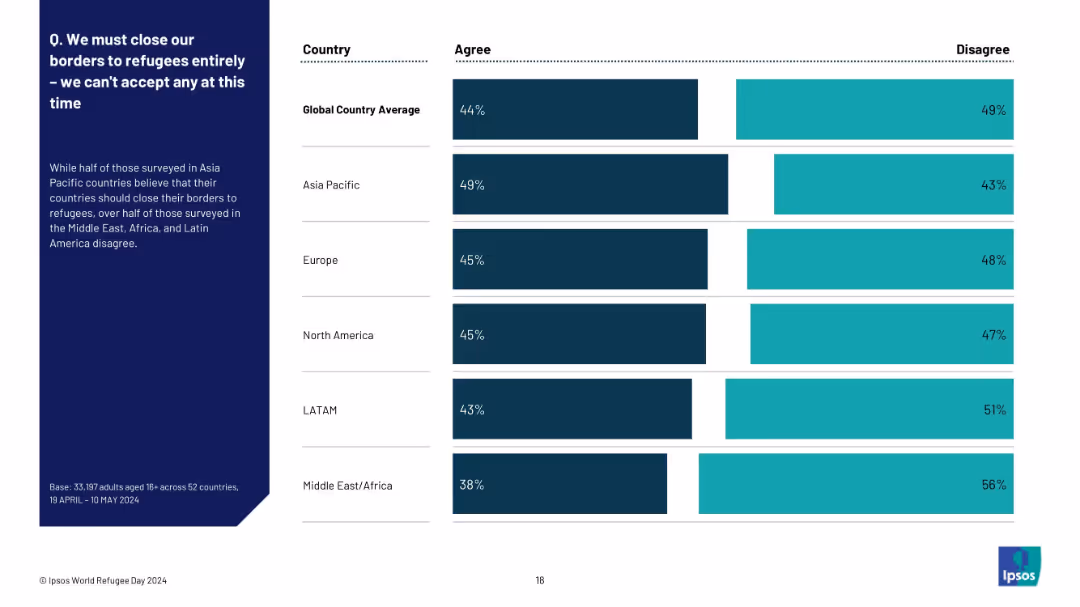
Similar layout to 19901; left text explanation with a regional breakdown bar chart on the right
Market Analysis and Trends
Government & Public Sector
The slide focuses on regional views of closing borders to refugees. Asia Pacific has the highest agreement rate, while Middle East/Africa and LATAM are more opposed. It complements slide 19902 by summarizing views at the regional rather than country level.
refugee policy, regional attitudes, border control, Ipsos, regional breakdown, public opinion, immigration
false
Market Analysis and Trends
Government & Public Sector
Mixed Chart
IPSOS
Add to my slides
Remove from favorites
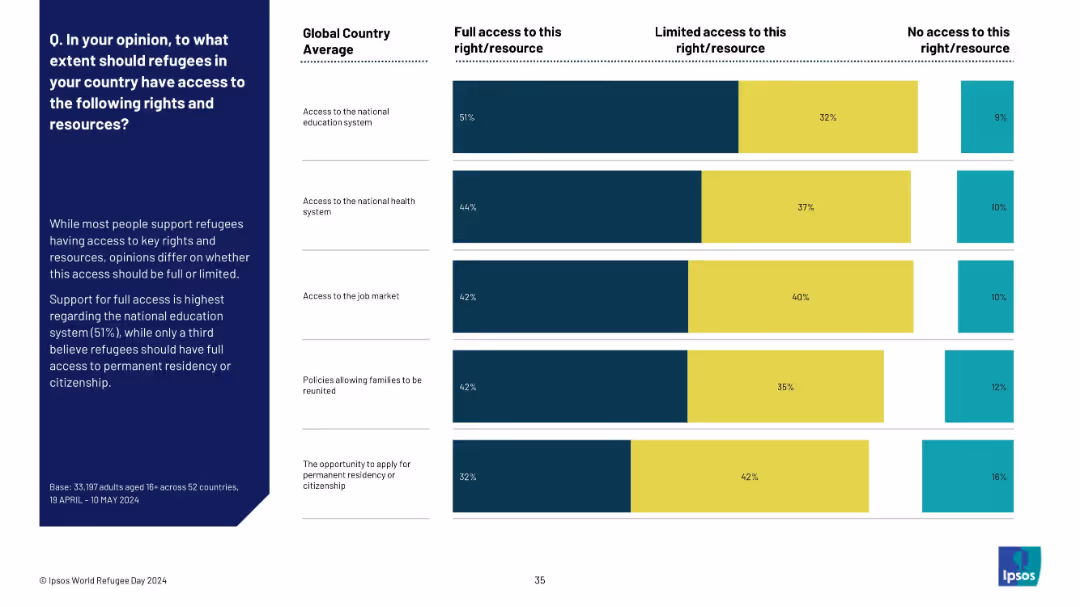
Simplified horizontal stacked bar chart summarizing access rights (education, health, jobs, etc.).
Regulatory and Compliance
Government & Public Sector
This slide shows the global average opinion on whether refugees should have full, limited, or no access to national systems like education, healthcare, jobs, and citizenship. Most support some level of access, with full access varying.
refugees, access rights, healthcare, education, job market, citizenship, public opinion, human rights, survey
false
Regulatory and Compliance
Government & Public Sector
Mixed Chart
IPSOS
Add to my slides
Remove from favorites
Combines column charts and illustrations depicting accommodation situations of refugees.
Operational Efficiency
Government & Public Sector
Discusses current accommodation status and future expectations of refugees.
refugees, accommodation, Poland, future outlook
false
Operational Efficiency
Government & Public Sector
Mixed Chart
Deloitte
Add to my slides
Remove from favorites
Slide includes two pie charts with color contrasts comparing age groups.
Customer and Market Segmentation
Government & Public Sector
Analyzes age demographics of refugees with data from a survey and official statistics.
refugees, age demographics, segmentation, statistics
false
Customer and Market Segmentation
Government & Public Sector
Multiple Chart
Deloitte
Add to my slides
Remove from favorites
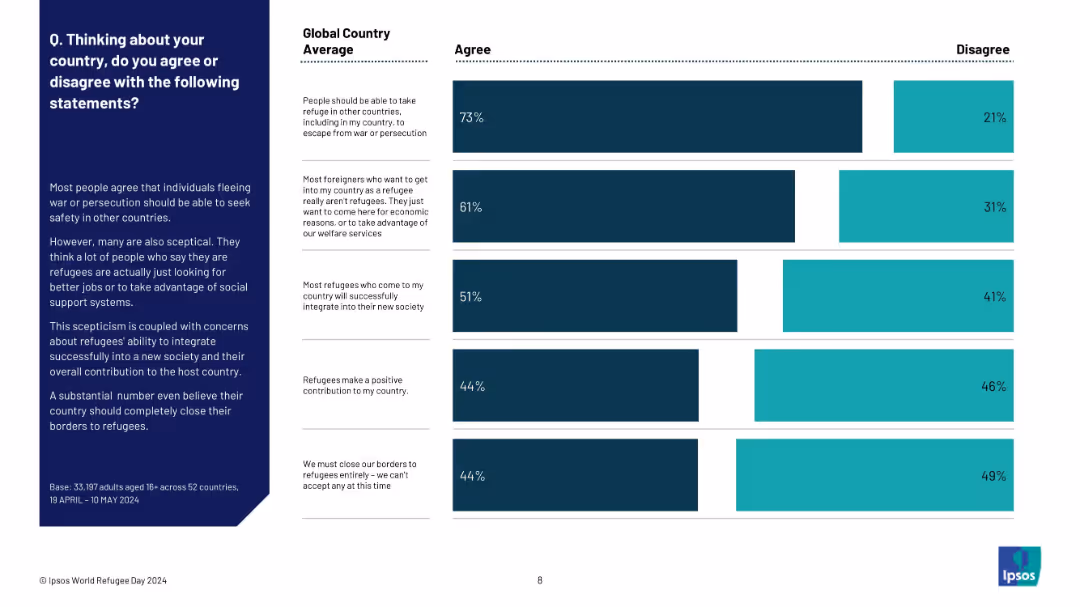
Vertical bar chart with multiple statements showing global average agreement and disagreement percentages about refugee policies. Dark blue bars indicate agreement, teal bars indicate disagreement.
Regulatory and Compliance
Government & Public Sector
This slide aggregates global public opinion on refugee issues such as asylum rights, refugee integration, economic motivation skepticism, and border closures. Highest agreement (73%) is for offering asylum to those fleeing war, while only 44% believe refugees make a positive contribution or oppose closing borders. Skepticism and division are evident in responses.
refugees, asylum, global opinion, skepticism, integration, welfare concerns, Ipsos, public perception, refugee policy
false
Regulatory and Compliance
Government & Public Sector
Mixed Chart
IPSOS
Add to my slides
Remove from favorites
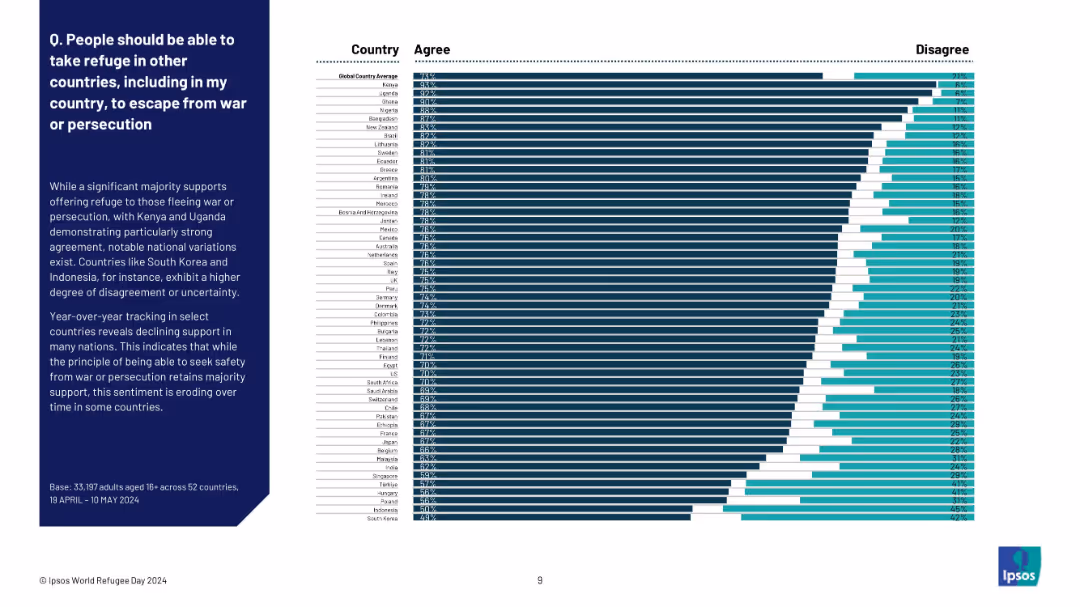
Bar chart showing agreement/disagreement by country. Left-aligned text and explanatory notes on left; data on right in ranked order with dark blue and teal bars.
Regulatory and Compliance
Government & Public Sector
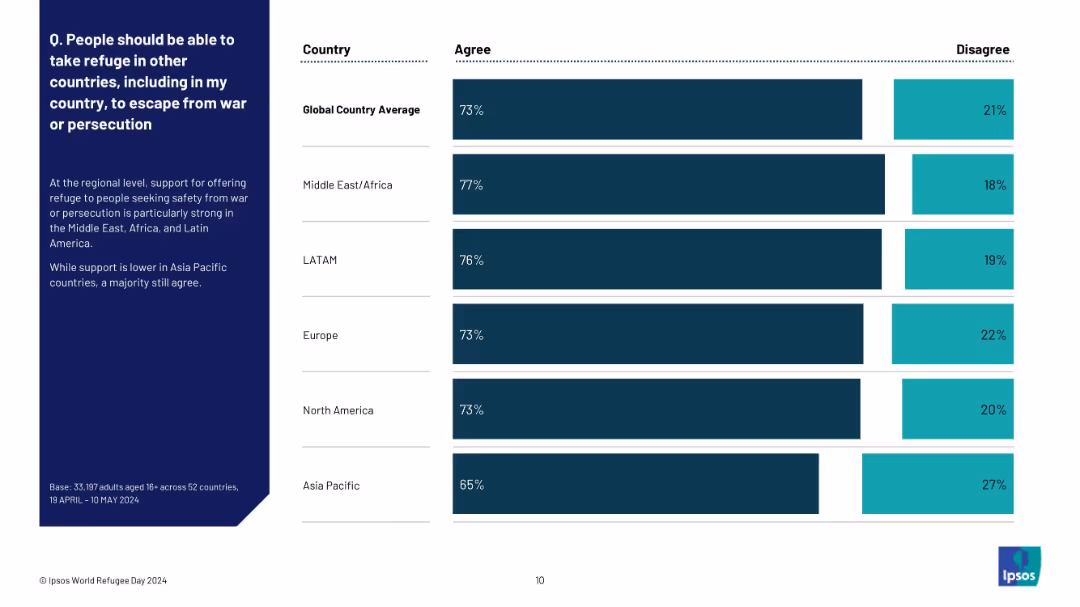
This slide presents a country-level breakdown of support for offering refuge to those fleeing war or persecution. Kenya and Uganda show the highest agreement (over 90%), while South Korea and Indonesia show the lowest. It also notes regional differences and trends over time. The global average agreement stands at 73%.
refugees, asylum, support levels, global sentiment, Ipsos, war, persecution, policy, national differences, international comparison
false
Regulatory and Compliance
Government & Public Sector
Mixed Chart
IPSOS
Add to my slides
Remove from favorites
Column chart displaying major barriers faced by refugees in accessing services.
Risk Assessment and Management
Government & Public Sector
Identifies and quantifies barriers to service access for refugees.
refugees, barriers, access to services, analysis
false
Risk Assessment and Management
Government & Public Sector
Single Chart
Deloitte
Add to my slides
Remove from favorites
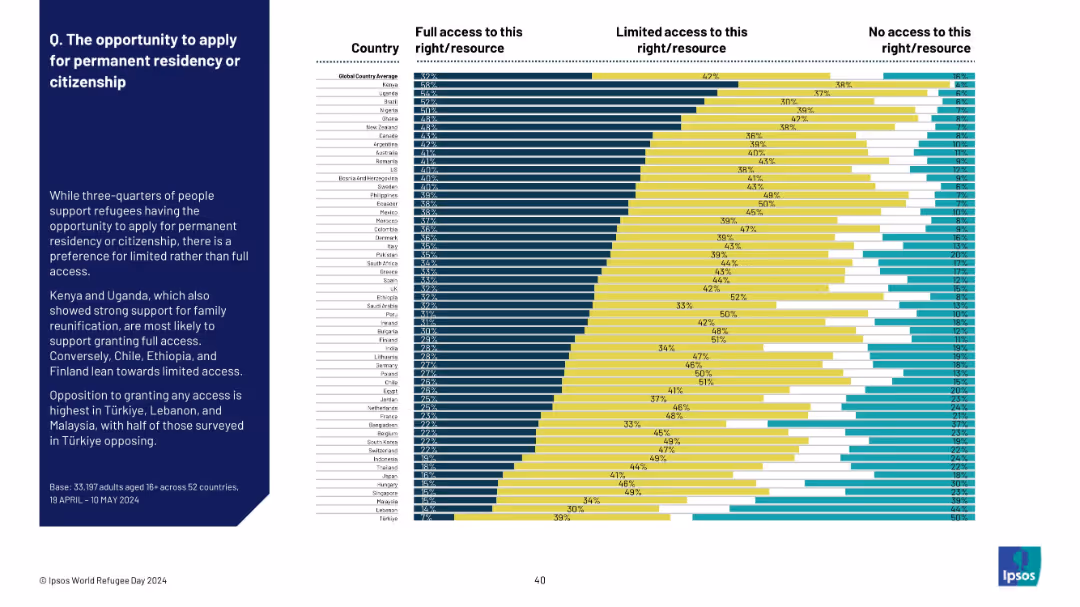
Bar chart showing three-tier access (full, limited, none) across countries, with a paragraph of insights on the left in a dark-blue sidebar. Clean, data-driven layout with emphasis on comparative support for refugee rights.
Regulatory and Compliance
Government & Public Sector
This slide compares global public opinion on whether refugees should have access to permanent residency or citizenship, showing preferences for full, limited, or no access. It highlights countries with the strongest support or resistance to full access.
refugees, citizenship, residency, public opinion, access rights, countries, Ipsos, global survey, support levels, immigration policy
false
Regulatory and Compliance
Government & Public Sector
Mixed Chart
IPSOS
Add to my slides
Remove from favorites
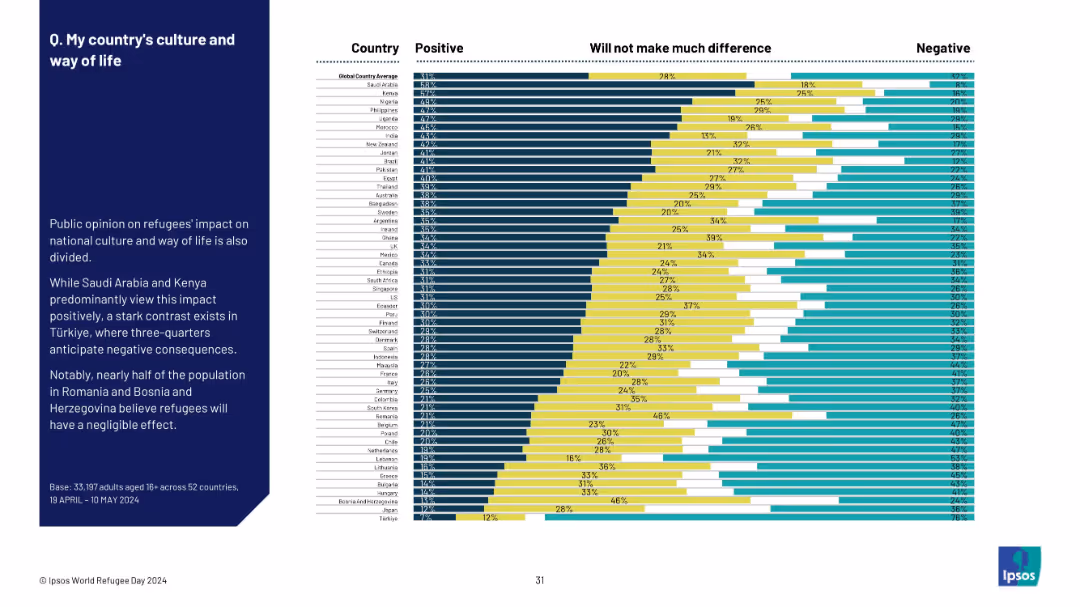
Similar visual style: bar chart by country with summary on the left; divided by impact perception.
Market Analysis and Trends
Government & Public Sector
This slide shows how public opinion on refugees' impact on national culture varies by country. While Saudi Arabia and Kenya are optimistic, countries like Türkiye are more negative. Bosnia sees the impact as mostly neutral.
refugees, culture, national identity, public opinion, Ipsos, global perception, sentiment, national values, integration
false
Market Analysis and Trends
Government & Public Sector
Mixed Chart
IPSOS
Add to my slides
Remove from favorites
Contains pie charts and text discussing gender demographic of refugees.
Organizational Structure and Change
Government & Public Sector
Highlights gender demographics of refugees based on survey data and official statistics.
refugees, demographics, gender, survey data
false
Organizational Structure and Change
Government & Public Sector
Multiple Chart
Deloitte
Add to my slides
Remove from favorites
Text-heavy slide discussing refugee documentation in Poland.
Regulatory and Compliance
Government & Public Sector
Explores documentation status of Ukrainian refugees in Poland and its implications.
refugees, documentation, Poland, compliance
false
Regulatory and Compliance
Government & Public Sector
Mixed Chart
Deloitte
Add to my slides
Remove from favorites
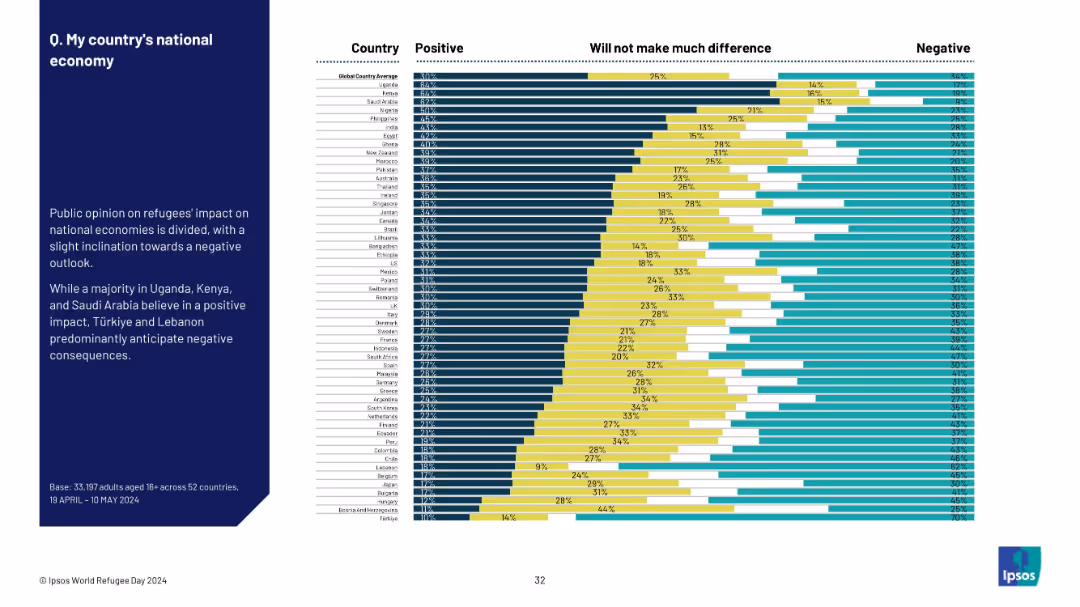
Bar chart split into Positive/Neutral/Negative sections by country; dark blue sidebar with text insights.
Market Analysis and Trends
Government & Public Sector
Public opinion on the economic impact of refugees is mixed globally. Uganda and Kenya show positive sentiment, while Türkiye and Lebanon show high negativity. The chart conveys global sentiment distribution clearly.
refugees, economy, sentiment, economic impact, national economy, Ipsos, survey results, perceptions, cross-country comparison
false
Market Analysis and Trends
Government & Public Sector
Mixed Chart
IPSOS
Add to my slides
Remove from favorites
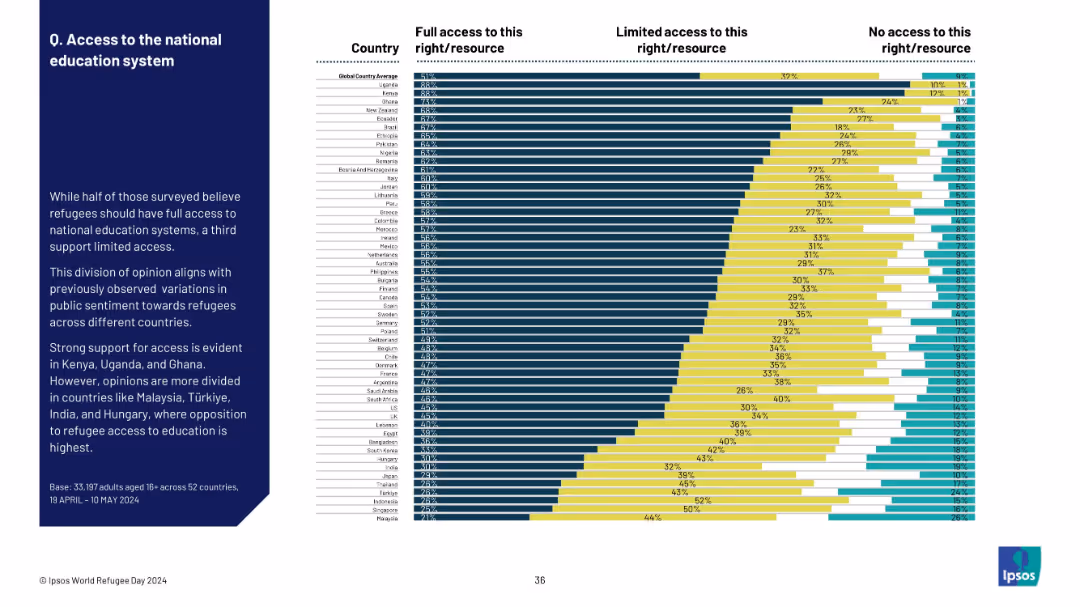
Ranked bar chart by country showing levels of support for refugee education access; detailed segmentation.
Regulatory and Compliance
Government & Public Sector
The slide shows that most countries support some level of refugee access to national education systems. Uganda and Kenya show the strongest support, while Türkiye, India, and Hungary show the most opposition.
refugees, education access, national systems, public opinion, support levels, global comparison, sentiment
false
Regulatory and Compliance
Government & Public Sector
Mixed Chart
IPSOS
Add to my slides
Remove from favorites
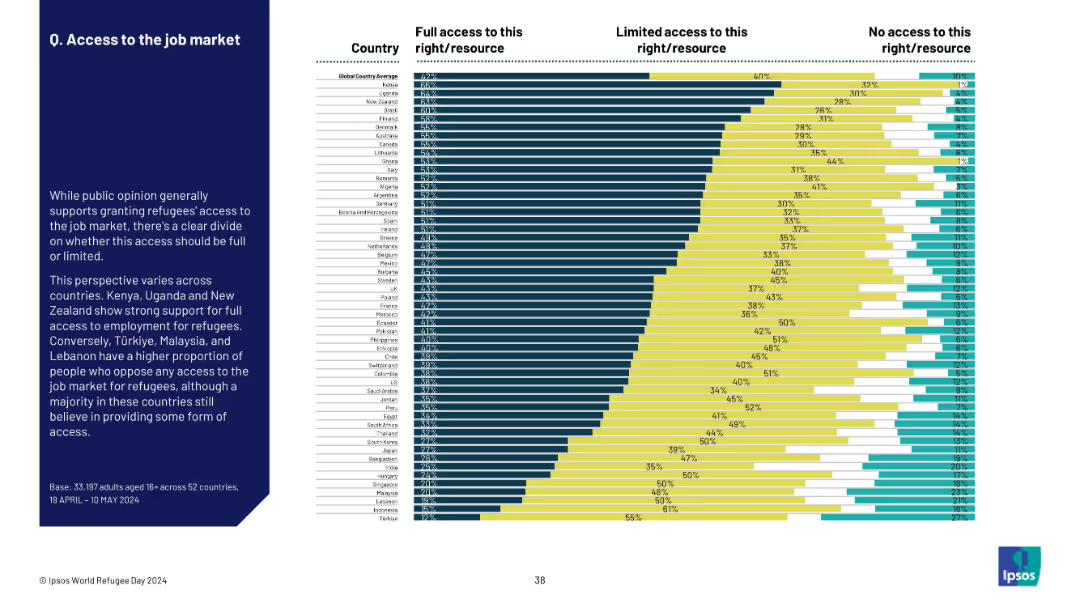
Country-ranked chart with horizontal bars for full, limited, and no access to employment for refugees.
Regulatory and Compliance
Government & Public Sector
The slide explores global support for refugee access to job markets. Kenya and Uganda show highest support for full access. Türkiye and Malaysia lean more toward restricted or no access, reflecting differing national sentiments.
refugees, employment, access, job market, public opinion, national policy, economic inclusion, Ipsos
false
Regulatory and Compliance
Government & Public Sector
Mixed Chart
IPSOS
Add to my slides
Remove from favorites
Slide with map and pie charts showing family and care responsibilities of refugees.
Client Case Studies
Government & Public Sector
Discusses familial responsibilities of refugees traveling to Poland.
refugees, family, care responsibilities, Poland
false
Client Case Studies
Government & Public Sector
Multiple Chart
Deloitte
Add to my slides
Remove from favorites
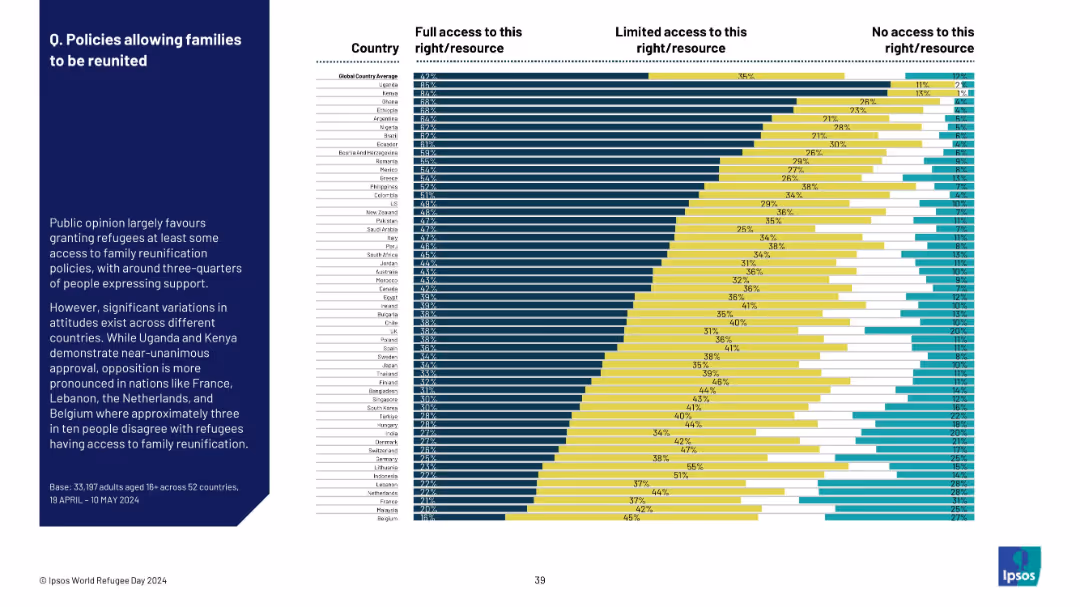
Bar chart by country, showing support levels for family reunification policies; full/limited/no access.
Regulatory and Compliance
Government & Public Sector
This slide shows public support for refugee family reunification policies. Uganda and Kenya display strong support, while countries like Belgium, Malaysia, and France show notable opposition to such access.
refugees, family reunification, access rights, support levels, policy perception, public sentiment, Ipsos
false
Regulatory and Compliance
Government & Public Sector
Mixed Chart
IPSOS
Add to my slides
Remove from favorites
Bar chart presenting future plans of refugees regarding their stay in Poland.
Strategic Planning
Government & Public Sector
Analyzes the future intentions of refugees in Poland based on survey data.
refugees, future plans, Poland, survey data
false
Strategic Planning
Government & Public Sector
Single Chart
Deloitte
Add to my slides
Remove from favorites
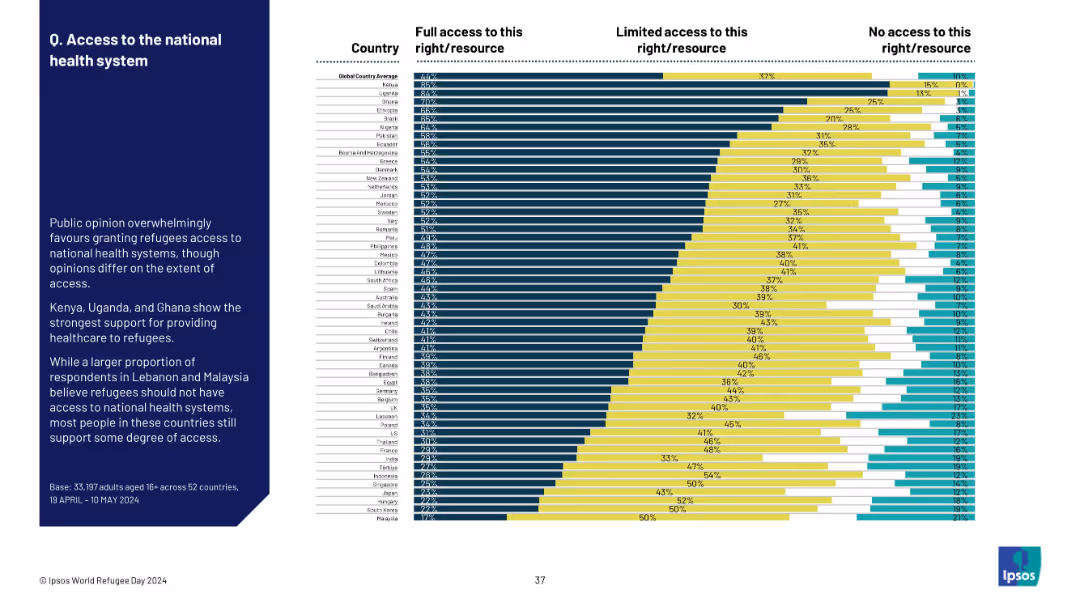
Bar chart by country showing sentiment on health system access; divided into full, limited, and no access.
Regulatory and Compliance
Government & Public Sector
The slide indicates strong global support for allowing refugees access to national healthcare, though countries differ on whether this should be full or limited. Kenya and Uganda lead in support, while Malaysia shows more resistance.
refugees, healthcare access, national systems, global opinion, full vs limited access, sentiment, public services, policy support
false
Regulatory and Compliance
Government & Public Sector
Mixed Chart
IPSOS
Add to my slides
Remove from favorites
Column charts and stats about income levels and sources of financial support for refugees.
Financial Performance
Government & Public Sector
Reviews financial conditions of refugees and the support they receive.
refugees, income, financial support, Poland
false
Financial Performance
Government & Public Sector
Multiple Chart
Deloitte
Add to my slides
Remove from favorites
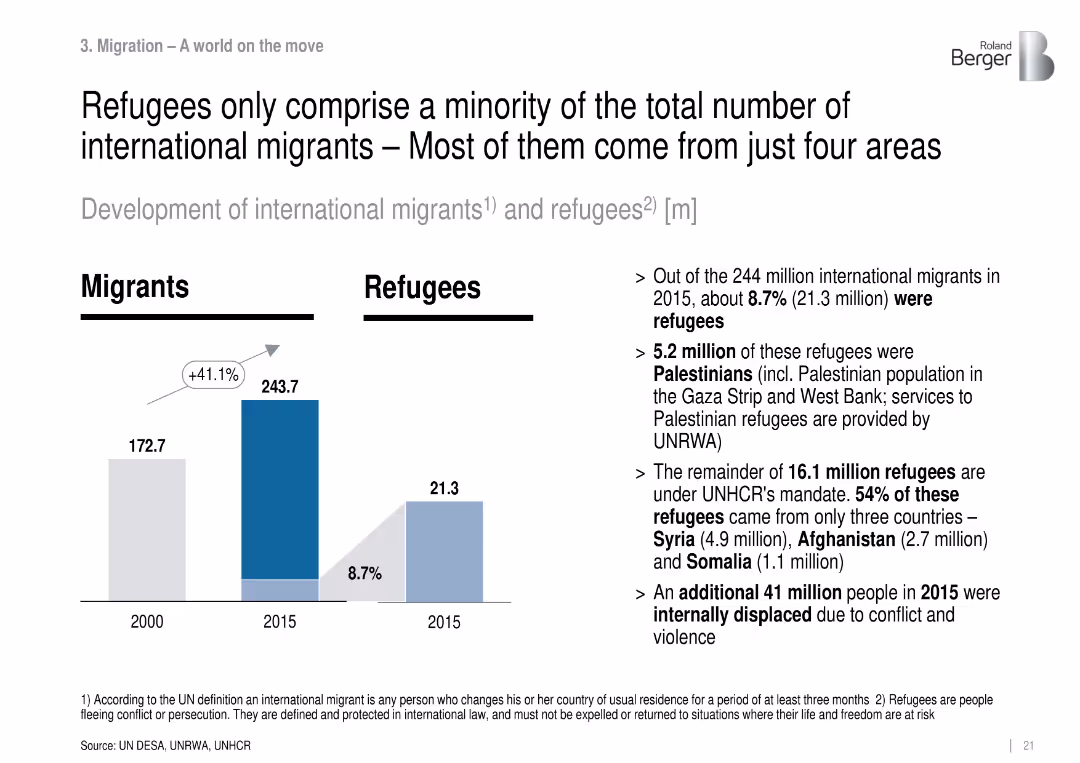
Bar chart showing total international migrants vs. refugee numbers in 2000 and 2015; includes explanatory text.
Regulatory and Compliance
Government & Public Sector
This slide separates refugees from general international migrants, emphasizing that refugees are only 8.7% of the 2015 total. Most refugees originate from four key conflict zones: Syria, Palestine, Afghanistan, and Somalia.
refugees, international migrants, conflict zones, UNHCR, population displacement, migration statistics
false
Regulatory and Compliance
Government & Public Sector
Mixed Chart
Roland Berger
Add to my slides
Remove from favorites
Country-level bar chart ranked by agreement/disagreement. Title in bold, summary explanation on left, horizontal bars showing % agree/disagree on right.
Risk Assessment and Management
Government & Public Sector
This slide showcases global skepticism towards refugee legitimacy. The global average agreement is 61%, with Peru and Lithuania at the top (70%+ agreement) and Ethiopia and New Zealand at the bottom (~41%). Many people believe refugees are motivated by economic gain rather than genuine need.
refugee skepticism, economic migrants, public opinion, Ipsos, global survey, country rankings, welfare concern, immigration policy
false
Risk Assessment and Management
Government & Public Sector
Mixed Chart
IPSOS
Add to my slides
Remove from favorites
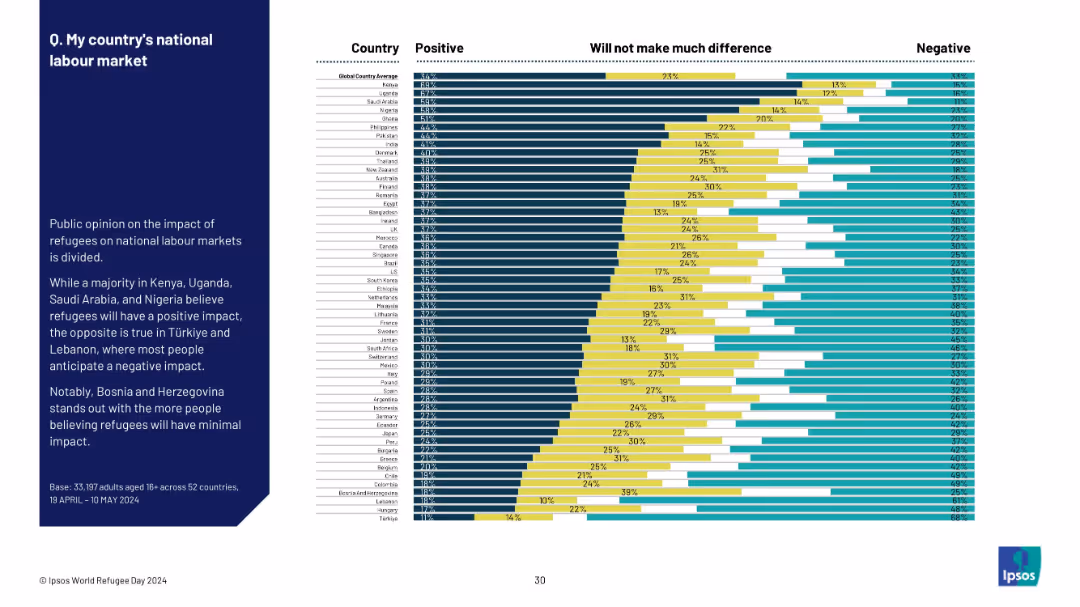
Bar chart with three segments (Positive, Neutral, Negative) per country; sidebar with summary text.
Market Analysis and Trends
Government & Public Sector
The slide visualizes global public opinion on the impact of refugees on national labour markets, segmented by country. It shows that while countries like Kenya and Uganda see refugees positively, others like Türkiye anticipate harm.
refugees, labour market, opinion, country comparison, Ipsos, global survey, public sentiment, positive impact, negative impact, economic perception
false
Market Analysis and Trends
Government & Public Sector
Mixed Chart
IPSOS
Add to my slides
Remove from favorites
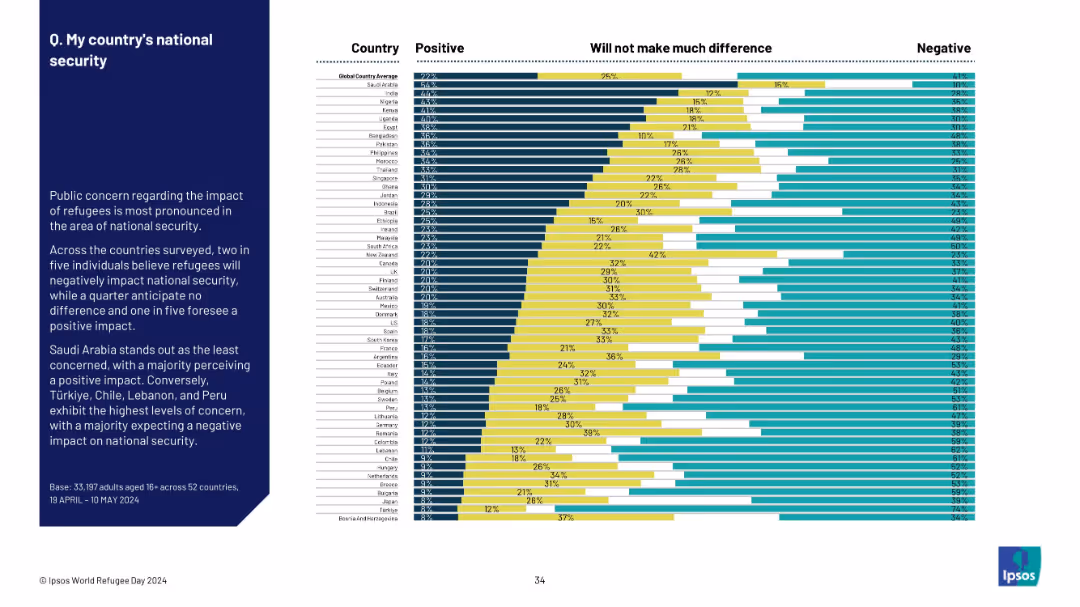
Horizontally segmented bar chart with opinion distributions; summary text on the left.
Risk Assessment and Management
Government & Public Sector
The slide explores how refugees are perceived in terms of national security. Two in five globally view the impact as negative. Saudi Arabia sees it positively, while Türkiye, Lebanon, and Chile express strong concerns.
refugees, national security, safety, perception, public sentiment, Ipsos survey, global opinion, threat, policy
false
Risk Assessment and Management
Government & Public Sector
Mixed Chart
IPSOS
Add to my slides
Remove from favorites
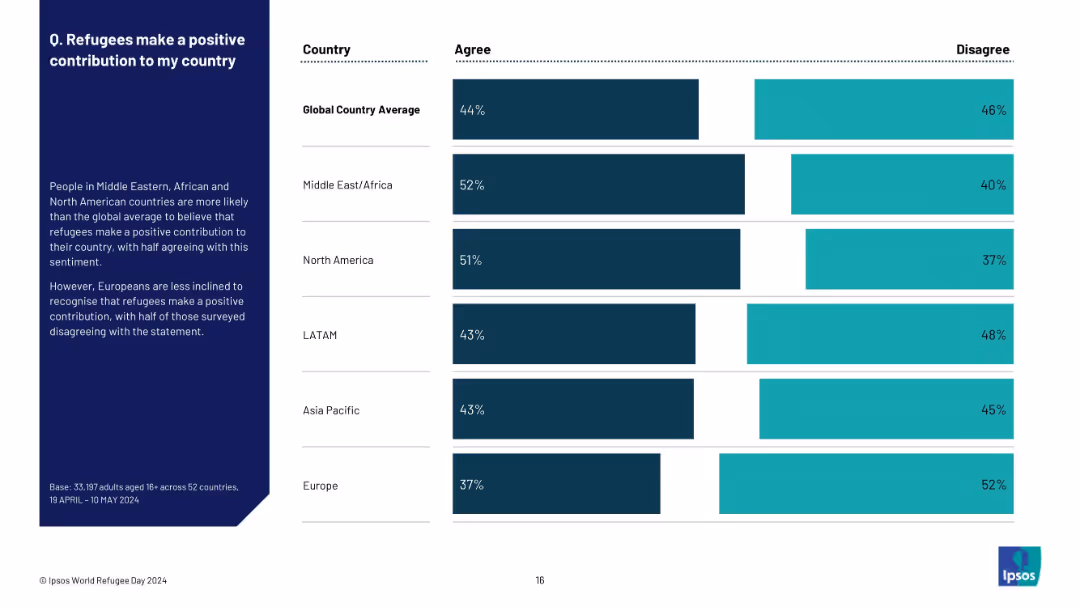
Split layout with a left-side text summary and a right-side horizontal bar chart comparing regions’ agree/disagree %
Market Analysis and Trends
Government & Public Sector
The slide explores regional attitudes toward the positive contribution of refugees. Middle East, Africa, and North America show more favorable views than the global average, while Europe shows more negative sentiment. The chart contrasts agreement levels across regions.
refugees, perception, contribution, global comparison, agreement, regional trends, Ipsos, 2024, World Refugee Day
false
Market Analysis and Trends
Government & Public Sector
Mixed Chart
IPSOS
Add to my slides
Remove from favorites
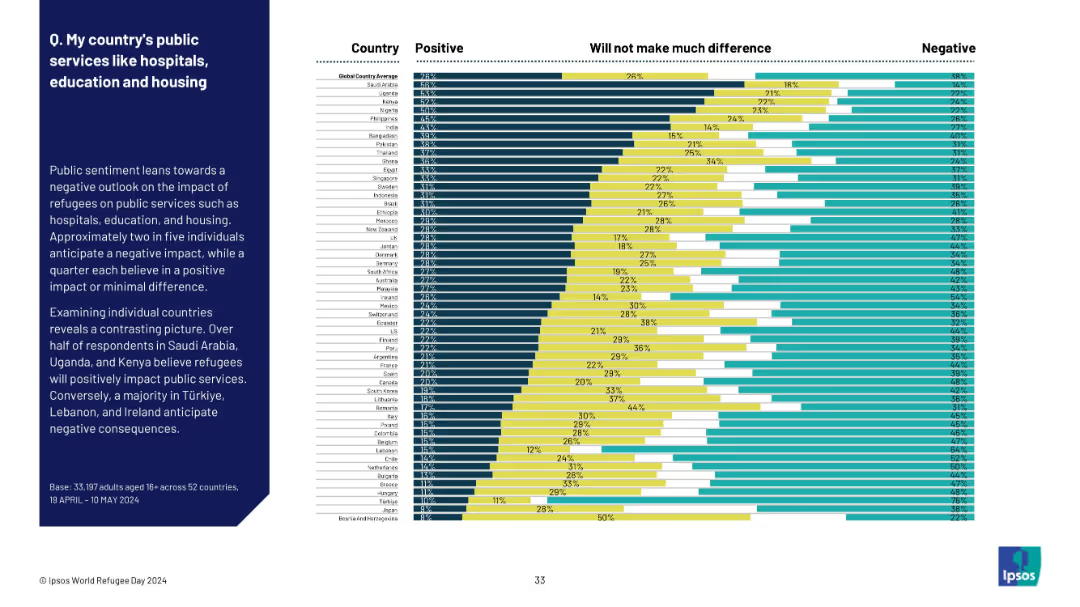
Horizontal bar chart categorized by perception, grouped by country; sidebar with summary.
Market Analysis and Trends
Government & Public Sector
This slide presents global perspectives on refugees’ effect on public services. The sentiment leans negative, but countries like Saudi Arabia and Kenya are optimistic. Contrasts are shown clearly between optimistic and pessimistic regions.
refugees, public services, healthcare, housing, education, sentiment, opinion, global perception, Ipsos, national infrastructure
false
Market Analysis and Trends
Government & Public Sector
Mixed Chart
IPSOS
Add to my slides
Remove from favorites
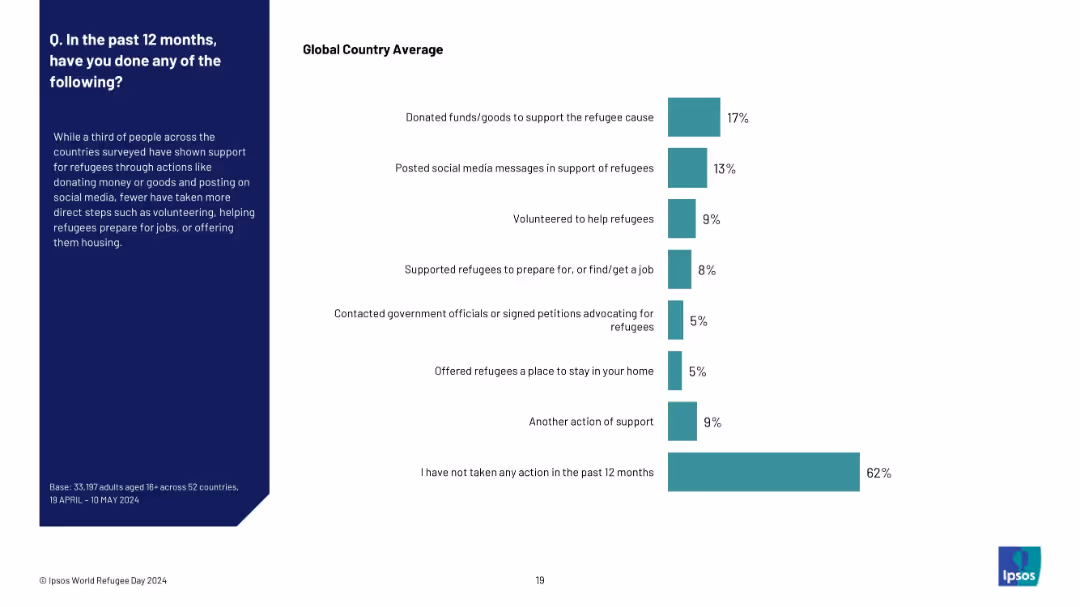
Left panel with explanation and a bar chart listing types of actions and corresponding global percentages
Human Resources and Talent Management
Government & Public Sector
This slide shows types of individual support for refugees over the past year. Most people (62%) took no action, while donation and social media support were the most common actions. Very few hosted refugees or contacted officials.
refugee support, civic engagement, action types, Ipsos, behavior, 12 months, volunteerism, donations
false
Human Resources and Talent Management
Government & Public Sector
Mixed Chart
IPSOS
Add to my slides
Remove from favorites
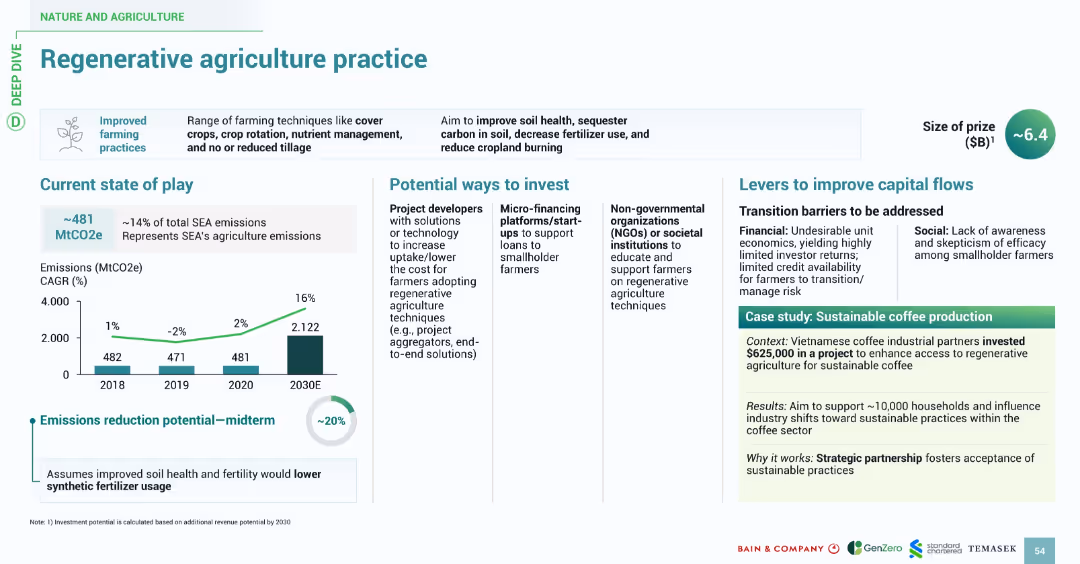
Three-column layout with left chart (emissions), center (investment avenues), and right (barriers and case study); green-themed design with icons.
Technology and Digital Transformation
Agriculture & Food Production
This slide offers a deep dive into regenerative agriculture, identifying its impact on emissions, soil health, and investment potential. Key investment methods include financing platforms and NGO support. Challenges such as financial viability and skepticism are noted, with a case study on sustainable Vietnamese coffee production.
regenerative agriculture, soil health, emissions reduction, Vietnam, sustainable farming, smallholders, investment barriers, crop management
false
Technology and Digital Transformation
Agriculture & Food Production
Multiple Chart
Bain
Add to my slides
Remove from favorites
The slide has a white background with blue circles and lines outlining three triggers for regime changes: new solvency framework, new regulatory intervention level, and significant revisions to the existing framework. Each trigger is described with a brief explanation in blue text.
Regulatory and Compliance
Financial Services
This slide outlines the triggers for regime changes in the financial sector, including new solvency frameworks, regulatory intervention levels, and revisions to existing frameworks, providing a structured approach to understanding these changes.
regime change, triggers, solvency, regulatory, compliance
false
Regulatory and Compliance
Financial Services
Framework
Oliver Wyman
Add to my slides
Remove from favorites
This slide includes multiple bar charts showing planned actions by region for 2023 with highlighted percentages in different colors representing regions such as North America, Europe, and Asia.
Market Analysis and Trends
Financial Services
This slide analyzes planned regional actions in 2023, focusing on cost reduction and efficiencies across North America, Europe, and Asia. It shows differences in focus areas such as innovation, supply chain actions, and talent management across these regions.
regional actions, cost reduction, efficiencies, innovation, supply chain
false
Market Analysis and Trends
Financial Services
Multiple Chart
BCG
Add to my slides
Remove from favorites
This slide contains a set of mini column charts and descriptive statistics detailing the performance of various regions in Asia, Europe, and the Americas.
Market Analysis and Trends
Consumer Goods
Discusses the luxury goods market performance in various regions, emphasizing Asia's growth and challenges in Europe and America due to socio-political issues.
Regional analysis, Asia, Europe, Americas
false
Market Analysis and Trends
Consumer Goods
Mixed Chart
Bain
Add to my slides
Remove from favorites
Provides two column charts showing the percentage of companies in various French regions, and a column chart summarizing the key factors influencing regional business locations.
Market Analysis and Trends
Real Estate & Construction
Analyzes geographical distribution of companies across French regions and the main factors determining business locations, emphasizing the prominence of Ile-de-France.
regional analysis, business location, France, geographical factors, economic environment, workforce, infrastructure, regional attractiveness, company distribution
false
Market Analysis and Trends
Real Estate & Construction
Multiple Chart
Bain
Add to my slides
Remove from favorites
Slide contains three column charts displaying factors affecting regional attractiveness in Île-de-France, Auvergne-Rhône-Alpes, and Hauts-de-France. Red header, white background, blue columns, annotations for data percentages.
Market Analysis and Trends
Government & Public Sector
Analyzes main determinants for regional attractiveness in France, focusing on geographic location, workforce, and infrastructure across three specific regions.
regional analysis, determinants, France, Île-de-France, Auvergne-Rhône-Alpes, Hauts-de-France, workforce, infrastructure, attractiveness
false
Market Analysis and Trends
Government & Public Sector
Multiple Chart
Bain
Add to my slides
Remove from favorites
This slide uses a combination of column charts and textual analysis to compare the economic performance of different regions like China, Europe, and the Americas. It includes percentage changes and highlights notable trends with arrows to denote increases or decreases.
Market Analysis and Trends
Consumer Goods
This comparative analysis slide highlights regional variations in consumer behavior and market performance within the luxury goods sector during a challenging economic period. It emphasizes differences in recovery speeds and the impact of external factors like lockdowns and political instability.
regional analysis, luxury goods, economic impact, market trends
false
Market Analysis and Trends
Consumer Goods
Mixed Chart
Bain
Add to my slides
Remove from favorites
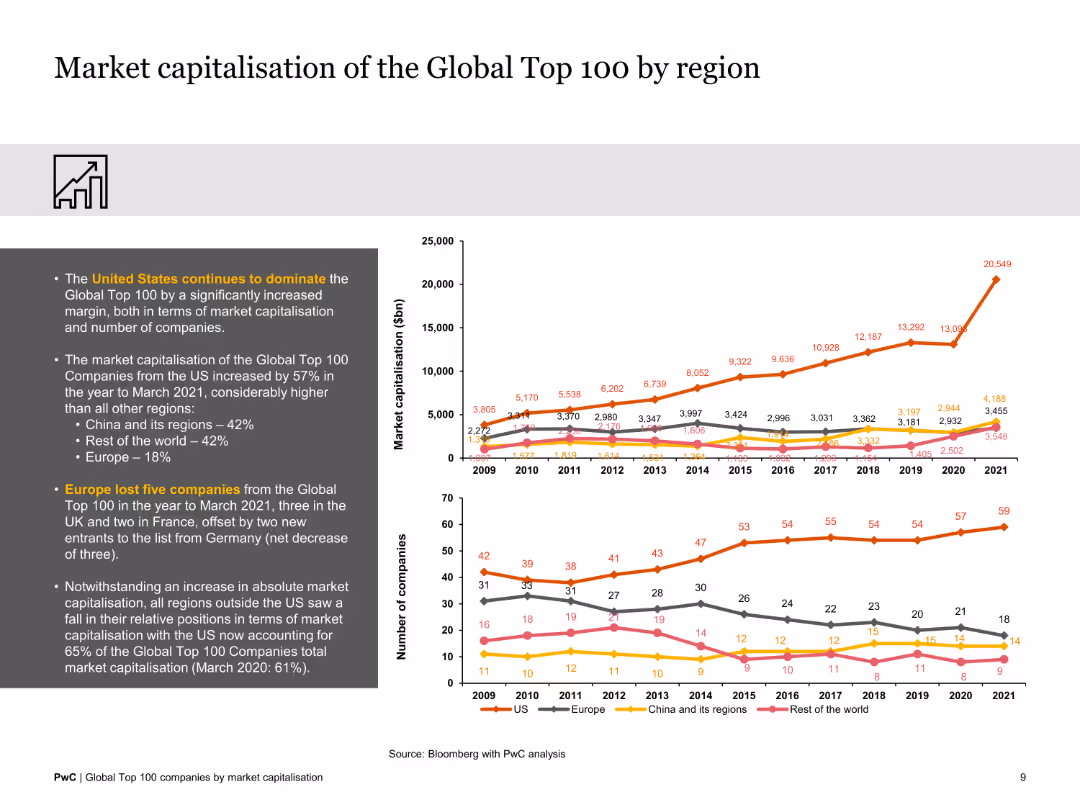
Contains two line charts displaying regional market capitalization data and the number of companies from each region. The slide is visually organized and data-rich.
Market Analysis and Trends
Financial Services
The slide provides an analysis of market capitalization by region, showing the dominance of the US and comparing it with other regions like Europe, China, and the rest of the world.
regional analysis, market dominance, US, Europe, China, financial comparison, global trends
false
Market Analysis and Trends
Financial Services
Multiple Chart
PwC/Strategy&
Add to my slides
Remove from favorites
Regional bar chart version of 19896, showing average agreement and disagreement by global region. Clear left-side text explanation.
Risk Assessment and Management
Government & Public Sector
This slide breaks down skepticism about refugee legitimacy by region. Latin America has the highest agreement (67%), while North America shows the lowest (55%). The data suggest regional differences in belief about refugee motivations, highlighting where skepticism is most and least pronounced.
regional attitudes, refugee legitimacy, skepticism, Ipsos, migration, public belief, asylum seekers, economic motive, perception differences
false
Risk Assessment and Management
Government & Public Sector
Mixed Chart
IPSOS
Add to my slides
Remove from favorites
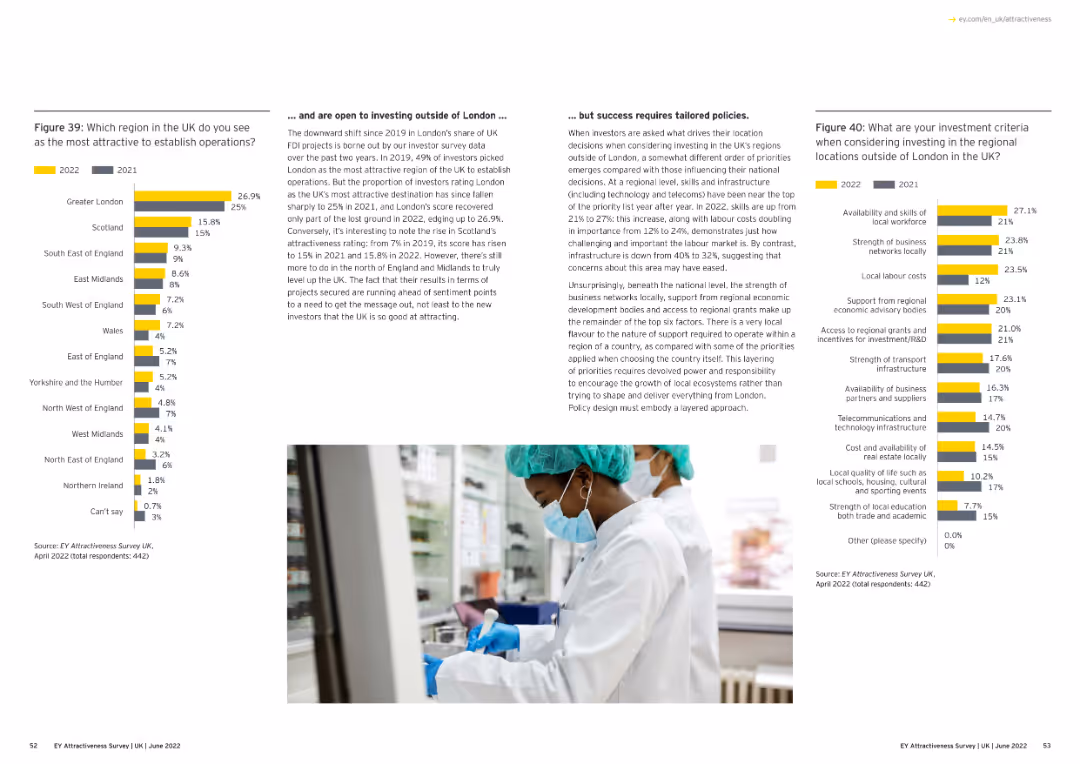
Text with bar charts. The charts compare regional attractiveness for establishing operations in the UK and investment criteria for regions outside London.
Market Analysis and Trends
Financial Services
The slide evaluates regional attractiveness within the UK, highlighting top regions and factors influencing investment decisions.
regional attractiveness, UK, investment criteria, column charts, London
false
Market Analysis and Trends
Financial Services
Multiple Chart
EY
Add to my slides
Remove from favorites
Two-column layout with line charts showing Nasdaq bank stock indexes and US lending conditions for businesses from 2021-2024 and 2008-2024.
Risk Assessment and Management
Financial Services
Analyzes the pressures on regional banks due to CRE-related vulnerabilities and the limited risk of broader financial contagion.
regional banks, CRE, financial vulnerabilities, banking system, risk assessment
false
Risk Assessment and Management
Financial Services
Multiple Chart
EY
Add to my slides
Remove from favorites
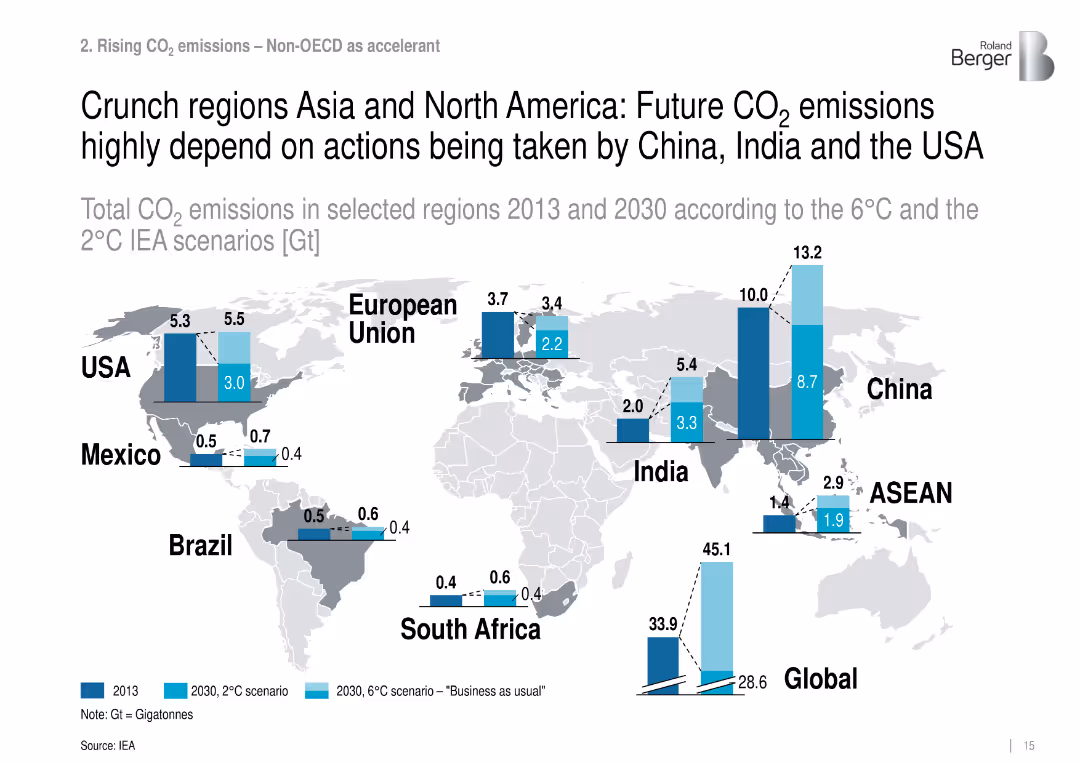
World map with vertical bar comparisons for CO₂ emissions by region (2013, 2030 2°C/6°C).
Risk Assessment and Management
Environmental Services & Sustainability
Highlights key countries driving future CO₂ emissions, stressing the role of the US, China, and India under different climate action pathways.
regional CO₂, emissions forecast, climate policy, Asia, North America
false
Risk Assessment and Management
Environmental Services & Sustainability
Mixed Chart
Roland Berger
Add to my slides
Remove from favorites
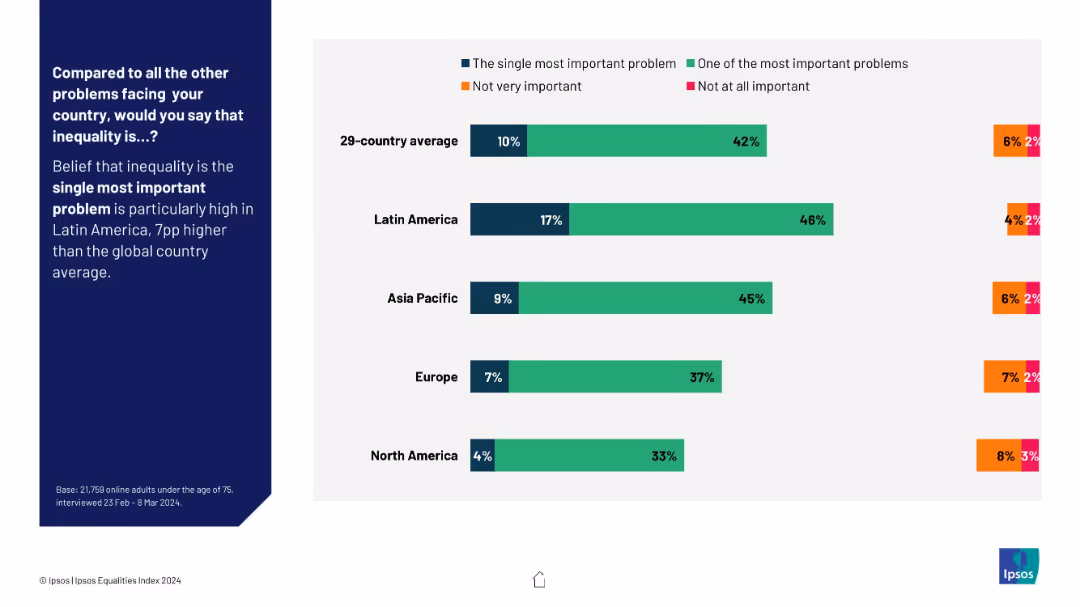
Horizontal bar chart with regional breakdown; segmented by perception type using color-coded bars; descriptive text left aligned.
Market Analysis and Trends
Government & Public Sector
This regional overview visualizes beliefs about inequality’s urgency across Latin America, Asia Pacific, Europe, and North America, showing regional trends and highlighting Latin America's elevated concern.
regional comparison, inequality perception, global attitudes, Ipsos, concern levels, urgency, public opinion
false
Market Analysis and Trends
Government & Public Sector
Mixed Chart
IPSOS
Add to my slides
Remove from favorites
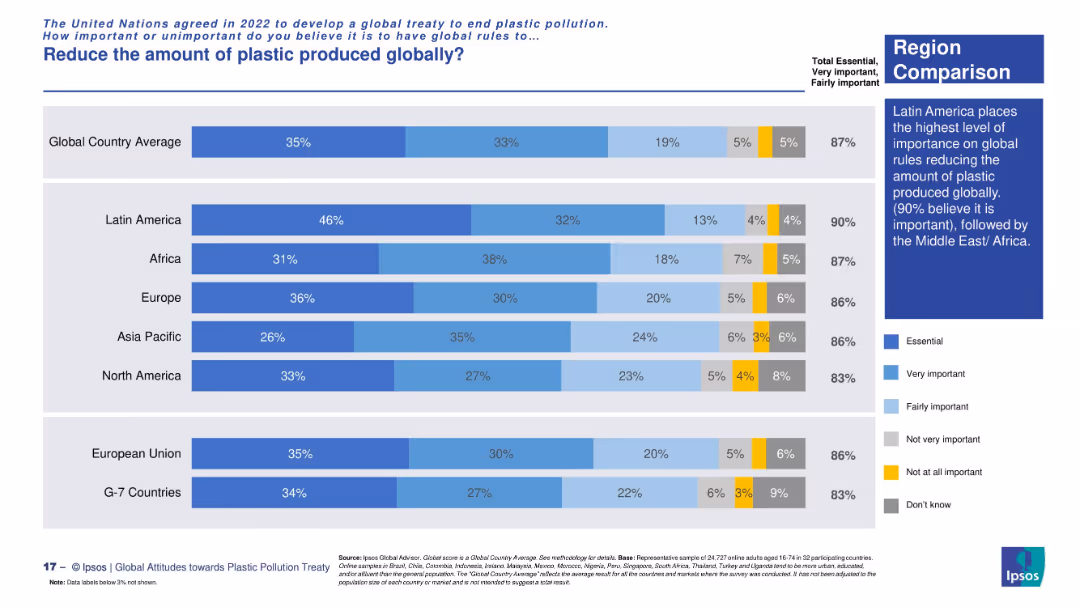
Horizontal bar chart showing regional breakdowns. Bars segmented into five levels of importance with a regional summary on the right.
Market Analysis and Trends
Environmental Services & Sustainability
This regional comparison emphasizes strong support in Latin America and Africa for global rules on reducing plastic production. Europe, Asia Pacific, and North America show slightly lower but still significant support.
regional comparison, plastic production, importance ratings, Latin America, UN treaty, public opinion
false
Market Analysis and Trends
Environmental Services & Sustainability
Mixed Chart
IPSOS
Add to my slides
Remove from favorites
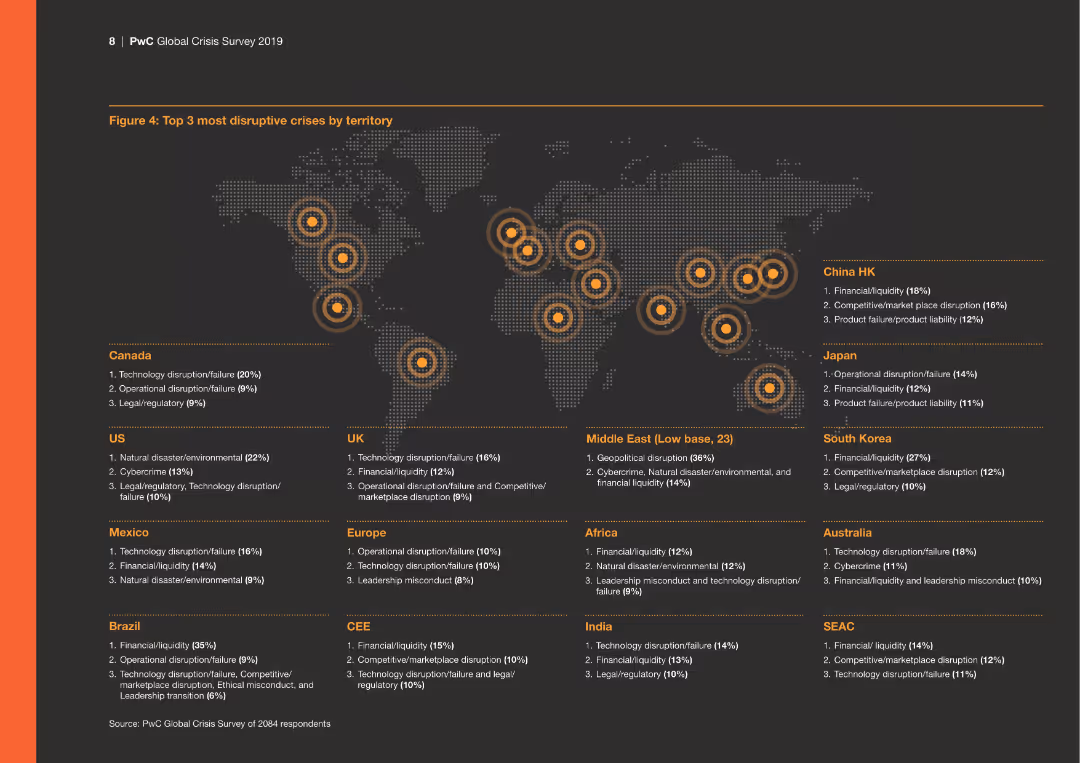
The slide presents a world map with highlighted regions indicating the top three most disruptive crises per territory, with corresponding crisis types listed below the map.
Risk Assessment and Management
Financial Services
This slide provides a regional breakdown of the most disruptive crises, illustrating how different areas are affected by various crisis types such as tech failure and cybercrime.
Regional crises, technology failure, cybercrime, financial, operational
false
Risk Assessment and Management
Financial Services
Graphic
PwC/Strategy&
Add to my slides
Remove from favorites
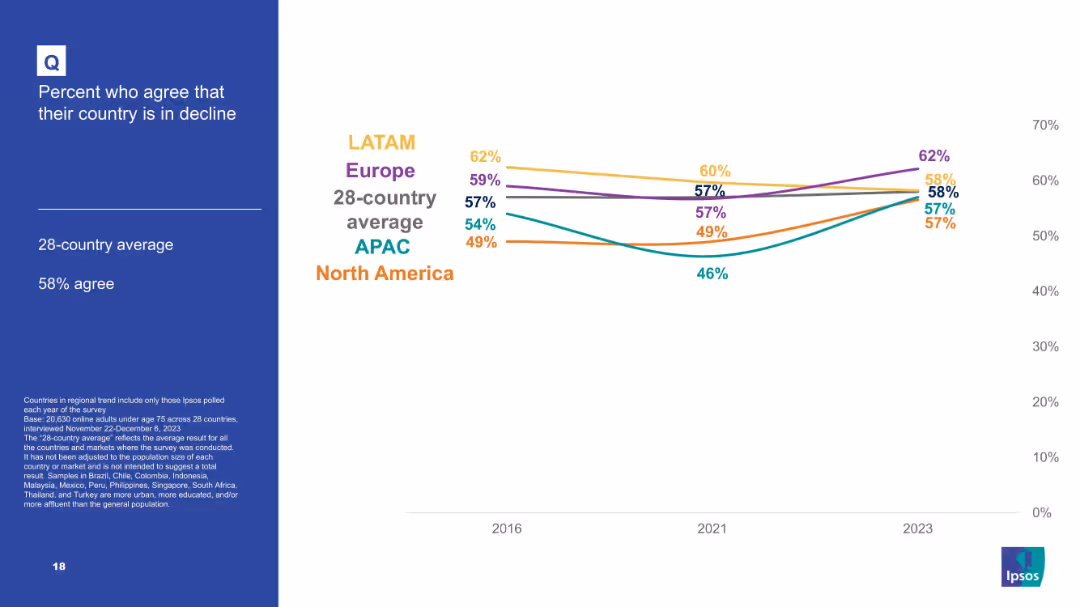
Regional line graph tracking agreement over time (2016–2023); simple format with colored lines for each region.
Market Analysis and Trends
Government & Public Sector
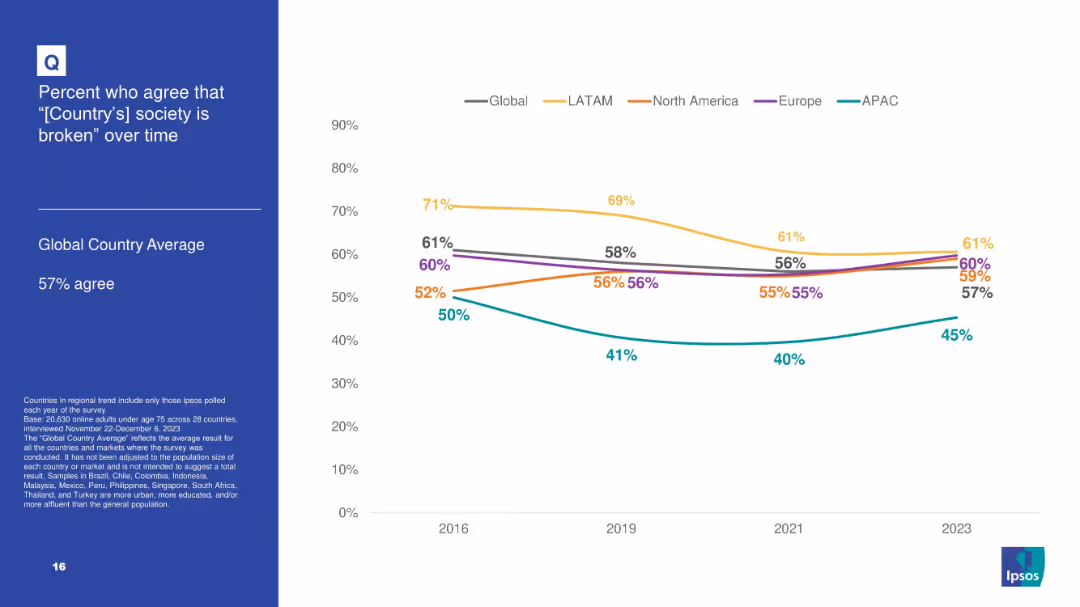
The slide presents regional perspectives on whether countries are in decline. LATAM leads in concern, while APAC shows the least agreement overall. Europe and North America trend around the average in most years.
regional decline, political perception, Ipsos data, global comparison, trend monitoring, sentiment tracking, cross-region views
false
Market Analysis and Trends
Government & Public Sector
Mixed Chart
IPSOS
Add to my slides
Remove from favorites
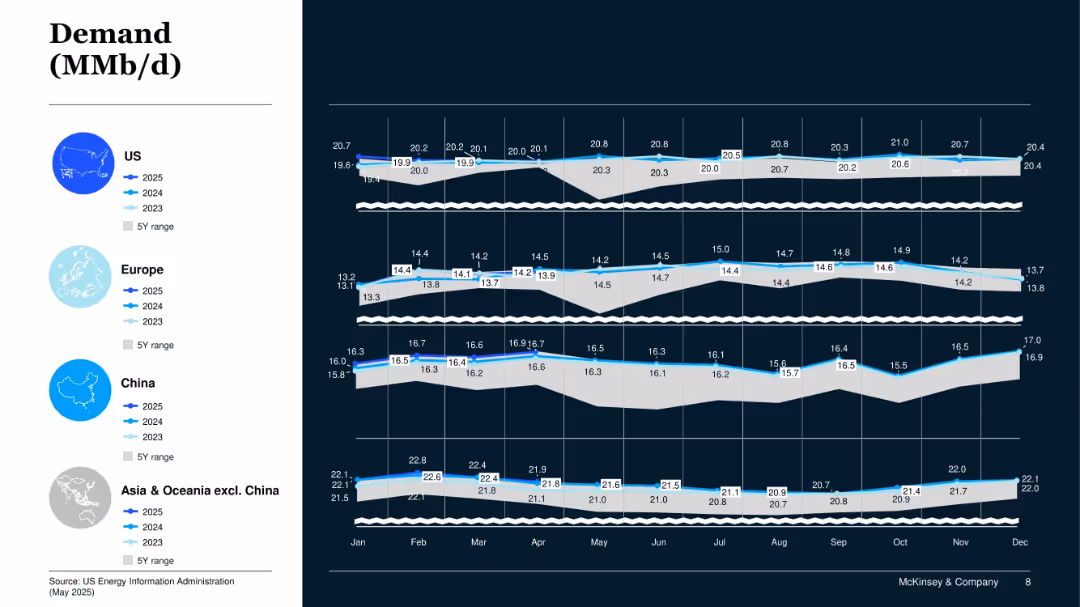
Panel chart with four geographic segments (US, Europe, China, Asia/Oceania excl. China); shows 2023–2025 demand vs 5Y range.
Market Analysis and Trends
Energy & Utilities
This slide provides a geographic breakdown of projected oil demand through 2025, highlighting stronger demand in China and Asia-Pacific, with stability or slight decline in US and Europe.
Regional Demand, Oil Consumption, Asia, Europe, US, 2025 Projections
false
Market Analysis and Trends
Energy & Utilities
Mixed Chart
McKinsey
Add to my slides
Remove from favorites
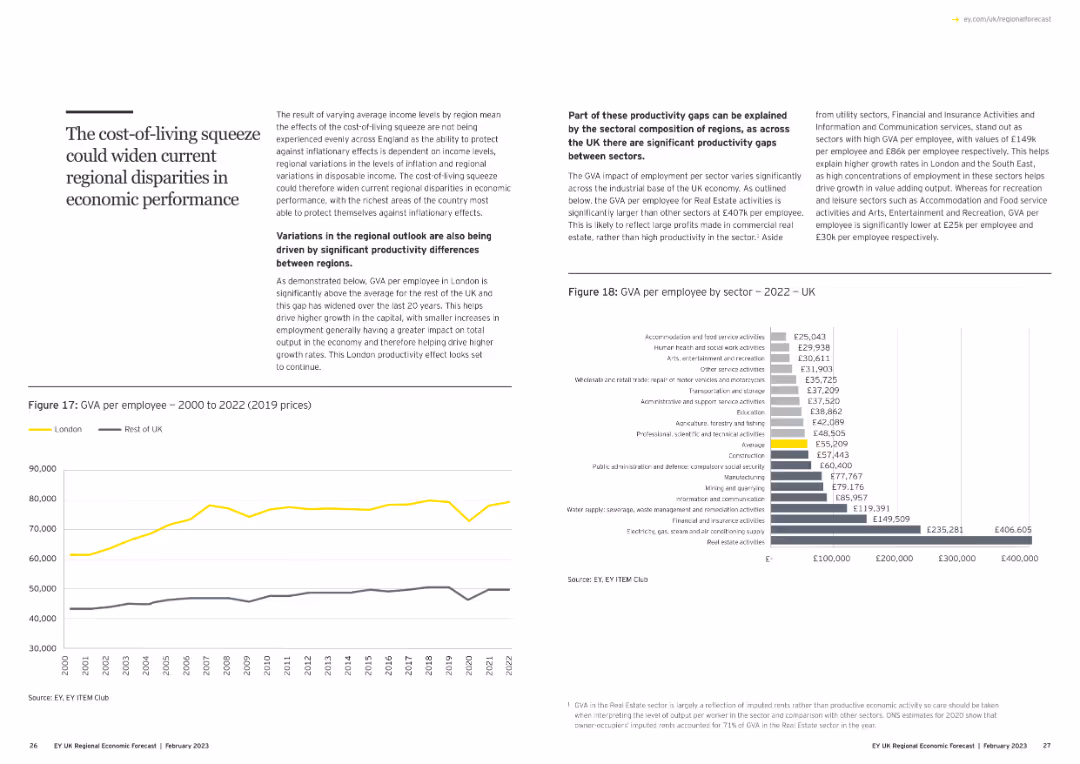
This slide features a title on the left with a block of text explaining the concept. On the bottom left, there is a column chart comparing GVA per employee in London vs. rest of UK. The right side contains a text box and a bar chart detailing GVA per employee by sector for 2022.
Market Analysis and Trends
Financial Services
The slide discusses how varying average income levels and productivity differences across regions could widen regional disparities in economic performance, with specific data on GVA per employee.
regional disparities, GVA, productivity, income levels, economic performance
false
Market Analysis and Trends
Financial Services
Multiple Chart
EY
Add to my slides
Remove from favorites
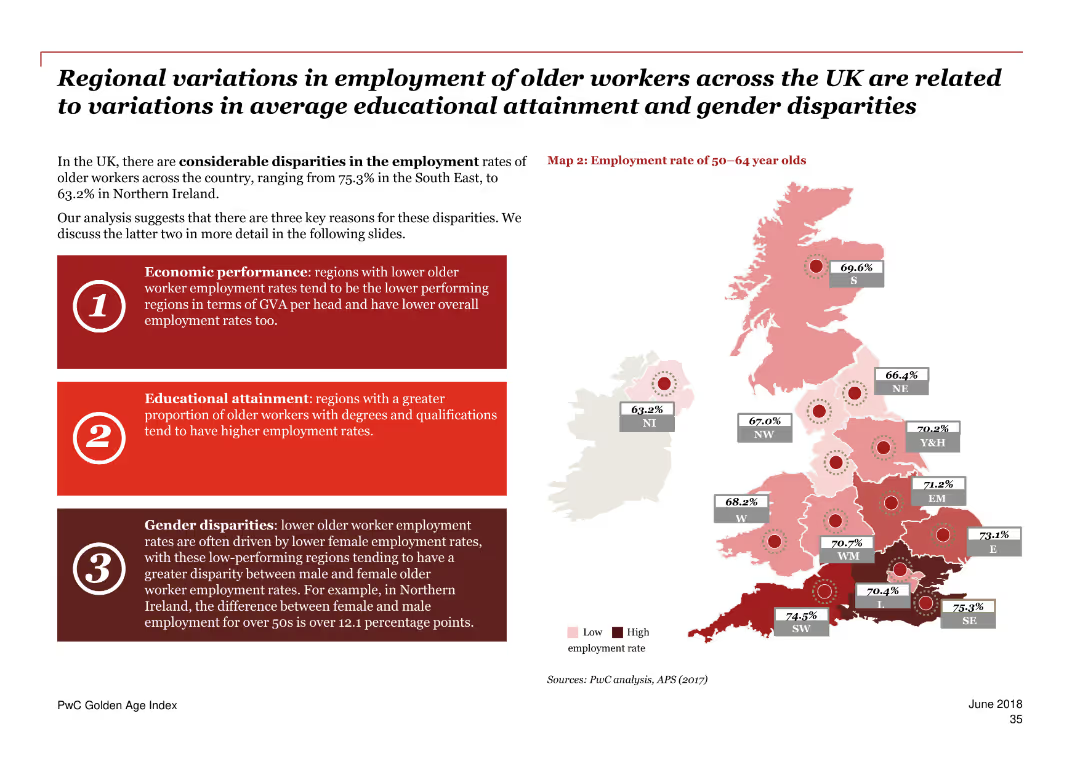
The slide presents a map of the UK highlighting regional variations in employment rates for older workers, alongside bullet points explaining the economic, educational, and gender-related factors contributing to these disparities.
Market Analysis and Trends
Government & Public Sector
This slide analyzes regional disparities in employment rates for older workers across the UK, identifying economic performance, educational attainment, and gender disparities as key contributing factors.
regional employment, UK, older workers, disparities, economic factors, educational attainment, gender disparities
false
Market Analysis and Trends
Government & Public Sector
Graphic
PwC/Strategy&
Add to my slides
Remove from favorites
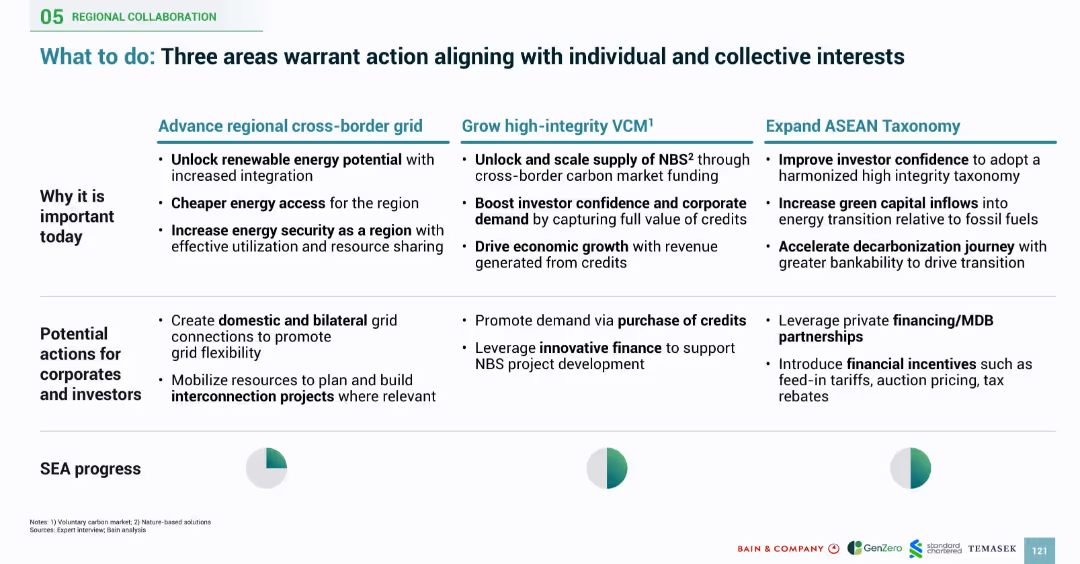
Three-column table with headers highlighting cross-border grid, carbon markets, and taxonomy actions; icons and pie chart visuals used
Strategic Planning
Government & Public Sector
Recommends three core strategies for regional decarbonization in SEA: advancing cross-border energy grids, growing voluntary carbon markets (VCM), and expanding ASEAN taxonomy to boost investment and policy alignment
regional grid, VCM, ASEAN taxonomy, decarbonization, corporate action, green finance, policy integration
false
Strategic Planning
Government & Public Sector
Mixed Chart
Bain
Add to my slides
Remove from favorites
The slide includes a map of Asia with annotations and percentages indicating market positions and growth. Awards and key strengths are listed on the right side.
Market Analysis and Trends
Financial Services
This slide showcases the company's strong regional footprint in Asia, highlighting market positions, growth percentages, and recent awards, emphasizing strengths in APAC IBCM and PB.
Regional Growth, APAC, Market Position, Awards, Strengths
false
Market Analysis and Trends
Financial Services
Graphic
Credit Suisse
Add to my slides
Remove from favorites
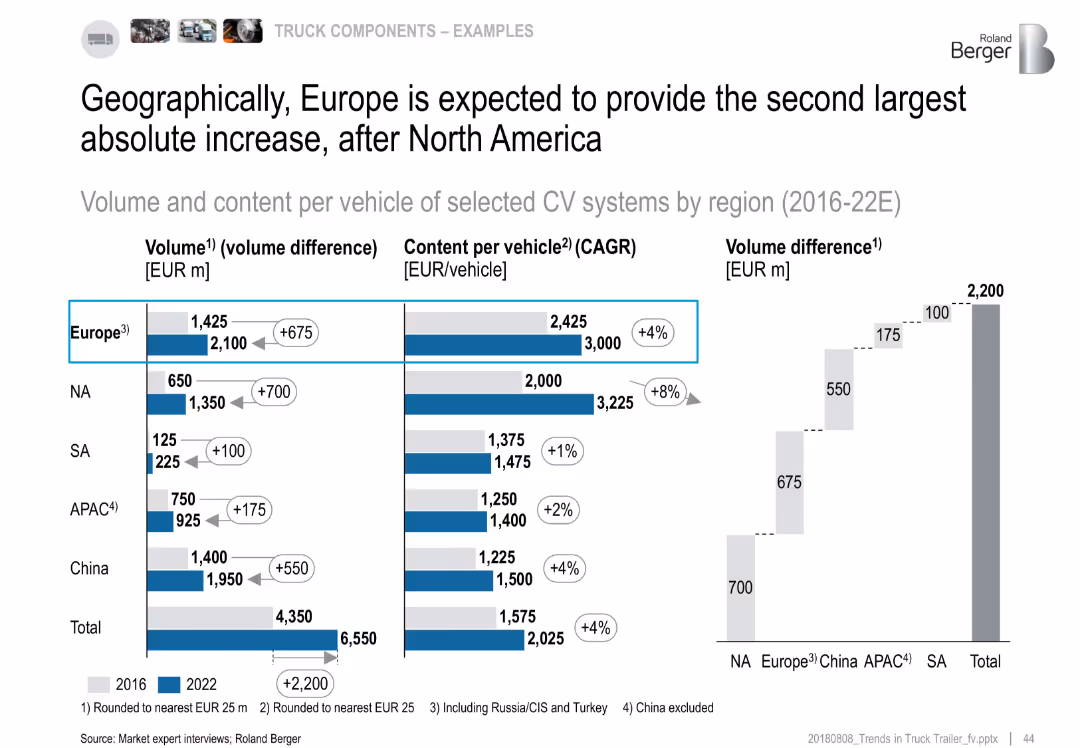
Multi-panel bar chart showing regional CV system market growth (volume & content per vehicle) between 2016–22
Market Analysis and Trends
Industrial & Manufacturing
Europe is projected to contribute €675m in CV system value growth, second only to North America. NA shows the highest CAGR in content per vehicle (8%). China, APAC, and SA also show positive growth, but at lower absolute or percentage levels.
regional growth, CV systems, Europe, North America, CAGR, content per vehicle, 2016–22
false
Market Analysis and Trends
Industrial & Manufacturing
Multiple Chart
Roland Berger
Add to my slides
Remove from favorites
Slide contains colored circles and text to present the growth percentages in luxury goods spending across different regions like China, Asia, and Europe.
Market Analysis and Trends
Retail & E-commerce
Highlights the regional performance in the luxury market with a focus on growth rates in China and other Asian countries compared to Europe and the Americas, stressing regional differences and factors affecting growth.
Regional Growth, Luxury Market, Asia, Europe, Performance
false
Market Analysis and Trends
Retail & E-commerce
Mixed Chart
Bain
Add to my slides
Remove from favorites
A UK map highlights different regions with associated GVA and employment figures in a legible format. Side text provides additional context and notes.
Market Analysis and Trends
Government & Public Sector
This slide details the regional economic impact of the Tempest programme, showcasing direct and indirect GVA and employment contributions across the UK.
regional impact, Tempest programme, GVA, employment, UK regions, economic contribution
false
Market Analysis and Trends
Government & Public Sector
Single Chart
PwC/Strategy&
Add to my slides
Remove from favorites
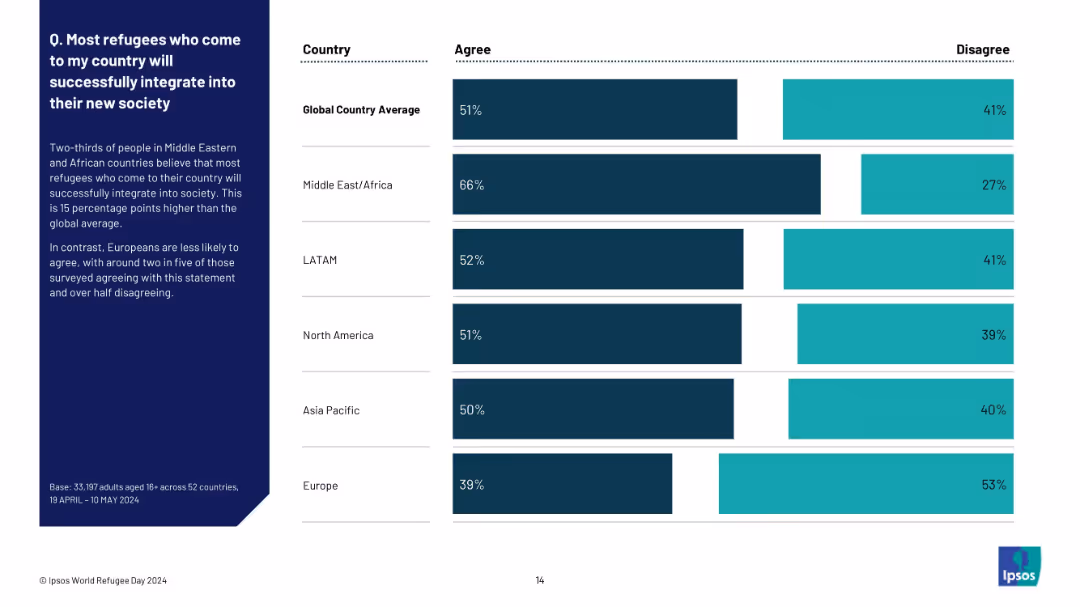
Regional breakdown bar chart showing agreement/disagreement percentages. Text summary on left, data bars on right.
Human Resources and Talent Management
Government & Public Sector
This regional view shows how different parts of the world perceive refugee integration success. Middle East/Africa reports the highest optimism (66%), while Europe is lowest (39%). The global average is 51%. The chart emphasizes the importance of regional context in shaping attitudes toward integration outcomes.
regional integration views, refugee adjustment, optimism, public opinion, Ipsos, cross-cultural adaptation, refugee acceptance
false
Human Resources and Talent Management
Government & Public Sector
Mixed Chart
IPSOS
Add to my slides
Remove from favorites
Contains bar charts and numeric rankings showing investment priorities by region (North America, Europe, Asia), particularly in innovation, cyber security, and talent development.
Strategic Planning
Financial Services
Analyzes regional investment priorities, emphasizing how different areas are leveraging investments in technology, security, and talent to position themselves competitively in the global market.
regional investments, technology, security, talent development, competitive positioning
false
Strategic Planning
Financial Services
Multiple Chart
BCG
Add to my slides
Remove from favorites
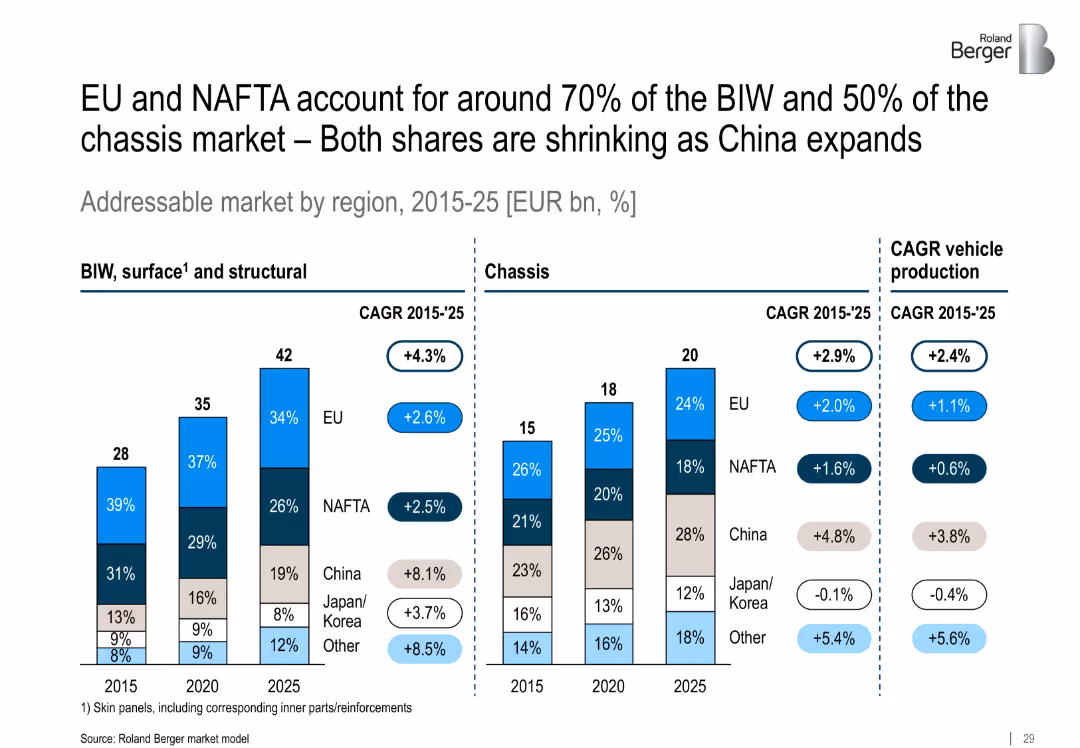
Two grouped vertical stacked bar charts representing BIW and chassis markets by region (2015, 2020, 2025), with side notes and CAGR values beside each bar cluster.
Market Analysis and Trends
Industrial & Manufacturing
This slide analyzes the geographic shift in addressable automotive market shares, highlighting China's rapid growth and decline of EU/NAFTA share in BIW and chassis segments.
regional market, BIW, chassis, China growth, NAFTA, EU, CAGR, automotive, outsourcing
false
Market Analysis and Trends
Industrial & Manufacturing
Multiple Chart
Roland Berger
Add to my slides
Remove from favorites
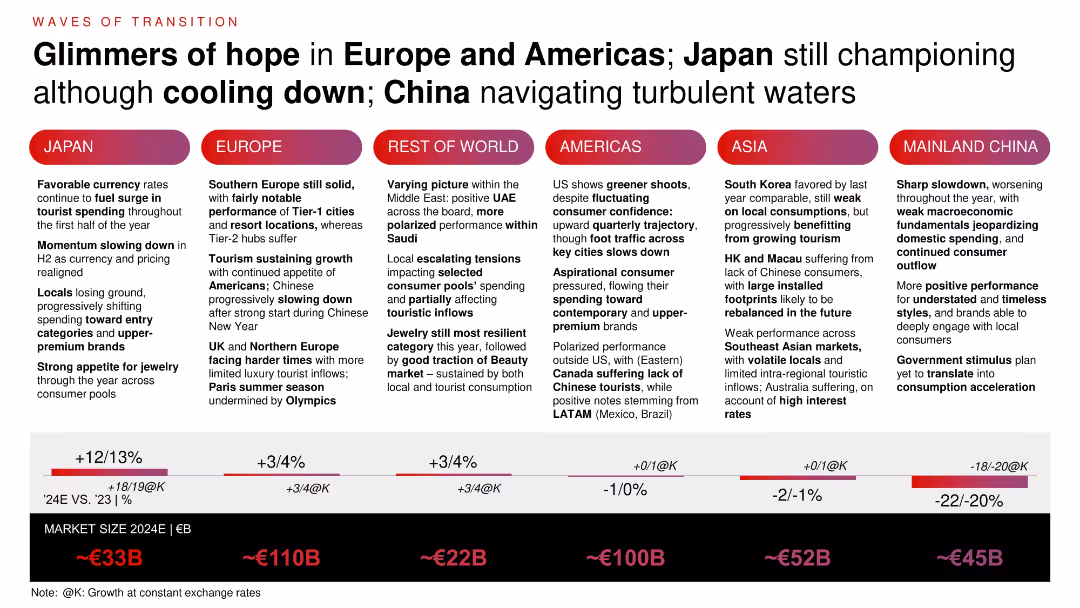
Multi-column layout showing six regions with qualitative commentary on consumer trends and local market shifts. Regional bar graph at the bottom comparing 2024E size and YoY growth.
Market Analysis and Trends
Consumer Goods
Examines regional transitions within the luxury market. Japan shows resilience due to favorable FX and tourism. Europe sustains momentum. China faces macroeconomic headwinds. Middle East shows polarization. Insights emphasize regional differentiation in demand, pricing effects, and tourist inflows.
regional outlook, luxury consumption, FX impact, tourism, China, Europe, Japan
false
Market Analysis and Trends
Consumer Goods
Mixed Chart
Bain
Add to my slides
Remove from favorites
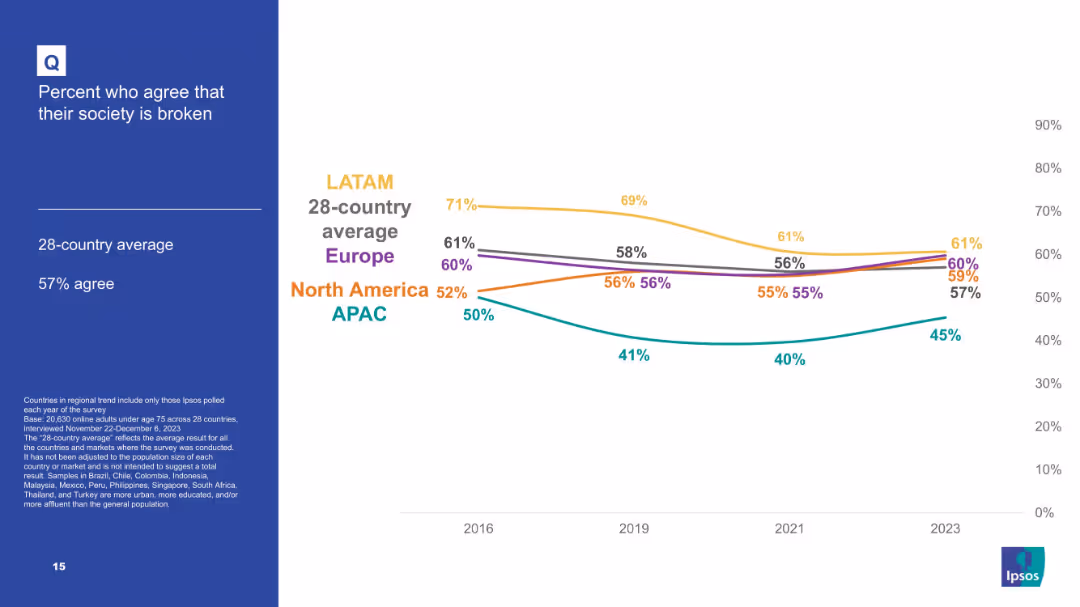
White background line chart showing agreement over time that society is broken by world region; blue info box on left.
Market Analysis and Trends
Government & Public Sector
Regional view of dissatisfaction with societal conditions, comparing LATAM, North America, Europe, and APAC regions; LATAM consistently shows higher agreement levels.
regional perception, societal issues, dissatisfaction, Ipsos, public opinion, trend
false
Market Analysis and Trends
Government & Public Sector
Mixed Chart
IPSOS
Add to my slides
Remove from favorites
Lists financial metrics and performance highlights for different regions.
Financial Performance
Financial Services
Summarizes regional performance in wealth management, noting high client engagement and income growth.
regional performance, client engagement, income growth, wealth management, financial metrics
false
Financial Performance
Financial Services
Multiple Chart
UBS
Add to my slides
Remove from favorites
The slide features column charts and maps showing regional performance in the IPO market, with metrics on number of IPOs and proceeds by region for 2018.
Market Analysis and Trends
Financial Services
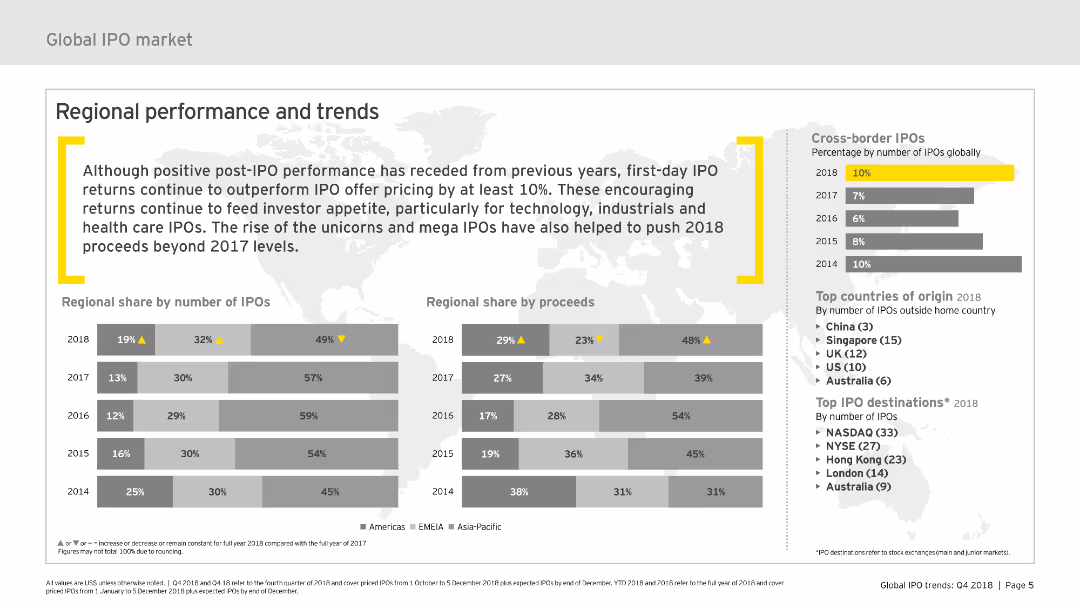
This slide reviews the regional distribution of IPOs and their proceeds, highlighting performance trends and key countries of origin for cross-border IPOs in 2018.
regional performance, IPOs, trends, proceeds, regions
false
Market Analysis and Trends
Financial Services
Multiple Chart
EY
Add to my slides
Remove from favorites
The slide features a multi-column table comparing performance metrics across Europe, North America, and South America, with each region highlighted in a different color. There are metrics like RoTE and efficiency ratios with 2019 data and mid-term goals. Icons representing each region add a visual element. The slide uses a combination of red, pink, and light blue, with the Santander logo in the corner and a watermark of the company logo in the background.
Operational Efficiency
Financial Services
This slide compares the bank's operational performance metrics by region and outlines goals for improvement. It's suited for internal strategic discussions or investor presentations to demonstrate operational efficiency and targets in different markets.
Regional Performance, RoTE, Efficiency, Santander, Banking Metrics, Performance Goals, Operational Analysis, Financial Targets
false
Operational Efficiency
Financial Services
Table
Morgan Stanley
Add to my slides
Remove from favorites
Combination of column charts for industry performance and a line graph for regional performance trends
Market Analysis and Trends
Financial Services
The slide provides an overview of regional PMI performance, comparing the US, Europe, and Asia, with a focus on financial conditions.
regional PMI, industry performance, US, Europe, Asia
false
Market Analysis and Trends
Financial Services
Multiple Chart
Accenture
Add to my slides
Remove from favorites
A pie chart highlights sales distribution by region, complemented by a column chart showing regional sales development. Red highlights indicate changes.
Market Analysis and Trends
Industrial & Manufacturing
This slide assesses regional sales, showing Asia leading in recovery compared to other regions, with details on sales percentage and operational development.
regional sales, Asia recovery, operational development, LANXESS, sales analysis, Americas, EMEA, Germany, market comparison
false
Market Analysis and Trends
Industrial & Manufacturing
Multiple Chart
Morgan Stanley
Add to my slides
Remove from favorites
A world map highlighting regions with varying colors, pie charts detailing product types sold, and textual information about sales, margins, and operations.
Industry Overview
Consumer Goods
Outlines the sales distribution and product focus within the Asia, Oceania, and Africa regions, providing insights into market segmentation and operational scale. Helpful for regional strategic planning and resource allocation.
regional sales, market segmentation, operational scale, strategic planning, Nestlé
false
Industry Overview
Consumer Goods
Multiple Chart
Deutsche Bank
Add to my slides
Remove from favorites
Contains bar charts, regional comparisons, and data tables. The slide is visually detailed, highlighting regional shares of IPO numbers and proceeds for 2019.
Market Analysis and Trends
Financial Services
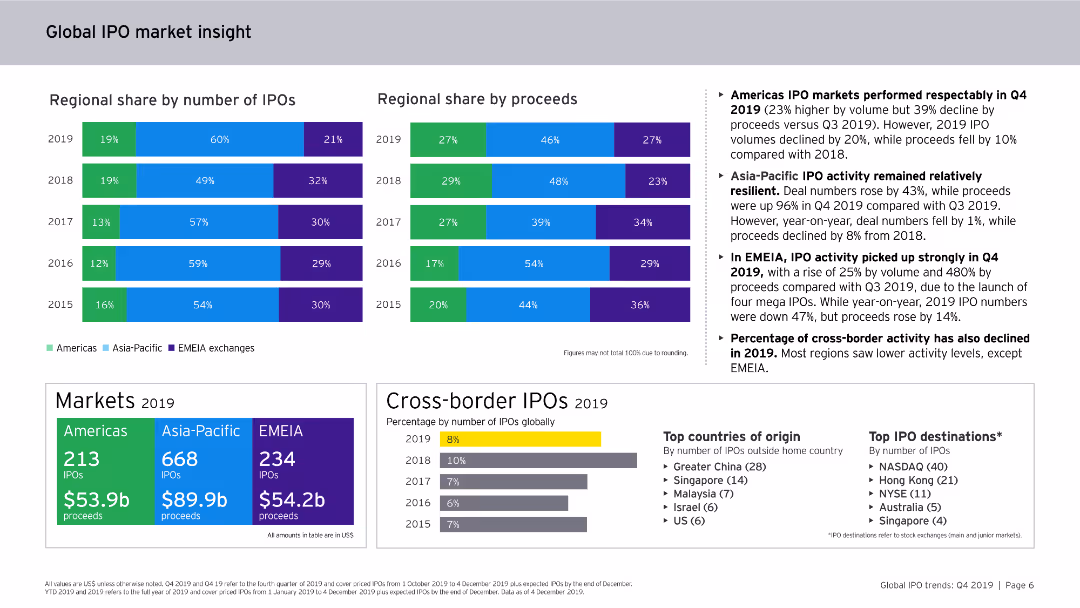
Analyzes regional IPO activities and market shares for 2019, focusing on the performance of Americas, Asia-Pacific, and EMEIA regions, and the trends in cross-border IPO activities.
regional share, IPO, proceeds, 2019, market insight
false
Market Analysis and Trends
Financial Services
Multiple Chart
EY
Add to my slides
Remove from favorites
Map of Denmark, regional highlights, infographic style with icons and color coding.
Regulatory and Compliance
Government & Public Sector
Surveys regional focus on SDGs in Denmark, showing varying priorities such as climate action and economic growth.
Regional strategy, Denmark, SDGs, climate action, economic growth
false
Regulatory and Compliance
Government & Public Sector
Graphic
McKinsey
Add to my slides
Remove from favorites
Regional-level bar chart with average agreement/disagreement by global region. Text explanation on left, simple bar chart on right.
Regulatory and Compliance
Government & Public Sector
This regional analysis highlights varying attitudes toward granting refuge. The Middle East/Africa and LATAM regions show the highest support (77% and 76% respectively), while Asia Pacific shows the lowest (65%). The slide emphasizes that, despite some variation, all regions maintain majority support for offering refuge.
regional support, asylum, public sentiment, global refugee policy, Ipsos, international attitudes, war and persecution, Middle East, Latin America
false
Regulatory and Compliance
Government & Public Sector
Mixed Chart
IPSOS
Add to my slides
Remove from favorites
Multiple bar charts represent the number one business threats across different regions, with contrasting colors to differentiate between the years. The layout is well-structured, allowing for easy comparison.
Risk Assessment and Management
Financial Services
It highlights regional differences in business threat perception, used for geographic-specific risk analysis and strategic regional planning.
regional threats, business concerns, risk analysis, cyber threats, policy uncertainty, geopolitical risk, strategic planning.
false
Risk Assessment and Management
Financial Services
Multiple Chart
PwC/Strategy&
Add to my slides
Remove from favorites
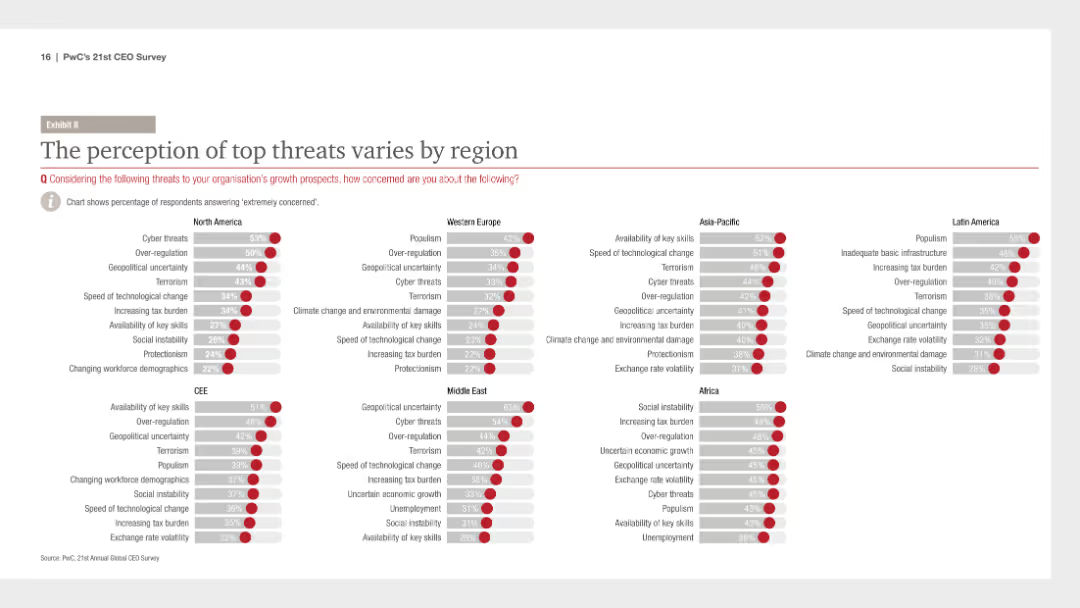
The slide uses a comparative layout with multiple charts to show the regional variations in the perception of top threats to organizational growth, with each region's top threats listed in a column chart.
Risk Assessment and Management
Financial Services
It highlights regional differences in threat perception, showing that CEOs in different regions prioritize different risks, useful for tailoring regional risk management strategies.
regional threats, perception, risk management, comparative analysis, regional variations, PwC, CEO Survey, top threats
false
Risk Assessment and Management
Financial Services
Multiple Chart
PwC/Strategy&
Add to my slides
Remove from favorites
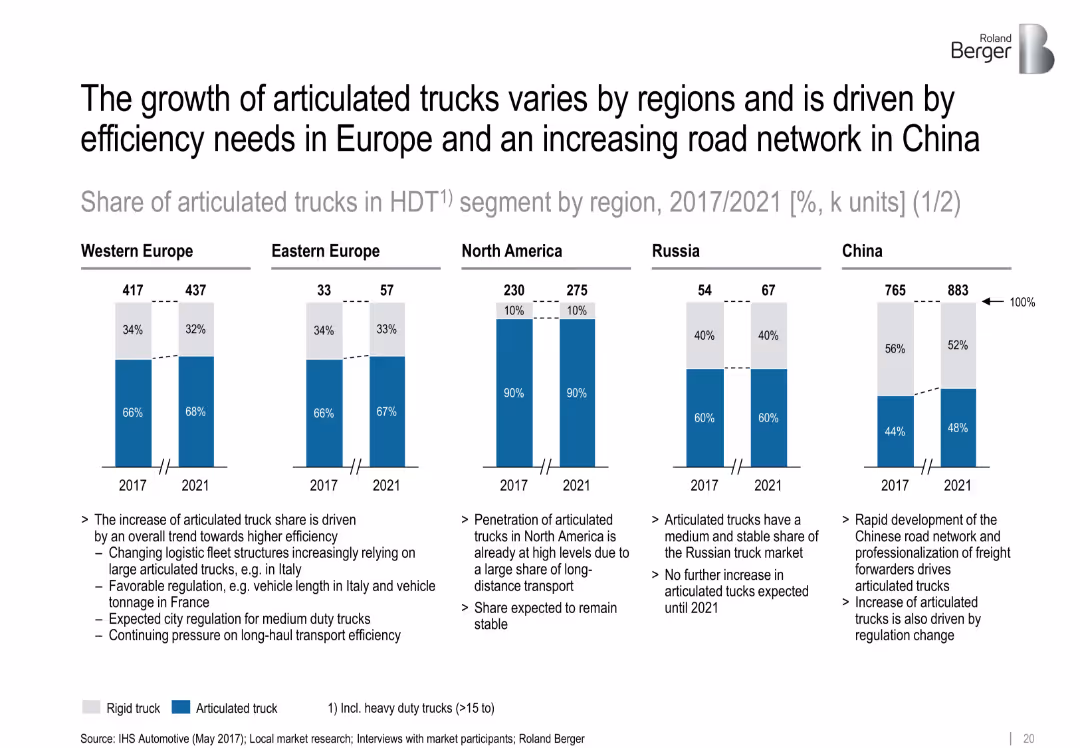
Five regional bar charts with split percentages for articulated vs rigid trucks in 2017 and 2021. Supporting notes below each graph.
Customer and Market Segmentation
Transportation & Logistics
This slide examines the regional differences in articulated truck share, highlighting Europe's efficiency-driven growth and China’s network-driven increase. North America remains stable with high penetration.
['regional trends', 'articulated trucks', 'segmentation', 'logistics', 'fleet efficiency', 'market share', 'forecast']
false
Customer and Market Segmentation
Transportation & Logistics
Mixed Chart
Roland Berger
Add to my slides
Remove from favorites
Line chart showing regional averages (LATAM, Europe, etc.) on a clean white background with regional color codes.
Market Analysis and Trends
Government & Public Sector
This slide compares regional perceptions of societal breakdown from 2016 to 2023. LATAM consistently scores the highest agreement that society is broken, while APAC shows lower but rising concern over the years.
regional trends, political pessimism, LATAM vs APAC, Ipsos tracking, societal issues, public view, system distrust
false
Market Analysis and Trends
Government & Public Sector
Mixed Chart
IPSOS
Add to my slides
Remove from favorites
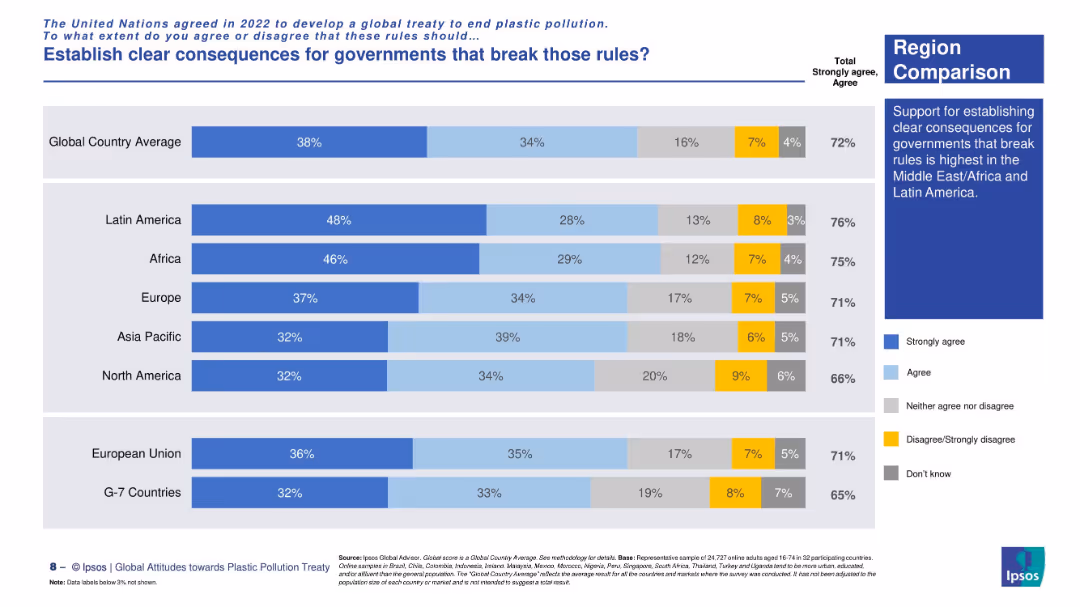
Region-level comparison in a horizontal stacked bar chart; consistent color scheme with explanatory text box at right.
Regulatory and Compliance
Environmental Services & Sustainability
This regional comparison shows attitudes toward enforcing consequences on governments violating plastic pollution rules. Support is strongest in Latin America and Africa, lowest in G7 and North America. Global average support is 73%.
regional trends, treaty compliance, global governance, plastic policy, Ipsos data, enforcement attitudes, environmental treaty, rule breaking
false
Regulatory and Compliance
Environmental Services & Sustainability
Mixed Chart
IPSOS
Add to my slides
Remove from favorites
World map with regions highlighted and metrics on AuM, AuM growth, and PTI growth for different market segments.
Customer and Market Segmentation
Financial Services
Focuses on client proximity strategies to capture regional wealth pools, detailing growth metrics for various emerging and mature markets.
Regional wealth, client proximity, AuM growth, PTI growth, market segments
false
Customer and Market Segmentation
Financial Services
Table
Credit Suisse
Add to my slides
Remove from favorites
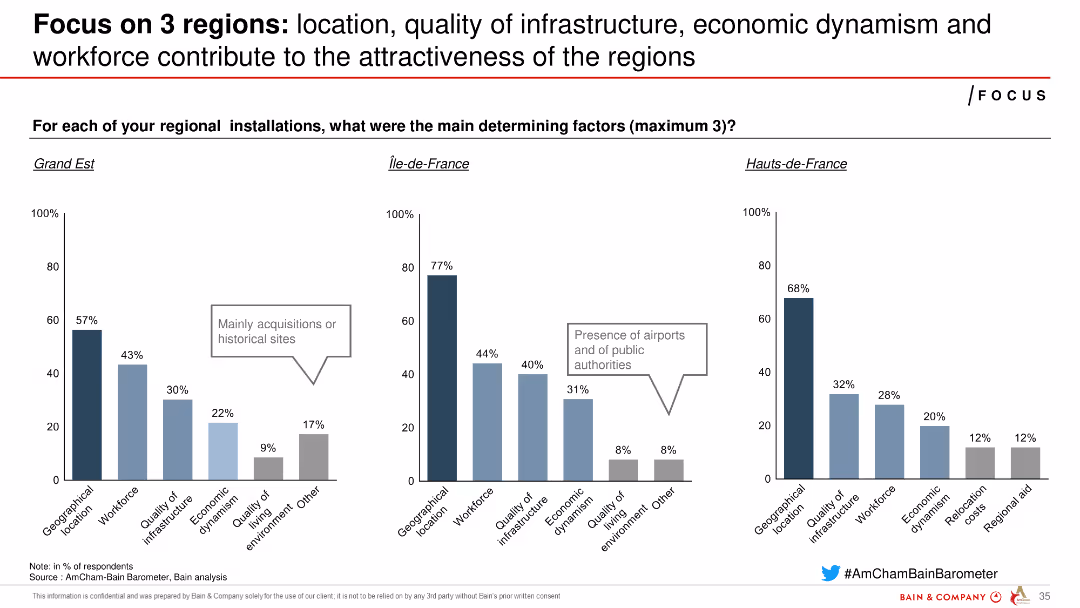
Three column charts comparing determining factors for regional installations in Grand Est, Île-de-France, and Hauts-de-France.
Market Analysis and Trends
Industrial & Manufacturing
Compares the main factors influencing attractiveness in three French regions, focusing on geographical location, infrastructure, economic dynamism, and workforce.
regions, attractiveness, factors, comparison, France
false
Market Analysis and Trends
Industrial & Manufacturing
Multiple Chart
Bain
Add to my slides
Remove from favorites
A pie chart illustrating the proportion of users who confirmed the registration of crypto trading platforms with provincial regulators before purchasing, in 2023.
Regulatory and Compliance
Financial Services
This slide shows the percentage of users who confirmed if crypto trading platforms were registered before purchase, highlighting awareness and due diligence in 2023.
Registration, crypto, trading, platform, compliance, 2023
false
Regulatory and Compliance
Financial Services
Single Chart
IPSOS
Add to my slides
Remove from favorites
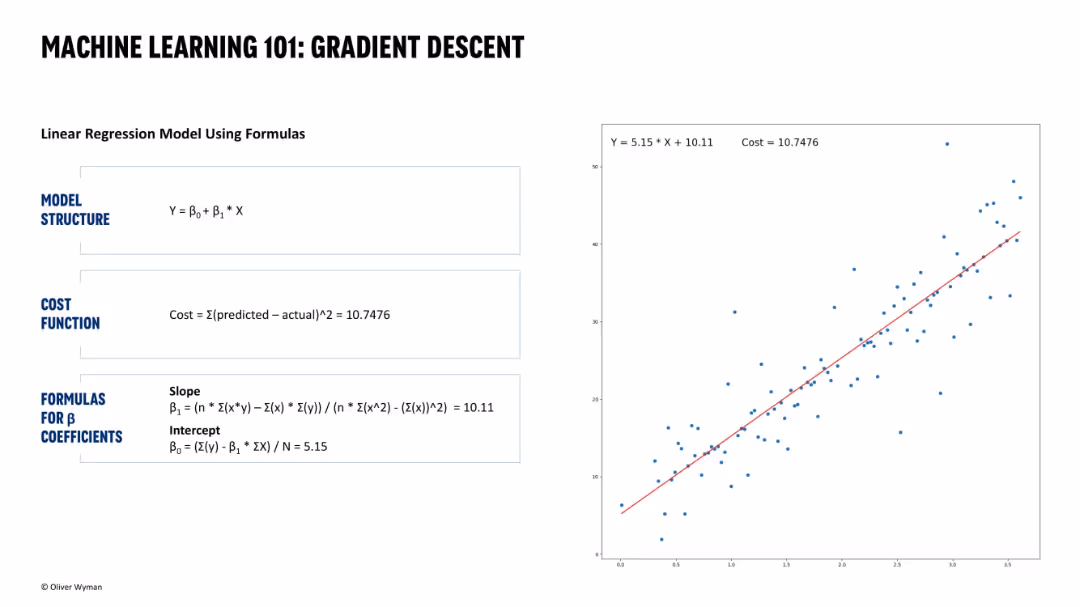
Builds on previous slide with completed regression line overlayed on scatterplot; same formula breakdown on the left.
Technology and Digital Transformation
Artificial Intelligence
A continuation of the linear regression explanation, this slide visualizes the result of applying gradient descent. The red regression line is shown alongside a calculated cost value, making it easier to connect formulaic understanding with visual model performance.
regression line, gradient descent, cost value, linear regression, machine learning, model fit, scatterplot
false
Technology and Digital Transformation
Artificial Intelligence
Single Chart
Oliver Wyman
Add to my slides
Remove from favorites
The slide includes a bar chart showing levels of regret among participants who purchased crypto assets, measured on a scale from 1 to 7.
Risk Assessment and Management
Financial Services
This slide analyzes the regret levels of participants who purchased crypto assets, indicating how many regret their decision to varying degrees.
Regret, crypto assets, purchase, sentiment, analysis
false
Risk Assessment and Management
Financial Services
Mixed Chart
IPSOS
Add to my slides
Remove from favorites
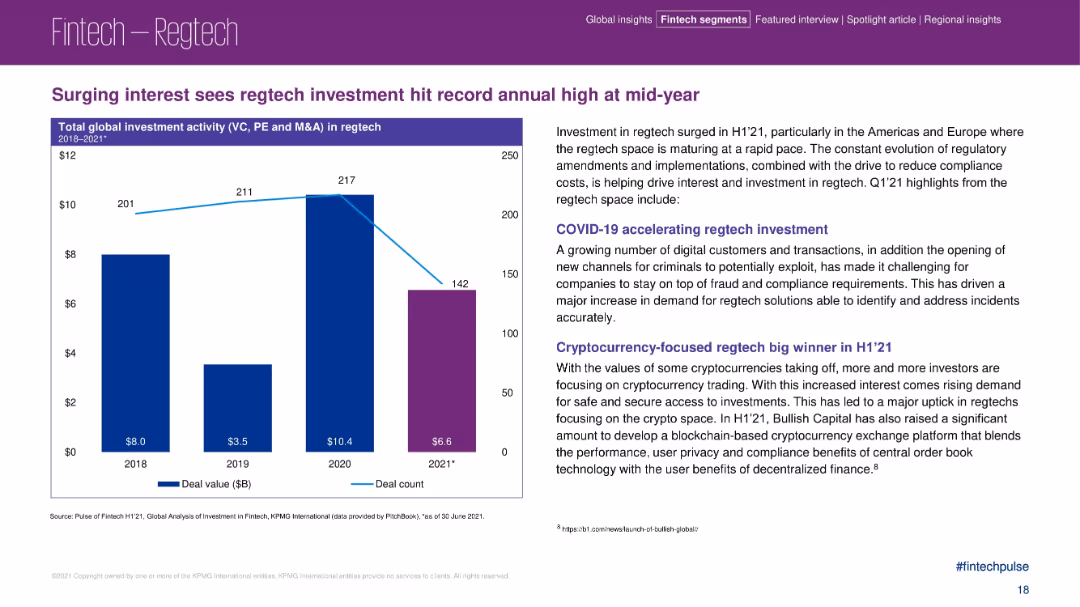
Bar chart on the left showing investment growth, paired with detailed insights on the right.
Risk Assessment and Management
Financial Services
This slide highlights a rise in regtech investment in H1 2021, particularly in the Americas and Europe. It attributes growth to regulatory changes, fraud prevention needs, and cryptocurrency-focused regtech. It also examines pandemic-driven digital transformation.
regtech, fintech compliance, digital fraud, cryptocurrency, investment surge, H1 2021
false
Risk Assessment and Management
Financial Services
Mixed Chart
KPMG
Add to my slides
Remove from favorites
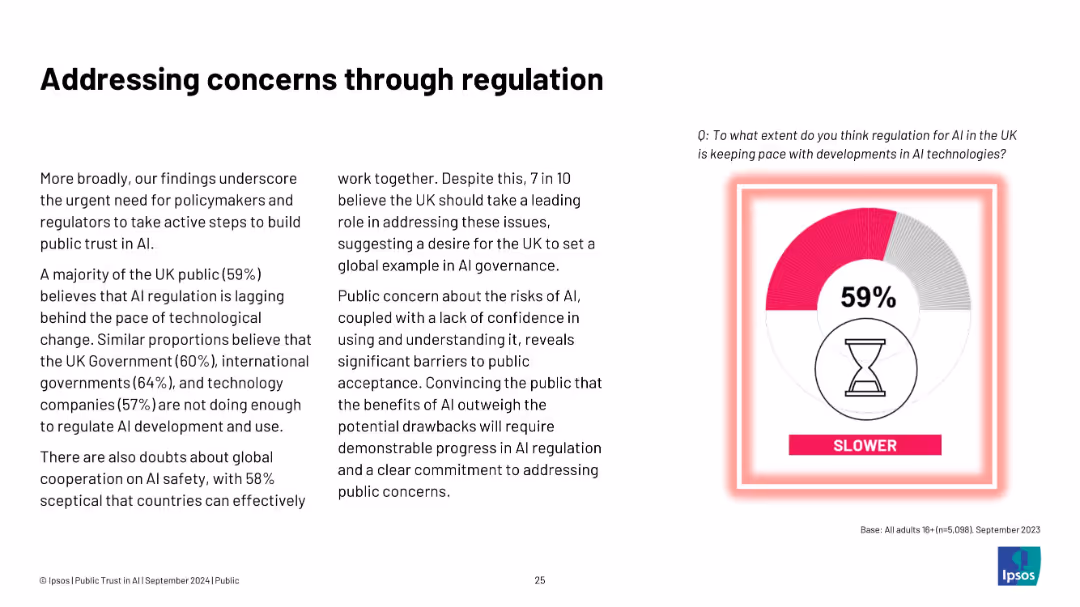
Left side contains detailed text explaining regulation gaps; right side has a circular chart with 59% indicating AI regulation is lagging behind technology developments.
Regulatory and Compliance
Artificial Intelligence
The slide presents findings that the public believes AI regulation is lagging behind tech advancements. It emphasizes the need for stronger governance and international cooperation. While most believe the UK should lead globally in AI oversight, there's skepticism about achieving this. Public concern over risks and insufficient regulation limits acceptance and adoption of AI technologies.
regulation, AI governance, public concern, international cooperation, UK policy, tech development, compliance
false
Regulatory and Compliance
Artificial Intelligence
Mixed Chart
IPSOS
Add to my slides
Remove from favorites
Horizontal bar chart showing likelihood of regulation by country. Simple layout with clean labeling.
Regulatory and Compliance
Government & Public Sector
This slide presents the public’s expectations for government regulation of big tech companies in 2025. Indonesia shows the highest anticipation for stricter rules. The chart also includes a comparison to past perceptions, indicating shifting expectations for tech policy.
regulation, big tech, government, policy, public opinion, tech companies
false
Regulatory and Compliance
Government & Public Sector
Mixed Chart
IPSOS
Add to my slides
Remove from favorites
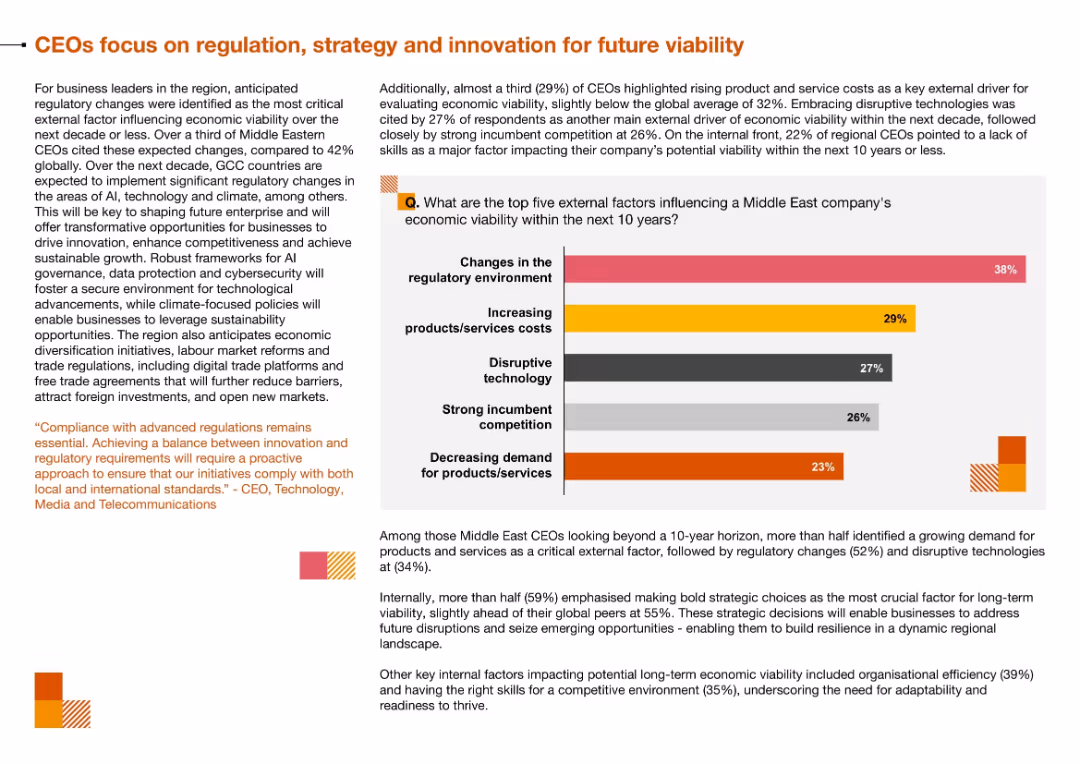
Bar chart of top five external factors influencing viability, with accompanying narrative on right; top section uses orange and gray color palette
Regulatory and Compliance
Technology & Software
The slide identifies the main external challenges facing Middle East businesses—particularly regulatory changes and rising costs—and the internal need to adapt through innovation and strategic decisions.
Regulation, Economic Viability, Disruptive Technology, Strategic Planning, Cost Pressures, Compliance
false
Regulatory and Compliance
Technology & Software
Mixed Chart
PwC/Strategy&
Add to my slides
Remove from favorites
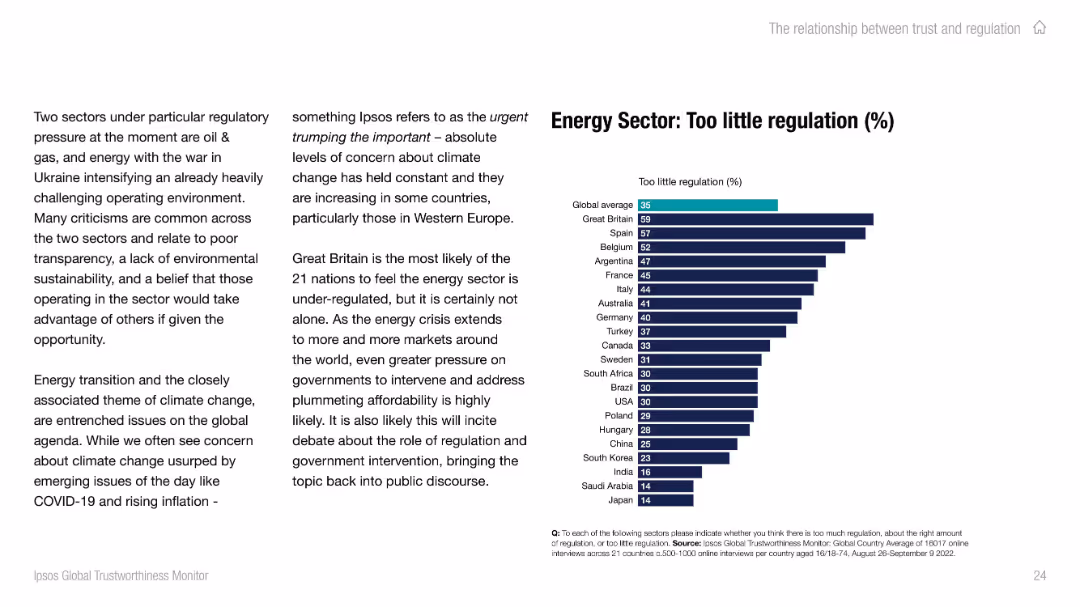
Split slide layout; left side contains paragraph text, right side features a horizontal bar chart comparing "Too little regulation (%)" by country with bold headings and teal/navy color scheme.
Regulatory and Compliance
Energy & Utilities
The slide highlights global perceptions of under-regulation in the energy sector, emphasizing the impact of climate concerns and geopolitical issues. A chart shows country-specific sentiment, with the UK having the highest concern and Japan the least.
regulation, energy, trust, climate, public opinion, global, Ipsos, chart, UK, Western Europe
false
Regulatory and Compliance
Energy & Utilities
Mixed Chart
IPSOS
Add to my slides
Remove from favorites
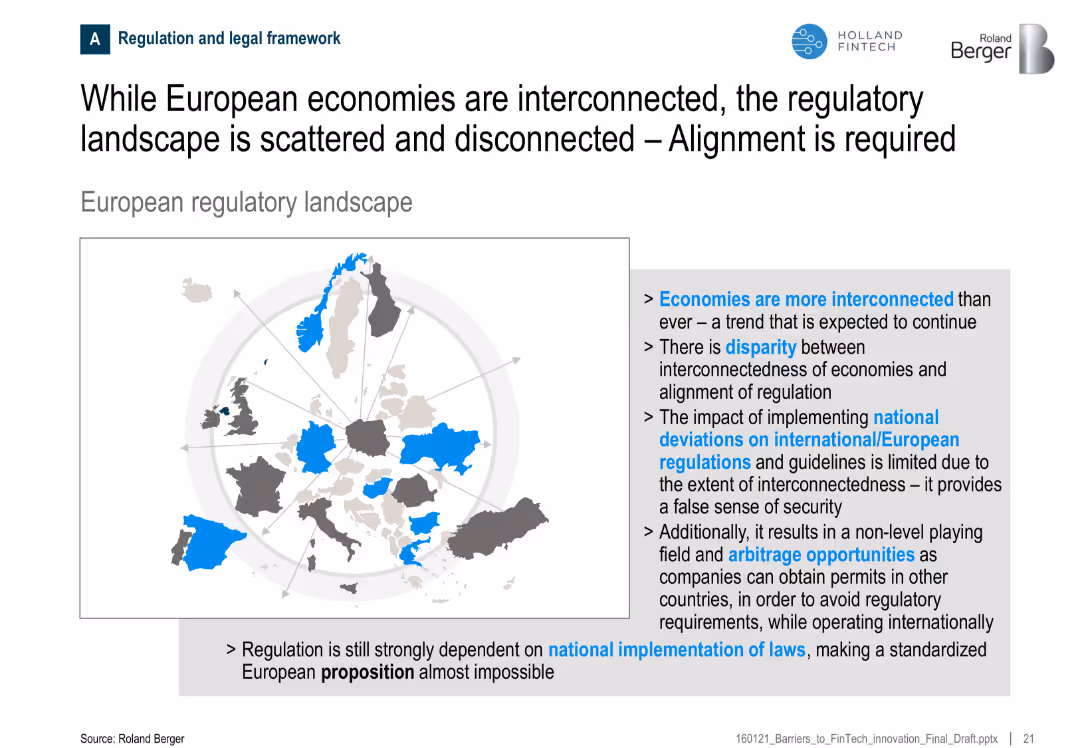
Split layout with a map of Europe on the left and bullet points on the right; grayscale and blue highlight theme
Regulatory and Compliance
Financial Services
The slide emphasizes the gap between the economic interconnectedness in Europe and the fragmented regulatory landscape. It argues for better regulatory alignment to avoid false security, arbitrage opportunities, and hindered standardization due to national law implementations.
regulation, Europe, alignment, interconnectedness, compliance, national laws, arbitrage, fragmentation
false
Regulatory and Compliance
Financial Services
Uncategorized
Roland Berger
Add to my slides
Remove from favorites
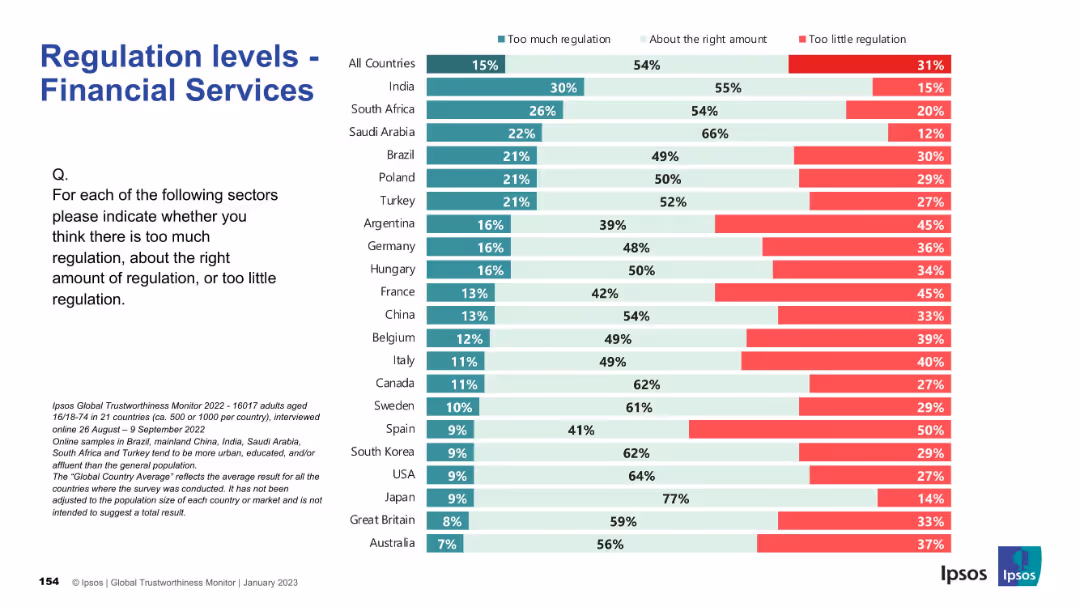
Horizontal stacked bar chart; country list on right; 3-color coded bars (too much, right, too little); left-aligned question and notes.
Regulatory and Compliance
Financial Services
The slide presents survey data from multiple countries assessing public opinion on the regulation of financial services. It shows the percentage of people who think regulation is excessive, adequate, or insufficient. India and Saudi Arabia have higher percentages thinking regulation is sufficient, while countries like France and Argentina see more calls for increased regulation.
regulation, financial services, global survey, Ipsos, public opinion, compliance, countries, policy perception, chart, governance
false
Regulatory and Compliance
Financial Services
Mixed Chart
IPSOS
Add to my slides
Remove from favorites
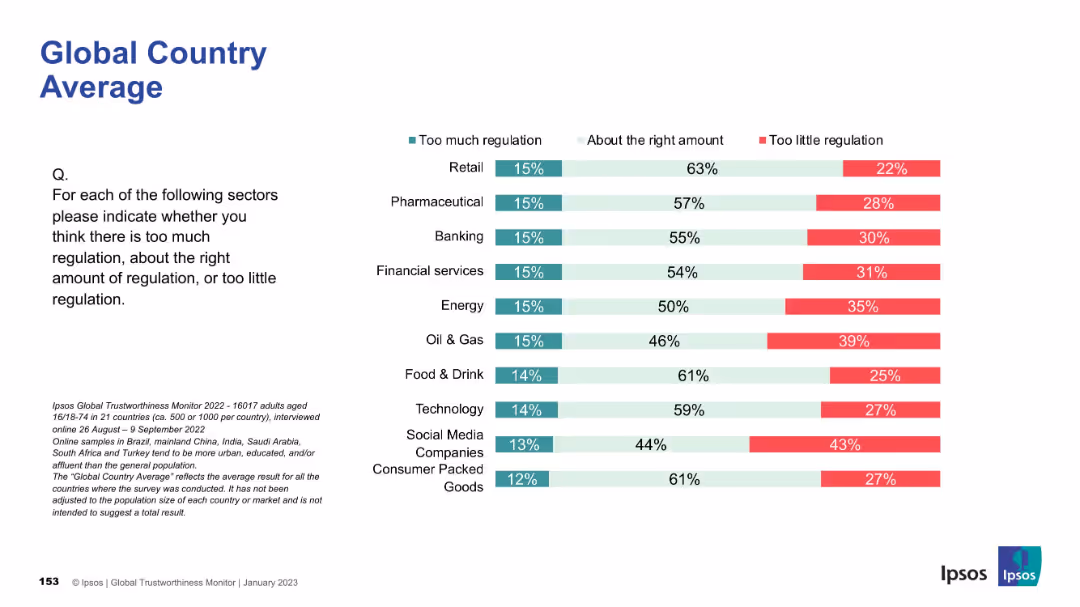
Stacked horizontal bars for multiple sectors; regulation perception shown by color-coded segments.
Regulatory and Compliance
Professional Services
This slide compares global perceptions of regulation across sectors including retail, pharma, tech, and finance. It shows whether respondents believe there is too much, too little, or the right amount of regulation.
regulation, global average, perception, sectors, compliance, policy, Ipsos
false
Regulatory and Compliance
Professional Services
Mixed Chart
IPSOS
Add to my slides
Remove from favorites
Previous
Next
You don't have any favorites yet.
Please wait loading your favorites slides...
Create a FREE account to continue browsing
Receive Instant Access to 1,000+ slides from companies like McKinsey, Google, and Goldman Sachs
First Name
Last Name
Email
Password
I agree to all
Terms & Privacy Policy
Thank you! Your submission has been received!
Oops! Something went wrong while submitting the form.
Have an account?
Sign in
Upgrade to PRO to Save slides
Advanced Search and Filters
Access to 15,000+ slides
Access to Category Pages
Save/Bookmark Slides
PowerPoint Template Library
Pick a Plan
MONTHLY
$12/month
Billed every month, Cancel anytime.
YEARLY
$9/year
Billed $108 annually, Cancel anytime.
Checkout for $12/month
Checkout for $108/yr
Secured by Stripe | AES-256 bit encryption


![The most important political issues in [Country] should be decided directly by the people through referendums, not by the elected officials](https://cdn.prod.website-files.com/654e70fb59937215cac87b19/6899be3385f8c694b07a78b3_BPnW09IxuUgW17OsnLattHgtFWwlU5sxgzfW-qWXUHw.avif)


![Q. Over the next few years, do you think refugees in [COUNTRY] are likely to have a positive or negative impact on each of the following, or not make much difference to:](https://cdn.prod.website-files.com/654e70fb59937215cac87b19/6899ca56175570c8a9d498eb_lLqwg6qIZuT9PL7tM39BAJqeor7iD6BnjhDGNGIMDOo.avif)


![Strict rules for large technology companies will be introduced by the Government in [COUNTRY]](https://cdn.prod.website-files.com/654e70fb59937215cac87b19/6899b94470d7bf58125be841_oy9SVpbyTLn49nrakEUExg_FaNGi9PgqfBlCip8VQJA.avif)