My Account
My Slides
Search by Category
Pricing
Templates
View All Templates
Download Template Slides
✦ AI Search
Feedback
Login
Logout
Get Started
Browse all Slides
Browse all Slides
Create a FREE Account
Instant access to 1,000+ real slides from top companies like McKinsey, BCG, Goldman Sachs, Google and many more!
First Name
Last Name
Email
Password
I agree to all
Terms & Privacy Policy
Thank you! Your submission has been received!
Oops! Something went wrong while submitting the form.
Have an account?
Sign in
Saved Slides
Total No. of slides saved
0
↻ Refresh
✖ Clear all
The slide features a blue and black color scheme with three main sections, each containing icons, percentages, and brief descriptions. There are various visual elements including charts, illustrations of vehicles and a piggy bank with a CO2 cloud. The layout is balanced with a clear visual hierarchy.
Market Analysis and Trends
Transportation & Logistics
The slide discusses three factors affecting supply chains and transportation: regulation, consumer acceptance of new mobility solutions, and technological disruptions. Each point highlights key statistics, like emission target percentages and investment increases in autonomous vehicles.
regulation, mobility, consumer preferences, technology disruption, supply chains, transportation
false
Market Analysis and Trends
Transportation & Logistics
Boxed
McKinsey
Add to my slides
Remove from favorites
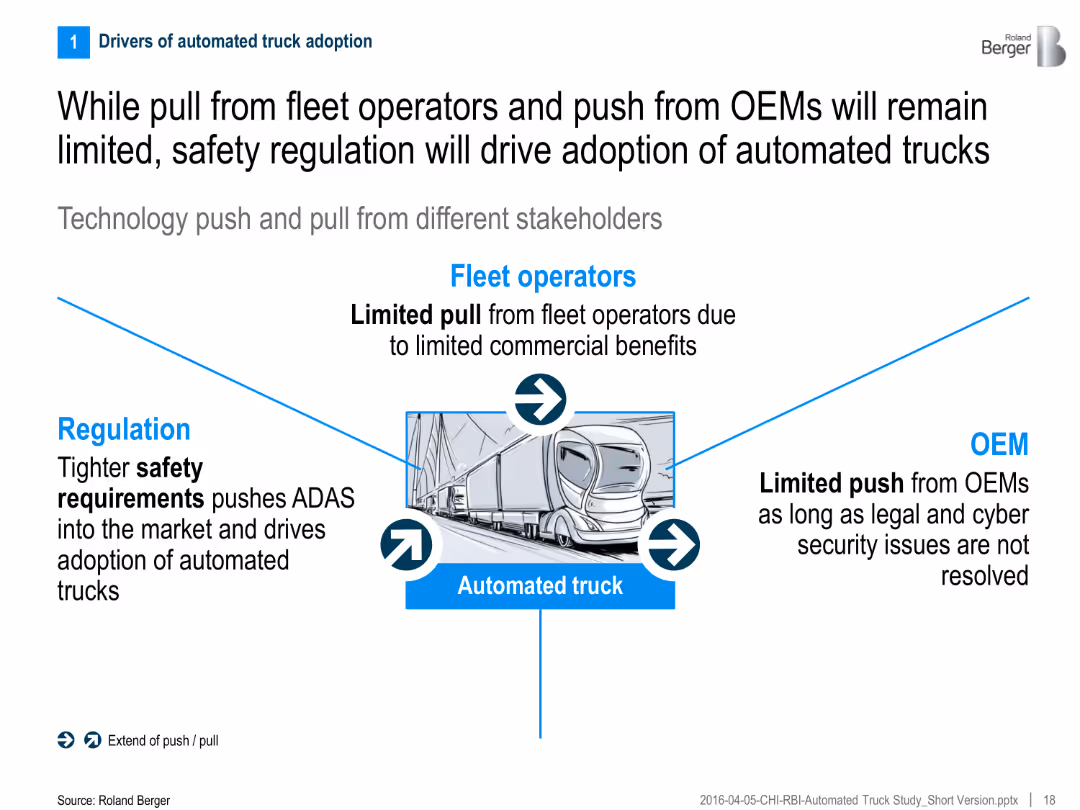
Central graphic showing push/pull from regulation, fleet operators, and OEMs toward automated truck adoption
Regulatory and Compliance
Transportation & Logistics
The slide highlights the limited commercial incentives from fleet operators and OEMs, stressing that regulation—especially safety requirements—is the key driver for automated truck adoption.
Regulation, OEMs, fleet operators, safety, automated trucks, adoption drivers, technology push/pull
false
Regulatory and Compliance
Transportation & Logistics
Linear Flow
Roland Berger
Add to my slides
Remove from favorites
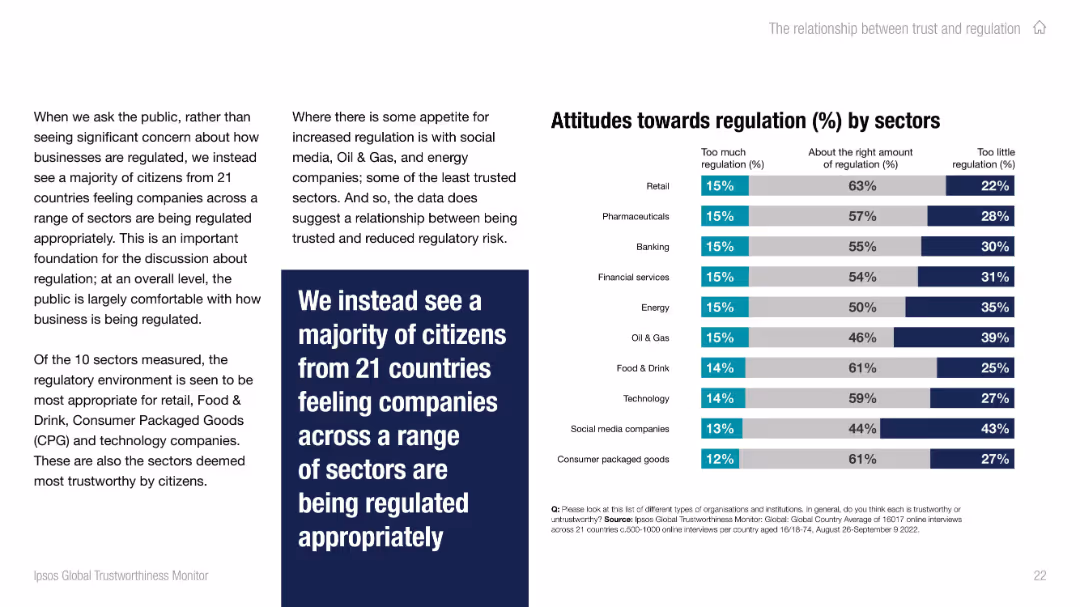
Left contains summary text; right side displays a grouped bar chart showing public opinion on regulation sufficiency across sectors.
Regulatory and Compliance
Professional Services
This slide details public attitudes toward business regulation across ten sectors. Most citizens believe regulation is appropriate, but a minority sees a need for more in sectors like social media and oil & gas. The chart helps identify where regulatory trust gaps exist.
regulation, public sentiment, compliance, sector trust, governance, business perception, regulation balance
false
Regulatory and Compliance
Professional Services
Mixed Chart
IPSOS
Add to my slides
Remove from favorites
Two content blocks comparing regulatory impacts on distributor margins in the alcohol and HVAC/safety equipment industries, with percentage values and bullet points.
Regulatory and Compliance
Financial Services
The slide discusses how regulations in certain industries like alcohol and HVAC allow distributors to command higher margins by providing technical expertise.
regulations, alcohol industry, HVAC, safety equipment, distributors, technical expertise, margins
false
Regulatory and Compliance
Financial Services
Header Horizontal
EY
Add to my slides
Remove from favorites
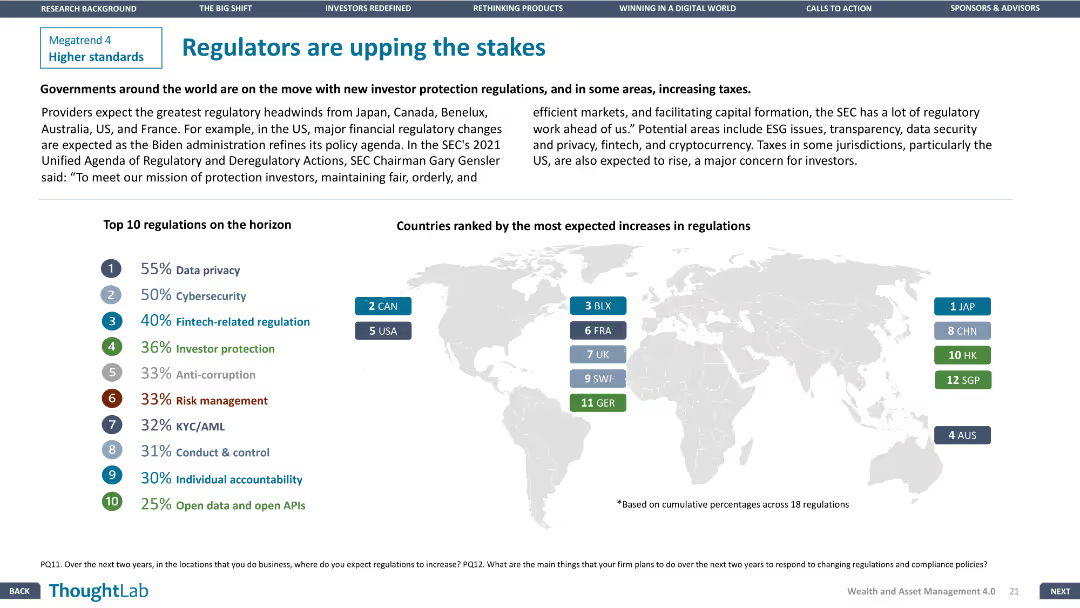
Column chart displaying top 10 regulations on the horizon. A world map highlights countries with expected regulatory increases. Layout is clear and informative.
Regulatory and Compliance
Financial Services
Discusses upcoming regulatory changes and the countries most impacted, highlighting the top 10 regulations on the horizon and their respective percentages.
regulations, compliance, financial, cybersecurity, fintech
false
Regulatory and Compliance
Financial Services
Graphic
Deloitte
Add to my slides
Remove from favorites
Features a detailed diagram with labeled circles around a central gray circle, representing market participants. The layout includes blue accents and a clear separation between U.S. and Non-U.S. regulations. The slide is numbered 5.
Regulatory and Compliance
Financial Services
The slide offers a comprehensive look at increased regulations affecting market structure, distinguishing between U.S. and global frameworks. It serves as a detailed regulatory reference for market participants.
regulations, compliance, market structure, U.S., global
false
Regulatory and Compliance
Financial Services
Framework
Goldman Sachs
Add to my slides
Remove from favorites
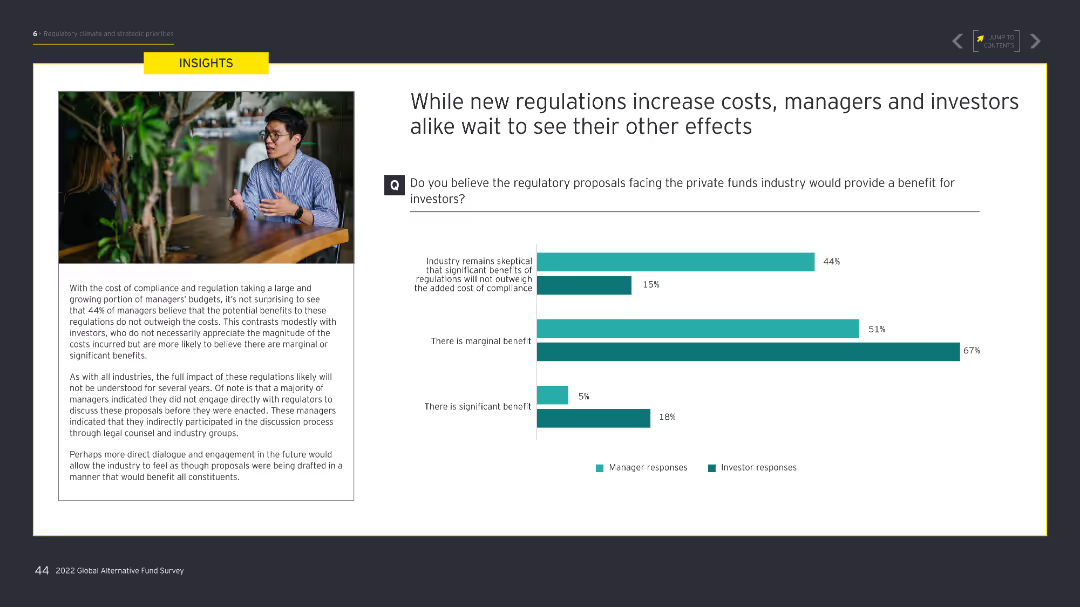
This slide includes a large image on the left and column charts on the right showing managers' and investors' perspectives on the benefits of regulatory proposals for the private funds industry.
Regulatory and Compliance
Financial Services
The slide examines the perceived benefits of new regulatory proposals for the private funds industry, highlighting differences in opinion between managers and investors.
regulations, costs, benefits, managers, investors
false
Regulatory and Compliance
Financial Services
Mixed Chart
EY
Add to my slides
Remove from favorites
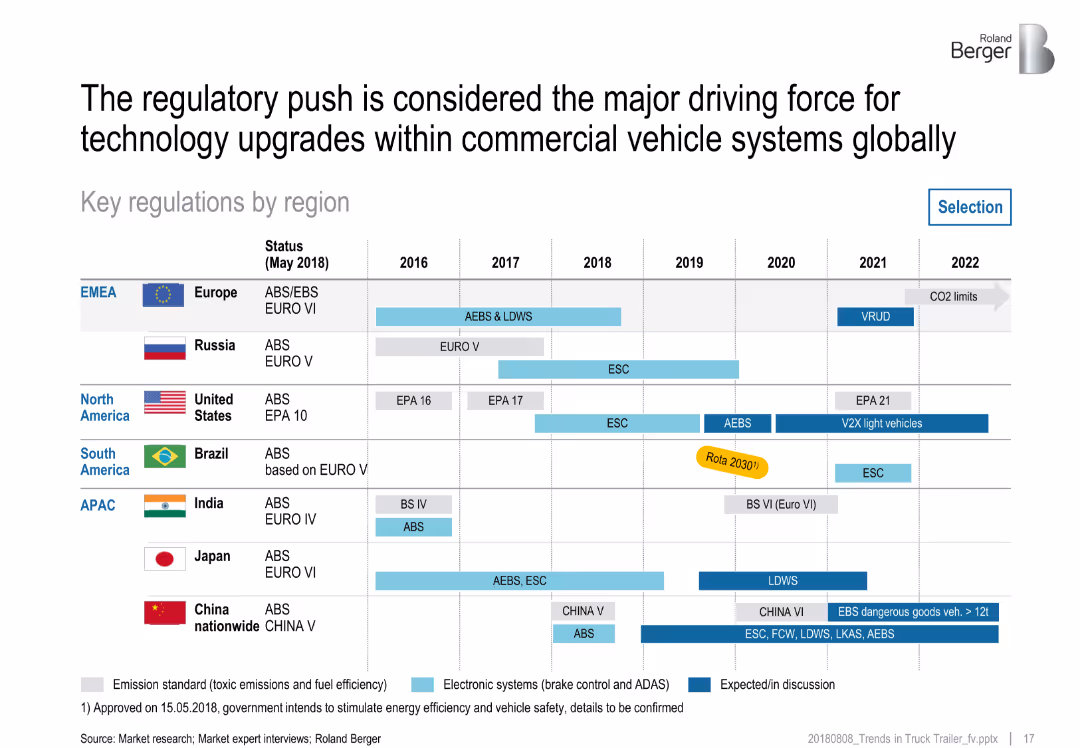
Region-wise horizontal bar chart across years showing emission and safety regulations; uses color codes for regulation types
Regulatory and Compliance
Transportation & Logistics
This slide summarizes regulatory timelines and changes from 2016–2022 across global regions. It includes emission standards and safety systems (e.g., AEBS, LDWS), noting the role of regulation in driving commercial vehicle technology improvements worldwide.
regulations, emissions, safety systems, EMEA, APAC, North America, technology compliance, vehicle systems
false
Regulatory and Compliance
Transportation & Logistics
Table
Roland Berger
Add to my slides
Remove from favorites
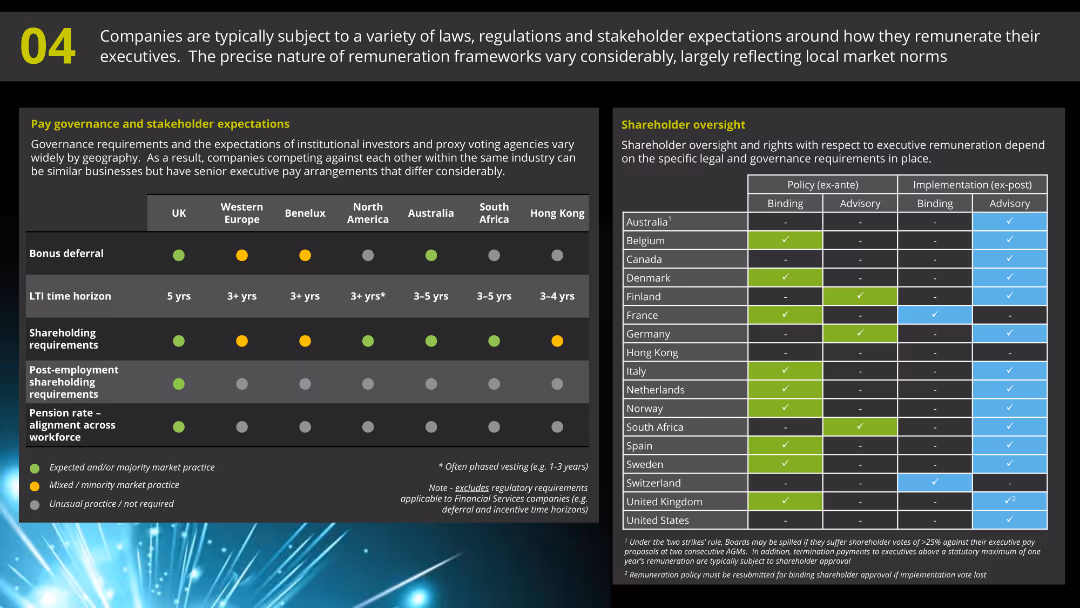
A comparative table on the left showing governance and stakeholder expectations across different regions, and another table on the right detailing shareholder oversight practices in various countries.
Regulatory and Compliance
Financial Services
This slide covers the diversity in laws, regulations, and stakeholder expectations for executive remuneration, and compares shareholder oversight policies and practices in various regions.
Regulations, Governance, Stakeholder, Oversight, Compliance
false
Regulatory and Compliance
Financial Services
Boxed
Deloitte
Add to my slides
Remove from favorites
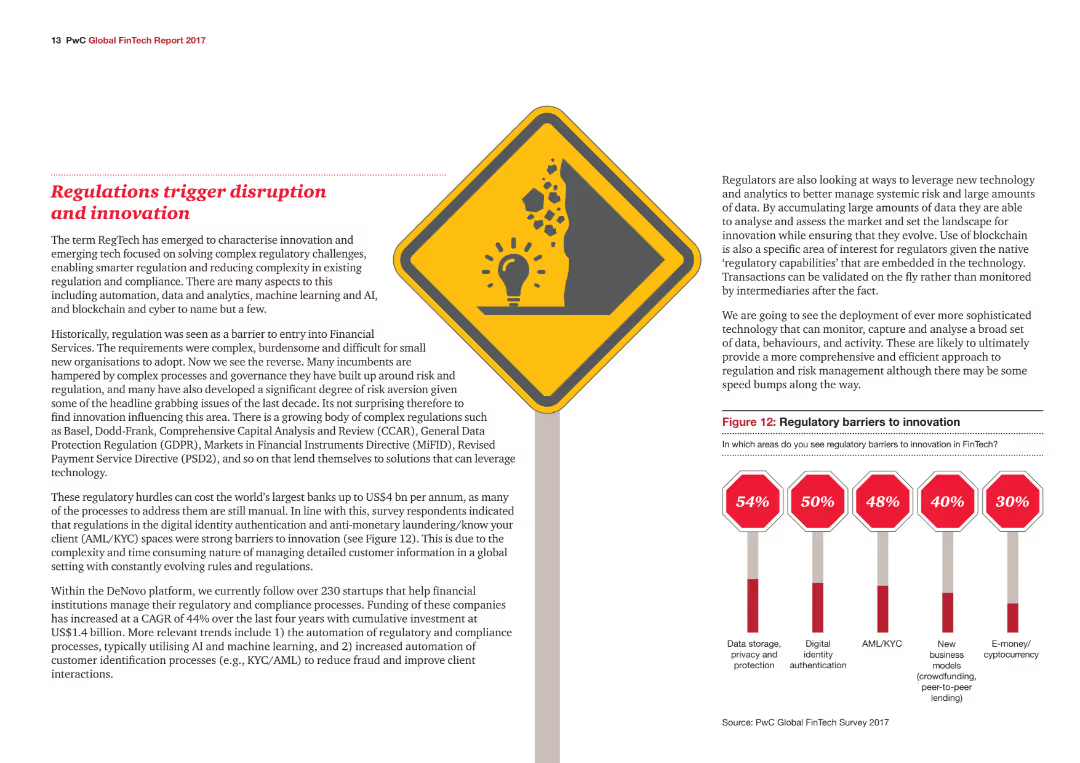
The slide features an icon and a column chart showing the percentage of respondents identifying various regulatory barriers to innovation, with color-coded data points.
Regulatory and Compliance
Financial Services
The slide explains how regulatory challenges in the financial services industry are driving innovation and disruption, focusing on specific regulatory barriers.
Regulations, Innovation, Compliance, Financial Services, Barriers
false
Regulatory and Compliance
Financial Services
Mixed Chart
PwC/Strategy&
Add to my slides
Remove from favorites
The slide features a pie chart with three sections: 32% won’t impact plans, 26% have tenants rent, and 40% sell property.
Regulatory and Compliance
Real Estate & Construction
This slide examines the effect of short-term rental regulations on investors' decisions regarding their properties, indicating a significant portion may sell.
regulations, short-term rentals, investment, decision making, pie chart, property sale
false
Regulatory and Compliance
Real Estate & Construction
Single Chart
IPSOS
Add to my slides
Remove from favorites
The slide features a pie chart with three sections: 45% won’t impact plans, 33% have tenants rent, and 20% no longer purchase.
Regulatory and Compliance
Real Estate & Construction
This slide shows how regulations on short-term rentals impact investors' decisions to buy properties. It indicates the percentage of investors affected in different ways.
regulations, short-term rentals, investment, property, decision making, pie chart, investor impact
false
Regulatory and Compliance
Real Estate & Construction
Single Chart
IPSOS
Add to my slides
Remove from favorites
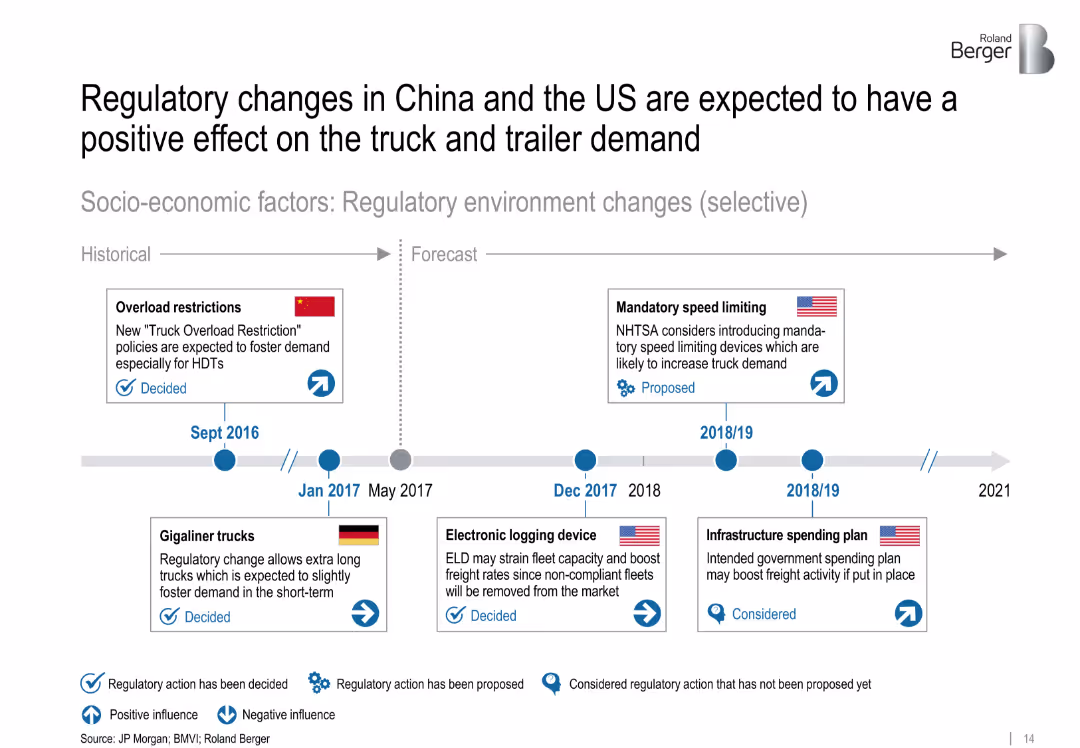
Timeline with icons indicating regulatory events and their impact on demand. Visual coding for positive/negative effects and decision status.
Strategic Planning
Transportation & Logistics
This timeline outlines selected regulatory changes between 2016 and 2021 in China, the US, and Germany. These include overload restrictions, speed limiting proposals, and infrastructure plans that influence heavy truck and trailer demand.
['regulations', 'truck demand', 'policy', 'China', 'US', 'timeline', 'logistics', 'forecast', 'strategic planning']
false
Strategic Planning
Transportation & Logistics
Uncategorized
Roland Berger
Add to my slides
Remove from favorites
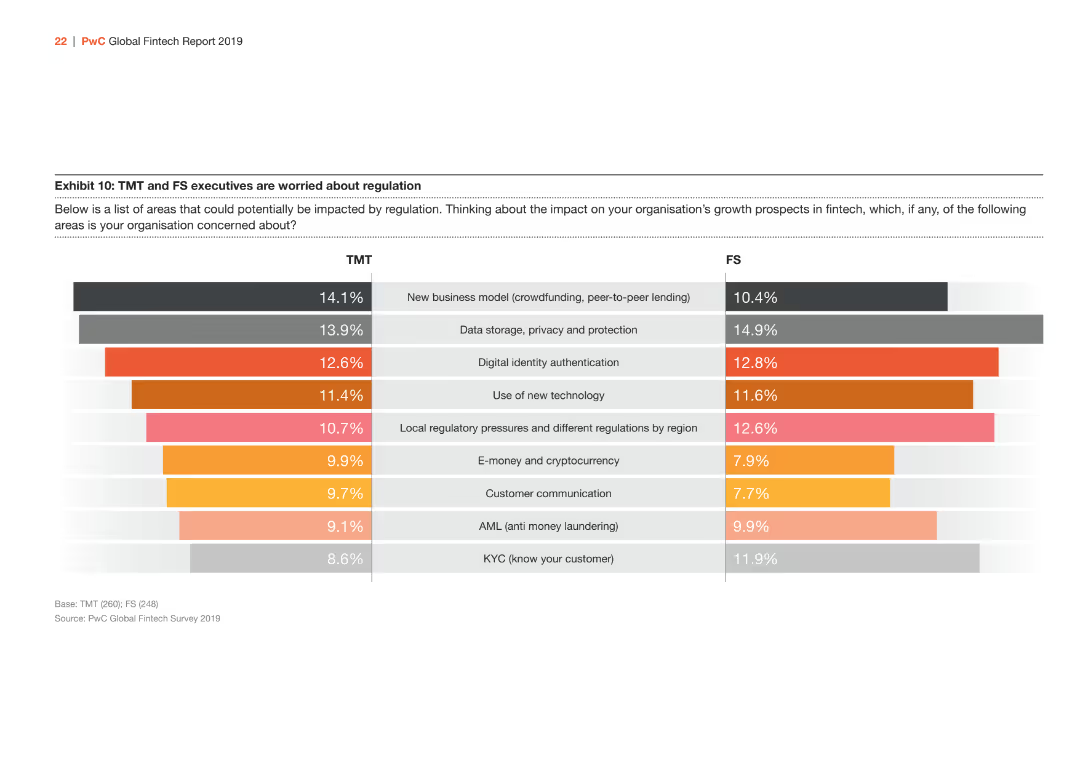
This slide contains a horizontal bar chart (bar chart) that shows regulatory concerns for TMT and FS organizations. Each bar represents a different regulatory concern with varying shades of orange.
Regulatory and Compliance
Financial Services
The slide lists regulatory areas of concern for TMT and FS executives, including data storage, privacy, digital identity authentication, and local regulatory pressures.
Regulation, TMT, FS, Concerns, Data, Privacy
false
Regulatory and Compliance
Financial Services
Multiple Chart
PwC/Strategy&
Add to my slides
Remove from favorites
A more detailed slide featuring three main content sections, each with a distinct icon and bullet points, discussing broad uncertainties affecting Web3 adoption. The design uses a combination of blue, white, and grey.
Risk Assessment and Management
Technology & Software
This slide examines broader uncertainties affecting Web3 adoption, such as evolving regulation, user experience challenges, and ecosystem infrastructure maturity. It's meant to present a critical perspective on Web3's potential impact across various sectors.
Regulation, User Experience, Ecosystem Infrastructure, Web3
false
Risk Assessment and Management
Technology & Software
Boxed
McKinsey
Add to my slides
Remove from favorites
This slide presents column chart comparing current MREL/TLAC requirements with available capital resources, highlighted with clear, distinct colors for different types of capital. Key highlights discuss regulatory implications.
Regulatory and Compliance
Financial Services
Discusses the institution's capacity to meet and exceed regulatory capital requirements, providing a detailed view on the sufficiency of loss-absorbing capacity, and strategic planning implications for financial stability.
regulatory, capital, financial, stability, planning
false
Regulatory and Compliance
Financial Services
Mixed Chart
Deutsche Bank
Add to my slides
Remove from favorites
Consists of a stacked column chart detailing regulatory capital movement within Macquarie Capital, segmented by type of investment. The chart uses color coding to differentiate between investment categories, with a clear legend and date annotations.
Investment Analysis
Financial Services
This slide presents the regulatory capital movement within Macquarie Capital, breaking down investments and realizations over time, intended for use in investment analysis and regulatory reporting.
regulatory capital, Macquarie Capital, investments, realizations, analysis, reporting, finance
false
Investment Analysis
Financial Services
Single Chart
Goldman Sachs
Add to my slides
Remove from favorites
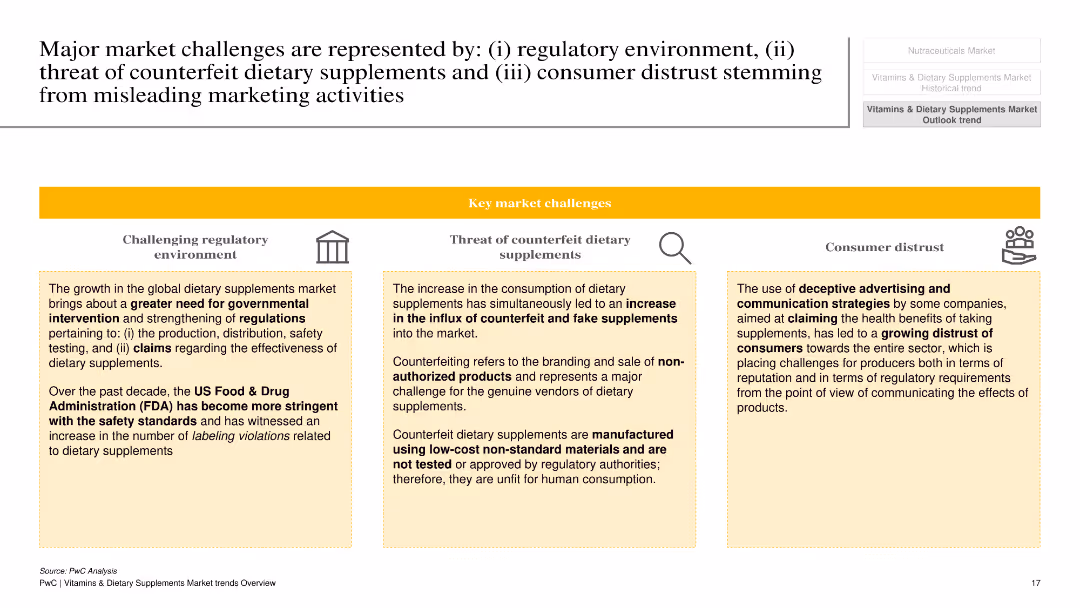
The slide is divided into three sections with icons and text blocks under each section: challenging regulatory environment, threat of counterfeit dietary supplements, and consumer distrust. Each section is highlighted with a yellow banner and corresponding icons.
Risk Assessment and Management
Healthcare & Pharmaceuticals
The slide discusses major challenges in the dietary supplements market, including regulatory hurdles, the threat of counterfeit products, and consumer distrust due to misleading marketing activities. It explains how these challenges impact the industry and emphasizes the need for better regulations and consumer protection.
regulatory challenges, counterfeit supplements, consumer distrust, dietary supplements, market risks
false
Risk Assessment and Management
Healthcare & Pharmaceuticals
Pillar
PwC/Strategy&
Add to my slides
Remove from favorites
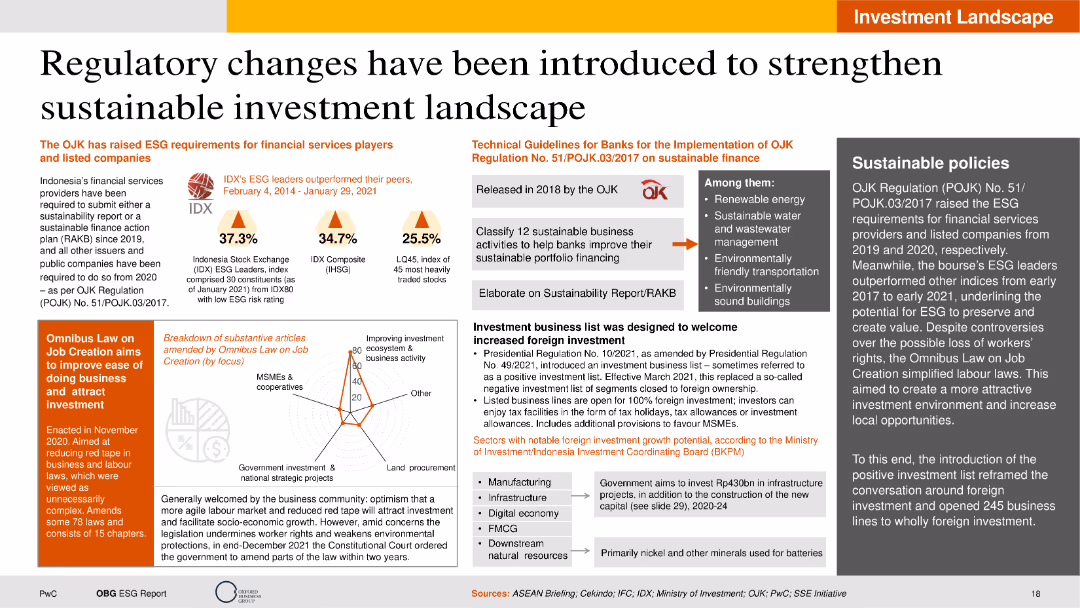
The slide is moderately dense with a combination of text, column charts, icons, and infographics. It has a clear layout featuring sections with distinct background colors for easy distinction. Key metrics are highlighted using column charts.
Regulatory and Compliance
Financial Services
The slide discusses recent regulatory changes in Indonesia aimed at strengthening the sustainable investment landscape. It covers the introduction of ESG requirements, technical guidelines for banks, and the impact of the Omnibus Law on job creation. The slide includes statistical performance data of IDX ESG leaders and highlights key areas for sustainable business activities.
Regulatory changes, ESG requirements, sustainable finance, Omnibus Law, IDX performance
false
Regulatory and Compliance
Financial Services
Mixed Chart
PwC/Strategy&
Add to my slides
Remove from favorites
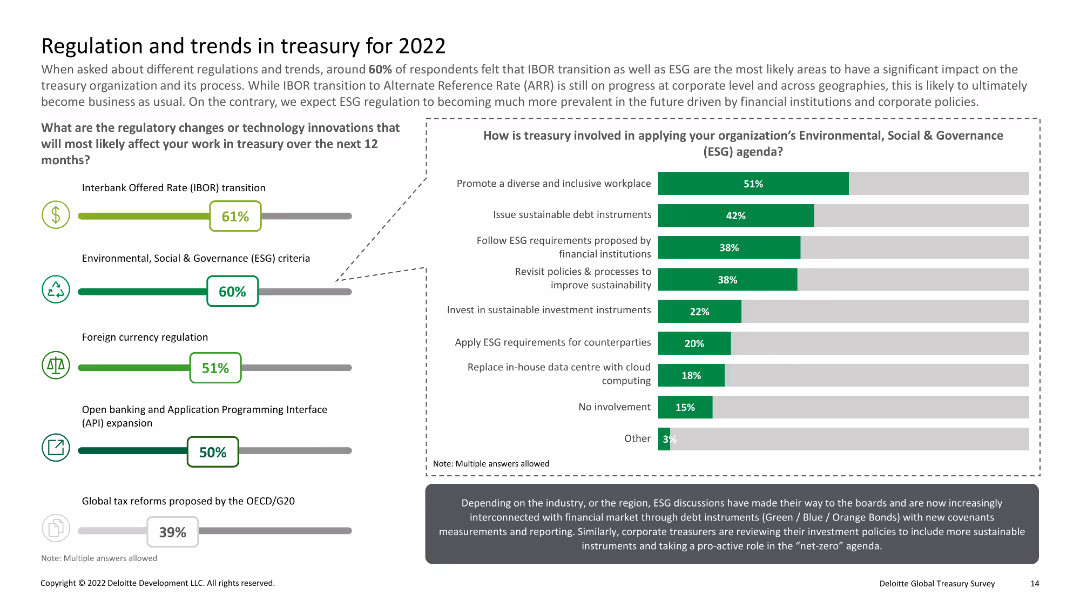
Multiple icons with percentages; column charts detailing involvement in ESG agenda, IBOR transition, etc.
Regulatory and Compliance
Financial Services
Covers regulatory changes and technology innovations affecting treasury work, with a focus on ESG criteria and IBOR transition.
Regulatory changes, ESG, treasury, IBOR, trends
false
Regulatory and Compliance
Financial Services
Multiple Chart
Deloitte
Add to my slides
Remove from favorites
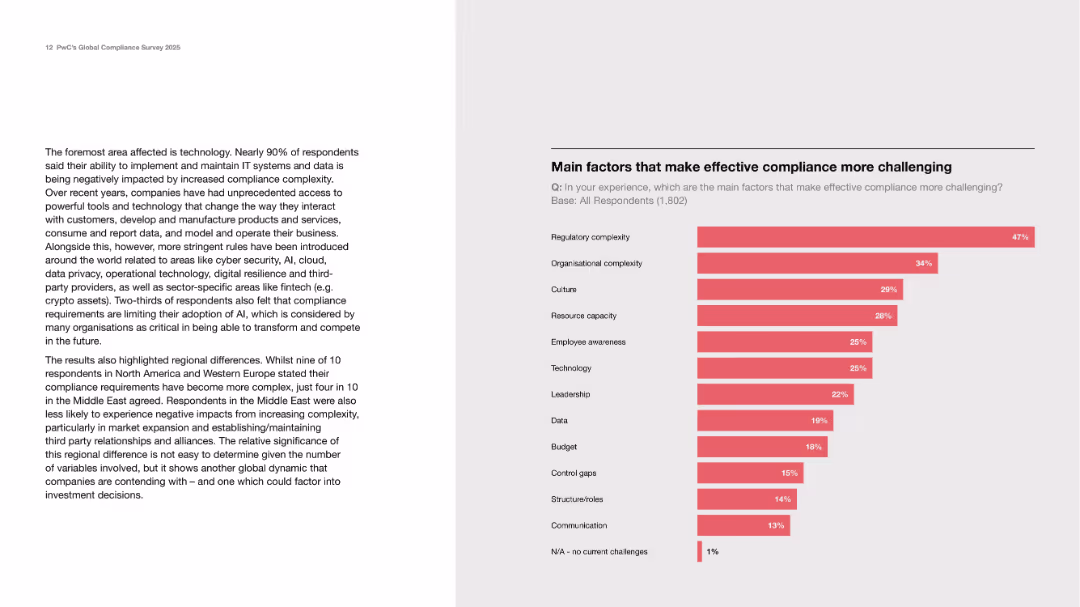
Text on tech challenges on the left; bar chart on the right ranking top challenges to effective compliance.
Operational Efficiency
Technology & Software
Identifies regulatory and organizational complexity, culture, and resource capacity as top barriers to compliance effectiveness. The left section emphasizes the major tech and regional effects on compliance adaptation.
regulatory complexity, compliance barriers, AI, tech, culture
false
Operational Efficiency
Technology & Software
Mixed Chart
PwC/Strategy&
Add to my slides
Remove from favorites
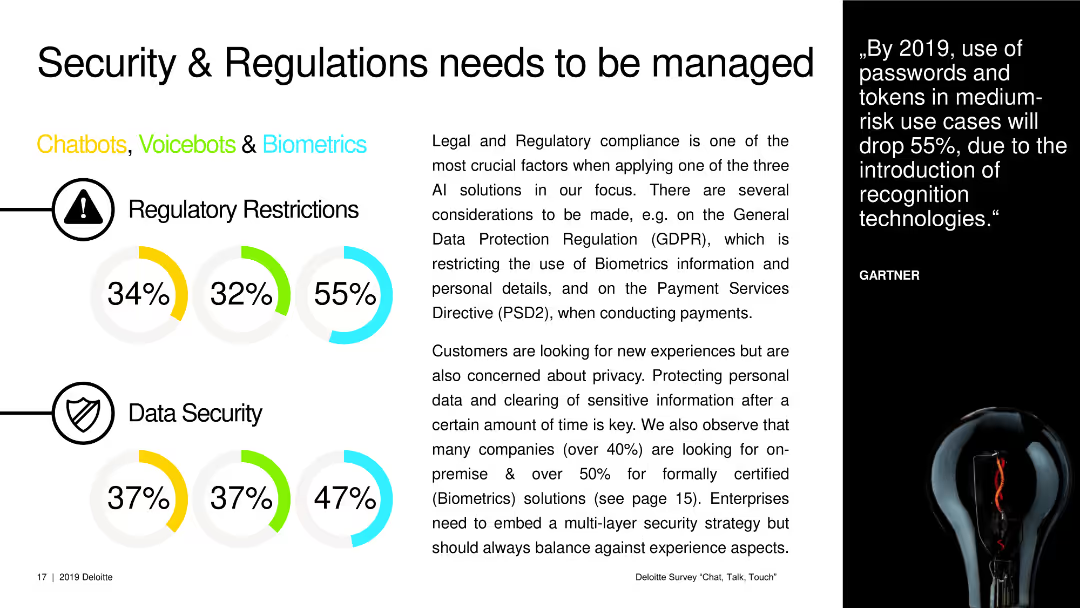
A text slide with pie charts showing regulatory and data security concerns related to chatbots, voicebots, and biometrics.
Regulatory and Compliance
Technology & Software
This slide discusses the importance of managing regulatory and data security issues when implementing chatbots, voicebots, and biometrics.
regulatory compliance, data security, chatbots, voicebots, biometrics, technology regulations
false
Regulatory and Compliance
Technology & Software
Multiple Chart
Deloitte
Add to my slides
Remove from favorites
The slide contains a column chart showing managers' preparedness for upcoming global regulatory changes. An image of professionals discussing work is on the left.
Regulatory and Compliance
Financial Services
Analyzes the readiness of managers for upcoming global regulatory changes, detailing different levels of preparedness and gaps in infrastructure.
regulatory, compliance, managers, preparedness, global changes, investment, infrastructure, professionals, analysis
false
Regulatory and Compliance
Financial Services
Mixed Chart
EY
Add to my slides
Remove from favorites
The slide features a column chart showing compliance commitments closed over time and text describing engagement with regulators, key regulatory programs, and the strategic office.
Regulatory and Compliance
Financial Services
This slide outlines the roadmap to meet regulatory commitments, highlighting transparency, compliance progress, and oversight improvements with a visual representation of achievements.
regulatory, compliance, roadmap, transparency, oversight
false
Regulatory and Compliance
Financial Services
Mixed Chart
Credit Suisse
Add to my slides
Remove from favorites
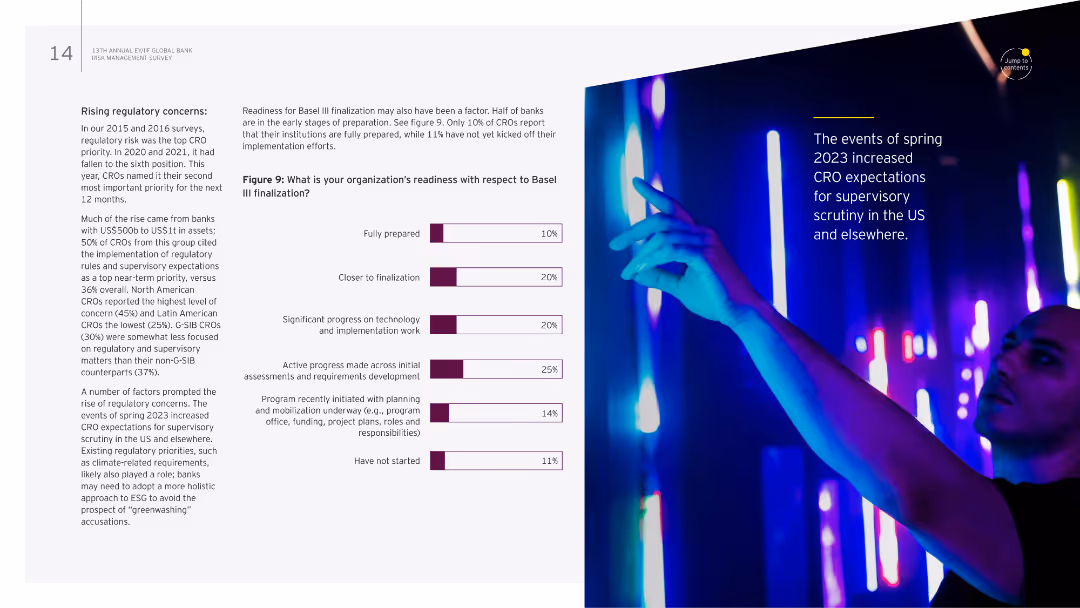
The slide has a textual overview on the left and a column chart on the right. The chart shows readiness levels for Basel III finalization among organizations.
Regulatory and Compliance
Financial Services
It details regulatory concerns, especially the readiness for Basel III finalization, and discusses varying levels of preparedness among institutions.
Regulatory concerns, Basel III, readiness, compliance, risk management
false
Regulatory and Compliance
Financial Services
Mixed Chart
EY
Add to my slides
Remove from favorites
This slide presents graphical representations of RWA density and the impact of IRB on Barclays' strategy. It uses color contrasts to highlight different years and projected outcomes, with a clear, organized layout that facilitates comprehension of complex regulatory impacts.
Regulatory and Compliance
Financial Services
Outlines Barclays' strategic responses to regulatory requirements, focusing on how the bank plans to manage and mitigate the impact of increased risk-weighted assets due to IRB regulations.
regulatory impact, IRB, risk management, strategic response
false
Regulatory and Compliance
Financial Services
Mixed Chart
Barclays
Add to my slides
Remove from favorites
Features stacked column charts with annotations. Detailed data on investments and cost structures over a period.
Operational Efficiency
Financial Services
Details reduction in regulatory costs allowing for increased investments in growth from 2023 to 2026.
regulatory, investments, growth, costs, 2026
false
Operational Efficiency
Financial Services
Single Chart
Barclays
Add to my slides
Remove from favorites
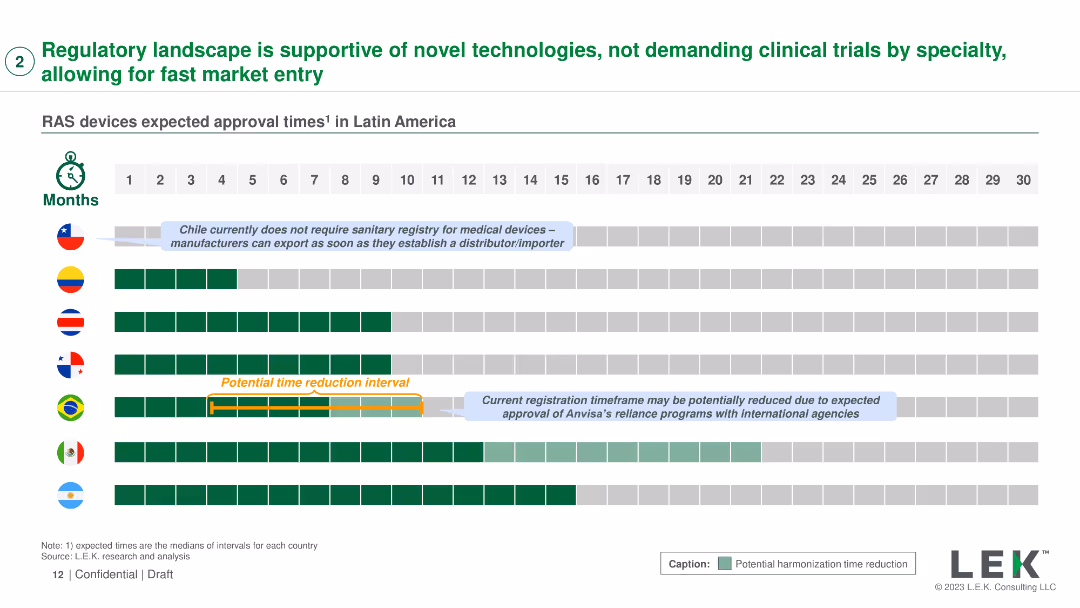
A timeline with flags of Latin American countries, indicating regulatory approval times for RAS devices
Regulatory and Compliance
Healthcare & Pharmaceuticals
Discusses the supportive regulatory landscape for novel technologies in Latin America, allowing for quicker market entry
regulatory landscape, market entry, RAS devices, Latin America, healthcare
false
Regulatory and Compliance
Healthcare & Pharmaceuticals
Single Chart
LEK
Add to my slides
Remove from favorites
This slide includes a series of vertical column chart depicting 'Bank Group Level 2 Ratios', focusing on different financial metrics such as CET1 ratio, Leverage ratio, LCR, and NSFR.
Regulatory and Compliance
Financial Services
Provides a visual representation of Macquarie's regulatory ratios, crucial for assessing the company's compliance with financial regulations and risk management.
Regulatory Ratios, Financial Metrics, Compliance, Risk Management
false
Regulatory and Compliance
Financial Services
Multiple Chart
Morgan Stanley
Add to my slides
Remove from favorites
The slide contains column charts depicting total loss-absorbing capacity, capital ratio, and leverage ratio against Swiss capital requirements.
Regulatory and Compliance
Financial Services
This slide emphasizes that Credit Suisse's capital significantly exceeds regulatory requirements, ensuring financial stability and compliance.
regulatory requirements, capital, leverage ratio, loss-absorbing capacity, financial stability
false
Regulatory and Compliance
Financial Services
Multiple Chart
Credit Suisse
Add to my slides
Remove from favorites
Timeline showing upcoming sustainability regulations and directives from 2023 to 2024.
Regulatory and Compliance
Consumer Goods
Outlines the increasing regulatory pressures on brands to accelerate sustainability efforts, detailing key regulations.
Regulatory, Sustainability, Compliance, Brands, Pressure
false
Regulatory and Compliance
Consumer Goods
Vertical Flow
Kearney
Add to my slides
Remove from favorites
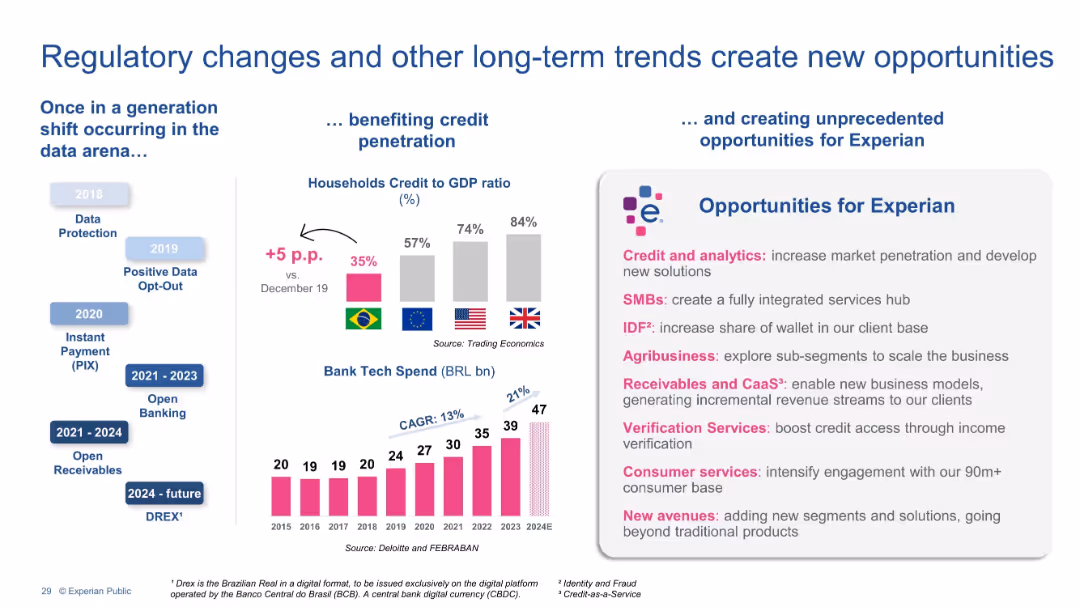
Three-column layout with timelines, bar charts, and opportunity boxes. Left column shows historical regulatory changes, center presents credit-to-GDP comparisons and bank tech spend, and right highlights opportunities for Experian.
Strategic Planning
Financial Services
This slide highlights how regulatory shifts (e.g., PIX, Open Banking) and global credit penetration trends are driving opportunities for Experian. It outlines specific growth areas including credit analytics, SMBs, agribusiness, and verification services, positioning Experian to benefit from evolving financial infrastructure.
Regulatory trends, Credit penetration, Experian, Fintech, Open Banking, Bank tech spend, Opportunities, Credit analytics, SMB, Agribusiness
false
Strategic Planning
Financial Services
Multiple Chart
Barclays
Add to my slides
Remove from favorites
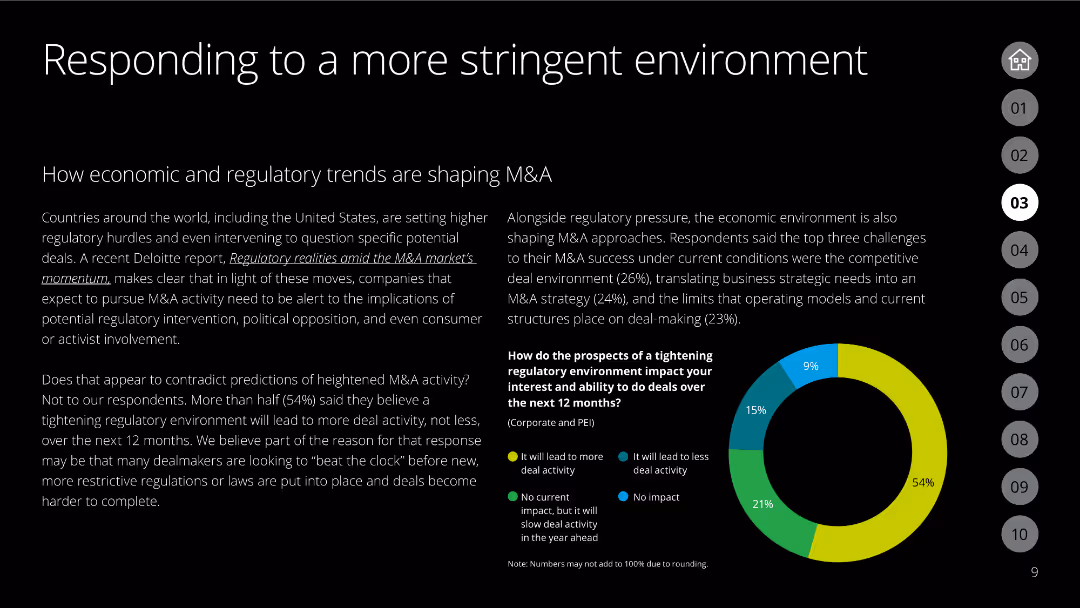
The slide has a donut chart showing responses to regulatory environment impacts on M&A activities.
Regulatory and Compliance
Financial Services
Analyzes how economic and regulatory trends are shaping M&A, with a focus on tightening regulations.
regulatory trends, M&A, economic environment, compliance, survey
false
Regulatory and Compliance
Financial Services
Mixed Chart
Deloitte
Add to my slides
Remove from favorites
The slide is divided into two halves. The left side features a column chart with three vertical bars overlaid on digital imagery of cityscapes and networks, signifying a +30% change. The right side has a similar design with digital network imagery, indicating a +7% change.
Strategic Planning
Technology & Software
The slide presents comparative data on the importance of selecting business partners and cloud services partners in delivering reinvention strategies, with percentage responses from Total Enterprise Reinventors, Transformers, and Optimizers highlighted on bar graphs.
reinvention, business partner, cloud services, strategy, comparative data, enterprise reinventors, transformers, optimizers
false
Strategic Planning
Technology & Software
Multiple Chart
Accenture
Add to my slides
Remove from favorites
This slide includes multiple column charts showcasing percentages of companies accelerating their reinvention in response to external forces like technology innovation and consumer preferences. Additionally, it provides insights into how organizations might react to a recession in various regions.
Strategic Planning
Technology & Software
Detailing the catalysts for organizational reinvention strategies, this slide is likely used to communicate the urgency and factors prompting companies to adapt swiftly to external changes, with emphasis on technology's role in driving future business strategies and operational enhancements.
reinvention, strategy, technology, innovation, recession, global, regional
false
Strategic Planning
Technology & Software
Multiple Chart
Accenture
Add to my slides
Remove from favorites
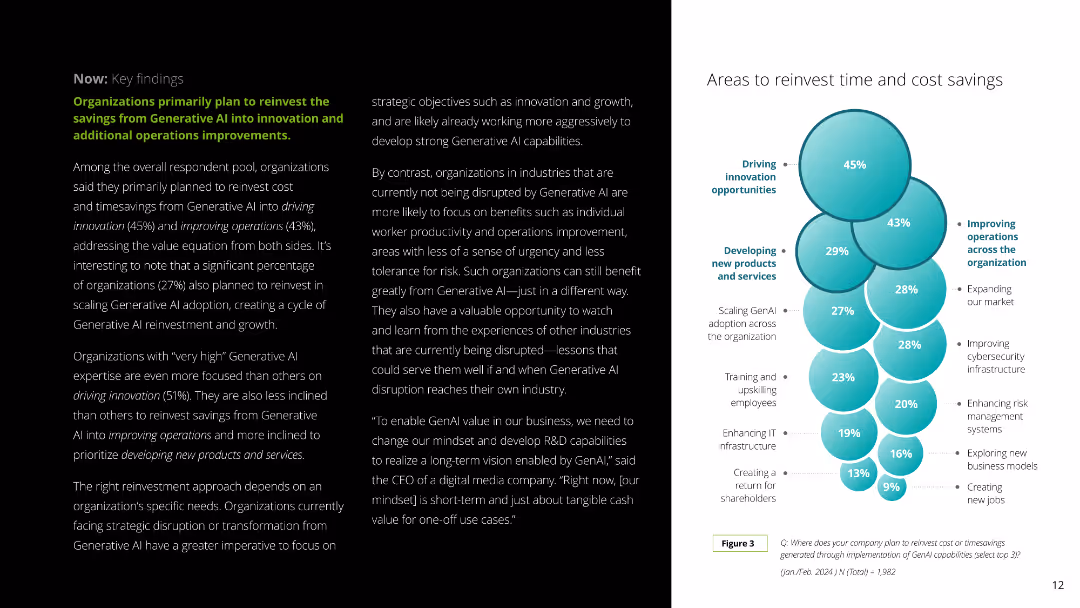
This slide combines text and a circular diagram to explain how organizations plan to reinvest savings from Generative AI into innovation and operational improvements. The layout is clean and color-coded for clarity.
Strategic Planning
Technology & Software
It discusses how companies plan to reinvest savings from Generative AI in driving innovation, improving operations, and developing new products, with a focus on strategic reinvestment areas.
reinvestment, savings, AI, innovation, operations
false
Strategic Planning
Technology & Software
Mixed Chart
Deloitte
Add to my slides
Remove from favorites
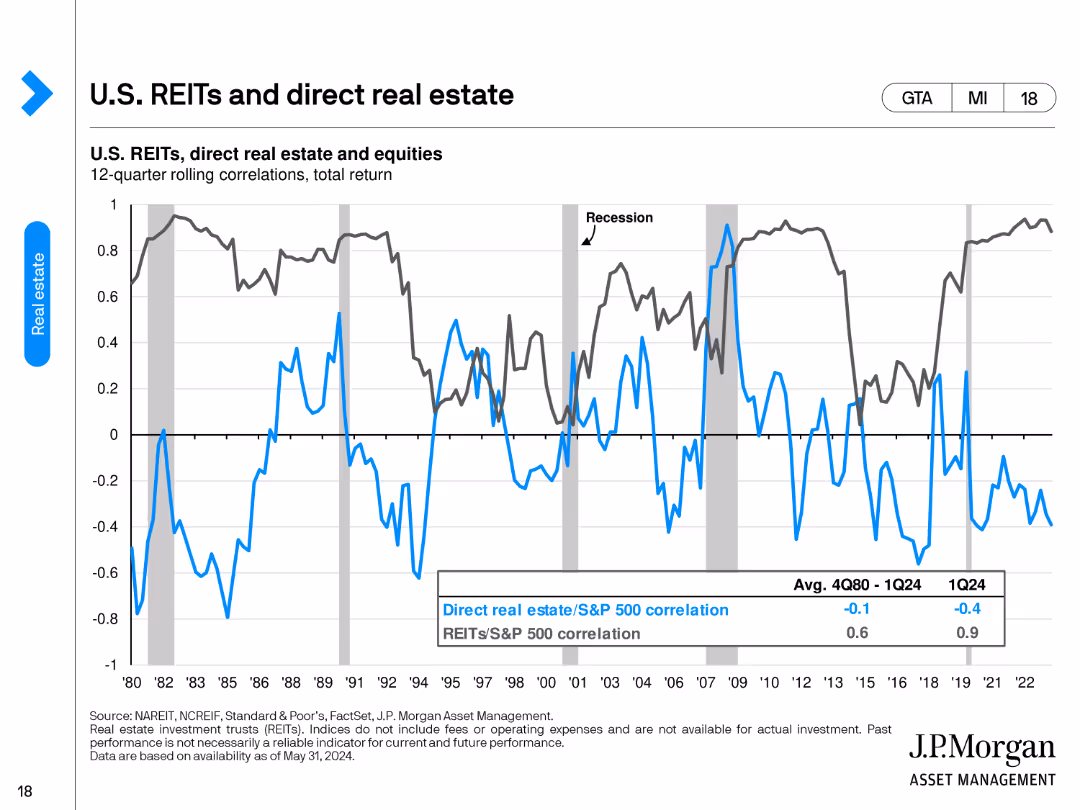
The slide features a line chart displaying 12-quarter rolling correlations between U.S. REITs, direct real estate, and equities from 1980 to 2024. The chart uses blue for REITs and black for direct real estate.
Investment Analysis
Real Estate & Construction
This slide analyzes the rolling correlations between U.S. REITs, direct real estate, and equities over a long-term period (1980 to 2024), showing how these asset classes interact and correlate with each other through different market cycles.
REITs, Direct Real Estate, Equities, Correlations, Market Cycles
false
Investment Analysis
Real Estate & Construction
Single Chart
JP Morgan
Add to my slides
Remove from favorites
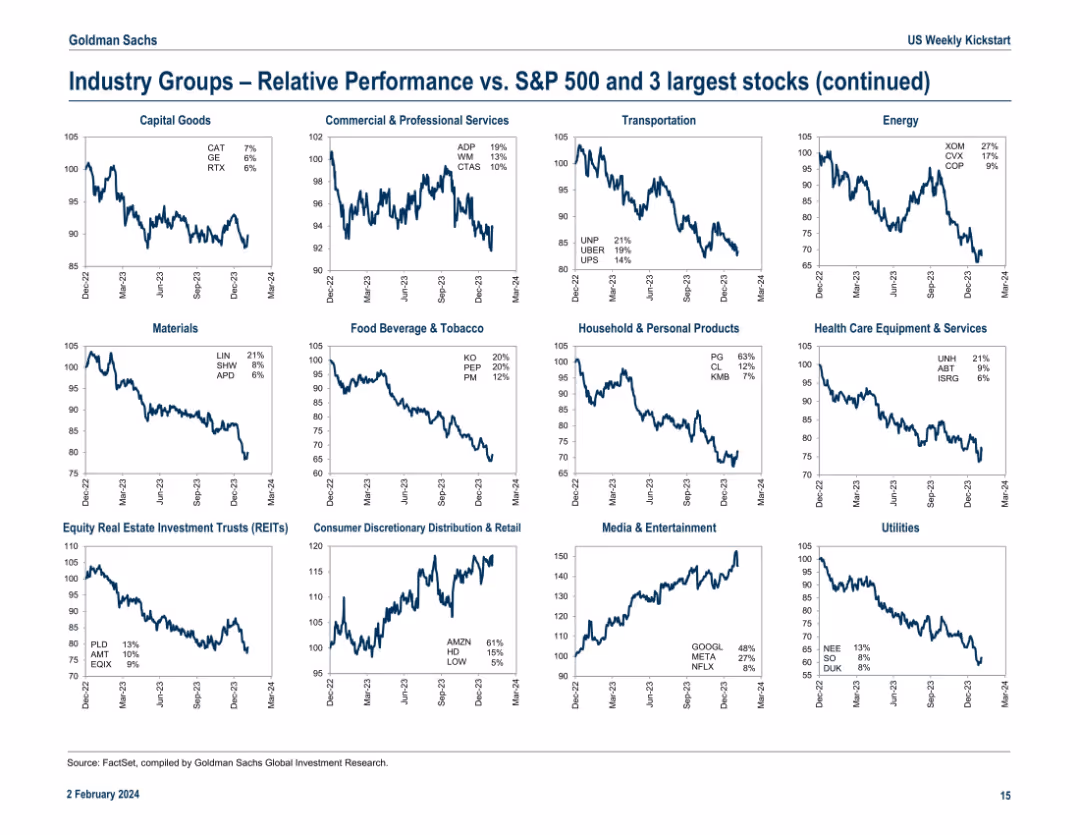
Continuation of the previous slide with another 16-panel grid layout of line charts. Includes industry groups like Transportation, Materials, Media, and Utilities. Each chart notes top 3 stocks in the group with YTD return.
Competitive Landscape
Financial Services
This continuation slide presents relative industry group performance vs. the S&P 500, focusing on sectors such as Transportation, Food & Tobacco, and REITs. Highlighted performers include UNP, KO, and META. The charts emphasize structural performance differences across industries and help detect winners and laggards among large-cap stocks.
REITs, META, UNP, KO, industry trends, relative performance, S&P 500, materials, transportation, utilities
false
Competitive Landscape
Financial Services
Multiple Chart
Goldman Sachs
Add to my slides
Remove from favorites
White background; left text column and right side shows a thermometer-style ranking of countries with heart icons.
Human Resources and Talent Management
Professional Services
This slide introduces the Love Life Satisfaction Index, combining multiple aspects of romantic and relationship satisfaction into a single score. It ranks countries from highest (Colombia) to lowest (Japan), noting regional patterns and country-specific insights like outliers and trends.
relationship index, satisfaction, love, romantic life, country ranking, global survey, emotional well-being, Ipsos
false
Human Resources and Talent Management
Professional Services
Mixed Chart
IPSOS
Add to my slides
Remove from favorites
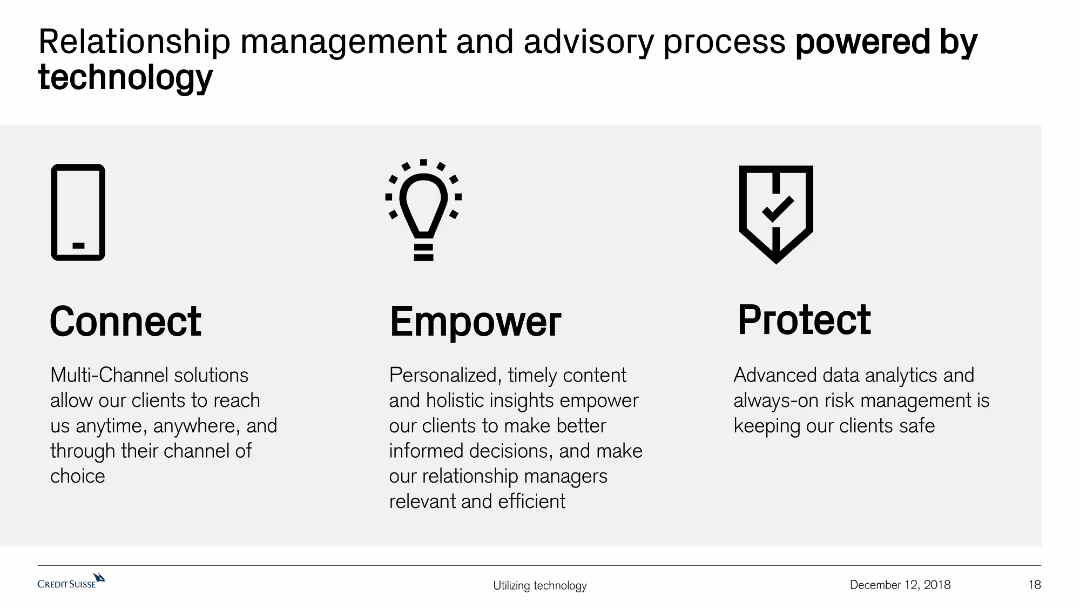
Utilizes icons and text to illustrate the relationship management process, focusing on Connect, Empower, and Protect, showing how technology supports each aspect.
Customer and Market Segmentation
Financial Services
This slide outlines the relationship management and advisory process, emphasizing how technology powers aspects like multi-channel solutions, personalized content, and risk management.
relationship management, advisory process, technology, connect, empower, protect, multi-channel, personalized content, risk management
false
Customer and Market Segmentation
Financial Services
Pillar
Credit Suisse
Add to my slides
Remove from favorites
A laptop screen displaying a dashboard with a pie chart and list of financial data, mostly in white and gray colors.
Financial Performance
Financial Services
The slide demonstrates a workbench for relationship managers, showcasing client information, asset allocation, and portfolio details.
Relationship manager, dashboard, financial data, pie chart, portfolio
false
Financial Performance
Financial Services
Mixed Chart
Credit Suisse
Add to my slides
Remove from favorites
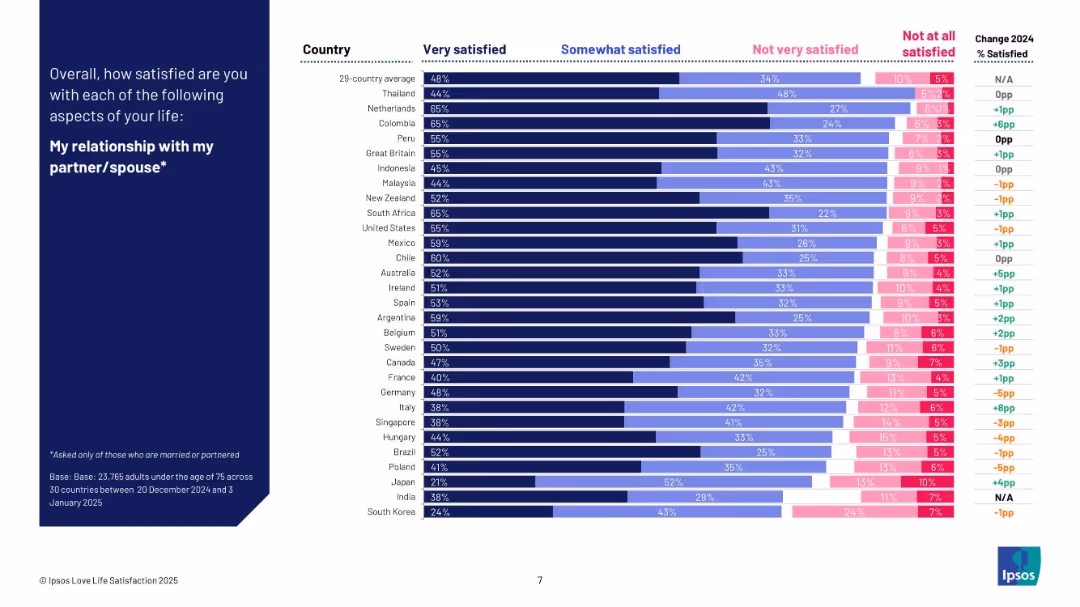
Bar chart with satisfaction levels by country for people in relationships; comparison between 2024 and 2025.
Human Resources and Talent Management
Professional Services
The slide analyzes how satisfied partnered individuals are with their relationships across 29 countries. It highlights countries like Thailand, Colombia, and the Netherlands at the top. The chart also tracks annual changes and provides insight into partner satisfaction globally.
relationship satisfaction, couples, emotional well-being, Ipsos, global comparison, survey, romantic life, 2025 data
false
Human Resources and Talent Management
Professional Services
Mixed Chart
IPSOS
Add to my slides
Remove from favorites
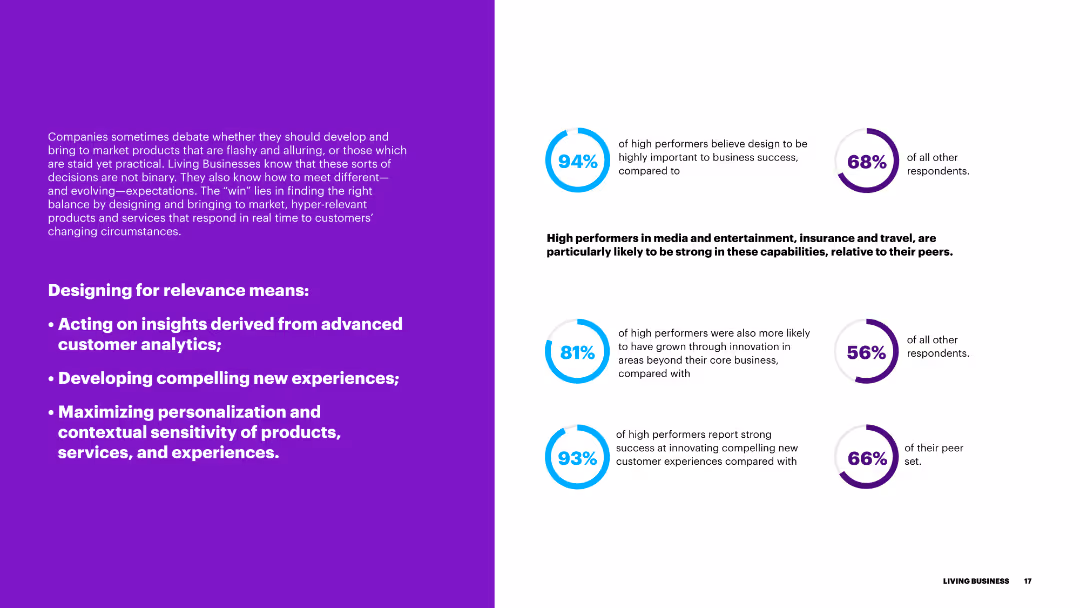
The slide has a purple background on the left and a white background on the right. Text with bullet points is presented on both sides, with blue circular indicators highlighting key statistics.
Product and Service Analysis
Media & Entertainment
This slide details the elements of designing for relevance, including customer analytics, new experiences, and product/service personalization, emphasizing the importance of these for high performers.
relevance, design, customer analytics, new experiences, personalization, high performers
false
Product and Service Analysis
Media & Entertainment
Multiple Chart
Accenture
Add to my slides
Remove from favorites
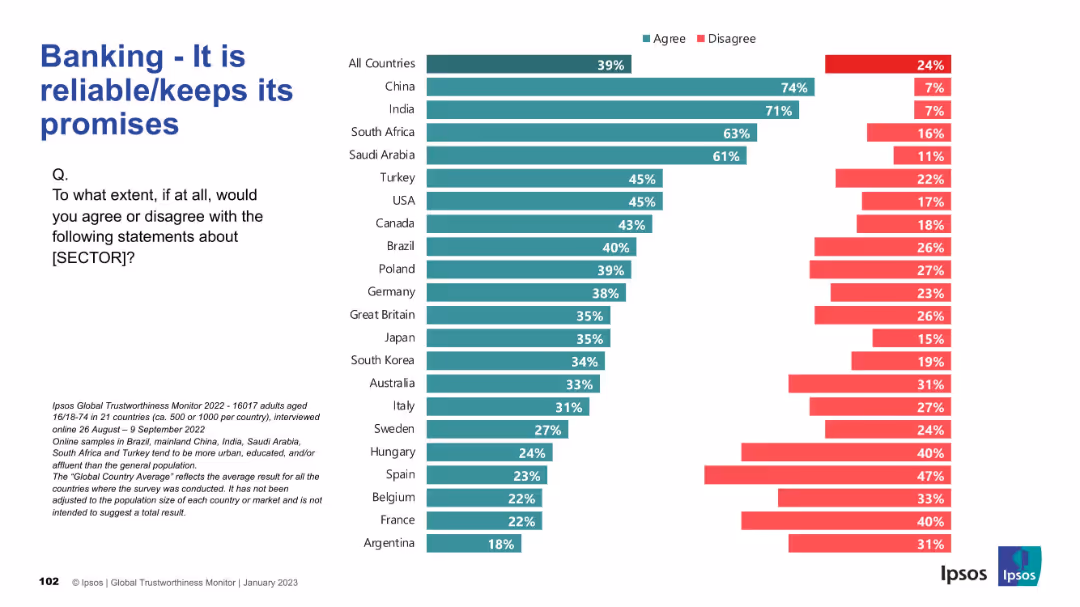
Horizontal bar chart. Rankings reflect trust in banking sector’s reliability. Layout and format consistent with previous slides.
Strategic Planning
Financial Services
This slide focuses on perceptions of reliability and promise-keeping within the banking sector, with India and China again ranking highest. It reflects public trust in sectoral accountability and service delivery.
reliability, finance, promises, sectoral trust, global views, Ipsos survey
false
Strategic Planning
Financial Services
Mixed Chart
IPSOS
Add to my slides
Remove from favorites
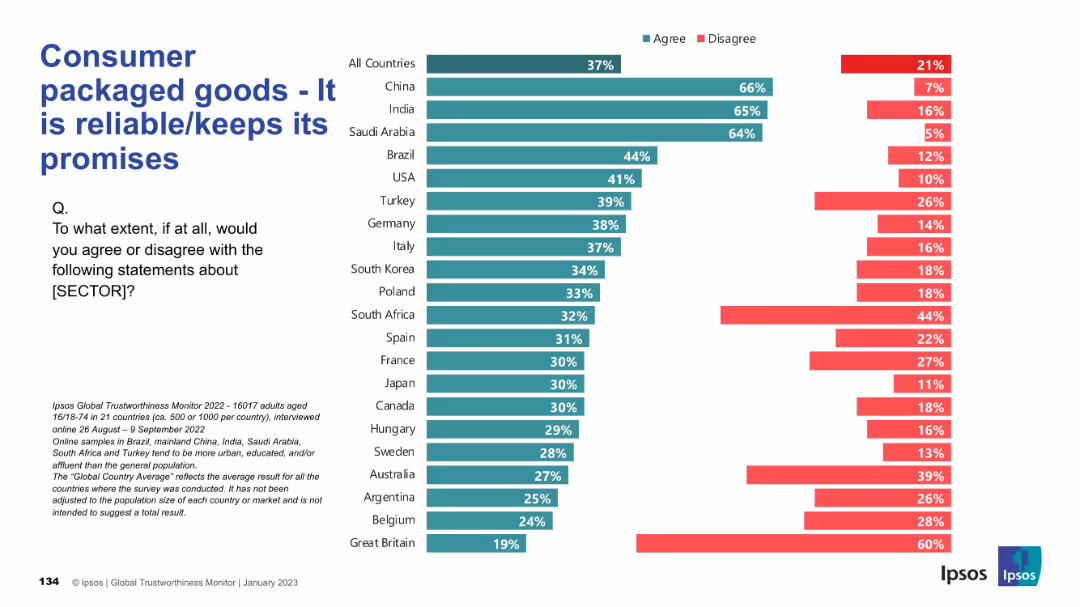
Standard bar chart format. Agreement and disagreement percentages shown side-by-side for multiple countries.
Market Analysis and Trends
Consumer Goods
This slide captures the extent to which respondents believe the CPG sector is reliable and delivers on its promises, with varied responses by region.
reliability, promises, consumer trust, perception, CPG, international, Ipsos, opinions, reputation, survey
false
Market Analysis and Trends
Consumer Goods
Mixed Chart
IPSOS
Add to my slides
Remove from favorites
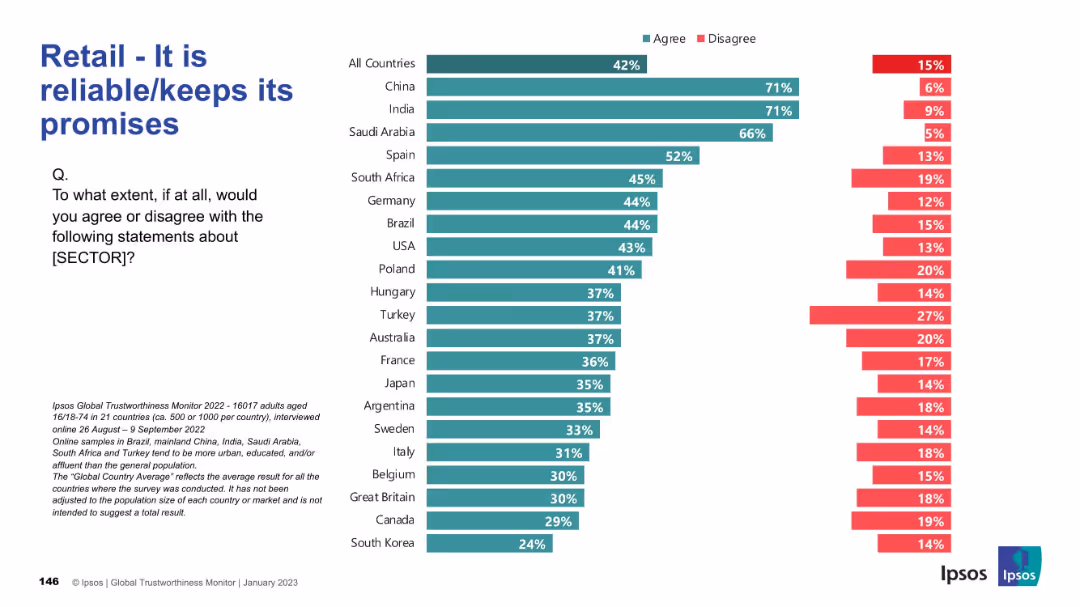
Similar horizontal bar chart, agree/disagree by country; dark teal and red color-coded bars.
Market Analysis and Trends
Retail & E-commerce
Evaluates whether consumers trust retail companies to keep their promises. India and China lead again, while countries like South Korea and Canada score lower.
reliability, promises, customer trust, perception, retail, countries, Ipsos
false
Market Analysis and Trends
Retail & E-commerce
Mixed Chart
IPSOS
Add to my slides
Remove from favorites
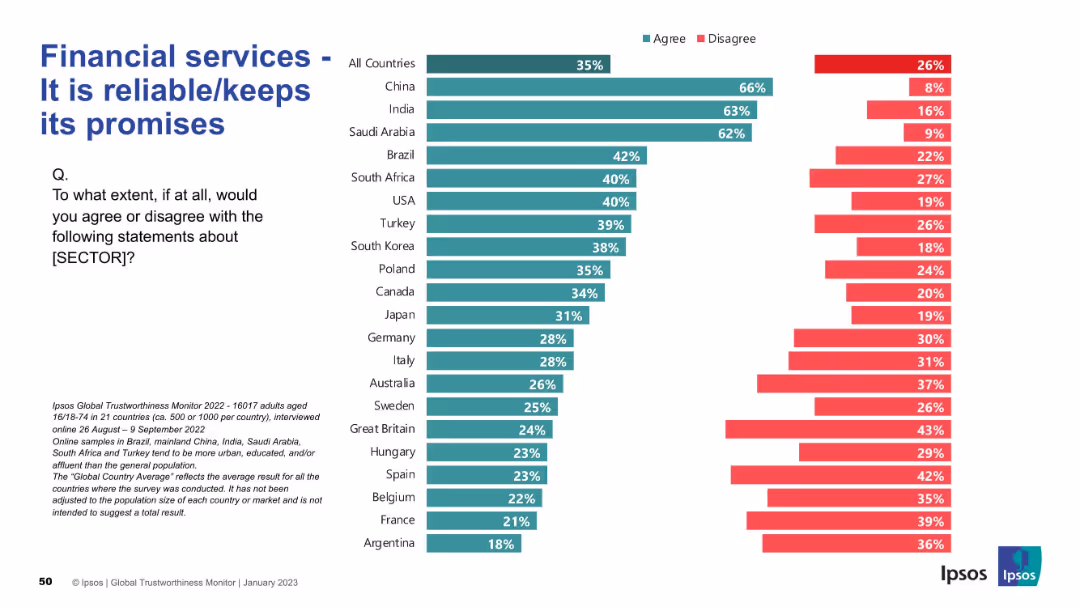
Bar chart format as with previous slides; left-aligned text and question; strong visual consistency
Strategic Planning
Financial Services
This slide assesses whether financial services are seen as reliable. China, India, and Saudi Arabia show high levels of agreement, while France, Argentina, and Belgium are among the least trusting. The global average is 35%.
reliability, promises, financial trust, countries, agreement, Ipsos, perception, strategic
false
Strategic Planning
Financial Services
Mixed Chart
IPSOS
Add to my slides
Remove from favorites
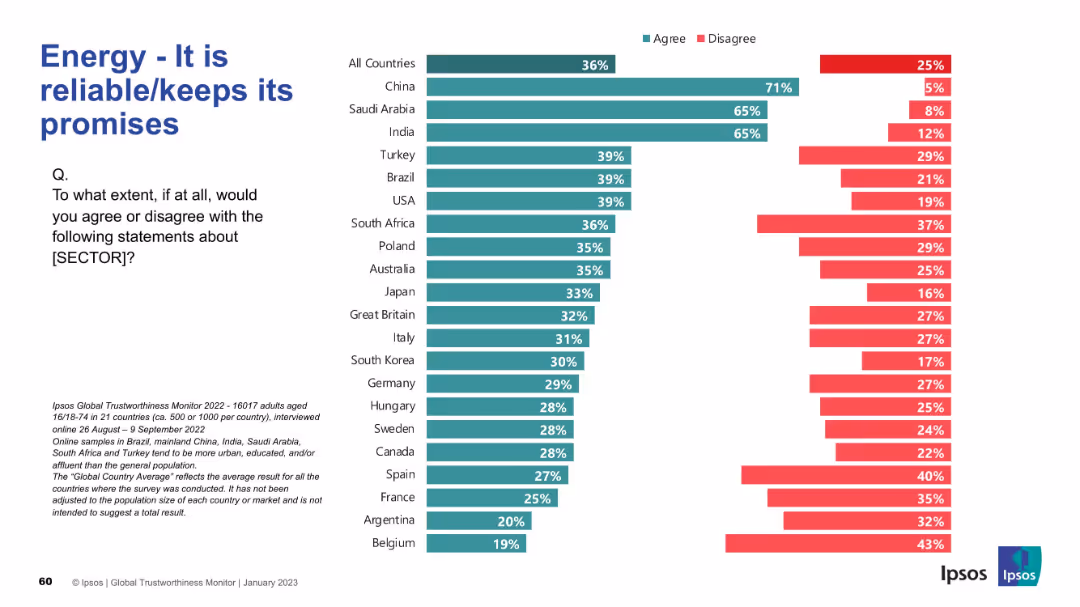
Bar chart of survey results by country; dark green for agreement; red for disagreement
Market Analysis and Trends
Energy & Utilities
This slide evaluates the perceived reliability of the energy sector. China, India, and Saudi Arabia again lead in agreement levels. European countries mostly fall below average, with Belgium and Argentina at the bottom.
reliability, promises, performance, energy, Ipsos, public opinion, trust, survey, bar chart
false
Market Analysis and Trends
Energy & Utilities
Mixed Chart
IPSOS
Add to my slides
Remove from favorites
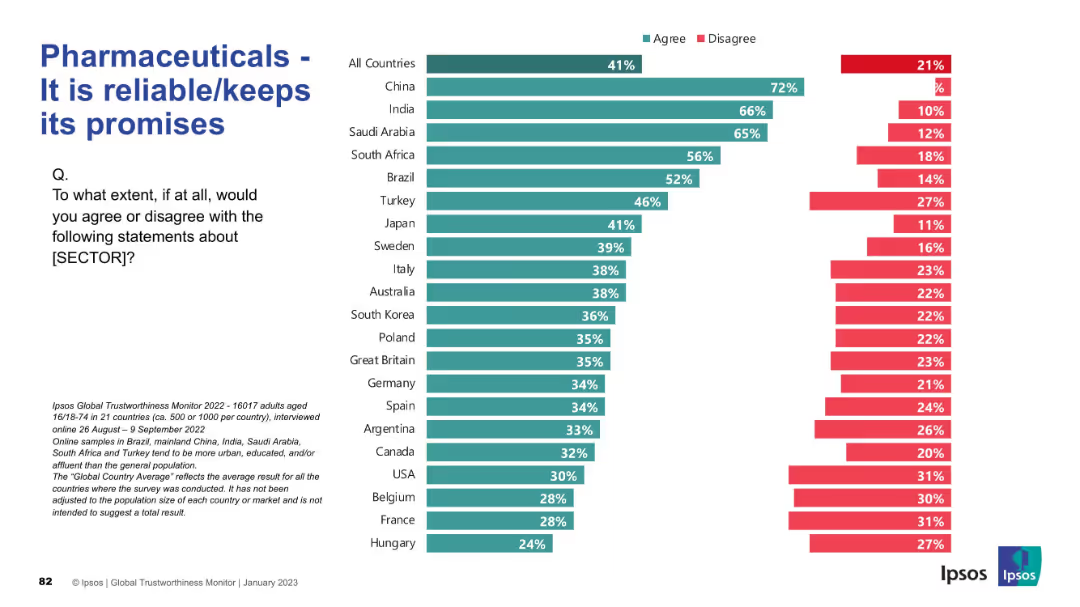
Standardized Ipsos design with bar charts showing country-level data; strong left panel and consistent color scheme.
Market Analysis and Trends
Healthcare & Pharmaceuticals
This slide measures whether people believe the pharmaceutical sector follows through on its commitments. China and India dominate in positive sentiment, while Western nations are more doubtful, with reliability ratings below 35% in most.
reliability, promises, public opinion, trust, healthcare, Ipsos survey, sector accountability, pharma performance
false
Market Analysis and Trends
Healthcare & Pharmaceuticals
Mixed Chart
IPSOS
Add to my slides
Remove from favorites
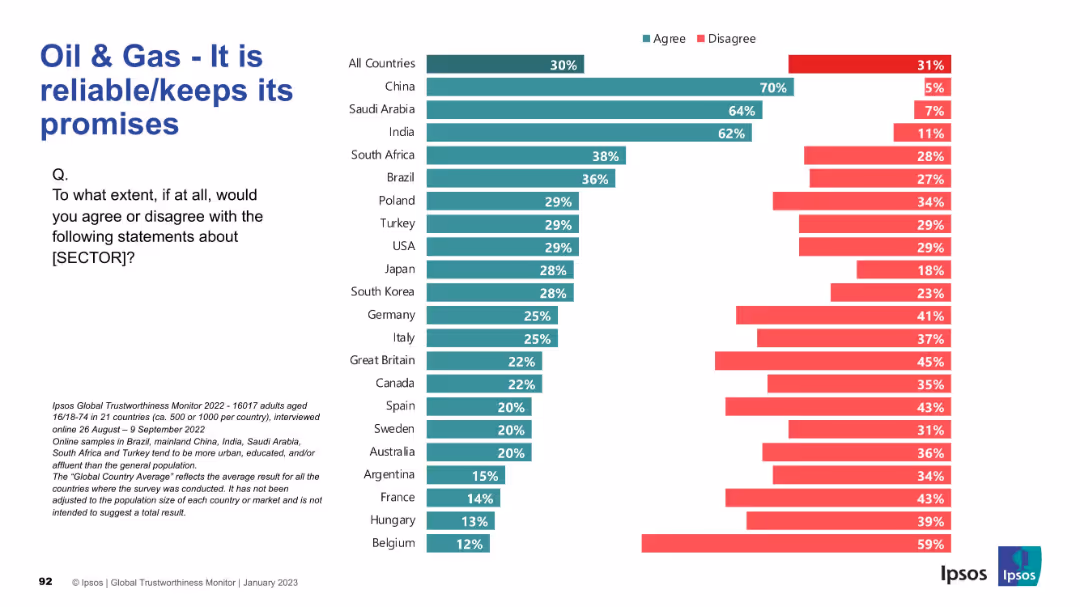
Horizontal stacked bar chart by country with left-side “agree” percentages and right-side “disagree”. Title and question placed top left.
Market Analysis and Trends
Energy & Utilities
This slide assesses the sector's reliability and its ability to keep promises. China, Saudi Arabia, and India again show high agreement. Western countries remain more critical, with low trust in promises from oil & gas companies.
Reliability, Promises, Trust, Oil & Gas Sector, Global Opinions, Ipsos Survey, Accountability, Market Perception, Country Trends
false
Market Analysis and Trends
Energy & Utilities
Mixed Chart
IPSOS
Add to my slides
Remove from favorites
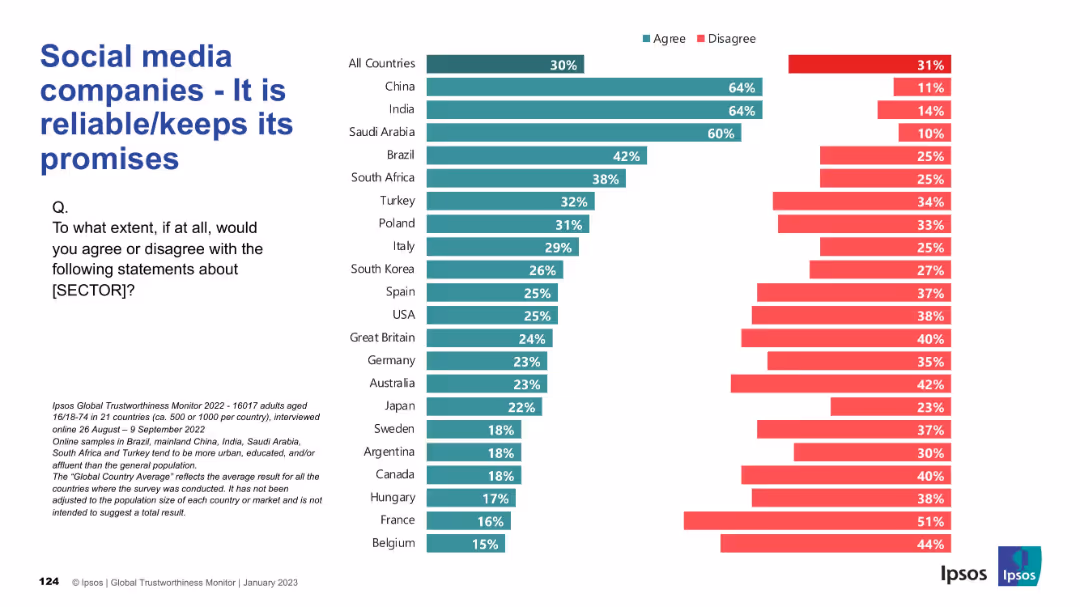
Horizontal bar chart with countries ranked by agreement that social media companies are reliable; design identical to previous slides; Ipsos branding.
Market Analysis and Trends
Technology & Software
This slide presents country-level opinions on the reliability of social media companies. India, China, and Saudi Arabia have high agreement levels, while many European countries show widespread skepticism, indicating a perceived trust gap between regions.
reliability, promises, trustworthiness, international comparison, Ipsos, perception
false
Market Analysis and Trends
Technology & Software
Mixed Chart
IPSOS
Add to my slides
Remove from favorites
Survey-based horizontal bar chart across multiple countries; title and question section on the left.
Performance Metrics and KPIs
Technology & Software
The slide captures international views on the reliability of technology firms, showing agreement and disagreement levels on their ability to keep promises.
reliability, tech industry, promise keeping, global perception, Ipsos, public trust, survey, performance, metrics, agreement
false
Performance Metrics and KPIs
Technology & Software
Mixed Chart
IPSOS
Add to my slides
Remove from favorites
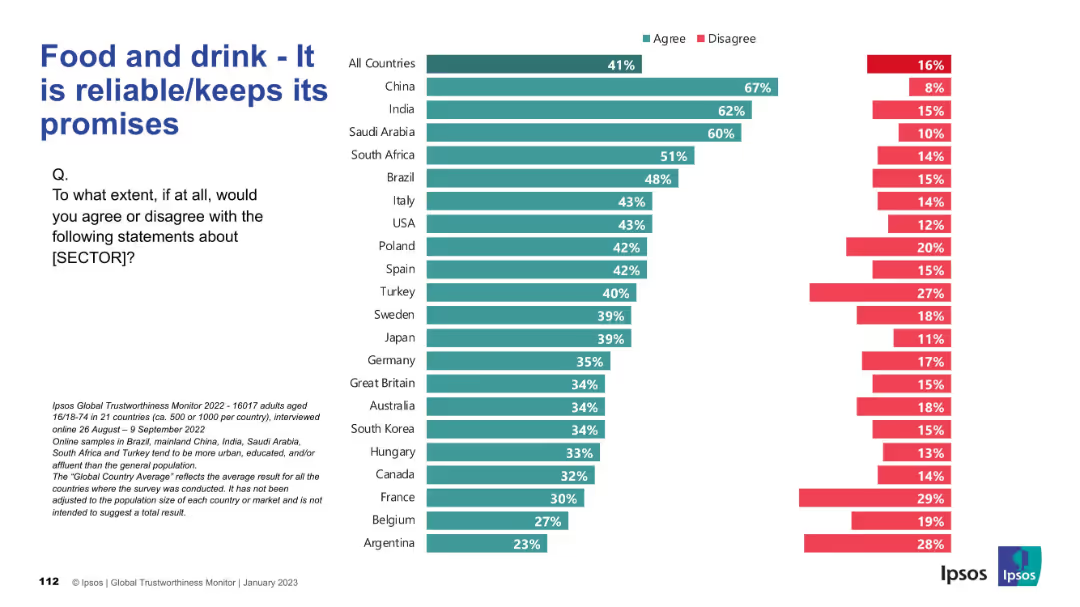
Horizontal split bar chart with countries sorted by agreement; question and context in text block to the left.
Market Analysis and Trends
Consumer Goods
This slide evaluates global public perceptions of the food and drink sector’s reliability and whether it keeps promises. It includes 21 countries and contrasts agreement versus disagreement visually.
reliability, trust, food sector, promises, Ipsos, survey results, bar chart, global perception, countries, consumer opinion
false
Market Analysis and Trends
Consumer Goods
Mixed Chart
IPSOS
Add to my slides
Remove from favorites
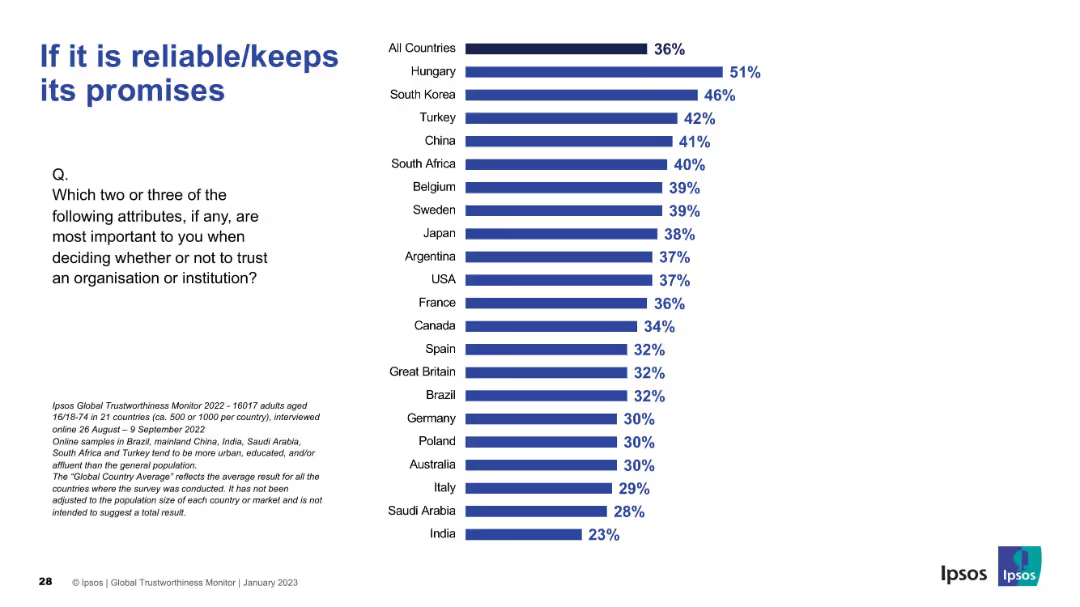
Slide uses same format: bar chart comparing 21 countries. Hungary ranks highest in valuing reliability.
Market Analysis and Trends
Professional Services
Reliability emerges as the most critical trust factor globally, particularly important in Hungary and South Korea. Communicates consistency in expectations.
reliability, trust, promise-keeping, country ranking, Ipsos data, integrity
false
Market Analysis and Trends
Professional Services
Mixed Chart
IPSOS
Add to my slides
Remove from favorites
Displays line charts tracing the growth of major religious groups globally, with clear annotations and a blue monochrome color scheme for visual distinction.
Market Analysis and Trends
Education & Training
Examines the projected growth and demographic shifts among the world's major religious groups, offering insights into future religious and social dynamics.
religion, demographics, growth, global, trends, Christianity, Islam, data, future, society
false
Market Analysis and Trends
Education & Training
Multiple Chart
Roland Berger
Add to my slides
Remove from favorites
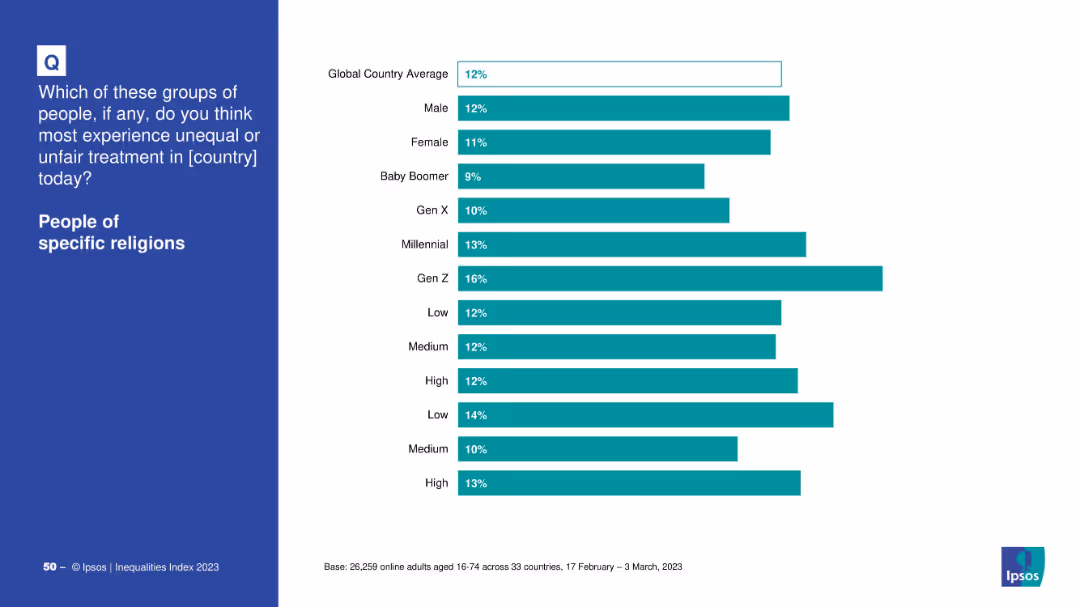
Demographic bar chart by gender, generation, income, and education
Market Analysis and Trends
Government & Public Sector
The slide breaks down how different demographic groups perceive unfair treatment of religious people. Gen Z and low-income respondents report higher perceptions of inequality, while Baby Boomers show the lowest concern.
religion, generational differences, Ipsos, inequality perception, education, Gen Z, discrimination
false
Market Analysis and Trends
Government & Public Sector
Mixed Chart
IPSOS
Add to my slides
Remove from favorites
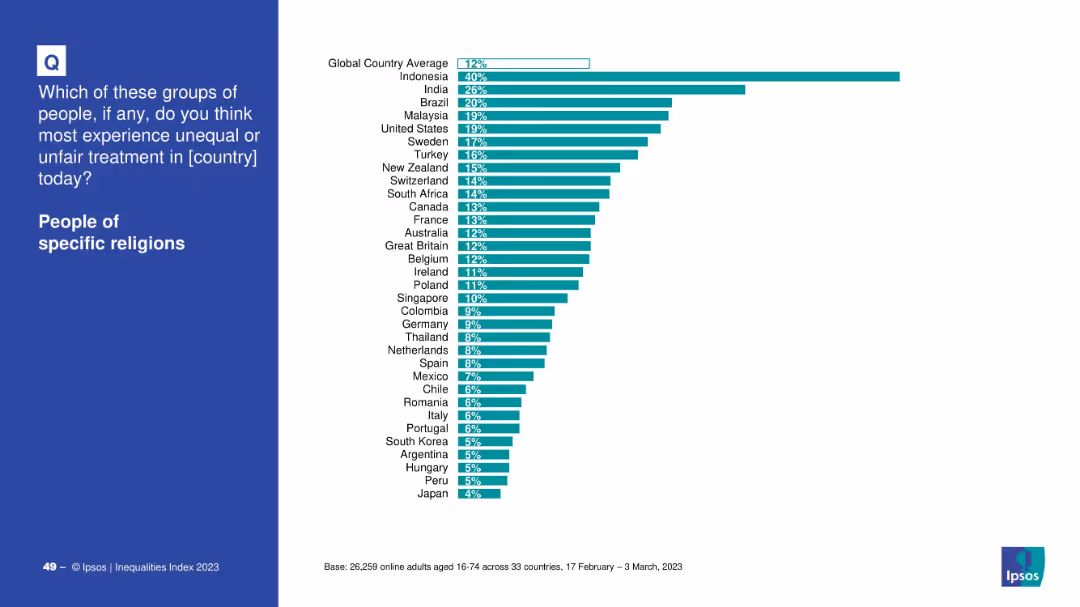
Country-level bar chart with teal bars on white background, global average shown at top
Market Analysis and Trends
Government & Public Sector
This slide explores perceptions of religious discrimination globally. Indonesia and India report the highest perceived inequality toward religious groups, with a global average of 12%. Japan shows the lowest perception at 4%.
religion, inequality, discrimination, Ipsos, global views, survey, religious bias, 2023
false
Market Analysis and Trends
Government & Public Sector
Mixed Chart
IPSOS
Add to my slides
Remove from favorites
Horizontal bar chart by country; stacked by “Important” vs “Not important”; presented on navy background
Customer and Market Segmentation
Government & Public Sector
This slide visualizes global views on whether being part of a religious majority is essential to national identity. Agreement is highest in Thailand and India and lowest in Japan and the Netherlands, reflecting cultural and religious diversity impacts.
religion, national identity, majority, beliefs, country comparison, Ipsos, culture, survey responses, belonging
false
Customer and Market Segmentation
Government & Public Sector
Mixed Chart
IPSOS
Add to my slides
Remove from favorites
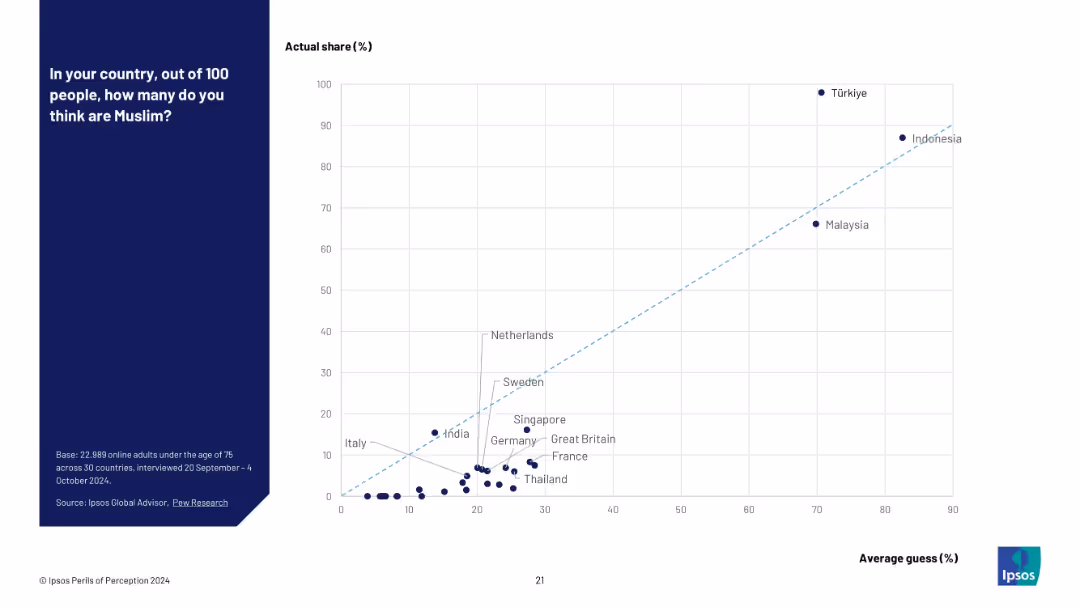
Scatter plot with actual % (Y-axis) vs perceived % (X-axis); notable overestimators annotated.
Market Analysis and Trends
Government & Public Sector
A scatter plot visualizing how countries estimate their Muslim populations compared to actual figures. It reveals a strong tendency for overestimation, especially in low-Muslim-population countries like France and Germany.
religion perception, scatter plot, Muslim population, demographic error, Ipsos study, data visualization, public misunderstanding
false
Market Analysis and Trends
Government & Public Sector
Mixed Chart
IPSOS
Add to my slides
Remove from favorites
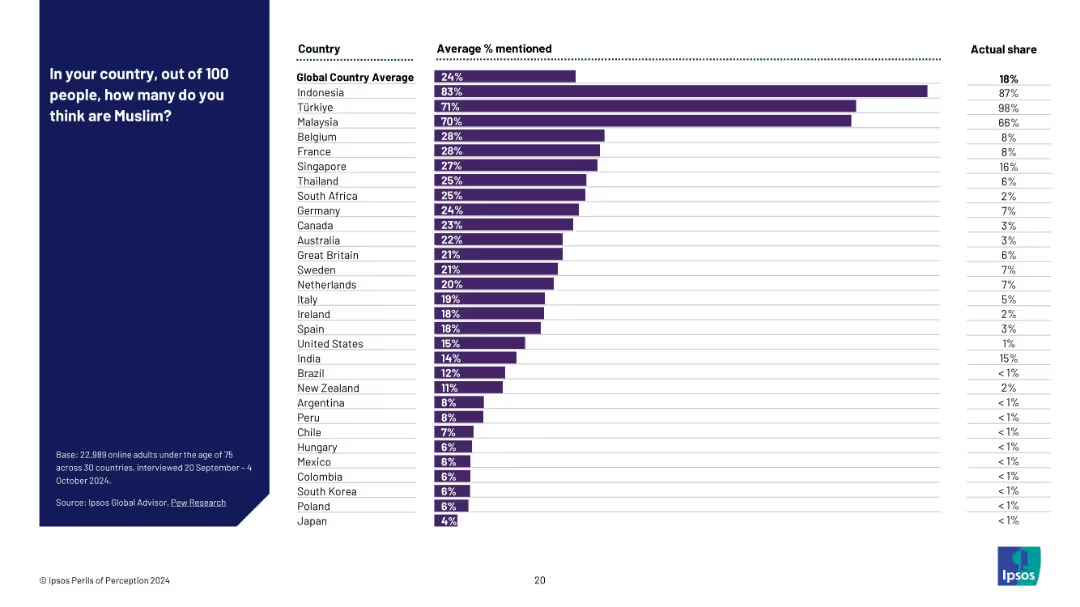
Bar chart listing countries with average perceived % Muslim and actual % side-by-side.
Market Analysis and Trends
Government & Public Sector
This slide displays the public perception of Muslim populations across different countries, comparing them with actual data. It highlights consistent overestimation, particularly in countries with small actual Muslim populations.
religious demographics, Muslim population, public misperception, belief vs fact, Ipsos survey, minority estimate, global religion stats
false
Market Analysis and Trends
Government & Public Sector
Mixed Chart
IPSOS
Add to my slides
Remove from favorites
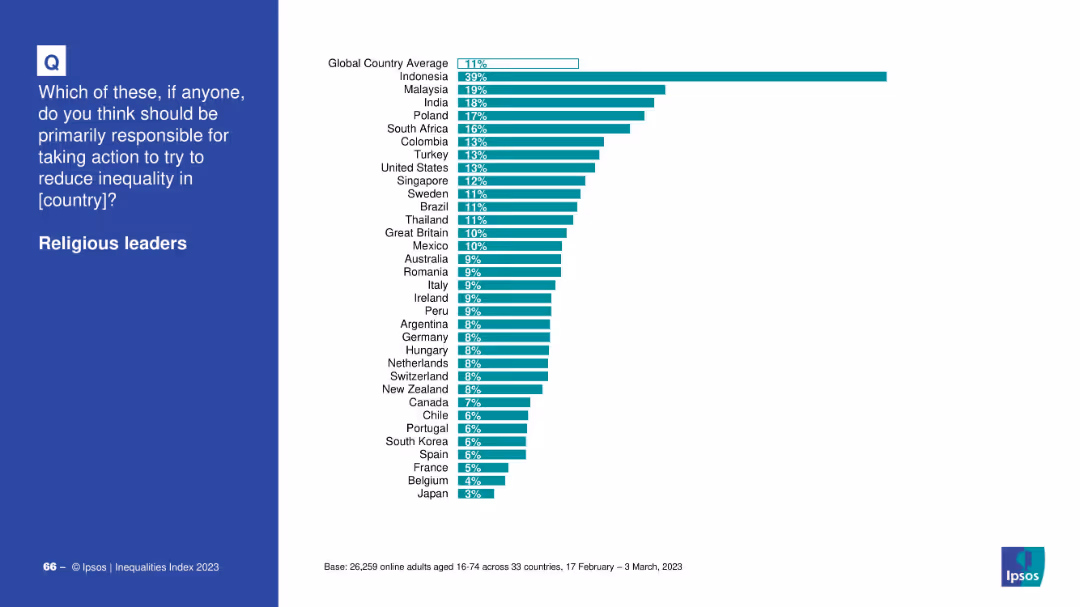
Similar structure as slide 19811 with bar chart comparing country-level responses on a white background; blue question box on the left.
Market Analysis and Trends
Government & Public Sector
This slide displays public opinion across 33 countries on whether religious leaders should take primary responsibility for reducing inequality, with varying agreement.
religious leaders, global comparison, inequality, country-level data, public opinion, Ipsos, survey results
false
Market Analysis and Trends
Government & Public Sector
Mixed Chart
IPSOS
Add to my slides
Remove from favorites
This slide has moderate visual complexity with two pie charts showing employee relocation resistance to specific regions. The design incorporates a clear layout for the text and charts, using color coding to differentiate responses by gender.
Human Resources and Talent Management
Professional Services
This slide discusses how global mobility leaders often face challenges aligning company growth destinations with employee preferences. It emphasizes the need for targeted action plans to address location barriers, particularly in areas less favored by employees, and to support female mobility to these locations.
Relocation challenges, Employee preferences, Geographical barriers, Action plans
false
Human Resources and Talent Management
Professional Services
Multiple Chart
PwC/Strategy&
Add to my slides
Remove from favorites
The slide includes text boxes comparing consulting, testing/analytics, and remediation services with icons and demand outlook descriptions.
Market Analysis and Trends
Environmental Services & Sustainability
It discusses the potential delays in remediation projects due to temporary job access while highlighting stable demand in consulting services.
Remediation, consulting, analytics, project delays, demand, services, engagement cycles, temporary job
false
Market Analysis and Trends
Environmental Services & Sustainability
Table
LEK
Add to my slides
Remove from favorites
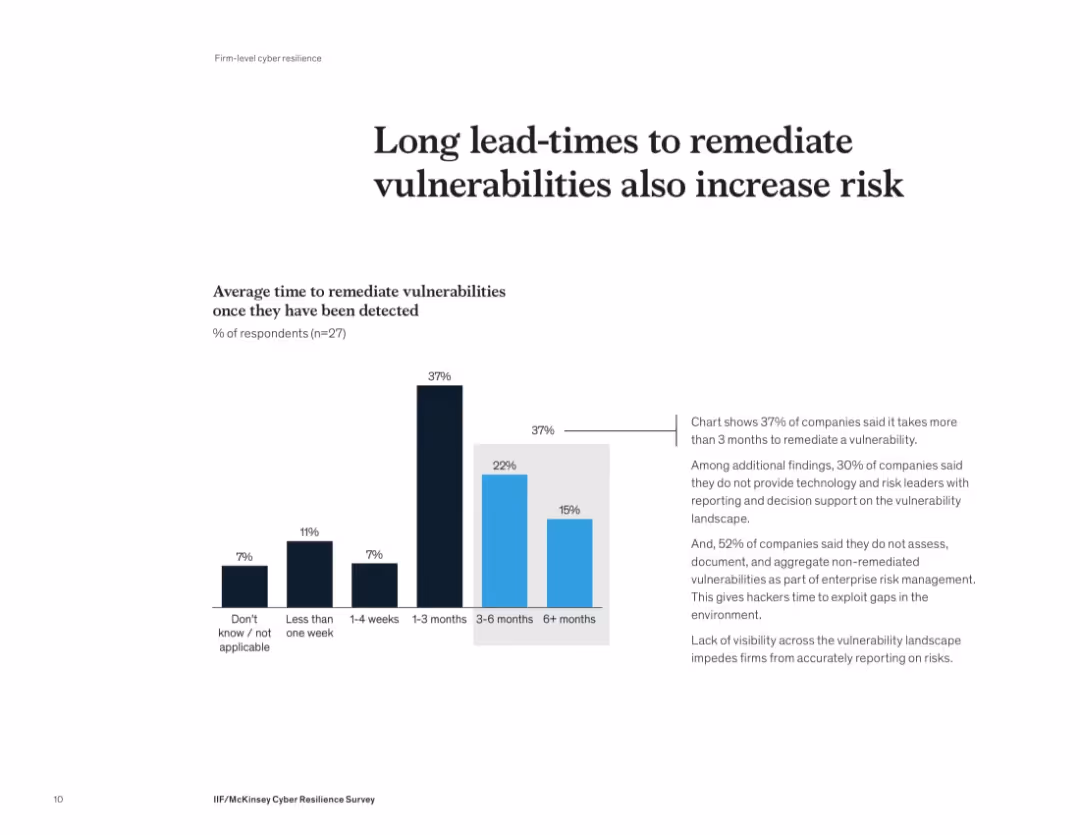
Vertical bar chart comparing average time to remediate vulnerabilities with a summary on the right. Simple, clean layout using two colors.
Risk Assessment and Management
Financial Services
Remediation timelines are long for many companies—37% take over 3 months to patch vulnerabilities. Many lack visibility, risk aggregation, and proper support for decision-making. These delays expose systems to potential exploitation.
remediation, vulnerability, cybersecurity, response time, delays, patching, risk visibility
false
Risk Assessment and Management
Financial Services
Mixed Chart
McKinsey
Add to my slides
Remove from favorites
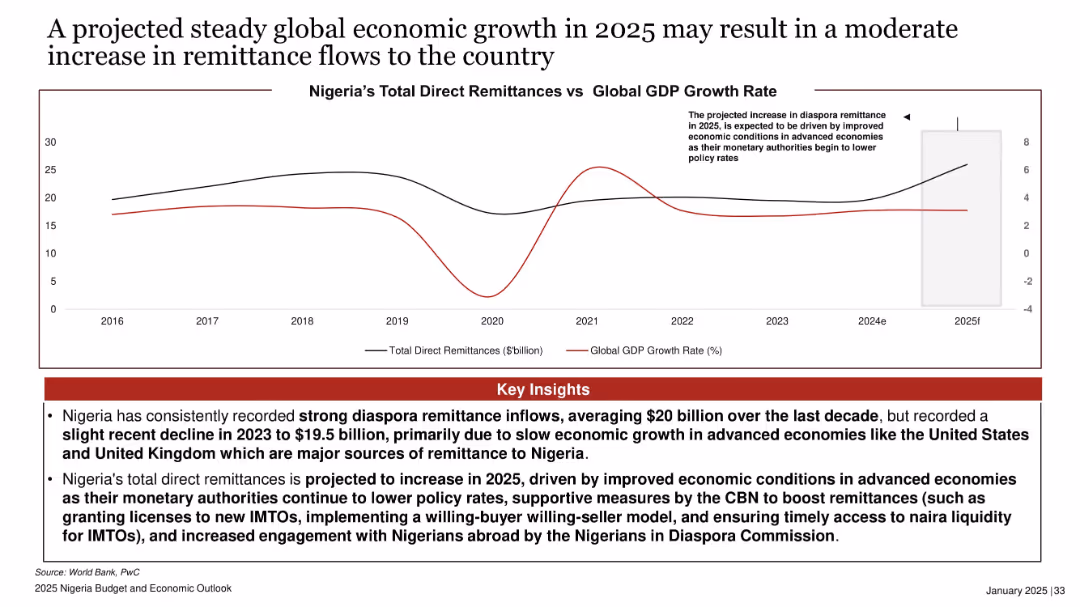
Dual-line chart comparing Nigeria’s remittances to global GDP growth; right-side projection box; red-highlighted insights box.
Market Analysis and Trends
Financial Services
Projects moderate increase in remittance inflows to Nigeria in 2025, driven by improved global economic conditions. Highlights historical remittance trends and links growth to falling interest rates and supportive policies by the CBN and Diaspora Commission.
remittances, diaspora, global GDP, economic growth, 2025, CBN, Nigeria, foreign inflows, IMTOs, diaspora engagement
false
Market Analysis and Trends
Financial Services
Mixed Chart
PwC/Strategy&
Add to my slides
Remove from favorites
Includes a line graph tracking monthly remittance flows in the Philippines during 2020, marking the stability despite the pandemic.
Market Analysis and Trends
Financial Services
Discusses trends in remittance flows to the Philippines during the COVID-19 pandemic, emphasizing the resilience of these transfers.
remittances, Philippines, COVID-19, financial trends, line graph, stability, monthly data, economic resilience
false
Market Analysis and Trends
Financial Services
Single Chart
Deloitte
Add to my slides
Remove from favorites
The slide includes screenshots of digital platforms and a pictogram representing remote advice. It's balanced with text on one side and images on the other, with a blue and white color theme.
Strategic Planning
Financial Services
Introduces a remote advice channel for mass-affluent clients, highlighting the human-led, digitally-enabled advisory services. It's designed to showcase a new digital strategy for offering low-cost advice to clients preferring digital engagement, highlighting its flexible and affordable platform.
Remote advice, Digital platform, Mass-affluent, Low-cost, Human-led
false
Strategic Planning
Financial Services
Graphic
JP Morgan
Add to my slides
Remove from favorites
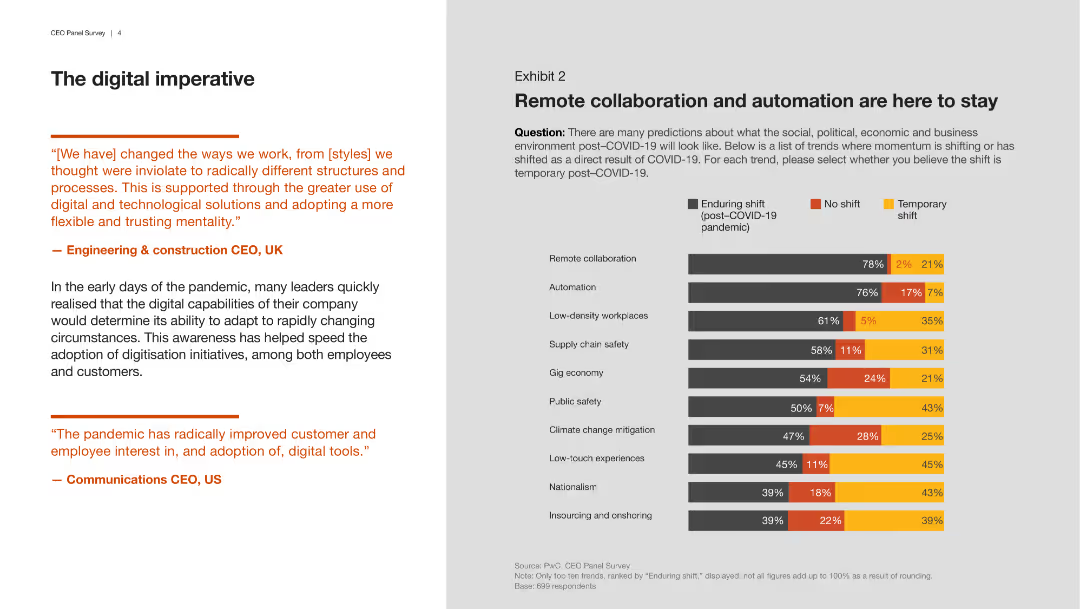
Features a column chart showing trends predicted to endure post-COVID-19, such as remote collaboration and automation. Different colors indicate the nature of the shift (enduring, temporary).
Market Analysis and Trends
Professional Services
This slide presents survey data on the expected permanence of trends like remote collaboration and automation post-COVID-19, indicating which trends are seen as enduring or temporary.
remote collaboration, automation, trends, COVID-19
false
Market Analysis and Trends
Professional Services
Mixed Chart
PwC/Strategy&
Add to my slides
Remove from favorites
Provides examples of advancements in remote sensing and their potential applications in various fields such as agriculture and geology.
Market Analysis and Trends
Technology & Software
Explores the potential disruptive applications of space technology in remote sensing for Earth observation data across various sectors.
remote sensing, Earth observation, forestry, hydrology, geology, agriculture
false
Market Analysis and Trends
Technology & Software
Boxed
McKinsey
Add to my slides
Remove from favorites
Includes a timeline-like graphic showing the varying levels of satisfaction with remote work over time, alongside an image of a working mother.
Human Resources and Talent Management
Professional Services
Explores evolving challenges in remote work environments, from initial struggles to finding successful strategies for managing remote teams, emphasizing the need for adaptability in remote policies.
Remote Work, Challenges, Adaptability, Work Environment, Strategies
false
Human Resources and Talent Management
Professional Services
Linear Flow
McKinsey
Add to my slides
Remove from favorites
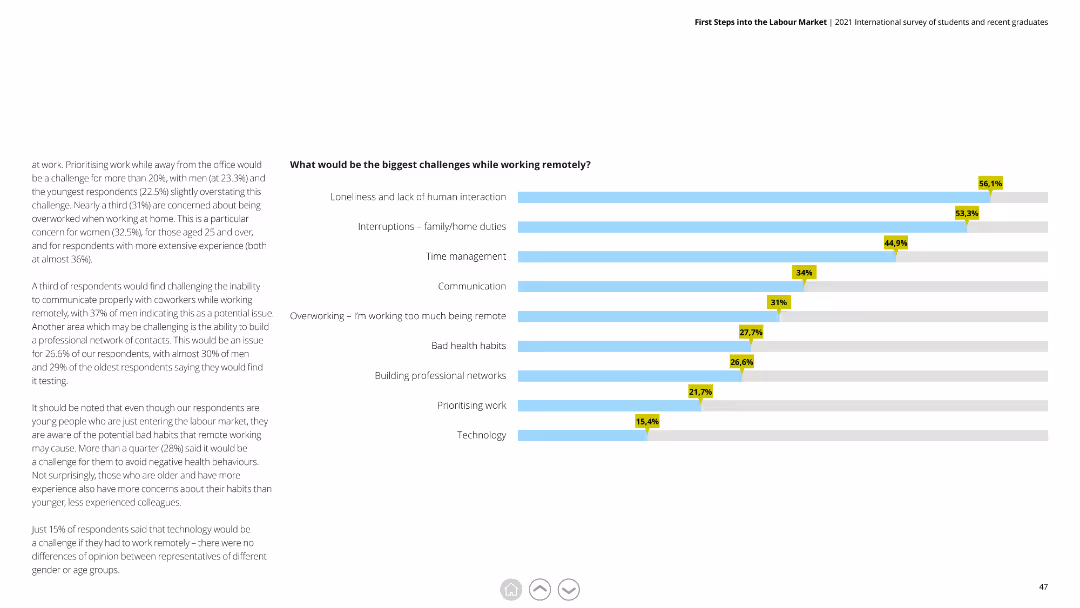
This slide features a horizontal bar chart with data points representing the biggest challenges while working remotely. It is cleanly designed with blue bars on a white background.
Market Analysis and Trends
Professional Services
The slide presents survey data on the main challenges faced by remote workers, such as loneliness, interruptions, and communication issues. It is used for understanding remote work difficulties.
Remote work, challenges, survey, communication, productivity
false
Market Analysis and Trends
Professional Services
Mixed Chart
Deloitte
Add to my slides
Remove from favorites
Circular diagram with multiple sections around a central concept of remote work, highlighting different aspects like tax compliance, data technology, and workforce strategies.
Strategic Planning
Professional Services
This slide outlines the cross-functional nature of remote work, touching on corporate tax, employment law, data/technology, regulatory considerations, and workforce strategies, emphasizing the need for a coordinated approach.
Remote work, compliance, technology, workforce, strategy
false
Strategic Planning
Professional Services
Diagram
Deloitte
Add to my slides
Remove from favorites
Featuring a purple color scheme, this slide has a textual case study on the left and an image of a woman and child on the right.
Market Analysis and Trends
Technology & Software
The slide provides a case study on how remote work during the pandemic has led Australians to adopt more flexible lifestyles and depend on the nbn network.
remote work, COVID-19, nbn network, case study, Australian workers, flexibility, lifestyle changes
false
Market Analysis and Trends
Technology & Software
Text Only
Accenture
Add to my slides
Remove from favorites
Slide compares remote work policies before and during COVID-19 through a column chart and bar graph detailing city-specific work-from-home statistics.
Organizational Structure and Change
Professional Services
Reviews the transition to remote work across various cities, indicating a significant increase in work-from-home adoption due to COVID-19, with comparative insights on employee distribution.
Remote Work, COVID-19, Work From Home, Cities, Transition
false
Organizational Structure and Change
Professional Services
Multiple Chart
McKinsey
Add to my slides
Remove from favorites
Column charts showing work frequency patterns before, during, and after Covid-19
Human Resources and Talent Management
Professional Services
Analyzes changes in remote work patterns among respondents, comparing pre and post-Covid trends
Remote work, Covid-19, work patterns, survey, EY
false
Human Resources and Talent Management
Professional Services
Multiple Chart
EY
Add to my slides
Remove from favorites
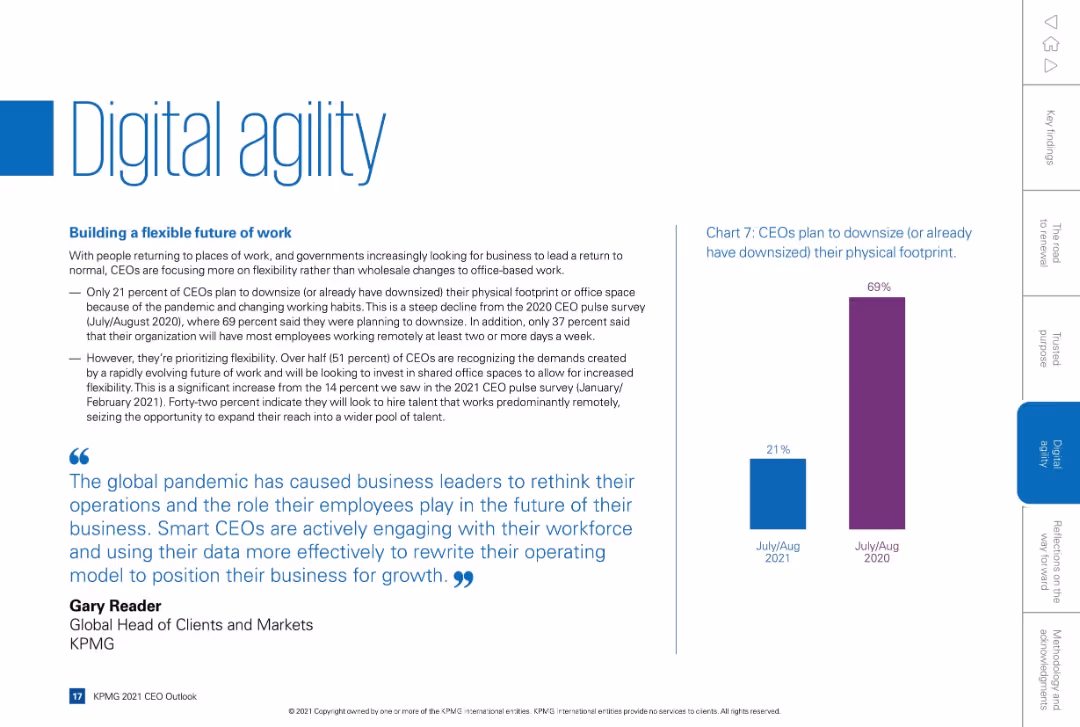
Clean layout with text-heavy left side and a tall vertical bar chart on the right. Blue-themed design with a quote at bottom.
Technology and Digital Transformation
Technology & Software
Discusses how CEOs are responding to the future of work, with emphasis on flexibility, hybrid work, and office downsizing. Shows drop in downsizing intent from 69% in 2020 to 21% in 2021. Focus on digital infrastructure and remote workforce hiring.
remote work, digital agility, office downsizing, hybrid work, flexibility
false
Technology and Digital Transformation
Technology & Software
Mixed Chart
KPMG
Add to my slides
Remove from favorites
A slide with a mixture of bullet points and charts, focusing on the inefficiencies of remote work. It includes sub-sections with icons and a bar graph comparing productivity decay in different site complexities.
Operational Efficiency
Professional Services
Examines the challenges of work-from-home setups, focusing on structural, people, process, and technology inefficiencies. Offers insights for HR departments and managers overseeing remote teams.
Remote work, Efficiency, Team cohesion, Productivity, Organizational structure
false
Operational Efficiency
Professional Services
Mixed Chart
McKinsey
Add to my slides
Remove from favorites
A column chart comparing pre and post-COVID percentages of remote working time per employee, highlighting expected changes in remote work patterns.
Human Resources and Talent Management
Real Estate & Construction
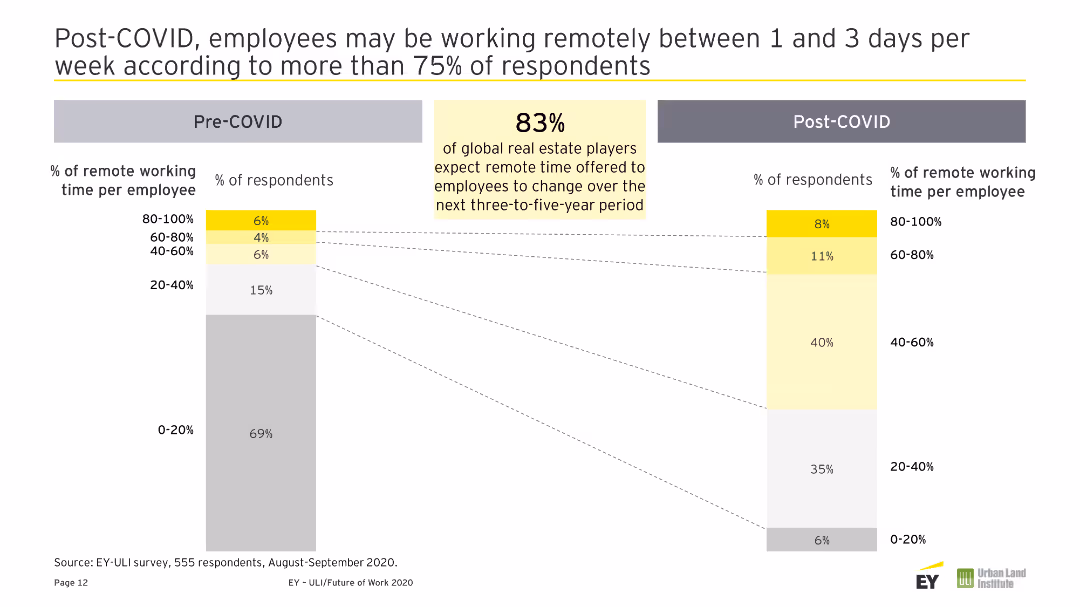
The slide shows the expected increase in remote work time per employee post-COVID, indicating a shift towards more flexible work arrangements.
Remote Work, Flexibility, Post-COVID, Work Patterns, Employee Trends
false
Human Resources and Talent Management
Real Estate & Construction
Multiple Chart
EY
Add to my slides
Remove from favorites
A pie chart showing desired remote work frequency post-COVID-19. A column chart compares pre and post-COVID remote work preferences for different days per week.
Human Resources and Talent Management
Real Estate & Construction
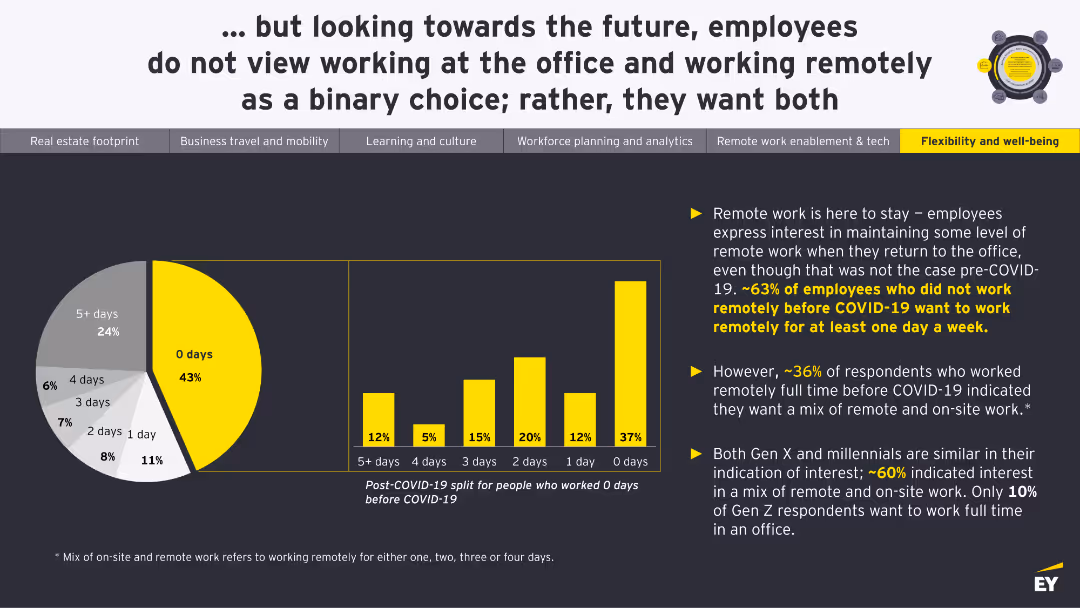
This slide illustrates employees' preferences for remote work post-COVID-19, indicating a desire for flexibility between remote and on-site work.
Remote Work, Flexibility, Preferences, Post-COVID, Strategy
false
Human Resources and Talent Management
Real Estate & Construction
Multiple Chart
EY
Add to my slides
Remove from favorites
Layout with four circular infographics and supporting text; quote from KPMG Global Head of People on the right
Human Resources and Talent Management
Professional Services
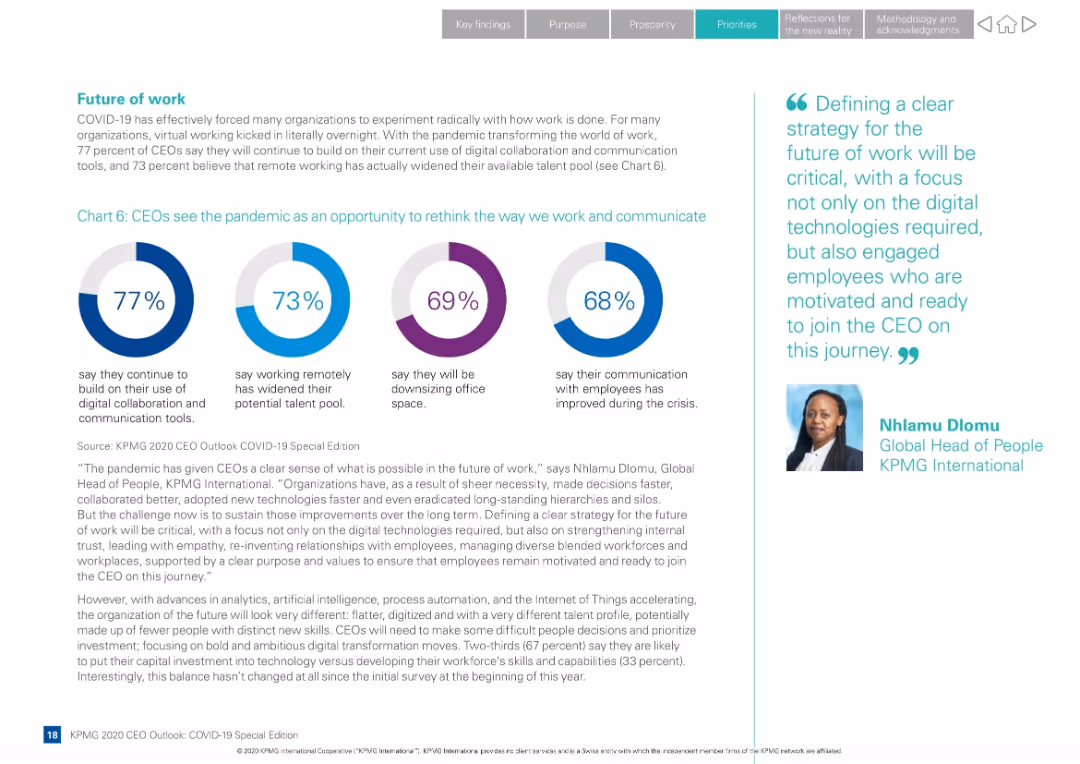
CEOs reflect on how COVID-19 changed work. Majority plan to continue remote work tools and see an expanded talent pool. Slide also explores communication improvements and office downsizing.
remote work, future of work, digital tools, talent pool, communication, office space, KPMG, employee strategy
false
Human Resources and Talent Management
Professional Services
Mixed Chart
KPMG
Add to my slides
Remove from favorites
Left-aligned narrative with a donut chart on right showing preferred work models over 3 years
Human Resources and Talent Management
Professional Services
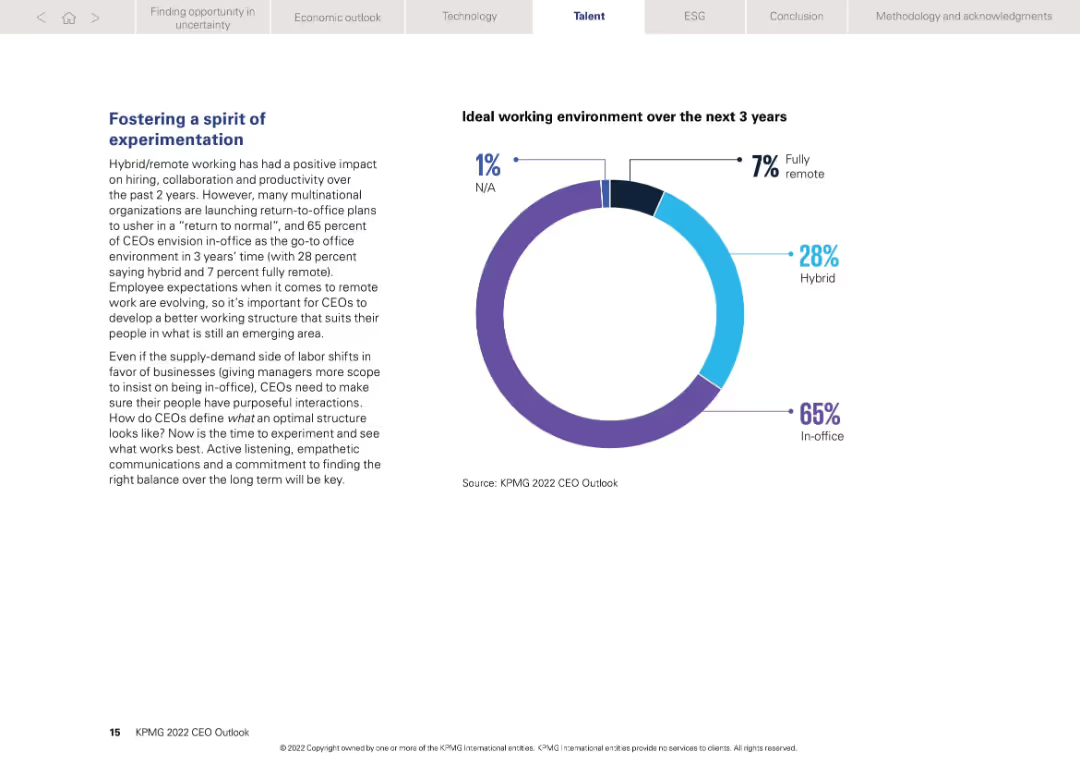
Discusses post-pandemic work structure evolution. 65% of CEOs expect return to in-office setup, while 28% favor hybrid. Only 7% foresee fully remote work. The slide promotes experimentation in leadership style and structure to suit future employee expectations.
Remote work, hybrid, in-office, employee structure, experimentation
false
Human Resources and Talent Management
Professional Services
Mixed Chart
KPMG
Add to my slides
Remove from favorites
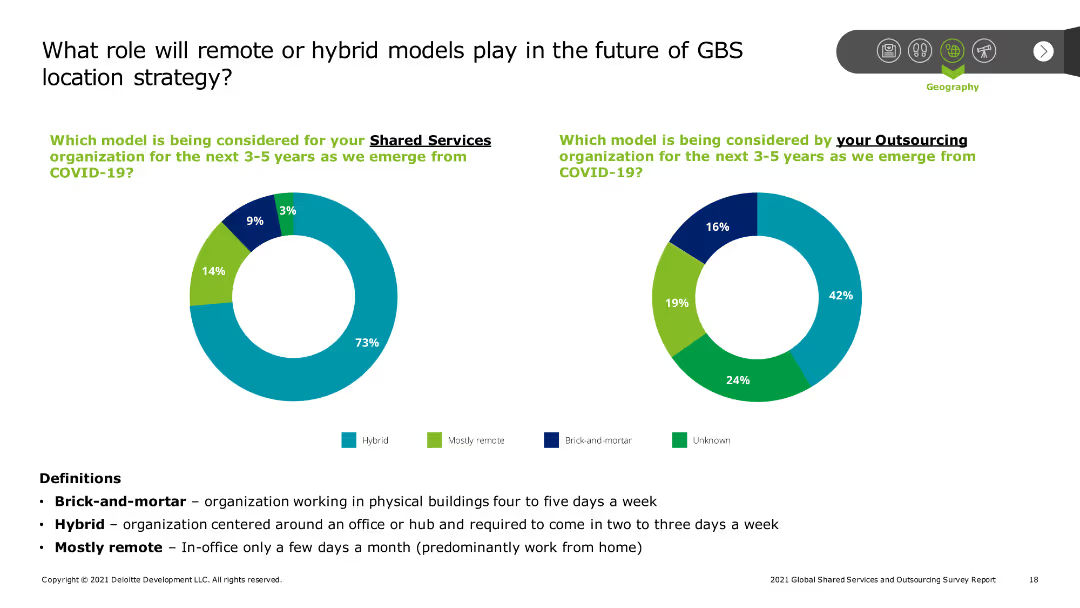
This slide presents two pie charts comparing models considered for shared services and outsourcing organizations post-COVID-19, including hybrid, remote, and brick-and-mortar models. Text provides definitions and key points.
Technology and Digital Transformation
Professional Services
The slide explores the role of remote or hybrid work models in the future of GBS location strategy, showing the distribution of preferred models for shared services and outsourcing organizations.
Remote work, hybrid models, GBS, location strategy, post-COVID-19
false
Technology and Digital Transformation
Professional Services
Multiple Chart
Deloitte
Add to my slides
Remove from favorites
The slide shows column charts depicting employee preferences for remote versus in-person work and expected management approaches over the next year.
Market Analysis and Trends
Professional Services
Discusses the ongoing shift in work modalities, emphasizing the preference for remote or hybrid models. It provides insight into the alignment (or misalignment) between employee desires and employer expectations, useful for strategic workforce planning.
remote work, hybrid work, management strategies, employee preferences, future of work
false
Market Analysis and Trends
Professional Services
Mixed Chart
PwC/Strategy&
Add to my slides
Remove from favorites
Two pie charts comparing percentages. One for 'Some of the Time' at 57.5% and another for 'All the Time' at 48.7%. Each pie chart is half and half styled, with symbols representing office buildings and a house respectively.
Customer and Market Segmentation
Professional Services
The slide shows the distribution of marketing professionals working remotely, either part-time or full-time, as surveyed in September 2022. It highlights the significant portion of the workforce that operates from home, showing a major shift in work environments.
Remote Work, Marketing, Telecommuting, Survey, Pie Chart, Workforce Distribution, 2022
false
Customer and Market Segmentation
Professional Services
Multiple Chart
Deloitte
Add to my slides
Remove from favorites
This slide displays a bar chart with horizontal bars illustrating survey responses about remote working preferences among Millennials and Gen Z. The bars are color-coded for each group, accompanied by explanatory text on the left.
Market Analysis and Trends
Professional Services
The slide highlights survey findings on the growing preference for remote work among Millennials and Gen Z, with detailed insights into their views on work-life balance, productivity, and the desire to continue remote work post-pandemic. It provides valuable data for employers planning future work arrangements.
Remote Work, Millennials, Gen Z, Work-Life Balance, Survey
false
Market Analysis and Trends
Professional Services
Multiple Chart
Deloitte
Add to my slides
Remove from favorites
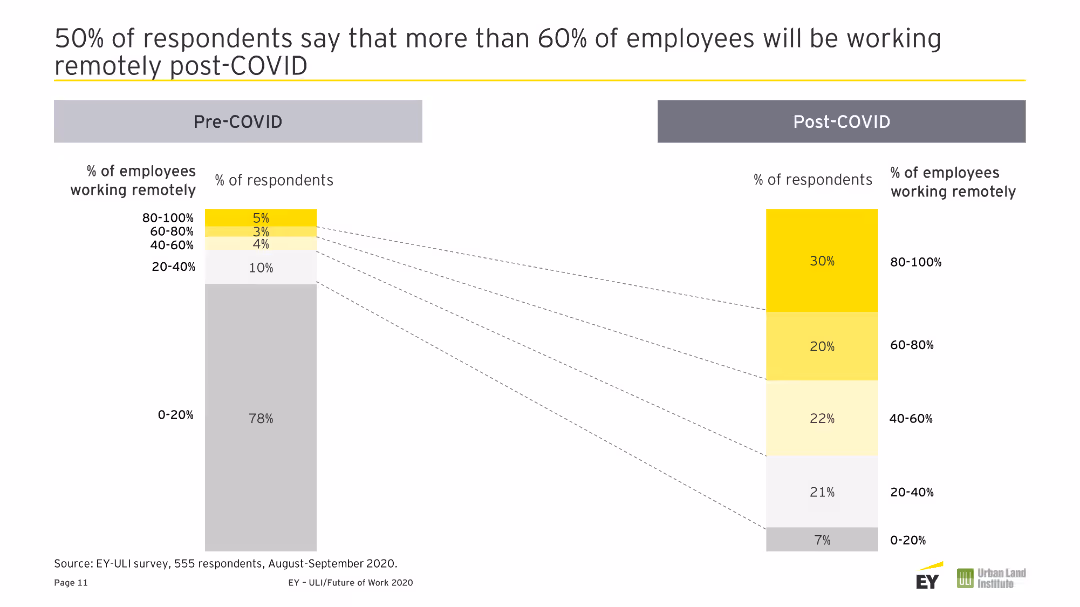
A column chart comparing pre and post-COVID percentages of employees working remotely across different timeframes.
Human Resources and Talent Management
Technology & Software
This slide highlights survey results indicating that a significant portion of employees are expected to work remotely most of the time post-COVID-19.
Remote Work, Post-COVID, Workforce, Survey, Employee Expectations
false
Human Resources and Talent Management
Technology & Software
Multiple Chart
EY
Add to my slides
Remove from favorites
The slide features a donut chart, a column chart, and a scale graphic. The left side shows the remote work preference index, and the right side explains the scoring.
Human Resources and Talent Management
Professional Services
Introduces the Remote Work Preference Index, quantifying employee preferences for remote work models and highlighting key statistics and scoring methodology.
remote work, preference index, survey, scoring, employee preferences
false
Human Resources and Talent Management
Professional Services
Mixed Chart
EY
Add to my slides
Remove from favorites
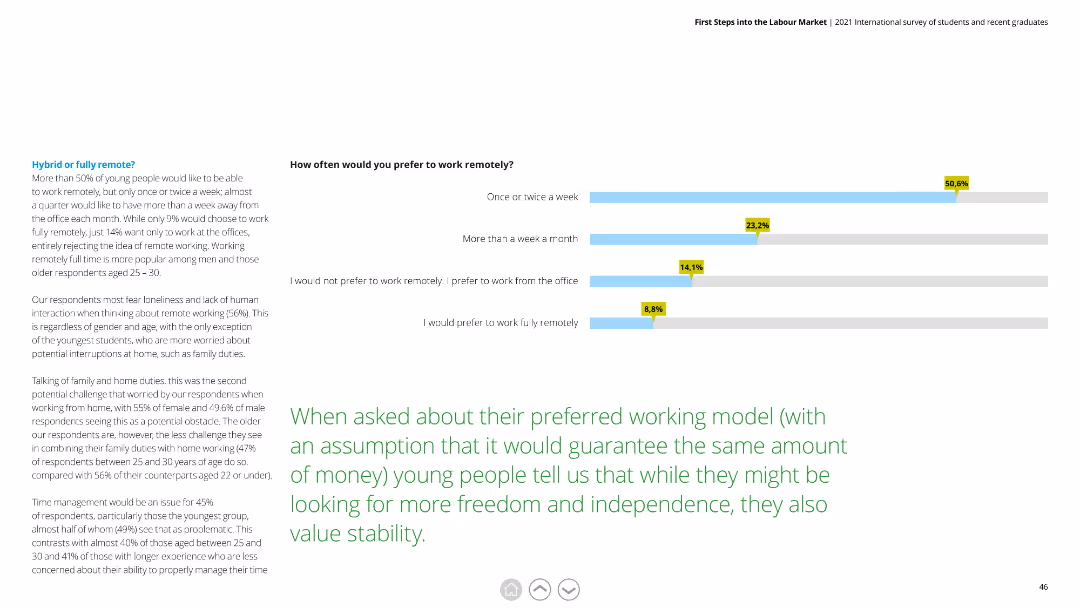
This slide features a bar chart with horizontal bars in blue and green. The text is organized into two columns, providing detailed explanations of remote working preferences and their implications.
Human Resources and Talent Management
Professional Services
Analyzes preferences for remote working among young people. Highlights the popularity of hybrid working models and discusses challenges like loneliness and time management.
remote work, preferences, hybrid, challenges, loneliness, time management, respondents
false
Human Resources and Talent Management
Professional Services
Mixed Chart
Deloitte
Add to my slides
Remove from favorites
Comparative slide with three columns detailing managing remote work requests, assessing compliance risks, and approval/documentation processes, with simple icons and text.
Risk Assessment and Management
Professional Services
This slide focuses on tracking and managing employee and employer risk and compliance related to remote work, outlining methods for managing requests, assessing risks, and handling approvals.
Remote work, risk assessment, compliance, management, approval
false
Risk Assessment and Management
Professional Services
Linear Flow
Deloitte
Add to my slides
Remove from favorites
Diagram with multiple icons representing different remote work scenarios, each described below with brief points in colored boxes.
Human Resources and Talent Management
Professional Services
This slide outlines various remote work scenarios, including domestic and international options for existing employees and new hires, emphasizing features and challenges of each scenario.
Remote work, scenarios, domestic, international, challenges
false
Human Resources and Talent Management
Professional Services
Pillar
Deloitte
Add to my slides
Remove from favorites
Diagram showing a flow from immediate actions to long-term strategy, with icons and descriptions for each stage and related tools.
Strategic Planning
Professional Services
This slide presents a strategy for remote work, from immediate actions to long-term planning, including identifying worker locations, managing compliance, developing frameworks, and continual improvement.
Remote work, strategy, compliance, governance, planning
false
Strategic Planning
Professional Services
Table
Deloitte
Add to my slides
Remove from favorites
Diagram slide with three sections (employee request, compliance assessment, outcomes and results), each with icons and text describing the process.
Risk Assessment and Management
Professional Services
This slide elaborates on leveraging technology to manage and automate requests, risk assessments, and outcomes for remote work, highlighting objectives, activities, and tools used in each stage.
Remote work, technology, automation, risk assessment, outcomes
false
Risk Assessment and Management
Professional Services
Header Horizontal
Deloitte
Add to my slides
Remove from favorites
Includes comparative lists and diagrams outlining remote work evolution and strategies, color-coded for clarity between past and future strategies, with emphasis on technology integration and policy development.
Technology and Digital Transformation
Professional Services
Explores the evolution of smart work practices pre- and post-crisis, examining how organizations can adapt to remote working for improved safety, productivity, and cost efficiency, with a focus on technology and policy enhancements.
Remote work, Technology integration, Work policy, Productivity, Cost efficiency
false
Technology and Digital Transformation
Professional Services
Mixed Chart
BCG
Add to my slides
Remove from favorites
Slide has a large title in bold at the top, a purple donut chart in the center showing percentages of change in work-from-home frequency, and a quote on the right side in a speech bubble.
Market Analysis and Trends
Professional Services
This slide presents data on changes in work-from-home practices post-outbreak and includes a personal testimonial to underscore the human aspect of the shift.
remote work, trends, COVID-19, work from home, data visualization, testimonial
false
Market Analysis and Trends
Professional Services
Single Chart
Accenture
Add to my slides
Remove from favorites
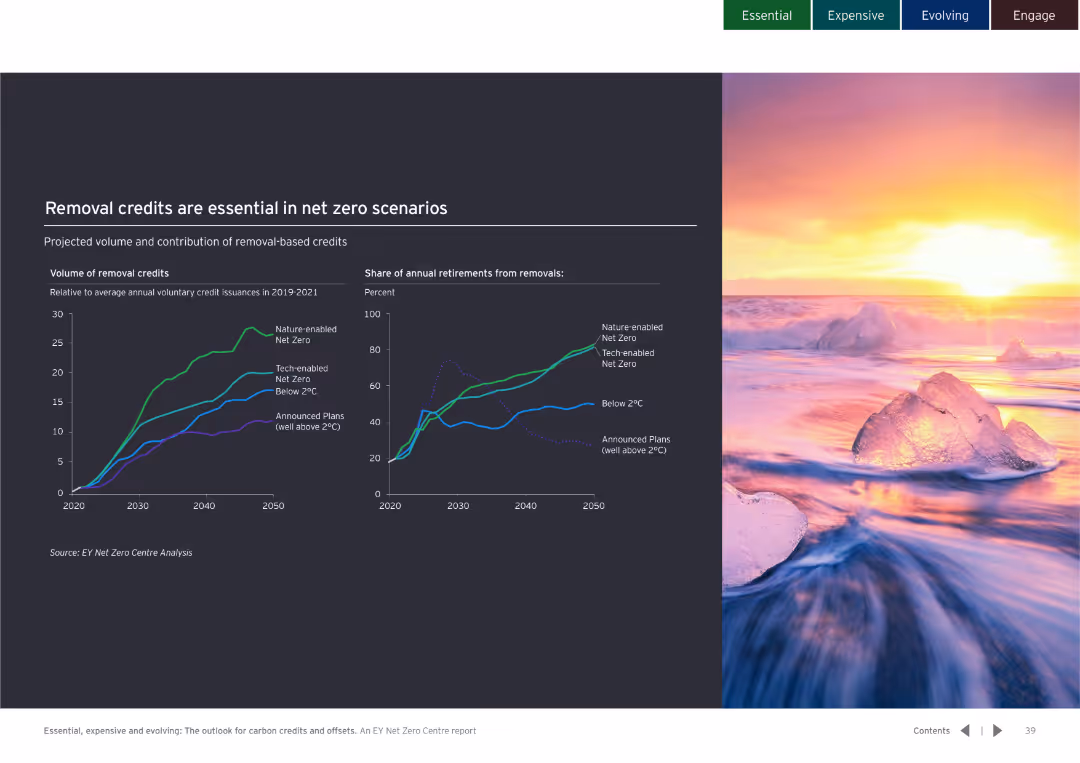
Dark background with line graphs showing the volume of removal credits and their share in annual retirements. Color-coded for clarity.
Financial Performance
Environmental Services & Sustainability
Highlights the essential role of removal credits in achieving net zero scenarios and their projected volumes over time.
removal credits, net zero, volume projections
false
Financial Performance
Environmental Services & Sustainability
Multiple Chart
EY
Add to my slides
Remove from favorites
Two line charts comparing CEO remuneration opportunities at target and maximum performance across various countries, emphasizing the significant outlier status of the US in terms of total compensation.
Market Analysis and Trends
Financial Services
The slide illustrates the variation in CEO remuneration opportunities across different countries, showing that the US has significantly higher levels compared to other regions.
Remuneration, Geography, CEO, Performance, Compensation
false
Market Analysis and Trends
Financial Services
Multiple Chart
Deloitte
Add to my slides
Remove from favorites
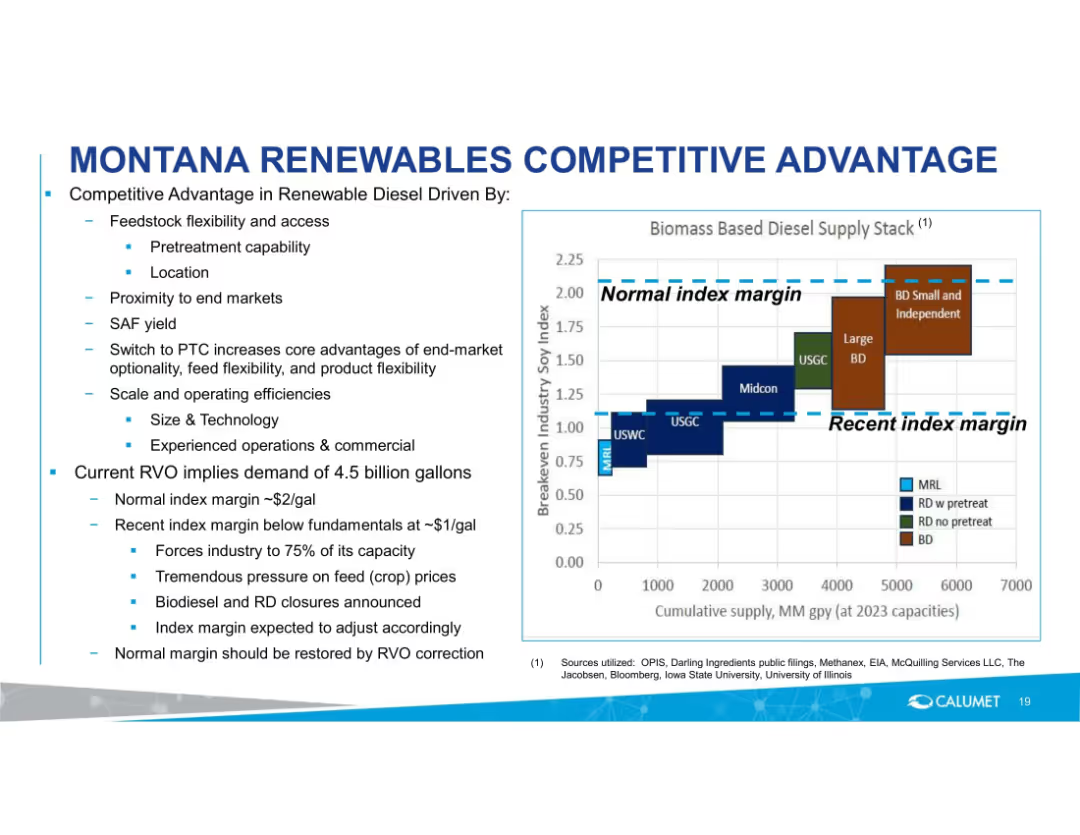
Left-aligned text and bullet points with a central stacked bar chart showing breakeven margin vs. industry benchmarks.
Strategic Planning
Energy & Utilities
Emphasizes Montana Renewables’ feedstock and operational advantages. Compares index margins and industry supply stack, and outlines challenges under current RVO demand, emphasizing future normalization of margins through corrections.
renewable diesel, feedstock, RVO, margin pressure, index margin, capacity, operational efficiency, diesel supply, Montana Renewables
false
Strategic Planning
Energy & Utilities
Mixed Chart
Goldman Sachs
Add to my slides
Remove from favorites
The slide features a diagram illustrating the biofuel x market combination, showing the value chain, sectors, segments, optimal biofuel, biofuel performance, competitive advantage, and maturity. Segments include power generation, CHP, heat generation, trucks, aviation, shipping, and cars.
Strategic Planning
Energy & Utilities
This slide highlights the best medium-term opportunities for biofuels, such as renewable diesel for road transports and biogas in power generation, and presents a detailed comparison of biofuel performance, competitive advantage, and market maturity.
renewable diesel, road transports, biogas, power generation, biofuel performance, competitive advantage, market maturity
false
Strategic Planning
Energy & Utilities
Table
Kearney
Add to my slides
Remove from favorites
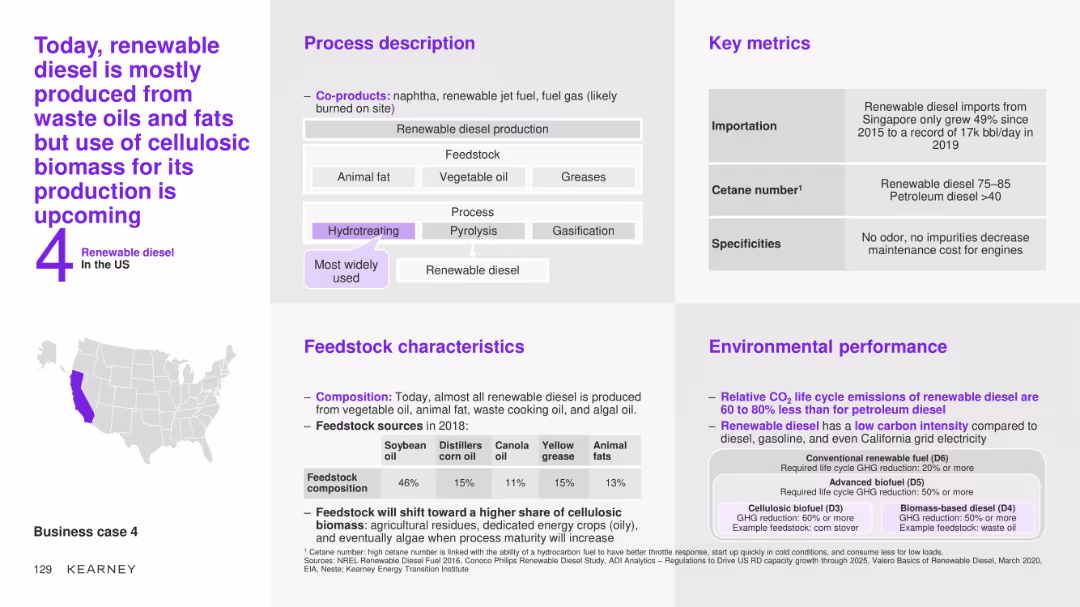
The slide features a detailed case study on renewable diesel production in the US, covering the process description, key metrics, feedstock characteristics, and environmental performance.
Client Case Studies
Energy & Utilities
This slide examines the renewable diesel production process in the US, detailing the conversion process, key metrics, feedstock characteristics, and environmental impacts associated with renewable diesel production, highlighting its viability and benefits.
renewable diesel, US, case study, process description, key metrics, feedstock characteristics, environmental performance
false
Client Case Studies
Energy & Utilities
Diagram
Kearney
Add to my slides
Remove from favorites
The slide features a detailed case study on the renewable diesel market in the US, covering the description, process characteristics, global market overview, and drivers/barriers. It includes a column chart showing renewable diesel production from 2007 to 2018.
Client Case Studies
Energy & Utilities
This slide provides an in-depth analysis of the renewable diesel market in the US, detailing the production process, market potential, and the benefits and challenges of developing renewable diesel as a competitive alternative to biodiesel.
renewable diesel, US, case study, process description, market overview, drivers, barriers, production
false
Client Case Studies
Energy & Utilities
Mixed Chart
Kearney
Add to my slides
Remove from favorites
Previous
Next
You don't have any favorites yet.
Please wait loading your favorites slides...
Create a FREE account to continue browsing
Receive Instant Access to 1,000+ slides from companies like McKinsey, Google, and Goldman Sachs
First Name
Last Name
Email
Password
I agree to all
Terms & Privacy Policy
Thank you! Your submission has been received!
Oops! Something went wrong while submitting the form.
Have an account?
Sign in
Upgrade to PRO to Save slides
Advanced Search and Filters
Access to 15,000+ slides
Access to Category Pages
Save/Bookmark Slides
PowerPoint Template Library
Pick a Plan
MONTHLY
$12/month
Billed every month, Cancel anytime.
YEARLY
$9/year
Billed $108 annually, Cancel anytime.
Checkout for $12/month
Checkout for $108/yr
Secured by Stripe | AES-256 bit encryption


![To be a [RELIGIOUS MAJORITY]](https://cdn.prod.website-files.com/654e70fb59937215cac87b19/6899bb1de44404f6f3c2da5a_90hoBWGU4Gu7-ZejW5r9InVHbDZ_qwHcyS-P8KthWT4.avif)