My Account
My Slides
Search by Category
Pricing
Templates
View All Templates
Download Template Slides
✦ AI Search
Feedback
Login
Logout
Get Started
Browse all Slides
Browse all Slides
Create a FREE Account
Instant access to 1,000+ real slides from top companies like McKinsey, BCG, Goldman Sachs, Google and many more!
First Name
Last Name
Email
Password
I agree to all
Terms & Privacy Policy
Thank you! Your submission has been received!
Oops! Something went wrong while submitting the form.
Have an account?
Sign in
Saved Slides
Total No. of slides saved
0
↻ Refresh
✖ Clear all
The slide features a detailed case study on the growth of the renewable diesel market in the US, covering the value chain stakeholders, market information, production cost analysis, and key regulations and policies.
Client Case Studies
Energy & Utilities
This slide analyzes the growth of the renewable diesel market in the US, highlighting the value chain, market information, production costs, and regulatory environment that supports the expansion and adoption of renewable diesel as a biofuel.
renewable diesel, US, case study, value chain, stakeholders, market information, production cost, regulations
false
Client Case Studies
Energy & Utilities
Mixed Chart
Kearney
Add to my slides
Remove from favorites
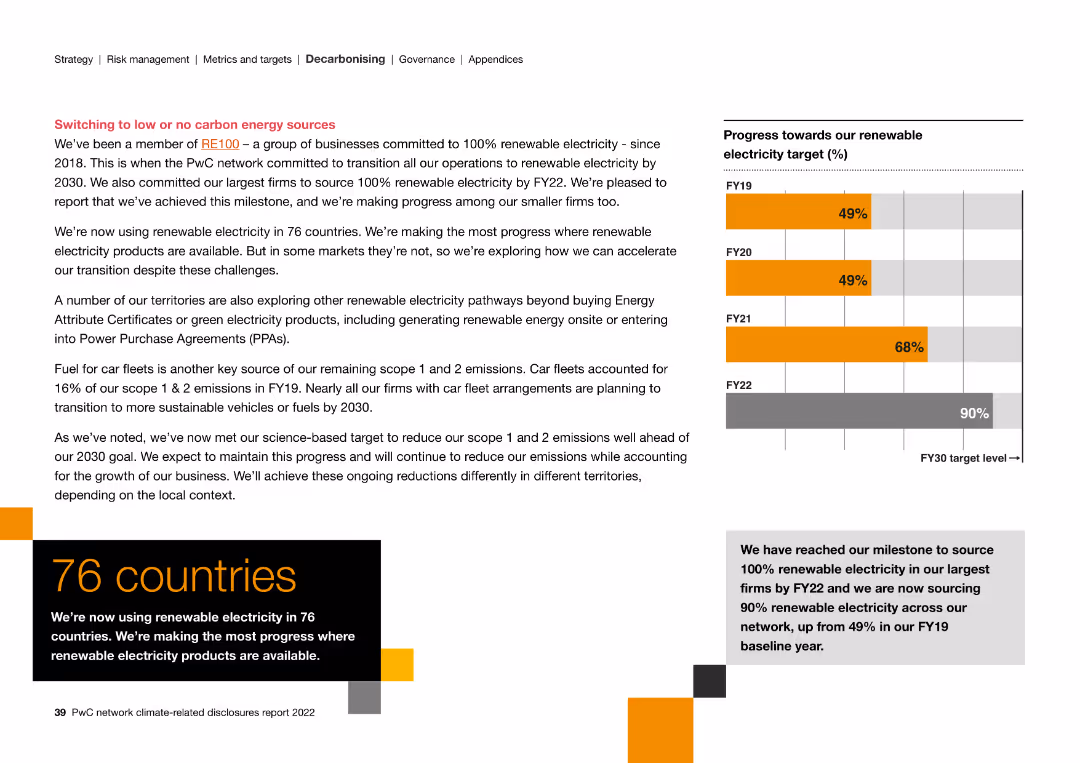
The slide contains a column chart and text, illustrating progress towards renewable electricity targets and exploring alternative energy sources.
Strategic Planning
Energy & Utilities
The slide discusses the transition to 100% renewable electricity, highlighting achievements in 76 countries and exploring further renewable energy pathways.
renewable electricity, carbon energy, transition, targets, achievements, alternative energy
false
Strategic Planning
Energy & Utilities
Mixed Chart
PwC/Strategy&
Add to my slides
Remove from favorites
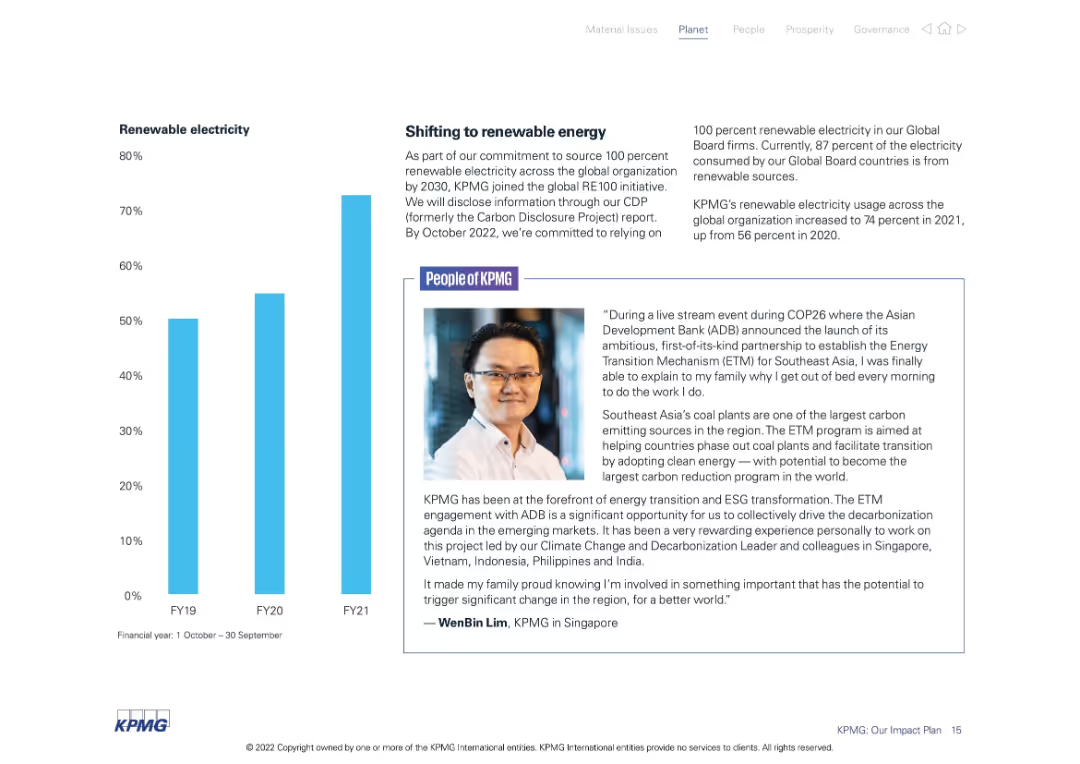
Dual-section layout with a bar chart on the left showing growth in renewable electricity usage (FY19–FY21) and a testimonial on the right. Visuals use clean white and blue tones.
Operational Efficiency
Environmental Services & Sustainability
Illustrates KPMG’s shift toward renewable electricity with a steady increase from 56% in 2020 to 74% in 2021. Also includes a personal account from a team member about the impact of ESG initiatives in Southeast Asia.
renewable electricity, ESG, sustainability, KPMG, energy transition, FY21, Southeast Asia
false
Operational Efficiency
Environmental Services & Sustainability
Mixed Chart
KPMG
Add to my slides
Remove from favorites
The slide features a column chart showing the primary demand for renewable energies from 2000 to 2017, detailing the contributions of wind, solar, geothermal, hydro, advanced biofuels, and primary solid biofuels, with CAGR percentages.
Market Analysis and Trends
Energy & Utilities
This slide tracks the growth and changing composition of renewable energy demand from 2000 to 2017, emphasizing the shift towards wind and solar energies while noting the decreasing share of bioenergy.
renewable energies, primary demand, 2000-2017, wind, solar, geothermal, hydro, biofuels
false
Market Analysis and Trends
Energy & Utilities
Single Chart
Kearney
Add to my slides
Remove from favorites
Column chart showing energy capacity additions from 2017 to 2022 with categories for different energy sources.
Market Analysis and Trends
Energy & Utilities
Details the increase in power generation capacity over the past 5 years, driven by renewable sources.
Renewable, Energy, Capacity, Growth, Sources
false
Market Analysis and Trends
Energy & Utilities
Mixed Chart
Kearney
Add to my slides
Remove from favorites
This slide features bar graphs showing the projected increases in installed capacity for utility-scale solar, onshore and offshore wind, and non-residential storage by 2030, indicating substantial growth.
Market Analysis and Trends
Energy & Utilities
Discusses the potential for significant expansion in renewable energy capacity, highlighting how technological and fiscal developments might drive a transition away from fossil fuels.
renewable energy, capacity increase, solar, wind, storage, 2030 outlook
false
Market Analysis and Trends
Energy & Utilities
Multiple Chart
BCG
Add to my slides
Remove from favorites
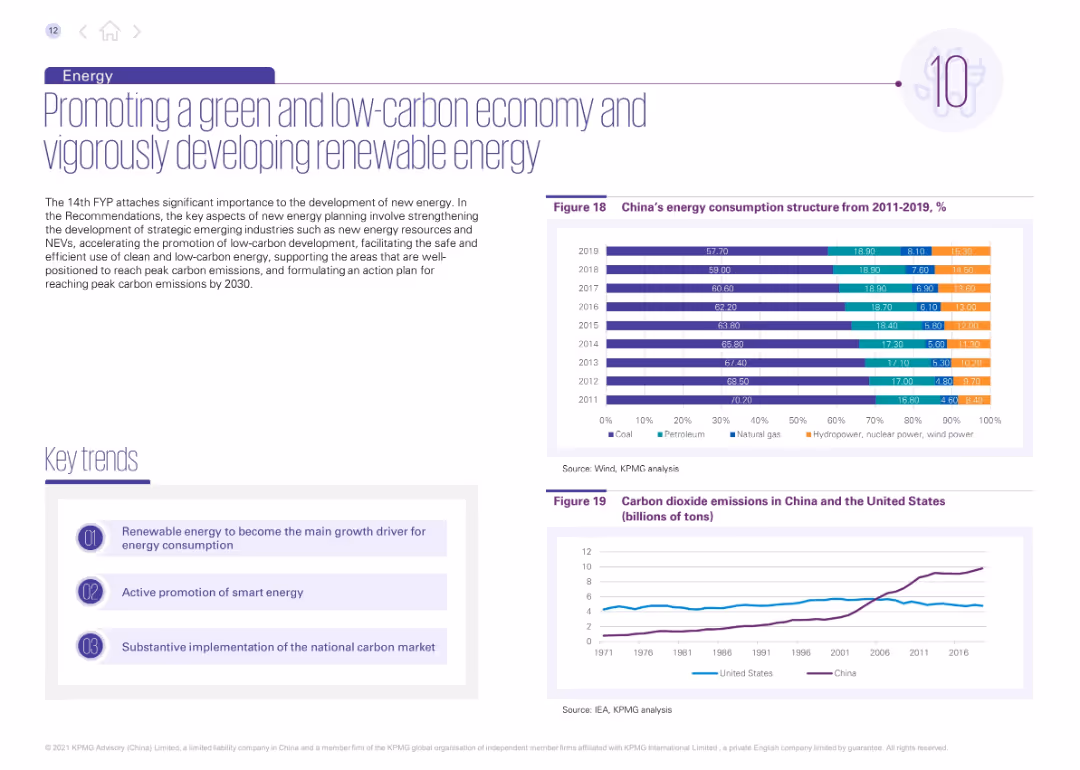
Left-aligned text with three key trends; right side shows stacked bar chart of energy consumption mix and line chart comparing CO2 emissions (China vs. US).
Investment Analysis
Energy & Utilities
This slide outlines China’s green energy agenda, focusing on renewable energy adoption, carbon market development, and low-carbon strategies. Data visuals show shifts in energy structure over time and rising carbon emissions compared to the U.S.
renewable energy, carbon emissions, China vs US, low-carbon economy, smart energy, energy transition, policy planning, green strategy, sustainability
false
Investment Analysis
Energy & Utilities
Multiple Chart
KPMG
Add to my slides
Remove from favorites
Comprises a column chart depicting 'Economic benefits of Copernicus through its contribution to renewable energy monitoring' and a series of diagram depicting benefits for end and intermediate users.
Financial Performance
Energy & Utilities
Details the economic and environmental benefits derived from utilizing Copernicus data in the renewable energy sector, highlighting increased profitability and reduced GHG emissions.
Renewable Energy, Copernicus, Benefits
false
Financial Performance
Energy & Utilities
Mixed Chart
PwC/Strategy&
Add to my slides
Remove from favorites
The slide displays a column chart on 'Copernicus economic impact (2018)' for renewable energy, a list of key Copernicus products, and a small text section.
Technology and Digital Transformation
Energy & Utilities
Focuses on how Copernicus data supports the renewable energy sector, including the use of raw data for improving energy forecasts and planning. Highlights economic impacts and opportunities for growth within the sector.
Renewable Energy, Copernicus, Economic Impact
false
Technology and Digital Transformation
Energy & Utilities
Mixed Chart
PwC/Strategy&
Add to my slides
Remove from favorites
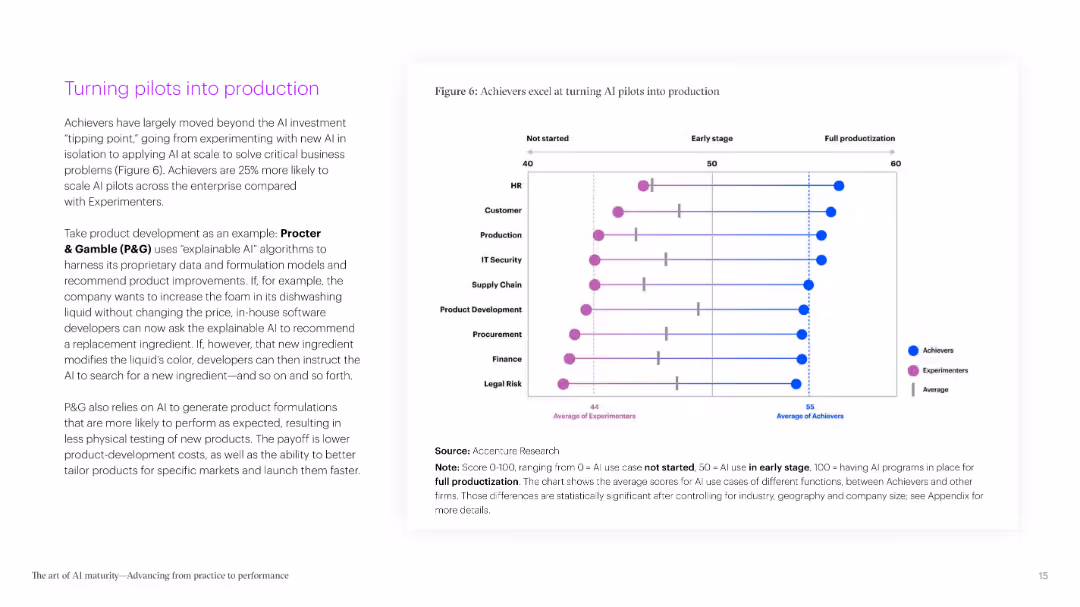
Contains bar graphs showing the levelized cost of energy for solar, onshore and offshore wind, and nuclear power with and without tax credits, illustrating significant cost reductions due to fiscal incentives.
Market Analysis and Trends
Energy & Utilities
Examines how full application of tax credits could reduce the costs associated with generating energy from various renewable sources, emphasizing the financial benefits of government incentives.
renewable energy, cost reduction, tax credits, solar, wind, nuclear
true
Market Analysis and Trends
Energy & Utilities
Single Chart
BCG
Add to my slides
Remove from favorites
Slide contains two scatter plots on a single frame comparing EBITDA growth and margin among various companies in renewable energy sectors like hydrogen and solar. The data points are color-coded by sector.
Market Analysis and Trends
Energy & Utilities
Discusses the financial performance of companies in the renewable sector by comparing growth and EBITDA margin, highlighting market trends and company positions within the industry.
renewable energy, EBITDA, market analysis, growth, financial performance
false
Market Analysis and Trends
Energy & Utilities
Multiple Chart
Barclays
Add to my slides
Remove from favorites
The slide includes a column chart illustrating the transition to renewable energy on farms and electric vehicles. It provides detailed descriptions of included actions and example initiatives.
Technology and Digital Transformation
Agriculture & Food Production
This slide outlines the transition to renewable energy and electric vehicles in agriculture. It highlights the adoption of renewable energy on farms, the transition to electric vehicles, and their impact on emissions reduction and cost savings.
Renewable energy, Electric vehicles, Agriculture, Emissions, Cost savings
false
Technology and Digital Transformation
Agriculture & Food Production
Mixed Chart
EY
Add to my slides
Remove from favorites
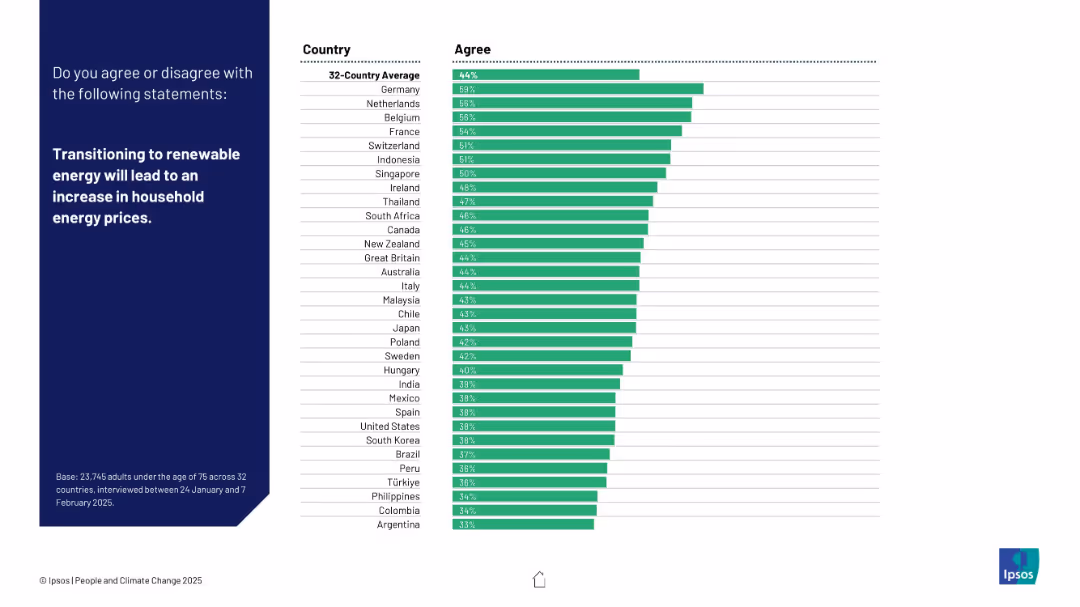
Left panel with bold white statement; right panel shows bar chart with 32-country responses, sorted by agreement level.
Market Analysis and Trends
Energy & Utilities
The slide presents survey results on public belief that shifting to renewable energy will raise energy prices. Germany leads agreement; Argentina is least concerned.
renewable energy, energy prices, household costs, public opinion, country comparison, Ipsos, energy transition, affordability, sustainability, global attitudes
false
Market Analysis and Trends
Energy & Utilities
Mixed Chart
IPSOS
Add to my slides
Remove from favorites
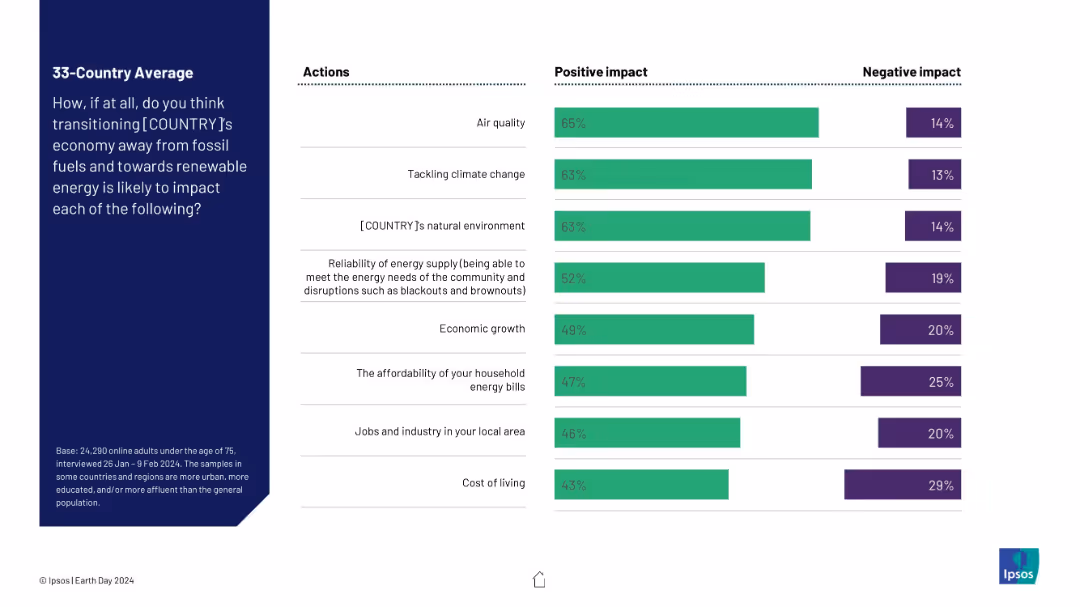
Stacked horizontal bar chart showing perceived positive vs. negative impact of transitioning to renewable energy across different societal aspects.
Technology and Digital Transformation
Environmental Services & Sustainability
The slide evaluates global perceptions on how a transition to renewable energy may affect areas like air quality, economy, and energy affordability. Respondents see overwhelmingly positive impacts across all categories, especially in air quality and environment.
renewable energy, energy transition, public opinion, climate change, societal impact, Ipsos, air quality, sustainability, energy policy
false
Technology and Digital Transformation
Environmental Services & Sustainability
Mixed Chart
IPSOS
Add to my slides
Remove from favorites
The slide is divided into three sections, each with bar graphs and comparative data matrices. The first section forecasts Australia's renewable energy targets; the second evaluates Australia against global ESG standards in mining; the third section discusses renewable energy as a percentage of total energy generation comparing Australia to the EU and US. Each part is clearly delineated and uses a consistent color scheme for easy comparison.
Competitive Landscape
Energy & Utilities
Highlights Australia's commitment to reaching high levels of renewable energy generation by 2030 and its strong ESG policies in mining, contrasting with other major economies and demonstrating its industry leadership.
renewable energy, ESG, mining, Australia, 2030 targets, energy generation, sustainability, global standards, industry leadership, policy strength
false
Competitive Landscape
Energy & Utilities
Mixed Chart
Accenture
Add to my slides
Remove from favorites
Column chart of renewable energy projects by country and a list of top European countries by attractiveness index.
Market Analysis and Trends
Energy & Utilities
Analyzes renewable energy investments, showcasing the dominance of four European countries in this sector.
renewable energy, investments, Europe, top countries, attractiveness index
false
Market Analysis and Trends
Energy & Utilities
Mixed Chart
EY
Add to my slides
Remove from favorites
This slide discusses various asset classes within the green economy, using background images and concise text to highlight key areas like solar and wind energy, and electric mobility.
Investment Analysis
Energy & Utilities
Explores deep dives into investor activities in Southeast Asia, identifying significant investment opportunities and challenges in sectors like renewable energy and electric mobility, emphasizing the potential for growth and the need for enhanced infrastructure and policies.
renewable energy, investments, Southeast Asia, electric mobility
false
Investment Analysis
Energy & Utilities
Text Only
Bain
Add to my slides
Remove from favorites
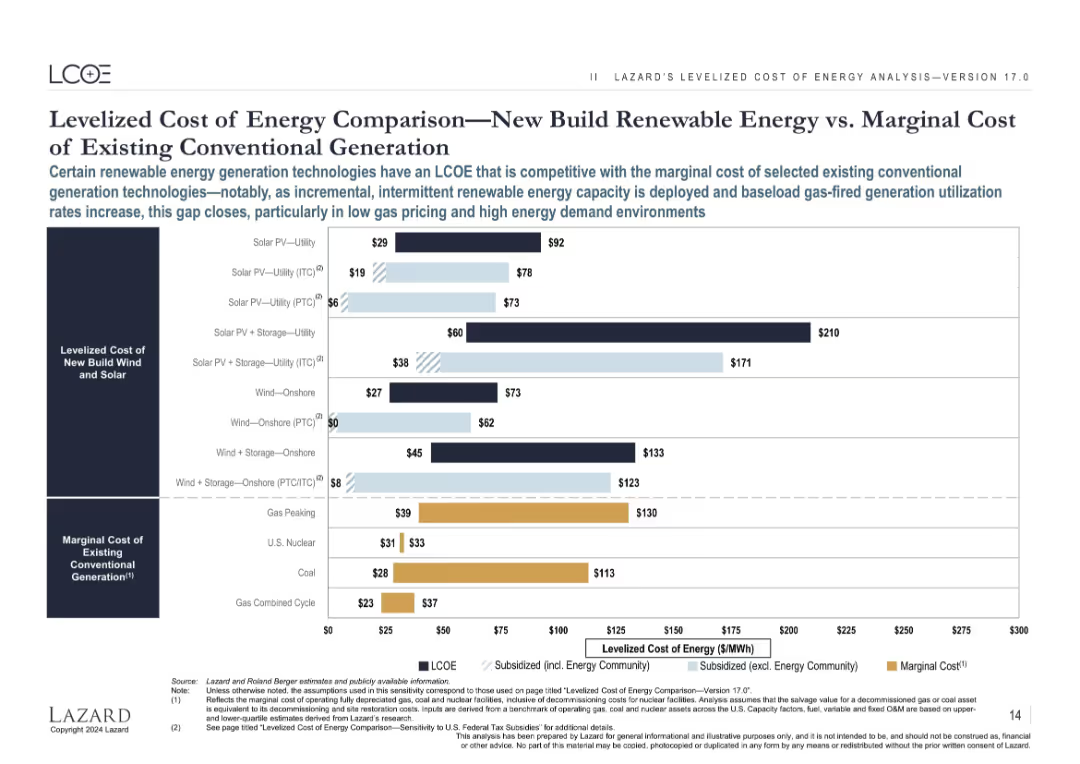
This slide includes a horizontal bar chart comparing the levelized cost of new-build renewable energy sources to the marginal cost of existing conventional generation technologies.
Market Analysis and Trends
Energy & Utilities
The slide contrasts the levelized cost of energy for new renewable energy projects against the marginal cost of existing conventional technologies, showcasing competitiveness and economic viability.
Renewable Energy, Marginal Cost, Comparison, LCOE, Conventional Technologies
false
Market Analysis and Trends
Energy & Utilities
Single Chart
Roland Berger
Add to my slides
Remove from favorites
Includes several column charts related to renewable energy consumption in EU member states, CO2 emissions, and a large text section discussing the role of renewable energy in EU energy targets.
Market Analysis and Trends
Energy & Utilities
Explores the expansion of renewable energy within the EU, noting specific contributions to energy targets and environmental benefits. Discusses the integration of solar and wind power into the energy mix and the impact on CO2 emissions.
Renewable Energy, Market Growth, EU
false
Market Analysis and Trends
Energy & Utilities
Multiple Chart
PwC/Strategy&
Add to my slides
Remove from favorites
Slide with multiple data tables and a large, detailed graphic of renewable energy symbols. Blue-toned, clean layout, with graphs displaying renewable energy capacity in MW.
Industry Overview
Energy & Utilities
Shows the status of renewable energy sources in the Philippines, including hydro, geothermal, solar, wind, and biomass, comparing capacity and projects in development.
Renewable energy, Philippines, capacity, hydro, solar, geothermal, biomass, wind, projects
false
Industry Overview
Energy & Utilities
Table
Deloitte
Add to my slides
Remove from favorites
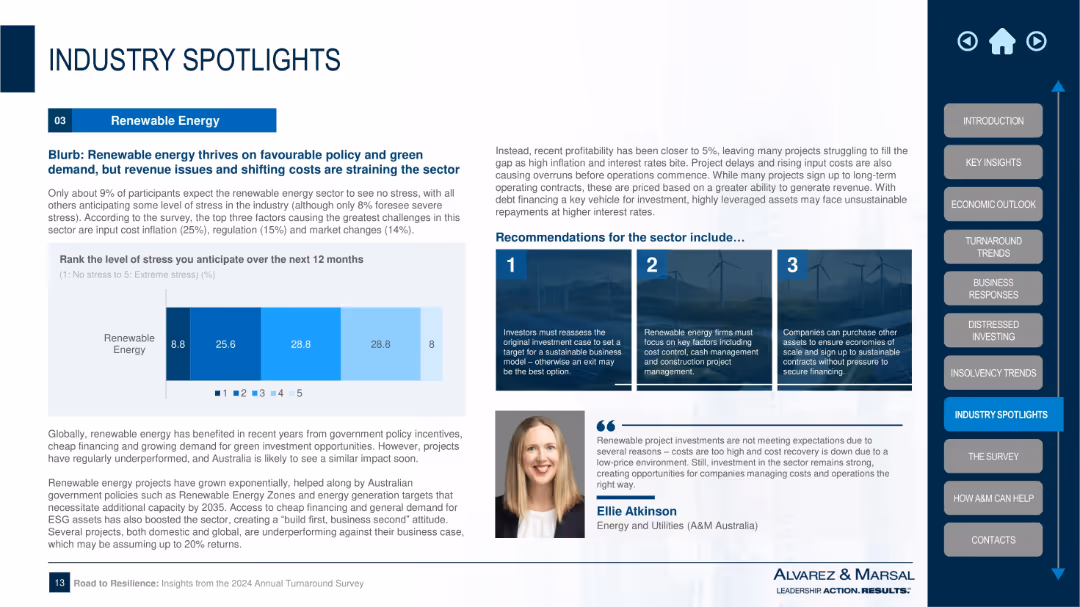
Stress ranking chart on left, contextual analysis and 3-point recommendation set on right; quote and speaker image below
Market Analysis and Trends
Energy & Utilities
This slide covers Renewable Energy, noting stress from rising input costs and regulatory shifts despite strong policy support. Offers insights into cost control, project management, and investment case reassessment. Highlights risk of underperformance and tight returns due to cost overruns and high rates.
renewable energy, policy support, cost control, project finance, inflation, energy market, investor strategy, sustainability, capital planning
false
Market Analysis and Trends
Energy & Utilities
Mixed Chart
Alvarez & Marsal
Add to my slides
Remove from favorites
This slide contains a bar graph displaying the historical and projected global power generation mix. It uses a color-coded legend to differentiate between renewable and non-renewable sources.
Strategic Planning
Energy & Utilities
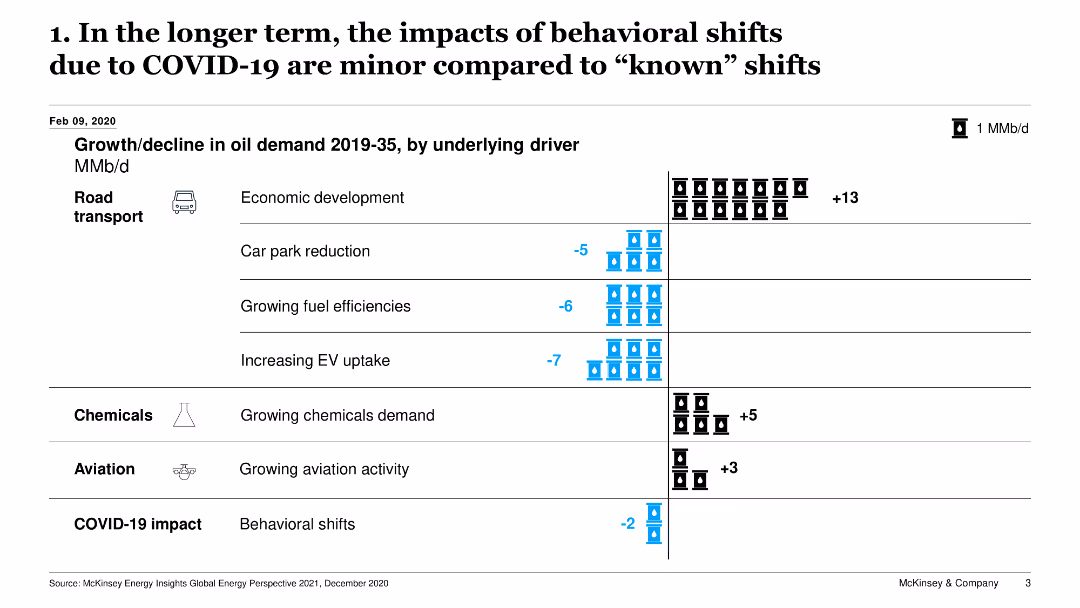
The slide emphasizes the growing share of renewables in the power generation mix, projecting that by 2050, 80-90% of power will be from renewable sources, which is vital for strategic energy transition planning.
Renewable Energy, Power Generation, Global Trends, 2050 Projection, Energy Mix, Strategic Planning
false
Strategic Planning
Energy & Utilities
Mixed Chart
McKinsey
Add to my slides
Remove from favorites
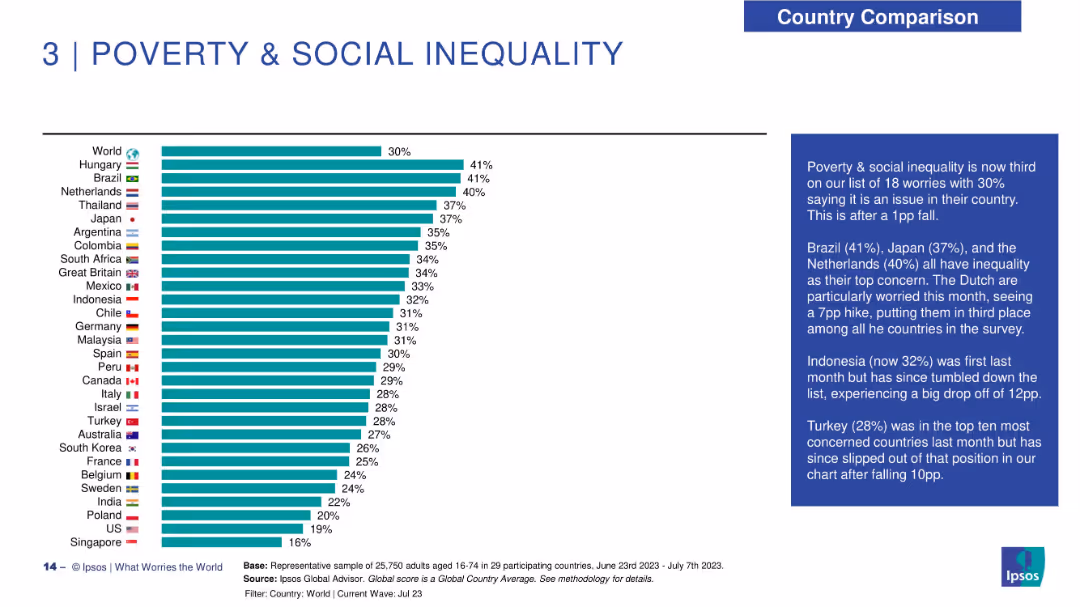
Horizontal bar chart ranking countries by concern over poverty and inequality; descriptive text panel on right.
Customer and Market Segmentation
Government & Public Sector
Poverty and social inequality is now the third most common global concern. The slide ranks countries based on concern level, highlighting shifts in Brazil, Japan, Netherlands, and Indonesia.
renewable energy, public opinion, energy transition, Ipsos, climate impact, sustainability, economic outlook, environment
false
Customer and Market Segmentation
Government & Public Sector
Mixed Chart
IPSOS
Add to my slides
Remove from favorites
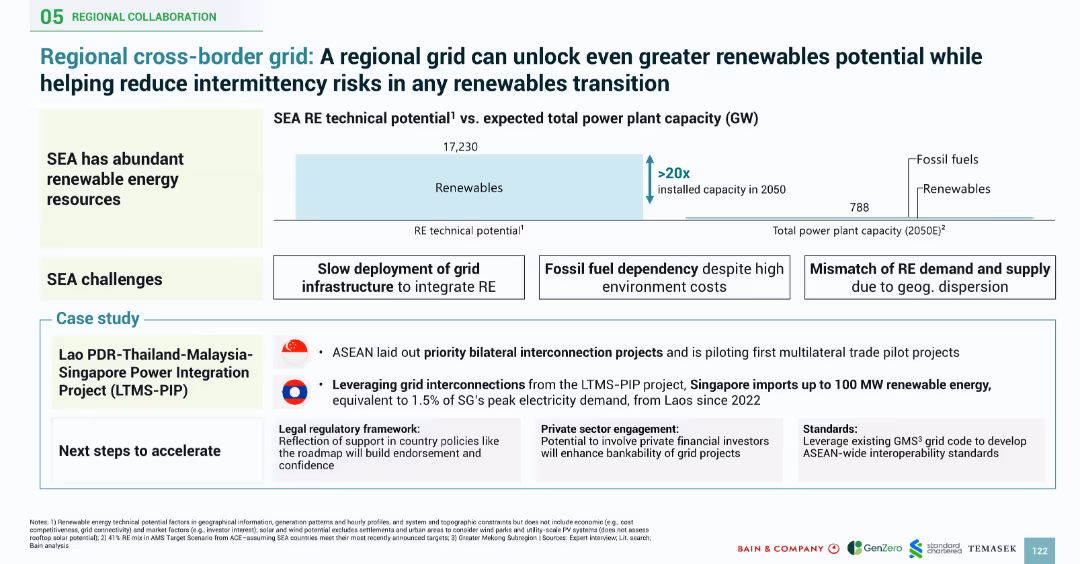
Split layout with charts, text blocks, and a highlighted case study; technical potential bar chart central to message
Technology and Digital Transformation
Energy & Utilities
Advocates for a regional energy grid to leverage SEA’s renewable potential, citing massive technical capacity and challenges like fossil fuel dependence and infrastructure delays; includes LTMS-PIP project case study
renewable energy, regional grid, interconnection, LTMS-PIP, fossil fuel dependency, SEA electricity
false
Technology and Digital Transformation
Energy & Utilities
Mixed Chart
Bain
Add to my slides
Remove from favorites
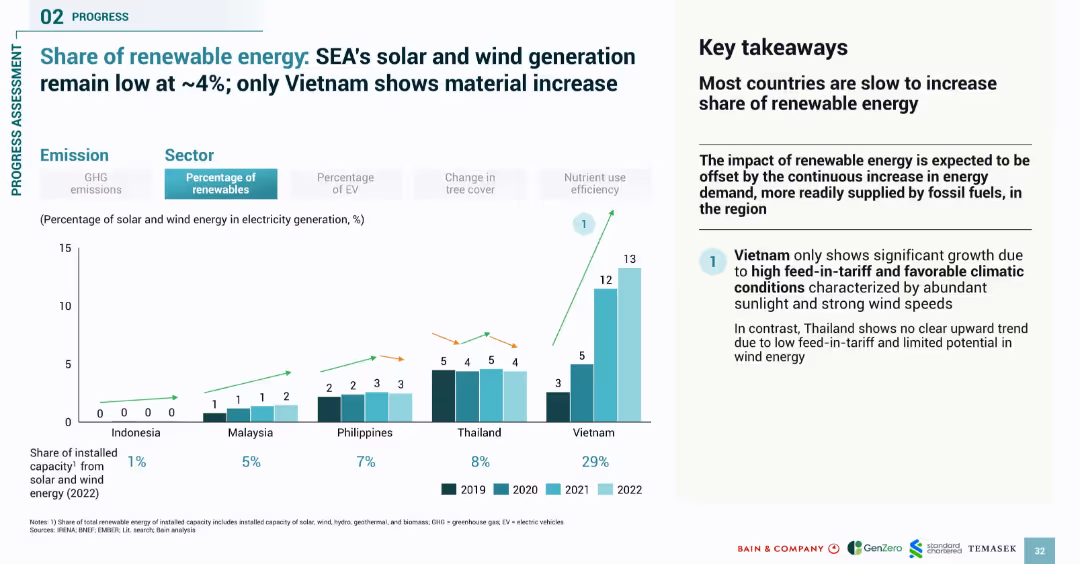
Vertical bar chart comparing renewable energy shares across years; takeaway text on the right
Performance Metrics and KPIs
Energy & Utilities
Reviews the growth in solar and wind energy share across SEA countries. It finds that most remain at ~4%, with Vietnam as the only country showing material increase due to favorable policies. The region's reliance on fossil fuels continues to offset renewable energy adoption.
renewable energy, SEA, solar, wind, Vietnam, energy transition, policy, electricity share
false
Performance Metrics and KPIs
Energy & Utilities
Multiple Chart
Bain
Add to my slides
Remove from favorites
The slide is divided into three main sections, each with its header and corresponding icons. On the left, there are two sections with bullet points discussing solar PV and offshore wind technologies. The right side features larger text and infographics, showing the percentage figures and other key points regarding net-zero power and growth in solar and wind power.
Strategic Planning
Energy & Utilities
This slide presents the disruptive potential of renewable energy sources in the electric power, natural gas, and utilities industries. It emphasizes required capabilities for scaling solar PV and offshore wind, as well as the expected market share from renewable sources by 2050. The focus is on strategic planning and preparation for the shift to a larger renewable energy mix, highlighting the importance of long-duration energy storage and the smart grid in achieving these goals. It is tailored for stakeholders and decision-makers involved in energy policy planning, infrastructure development, and investment in renewable technologies.
renewable energy, solar PV, offshore wind, long-duration storage, smart grid, net-zero power, energy transition, market growth, strategic planning, sustainability
false
Strategic Planning
Energy & Utilities
Boxed
McKinsey
Add to my slides
Remove from favorites
Contains multiple text boxes and images describing opportunities in sustainable farming, solar, built environment, and wind energy. Visuals include photos and simplified icons representing different sectors.
Strategic Planning
Energy & Utilities
The slide details various sectors within the renewable energy industry, supported by strong government policies and investment potential. It covers key opportunities and challenges across sustainable farming, solar energy, the built environment, and wind energy.
renewable energy, solar, wind, government support, investment
false
Strategic Planning
Energy & Utilities
Header Horizontal
Bain
Add to my slides
Remove from favorites
Map with icons representing power sources and a column chart depicting growth of renewable energy assets.
Strategic Planning
Energy & Utilities
Details Enbridge’s strategy in renewable energy, outlining growth in wind and solar power in Canada.
renewable, energy, strategy, growth, Canada
false
Strategic Planning
Energy & Utilities
Multiple Chart
Barclays
Add to my slides
Remove from favorites
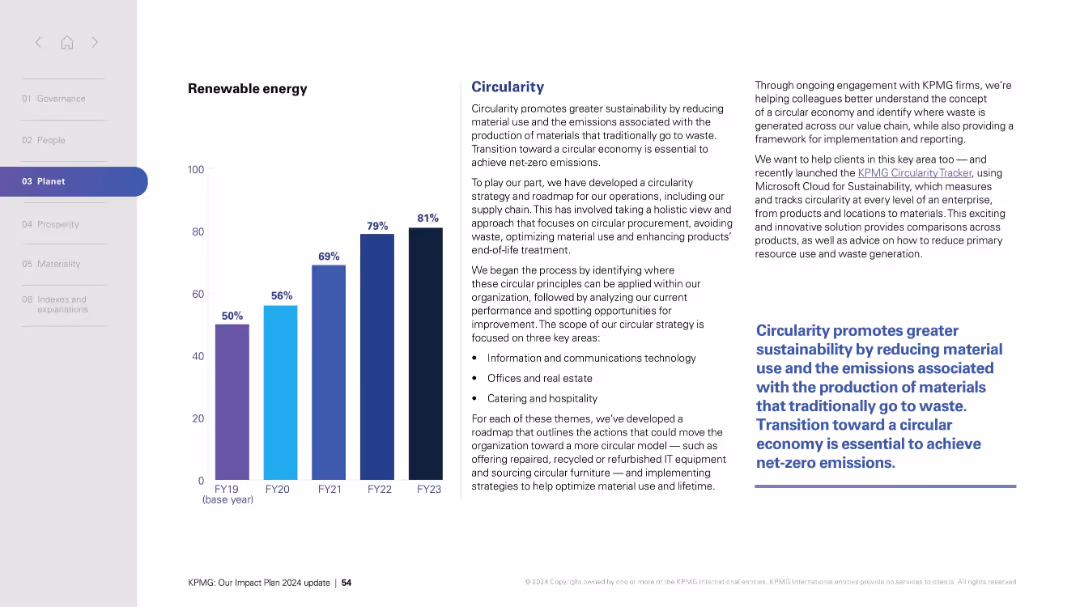
Split layout: left side with vertical bar chart (FY19–FY23), right side with text blocks and a bold quote.
Technology and Digital Transformation
Professional Services
Highlights progress in renewable energy usage across fiscal years and details a circularity strategy aimed at sustainability. The text explains how the organization is adopting circular economy principles by reducing material use, managing waste, and promoting sustainable procurement across various operations. It also mentions a tool (Circularity Tracker) that aids in tracking these efforts.
Renewable energy, sustainability, circularity, emissions, supply chain, procurement, technology, KPMG, net-zero, operations
false
Technology and Digital Transformation
Professional Services
Mixed Chart
KPMG
Add to my slides
Remove from favorites
Map of the United States showcasing the distribution of solar, wind, and geothermal projects with corresponding icons, plus a case study with text on the right.
Market Analysis and Trends
Energy & Utilities
This slide features a geographic overview and case study on JPMorgan Chase’s renewable energy projects, useful for discussions on sustainability and clean energy initiatives.
renewable energy, sustainability, solar, wind, geothermal, JPMorgan Chase, clean energy, geography, case study
false
Market Analysis and Trends
Energy & Utilities
Boxed
JP Morgan
Add to my slides
Remove from favorites
Simple slide design with key points and statistical icons, offering a straightforward visual structure that emphasizes the future landscape of energy technology.
Strategic Planning
Energy & Utilities
Addresses the strategic implications of renewable energy, sustainable fuels, nuclear fusion, and energy storage for the future of clean energy.
renewable energy, sustainable fuels, nuclear fusion, energy storage, strategy, clean energy, growth, investment, technology
false
Strategic Planning
Energy & Utilities
Header Horizontal
McKinsey
Add to my slides
Remove from favorites
The slide contains a column chart on the right showing the proportion of companies setting renewable energy targets by region.
Strategic Planning
Environmental Services & Sustainability
The slide discusses the adoption of renewable energy targets by companies as part of their broader net zero strategies, with regional breakdowns.
renewable energy, targets, net zero, overall sample, Europe, North America, rest of world, public targets
false
Strategic Planning
Environmental Services & Sustainability
Mixed Chart
Accenture
Add to my slides
Remove from favorites
This slide displays a series of bar graphs illustrating the potential increase in tax credit bonuses for renewable investments, categorized by conditions like domestic content and community impact.
Market Analysis and Trends
Energy & Utilities
Details the tax credit structure for renewable energy investments under new legislative acts, focusing on how bonuses can enhance base incentives. Useful for discussions on fiscal incentives and their impact on clean energy investments.
renewable energy, tax credits, investment cost, fiscal policy
false
Market Analysis and Trends
Energy & Utilities
Mixed Chart
BCG
Add to my slides
Remove from favorites
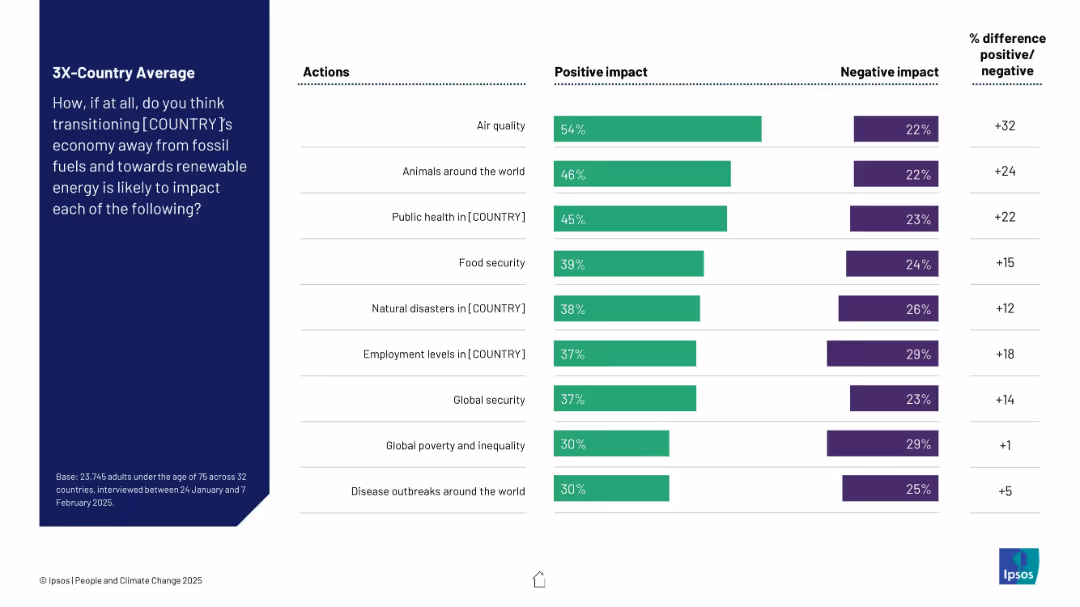
Tabular bar chart layout showing positive vs. negative impacts of transitioning away from fossil fuels across 9 domains. Right column quantifies net positivity.
Technology and Digital Transformation
Environmental Services & Sustainability
This slide presents average perceptions across 32 countries regarding the impact of moving from fossil fuels to renewables. Key areas assessed include air quality, health, employment, and disasters. Most respondents expect positive outcomes, especially for air quality.
renewable energy, transition, perception, fossil fuels, air quality, employment, public health, Ipsos, survey
false
Technology and Digital Transformation
Environmental Services & Sustainability
Mixed Chart
IPSOS
Add to my slides
Remove from favorites
Bar chart comparing LCOE of new renewable projects with marginal cost of operating existing conventional plants; includes subsidy impacts.
Strategic Planning
Energy & Utilities
Shows that new renewable projects are often cheaper than continuing to operate existing fossil plants, especially when subsidies are considered, underscoring the financial case for clean energy transition.
renewable, marginal cost, conventional energy, LCOE, transition, subsidies, solar, wind
false
Strategic Planning
Energy & Utilities
Single Chart
Roland Berger
Add to my slides
Remove from favorites
Slide includes bar charts depicting investment amounts in sectors like renewables and built environment, alongside icons and minimal text.
Market Analysis and Trends
Environmental Services & Sustainability
Discusses major investments in renewables by corporates, highlighting specific projects and investment amounts.
renewables, corporate investment, solar energy, built environment
false
Market Analysis and Trends
Environmental Services & Sustainability
Mixed Chart
Bain
Add to my slides
Remove from favorites
The slide includes a column chart showing the change in global electricity generation mix (TWh) from 2022 to 2050, with projections for Coal, Gas, Solar, Wind, Hydro, Nuclear, and Others. It also has a textual highlight indicating a fivefold increase in renewable capacity by 2050.
Market Analysis and Trends
Energy & Utilities
The slide projects that renewables will dominate global energy generation by 2050, highlighting the significant growth in solar and wind power. It provides a detailed forecast of the shift from nonrenewable to renewable energy sources over the next few decades.
Renewables, Energy, Generation, Global, Forecast, 2050, Solar, Wind
false
Market Analysis and Trends
Energy & Utilities
Mixed Chart
EY
Add to my slides
Remove from favorites
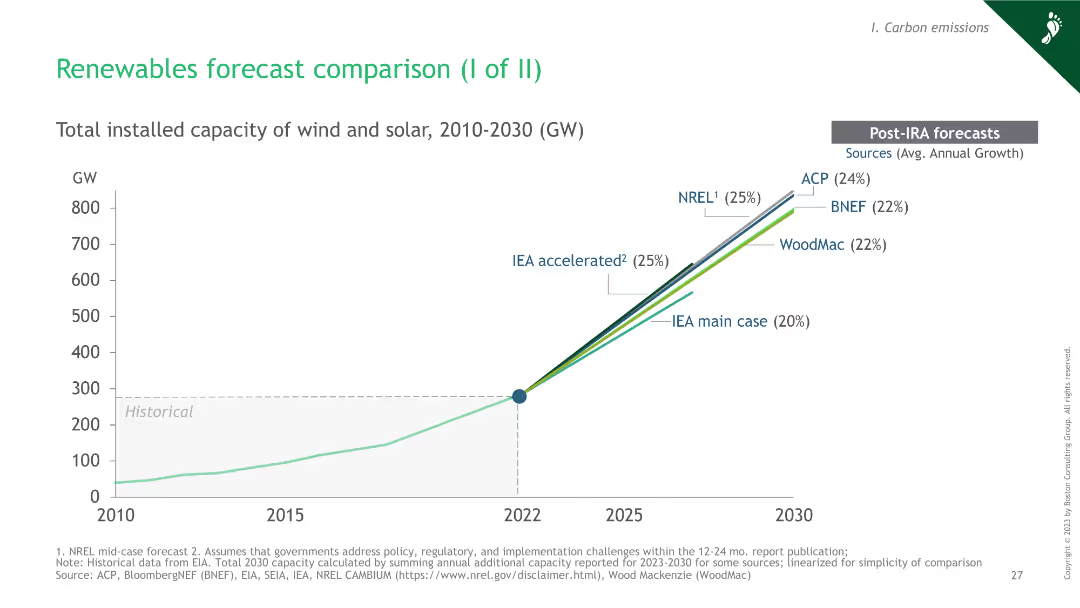
Line chart showing total installed capacity of wind and solar from 2010 to 2030, with multiple forecast lines from different sources post-IRA. Includes a legend for the forecast sources.
Market Analysis and Trends
Energy & Utilities
This slide compares the forecasts of total installed wind and solar capacity from various sources. It's used to visualize trends and predictions in renewable energy growth up to 2030.
renewables, forecast, wind, solar, capacity, growth, 2030, trends, energy
false
Market Analysis and Trends
Energy & Utilities
Single Chart
BCG
Add to my slides
Remove from favorites
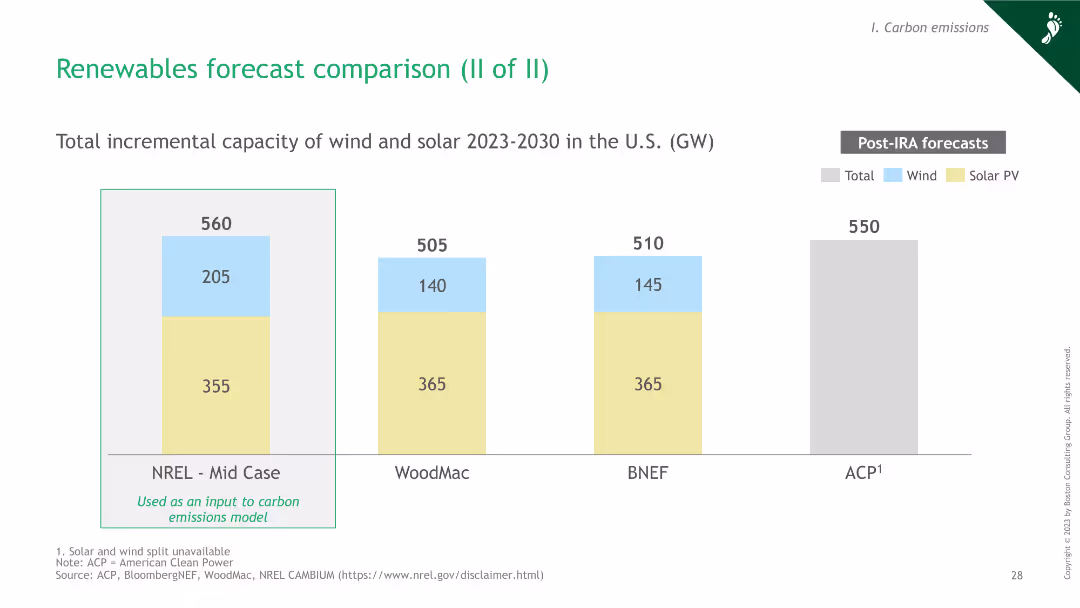
Column chart showing total incremental capacity of wind and solar in the U.S. from 2023 to 2030 by different sources. Divided into total, wind, and solar PV components.
Market Analysis and Trends
Energy & Utilities
This slide presents the forecasted incremental capacity of wind and solar in the U.S. from 2023 to 2030. It compares projections from different sources for informed decision-making.
renewables, forecast, wind, solar, capacity, U.S., incremental, 2030, trends
false
Market Analysis and Trends
Energy & Utilities
Single Chart
BCG
Add to my slides
Remove from favorites
The slide features a table comparing the share of coal and gas in power generation across various countries and the tipping points for renewables becoming cheaper.
Market Analysis and Trends
Energy & Utilities
The slide discusses the cost-competitiveness of renewable energy compared to fossil fuels, showing when renewables will become cheaper in different regions.
renewables, fossil fuels, cost-competitive, tipping points, energy
false
Market Analysis and Trends
Energy & Utilities
Mixed Chart
McKinsey
Add to my slides
Remove from favorites
Rich in data visualizations, the slide presents a strategic overview of investing in renewables, outlining steps to enhance market accessibility and financing.
Strategic Planning
Energy & Utilities
Strategic steps to scale investment in renewables through extended incentives and market structure improvements.
renewables, investment scaling, market structure, strategic planning, green financing
false
Strategic Planning
Energy & Utilities
Header Horizontal
Bain
Add to my slides
Remove from favorites
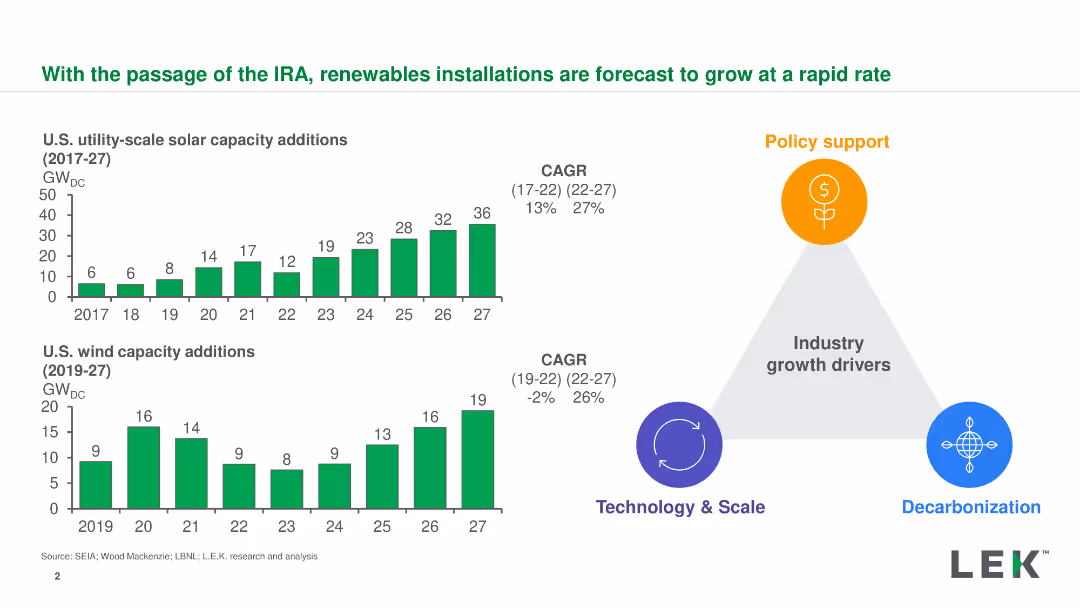
Column charts showing solar and wind capacity additions, with a diagram highlighting growth drivers
Market Analysis and Trends
Energy & Utilities
Forecasts the growth of renewable installations in the U.S. driven by the IRA, focusing on solar and wind energy
renewables, IRA, solar capacity, wind capacity, growth forecast
false
Market Analysis and Trends
Energy & Utilities
Multiple Chart
LEK
Add to my slides
Remove from favorites
The slide features a line chart comparing the share of nonrenewables and renewables in global power generation from 2000 to 2050. Additional information about accelerators and risks associated with this transition is provided on the side.
Market Analysis and Trends
Energy & Utilities
This slide highlights the increasing share of renewable energy in global power generation, predicting that by 2050, renewables will surpass nonrenewables significantly. It also discusses various factors that will accelerate or hinder this transition.
Renewables, Power, Generation, Transition, Forecast, Accelerators, Risks
false
Market Analysis and Trends
Energy & Utilities
Mixed Chart
EY
Add to my slides
Remove from favorites
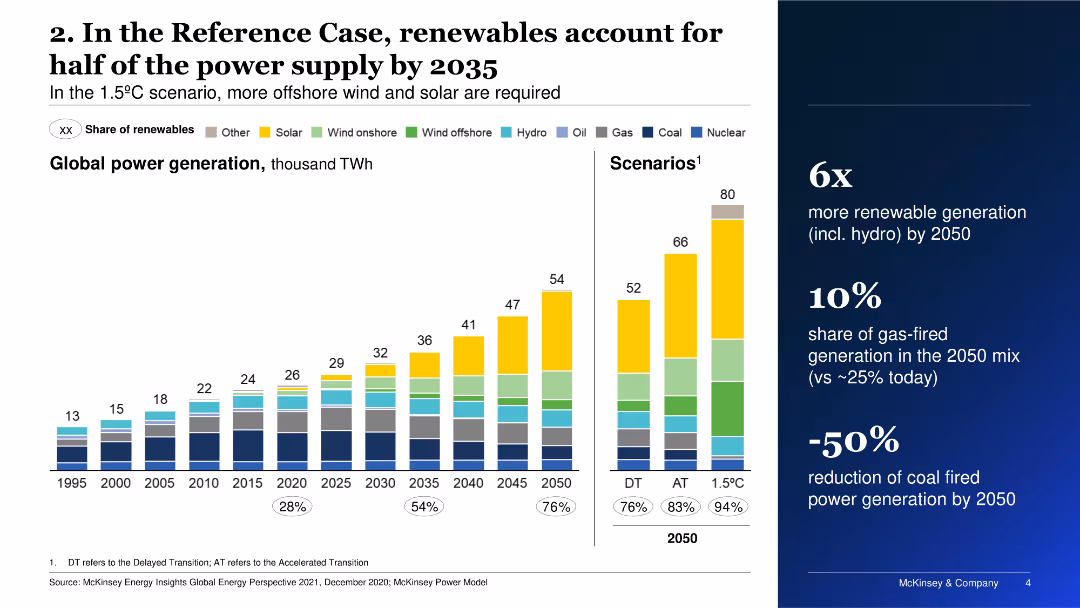
The slide has a column chart showing the share of renewables in global power generation from 1995 to 2050, with different scenarios highlighted on the right.
Market Analysis and Trends
Energy & Utilities
The slide projects the growth of renewable energy in power generation, emphasizing the increase in wind and solar power.
renewables, power supply, energy, wind, solar, 2035
false
Market Analysis and Trends
Energy & Utilities
Mixed Chart
McKinsey
Add to my slides
Remove from favorites
Slide includes a horizontal timeline from Q3 2022 to future steps with circular milestones. Various initiatives like RD plant commissioning and SAF monetization are mapped across the timeline. Below, a bulleted list discusses next steps for Montana Renewables.
Financial Performance
Energy & Utilities
This slide presents a timeline of key initiatives and future steps for Montana Renewables, focusing on financial and strategic planning in energy. It illustrates milestones like the commissioning of new plants and the monetization of SAF.
renewables, strategy, financial, timeline, energy, monetization, planning, hydrogen, SAF
false
Financial Performance
Energy & Utilities
Linear Flow
Barclays
Add to my slides
Remove from favorites
Displays graphs comparing electricity prices with renewable installation rates across different countries, alongside a curve comparing LCOE and VALCOE for solar and coal.
Market Analysis and Trends
Energy & Utilities
Analyzes the economic implications and system costs of integrating renewables at scale in Southeast Asia, emphasizing the need for clear policies and financial models to support the transition without imposing undue costs on consumers.
renewables, system costs, LCOE, VALCOE, financial analysis
false
Market Analysis and Trends
Energy & Utilities
Multiple Chart
Bain
Add to my slides
Remove from favorites
The slide presents a timeline from 1991 to 2018, showing key milestones in renewable and heavy lifting sectors, accompanied by icons like wind turbines and gears, which add context to each entry.
Industry Overview
Energy & Utilities
The slide outlines the company's history and growth in the renewables sector, highlighting major projects and acquisitions, aiming to establish credibility and experience in the industry.
renewables, timeline, growth, projects, acquisitions
false
Industry Overview
Energy & Utilities
Linear Flow
Barclays
Add to my slides
Remove from favorites
Displays a map of Japan with highlighted areas showing average wind speeds and sea depths. Text on the left and center provides specific wind speed and sea depth data for two locations. The dark background map contrasts with highlighted data points and textual information.
Market Analysis and Trends
Environmental Services & Sustainability
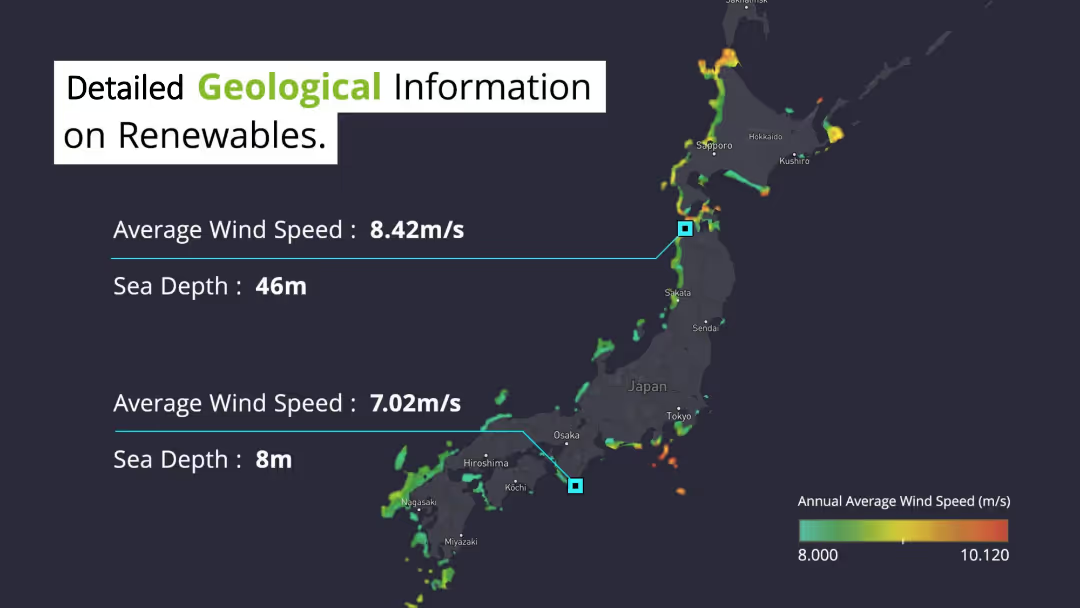
Shares detailed geological data on renewable energy potential in Japan, focusing on average wind speeds and sea depths in various regions. This information is crucial for planning and optimizing renewable energy projects, particularly offshore wind farms.
Renewable, Wind Speed, Sea Depth, Japan, Geological
false
Market Analysis and Trends
Environmental Services & Sustainability
Graphic
Deloitte
Add to my slides
Remove from favorites
A column chart showing the average monthly rent (EUR/sqm) for different cities, with a text summary of rental market trends.
Market Analysis and Trends
Real Estate & Construction
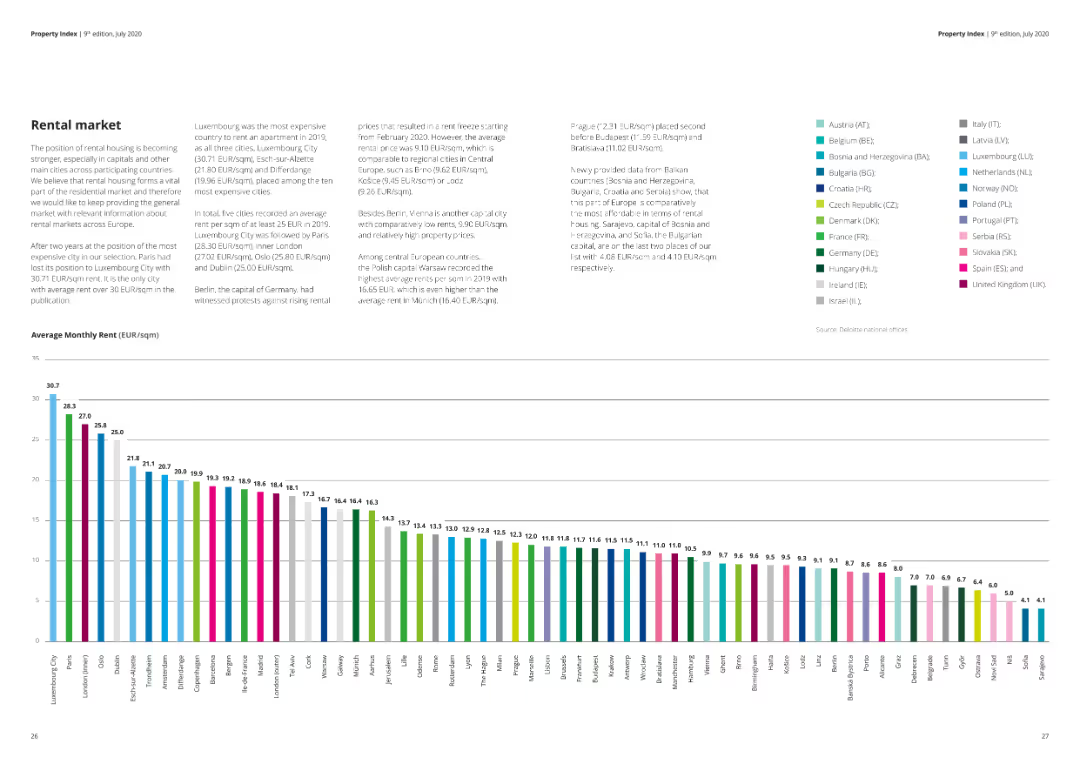
The slide details the average monthly rent prices in various cities, offering insights into the rental market across different regions.
rental market, average rent, EUR/sqm, city comparison, market trends, real estate
false
Market Analysis and Trends
Real Estate & Construction
Mixed Chart
Deloitte
Add to my slides
Remove from favorites
Side-by-side line charts compare consumer spending and employment trends indexed to Jan 2020, with one line for states that reopened and another for those that did not. Minimalist layout with clear labeling.
Operational Efficiency
Government & Public Sector
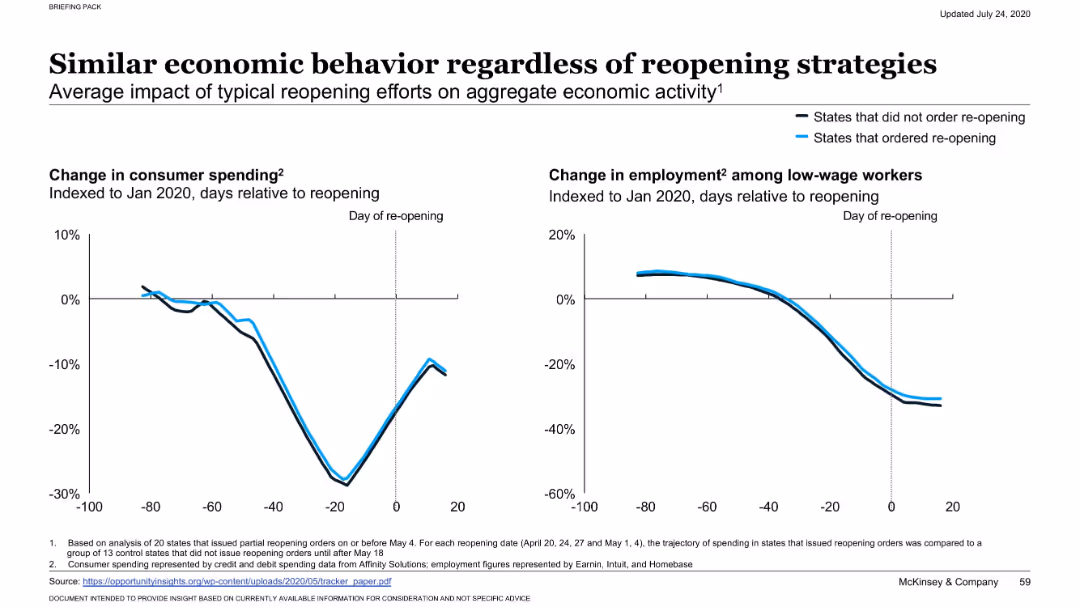
Analyzes the impact of reopening strategies on economic activity in US states. It finds minimal difference in consumer spending and employment between states that reopened early and those that did not, suggesting reopening had limited economic influence.
reopening impact, consumer spending, low-wage employment, economic behavior, state comparison, reopening strategies, COVID-19, indexed trend, mobility vs economy
false
Operational Efficiency
Government & Public Sector
Multiple Chart
McKinsey
Add to my slides
Remove from favorites
Features line charts comparing mobility and spending trends in states that reopened early versus late during the pandemic.
Risk Assessment and Management
Transportation & Logistics
Highlights the impact of early versus late reopening on state mobility and spending, suggesting greater variability in spending with earlier reopening schedules.
Reopening, Mobility, Spending, COVID-19, Variability
false
Risk Assessment and Management
Transportation & Logistics
Multiple Chart
McKinsey
Add to my slides
Remove from favorites
The slide has a green and white color scheme and presents a matrix showing reasons against repairing different types of e-waste. It uses red and orange circles to indicate various reasons such as cost, lack of repair options, and effort, across items like washing machines and mobile phones.
Market Analysis and Trends
Environmental Services & Sustainability
This slide outlines solvable reasons why people avoid repairing e-waste items, such as high costs and lack of repair options. It uses a matrix to show the prevalence of each reason for different items, advocating for solutions to these barriers.
repair, e-waste, barriers, reasons, solutions
false
Market Analysis and Trends
Environmental Services & Sustainability
Table
Oliver Wyman
Add to my slides
Remove from favorites
The slide uses a green and white color scheme with a table showing the percentages of respondents who repaired various items in Germany, France, and the UK. It includes icons for items like washing machines and mobile phones, with the highest and lowest repair rates indicated in different colors.
Market Analysis and Trends
Environmental Services & Sustainability
This slide indicates that the percentage of repaired goods is low across different products, with a focus on comparisons among Germany, France, and the UK, suggesting the impact of initiatives like the Green Deal in France.
repair, e-waste, products, survey, international
false
Market Analysis and Trends
Environmental Services & Sustainability
Multiple Chart
Oliver Wyman
Add to my slides
Remove from favorites
The slide, duplicating slide 956, has a simple text-based agenda with blue accents, clearly indicating the structure of the presentation on agriculture industry themes.
Investment Analysis
Agriculture & Food Production
This agenda slide reiterates the primary topics to be addressed, focusing on agriculture industry overviews and crop market investment themes.
repeat, agenda, presentation structure, agriculture, market investment, industry themes
false
Investment Analysis
Agriculture & Food Production
Agenda
EY
Add to my slides
Remove from favorites
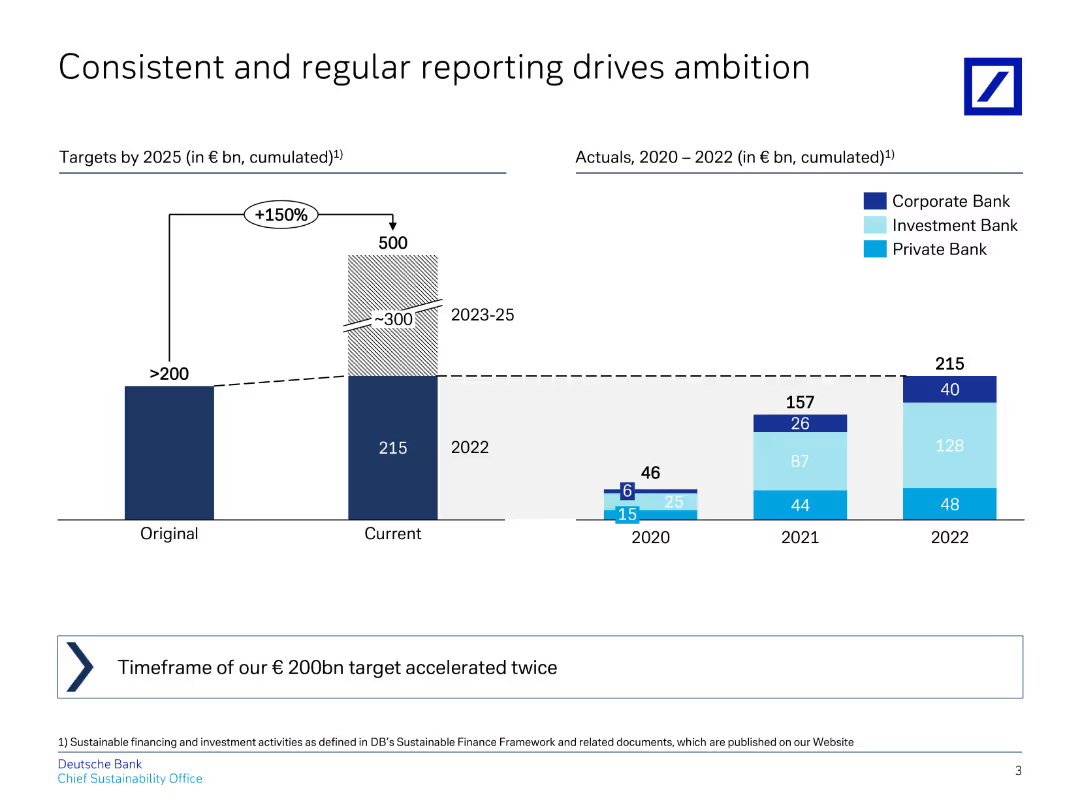
The slide includes a column chart showing target vs. actual financial metrics for Deutsche Bank, highlighting the importance of consistent and regular reporting.
Strategic Planning
Financial Services
It emphasizes the importance of regular reporting in achieving financial targets, showing past targets and actual achievements to stress the importance of reporting.
reporting, targets, actuals, financial metrics, Deutsche Bank
false
Strategic Planning
Financial Services
Multiple Chart
Deutsche Bank
Add to my slides
Remove from favorites
The slide combines column charts with an image to show representation by groups within BCG X + other specialty business units, comparing race and gender for the years 2021, 2022, and 2023.
Customer and Market Segmentation
Professional Services
The slide provides a detailed look at the representation of different races and genders within BCG X and other specialty business units over three years.
representation, BCG X, specialty units, race, gender
false
Customer and Market Segmentation
Professional Services
Multiple Chart
BCG
Add to my slides
Remove from favorites
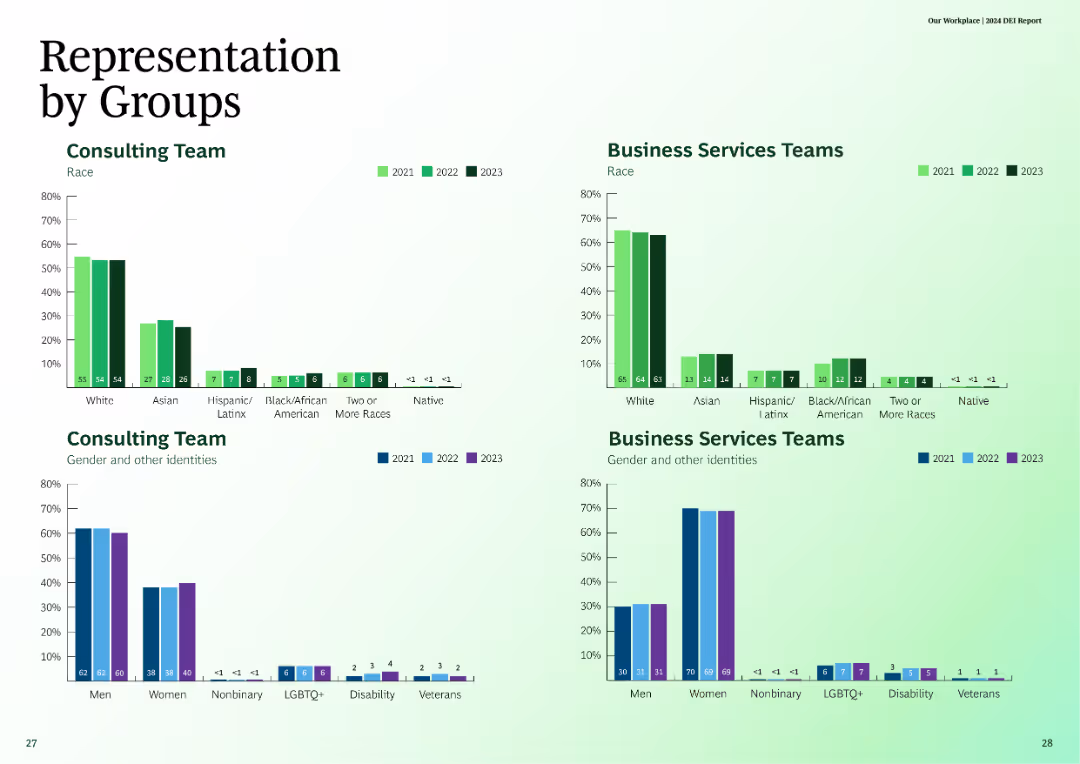
The slide features column charts depicting representation by groups, comparing consulting teams and business services teams across different races and identities for the years 2021, 2022, and 2023.
Customer and Market Segmentation
Professional Services
The slide compares the representation of various races and identities within consulting and business services teams over three years.
representation, consulting, business services, race, identity
false
Customer and Market Segmentation
Professional Services
Multiple Chart
BCG
Add to my slides
Remove from favorites
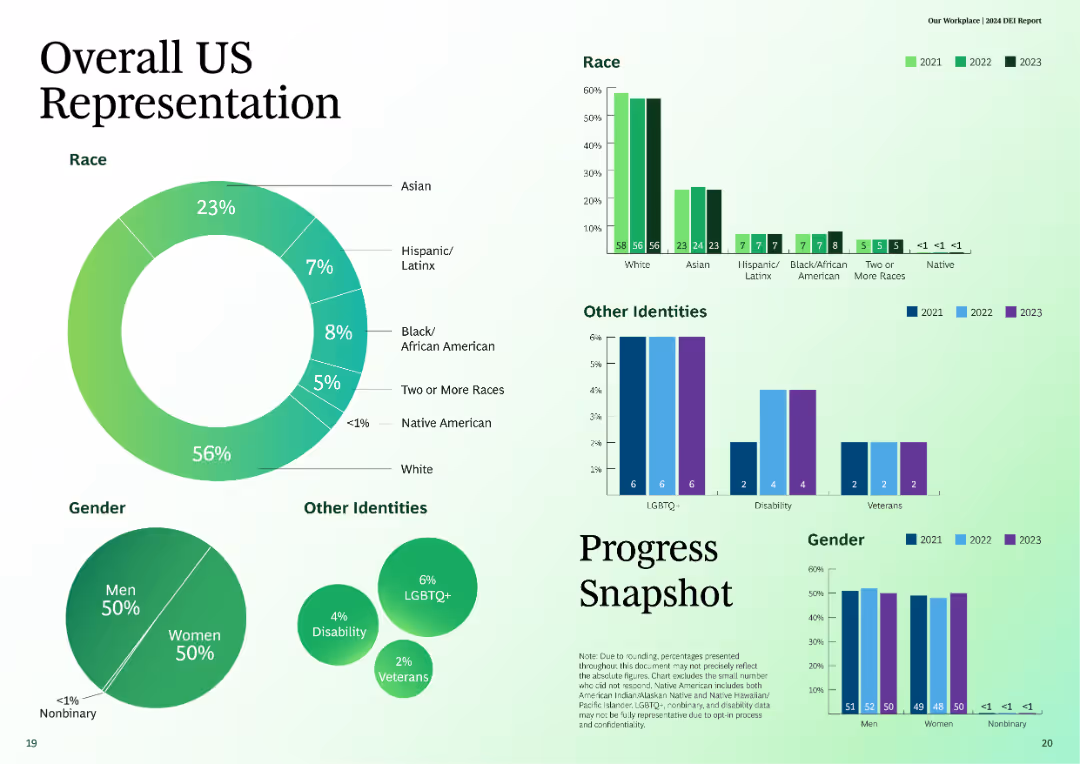
This slide features multiple charts, including a pie chart, bar charts, and column charts, displaying demographic data for race, gender, and other identities.
Customer and Market Segmentation
Professional Services
The slide presents a snapshot of overall US representation in terms of race, gender, and other identities over the years 2021, 2022, and 2023.
representation, demographics, race, gender, diversity
false
Customer and Market Segmentation
Professional Services
Multiple Chart
BCG
Add to my slides
Remove from favorites
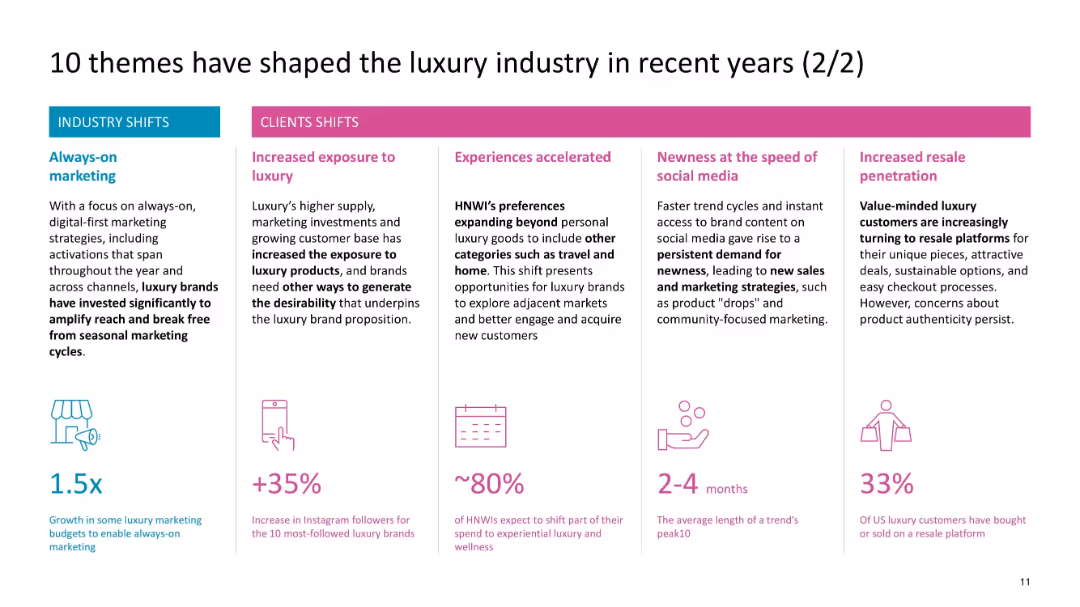
Horizontal layout with five themed boxes on client shifts
Customer and Market Segmentation
Consumer Goods
This slide outlines five client-side changes such as increased exposure, resale growth, always-on marketing, and faster trend cycles via social media.
resale, social media, client behavior, trend cycles, Instagram growth, marketing strategy
false
Customer and Market Segmentation
Consumer Goods
Pillar
McKinsey
Add to my slides
Remove from favorites
Contains multiple text boxes and images showing products and customer reviews. Graphics include star ratings and customer testimonials highlighting product quality.
Financial Performance
Consumer Goods
Discusses the importance of research and innovation in L'Oréal's business, with a focus on researcher numbers, budget allocation, and the success reflected through positive customer reviews.
research and innovation, customer reviews, product quality, L'Oréal
false
Financial Performance
Consumer Goods
Multiple Chart
Deutsche Bank
Add to my slides
Remove from favorites
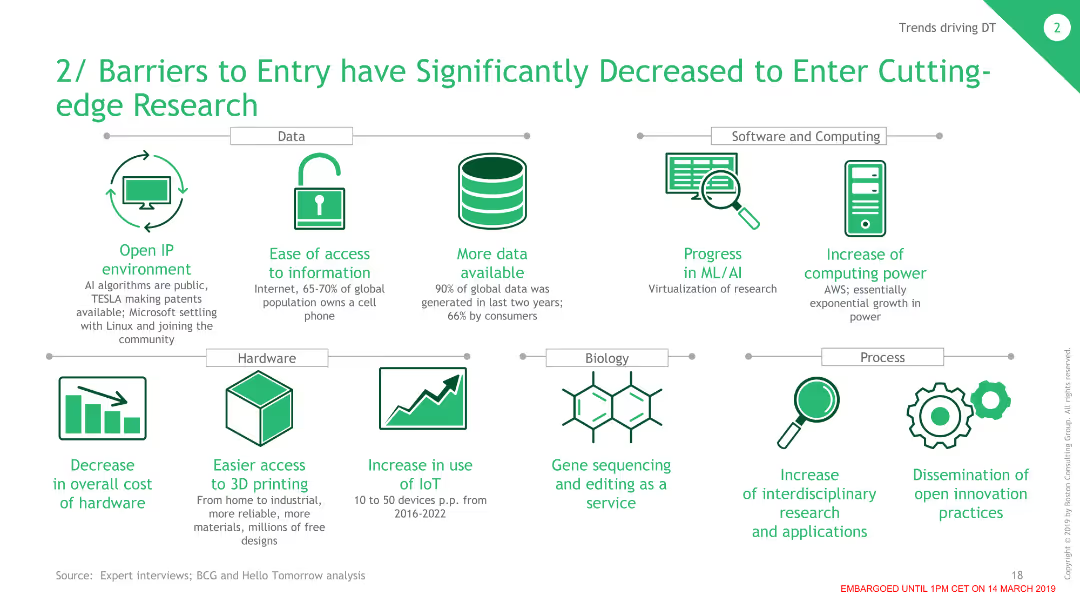
The slide features multiple icons and short texts arranged in three rows, each representing different aspects such as data, hardware, and process that have reduced barriers to entry in research.
Regulatory and Compliance
Technology & Software
This slide discusses the various factors that have lowered the barriers to entry in cutting-edge research, including open IP environments, increased access to information, and more affordable hardware.
Research, Barriers, Data, Hardware, Innovation
false
Regulatory and Compliance
Technology & Software
Header Vertical
BCG
Add to my slides
Remove from favorites
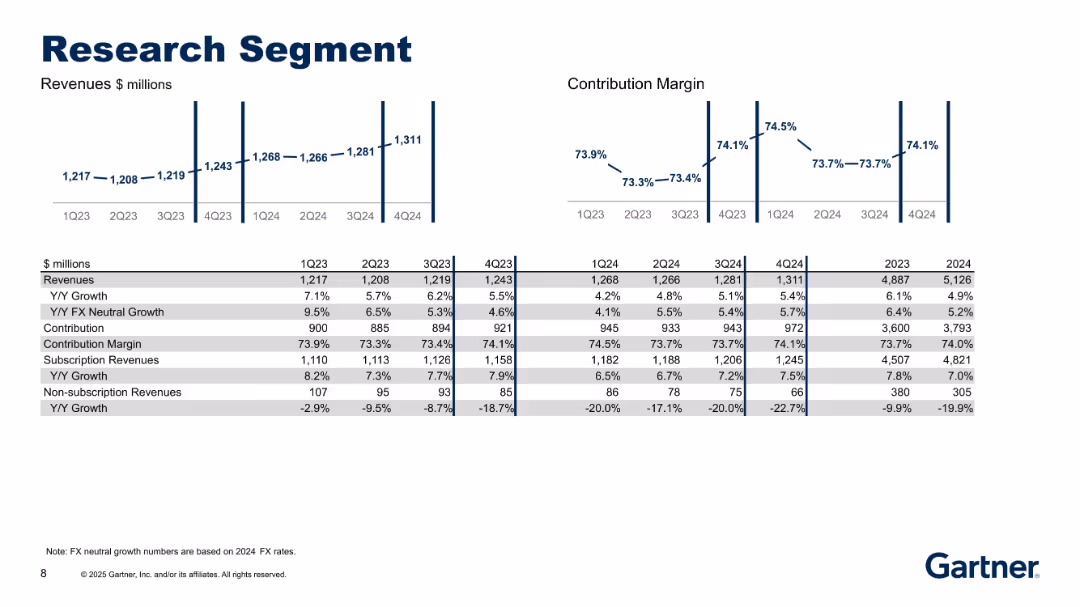
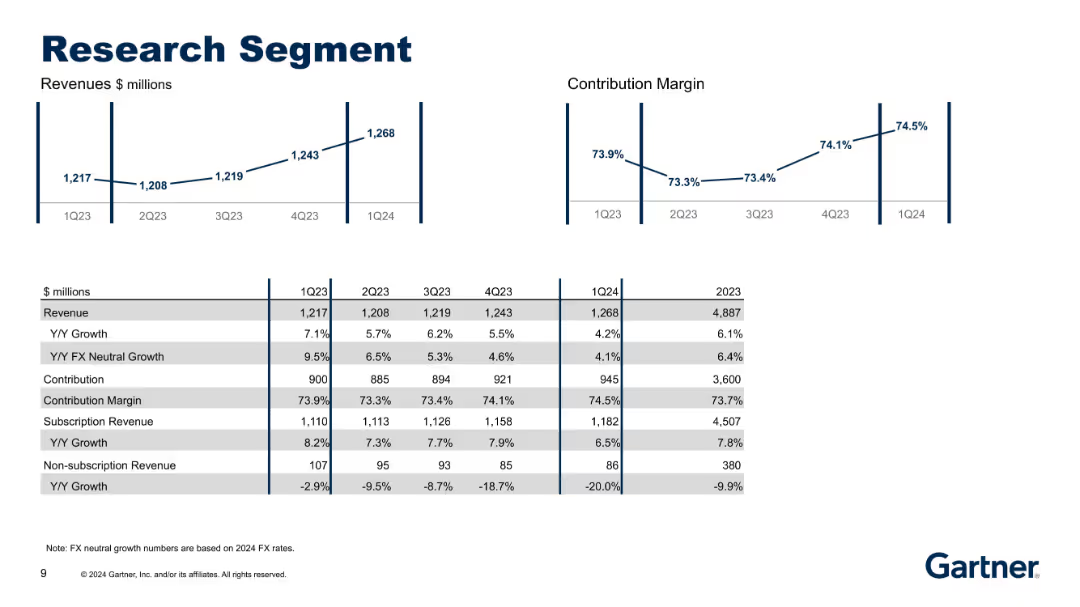
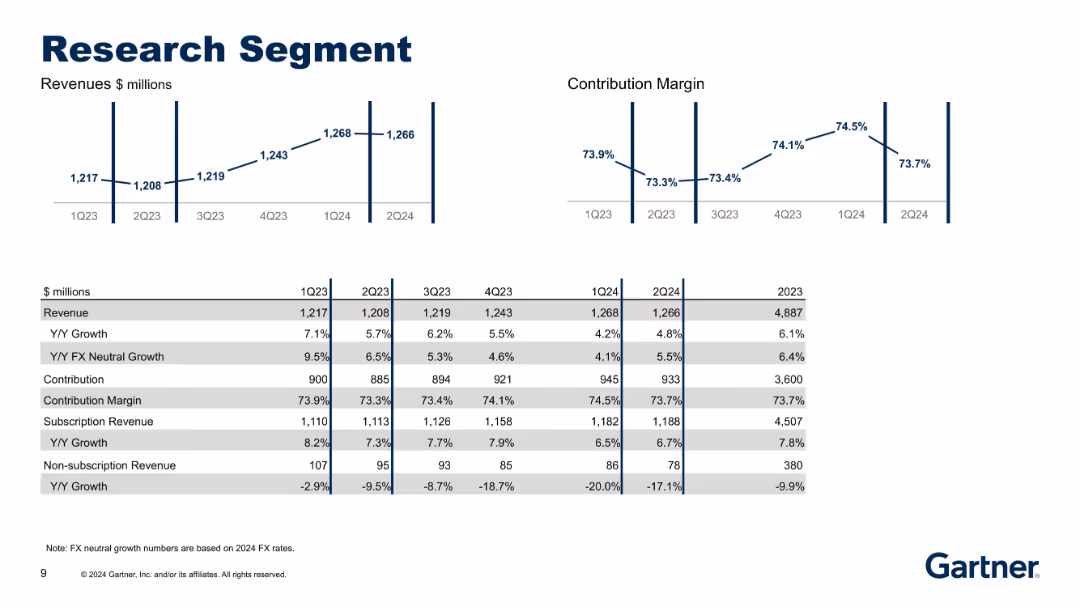
Two line charts (Revenue and Contribution Margin) above a detailed data table. Clean, grid-aligned layout. Data spans 1Q23–4Q24 with YoY and FX-neutral growth.
Product and Service Analysis
Technology & Software
Displays financial performance and metrics for the Research segment including subscription vs. non-subscription revenue, margins, and YoY growth. Emphasizes consistency and profitability in Gartner’s core research offerings.
research, contribution margin, FX neutral, subscription revenue, YoY
false
Product and Service Analysis
Technology & Software
Multiple Chart
Gartner
Add to my slides
Remove from favorites
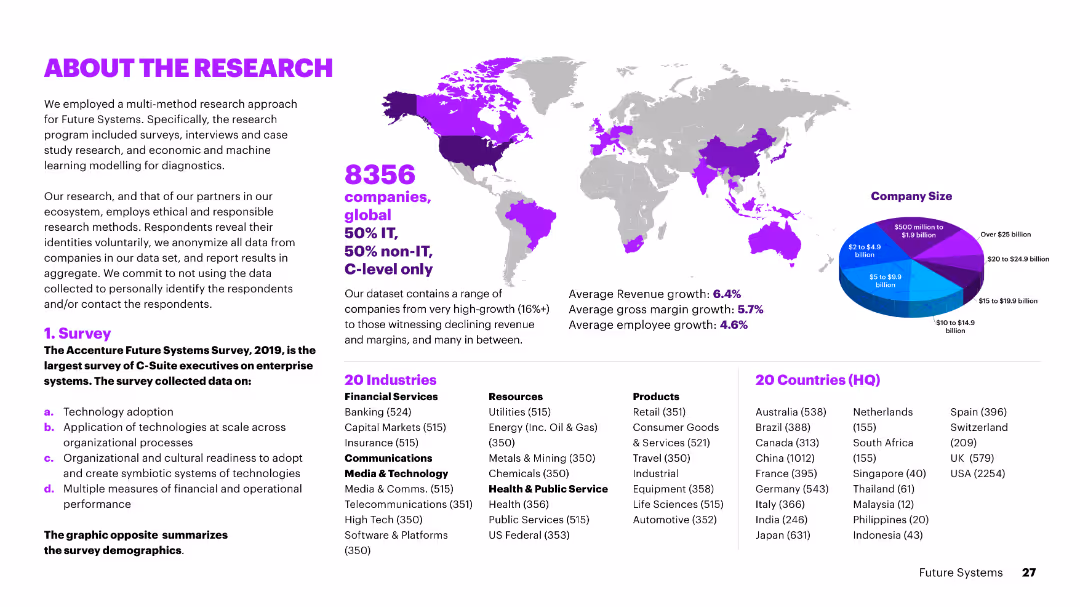
A content slide summarizing research methodology and demographics. Includes a map showing the distribution of respondents by region and a bar chart showing the industry and revenue breakdown of the sample.
Market Analysis and Trends
Professional Services
This slide provides an overview of the research conducted, including survey demographics, regional distribution, and industry and revenue breakdown of the participants.
research, demographics, industry breakdown, revenue, survey
false
Market Analysis and Trends
Professional Services
Mixed Chart
Accenture
Add to my slides
Remove from favorites
The slide includes pie charts representing industry distribution, job levels, and organizational sizes among research participants in Ukraine. The design is clean with well-labeled sections for clarity.
Market Analysis and Trends
Professional Services
This slide provides demographic and market analysis data of research participants in Ukraine, breaking down their distribution across various industries, job levels, and organizational sizes. It offers insights into the sample's composition, useful for contextualizing the study’s findings within specific sectors and job roles.
Research, Demographics, Ukraine, Industry, Job Levels
false
Market Analysis and Trends
Professional Services
Multiple Chart
Deloitte
Add to my slides
Remove from favorites
This slide includes circular graphics representing different research areas, accompanied by brief descriptions, numerical data, and background images. The layout is spacious and organized.
Industry Overview
Professional Services
It showcases the breadth of McKinsey's research via their Global Institute, highlighting key areas of focus like growth and competition, financial markets, consumer behavior, and technology. It emphasizes McKinsey's contribution to thought leadership in various sectors.
Research, Economics, McKinsey Global Institute, Consumer Behavior, Technology, Sustainability
false
Industry Overview
Professional Services
Diagram
McKinsey
Add to my slides
Remove from favorites
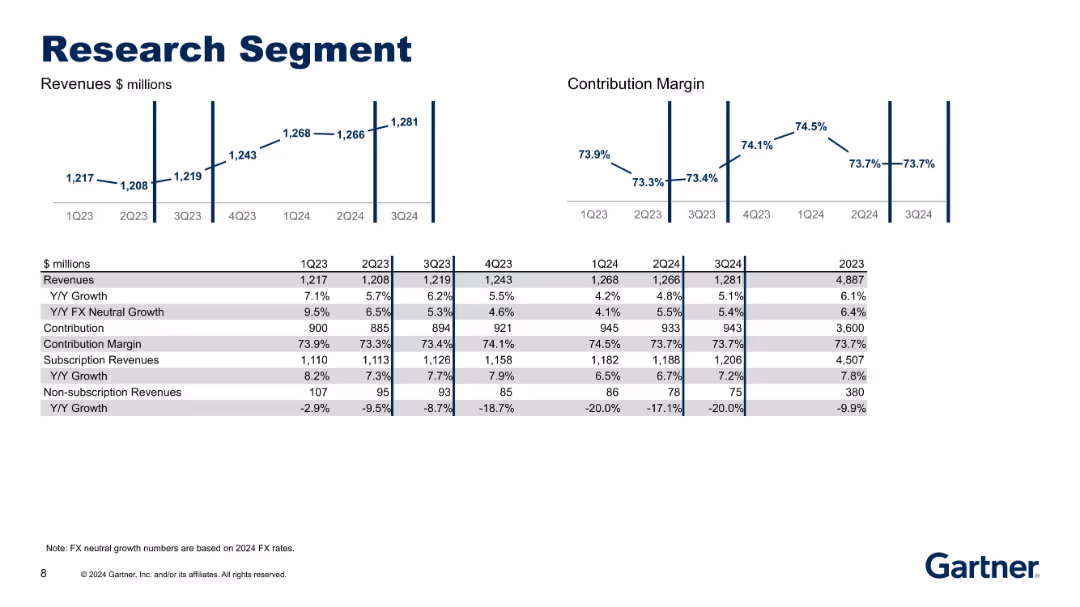
Duplicate of slide 18622 but updated to Q3 2024. Same format with revenue and margin charts and a table below showing updated financial data.
Product and Service Analysis
Technology & Software
Updated financial performance and KPIs for the Research segment. Reflects most recent data to aid in performance tracking and strategic decisions related to subscription and non-subscription services.
research, FX neutral, margin, subscription, financial update
false
Product and Service Analysis
Technology & Software
Multiple Chart
Gartner
Add to my slides
Remove from favorites
The slide has a basic visual complexity, displaying textual information about the contents of a research report, along with icons representing different themes covered. The layout is straightforward, with a clear focus on the textual message and a simple graphic element to the side.
Human Resources and Talent Management
Professional Services
This slide serves as a summary and call-to-action, inviting viewers to explore a report that covers gender-inclusive mobility and provides insights and case studies on the topic. It's aimed at encouraging further exploration into organizational practices and the experiences of female role models in international assignments.
Research, Gender inclusivity, Case studies, Organizational practices
false
Human Resources and Talent Management
Professional Services
Boxed
PwC/Strategy&
Add to my slides
Remove from favorites
This slide features pie charts showing the distribution of research participants globally across different industries and job levels. The layout is straightforward, focusing on the data.
Market Analysis and Trends
Professional Services
This slide details the demographic and market analysis of global research participants, categorizing them by industry, job level, and organizational size. It provides a comprehensive view of the participant pool, aiding in understanding the global scope of the research and its relevance across different sectors and professional standings.
Research, Global, Demographics, Industry, Job Levels
false
Market Analysis and Trends
Professional Services
Multiple Chart
Deloitte
Add to my slides
Remove from favorites
The slide includes text, a world map, and a pie chart showing company size distribution. It provides an overview of the research methodology and demographics.
Market Analysis and Trends
Technology & Software
The slide details the research methodology, demographics, and industry focus of the surveyed companies, highlighting key statistics and geographic distribution.
research, methodology, demographics, market analysis, trends, company size, technology
false
Market Analysis and Trends
Technology & Software
Mixed Chart
Accenture
Add to my slides
Remove from favorites
This slide features a column chart showing the distribution of surveyed companies by industry and a world map highlighting the locations of the respondents. It also includes a pie chart depicting revenue segments.
Industry Overview
Technology & Software
The slide provides an overview of the research methodology, including details on the industries surveyed, geographic distribution, and revenue categories of the participating companies.
research methodology, survey data, industry distribution, revenue segments, geographic distribution
false
Industry Overview
Technology & Software
Mixed Chart
Accenture
Add to my slides
Remove from favorites
The slide features a bar chart comparing various research methods (tracking, focus groups, strategic, positioning, copy testing) used by winners, finalists, and those with no award. Bars are vertically oriented.
Market Analysis and Trends
Media & Entertainment
This slide highlights the importance of research methods like tracking and focus groups, showing their prevalence among award winners compared to finalists and non-award recipients.
research methods, tracking, focus groups, bar chart, award winners
false
Market Analysis and Trends
Media & Entertainment
Single Chart
IPSOS
Add to my slides
Remove from favorites
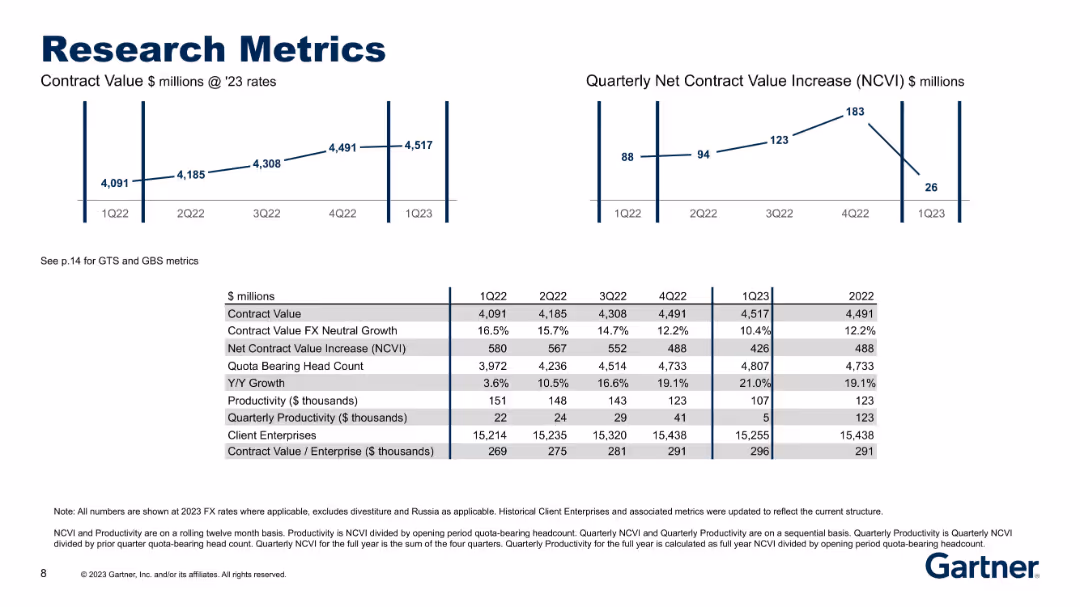
This slide includes a table with various metrics and two line charts showing contract value and quarterly net contract value increase.
Market Analysis and Trends
Technology & Software
It presents detailed research metrics, including contract value, net contract value increase, productivity, and client enterprises statistics.
Research, Metrics, Contract Value, Productivity, Client Enterprises, Net Increase
false
Market Analysis and Trends
Technology & Software
Multiple Chart
Gartner
Add to my slides
Remove from favorites
Two line charts (Contract Value, NCVI) on top; a detailed table below outlines headcount, productivity, client enterprise data, and growth rates.
Performance Metrics and KPIs
Technology & Software
Highlights operational and sales-related research metrics including contract value trends, net contract value increase, headcount growth, and productivity. Offers detailed insight into drivers behind research revenue performance.
research metrics, NCVI, headcount, productivity, contract value, growth
false
Performance Metrics and KPIs
Technology & Software
Multiple Chart
Gartner
Add to my slides
Remove from favorites
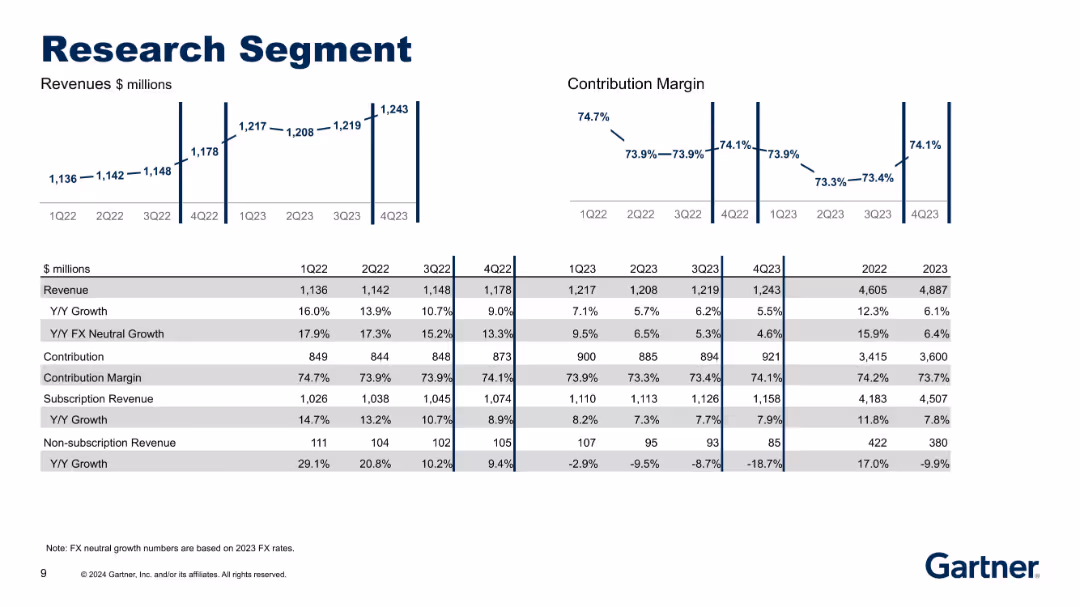
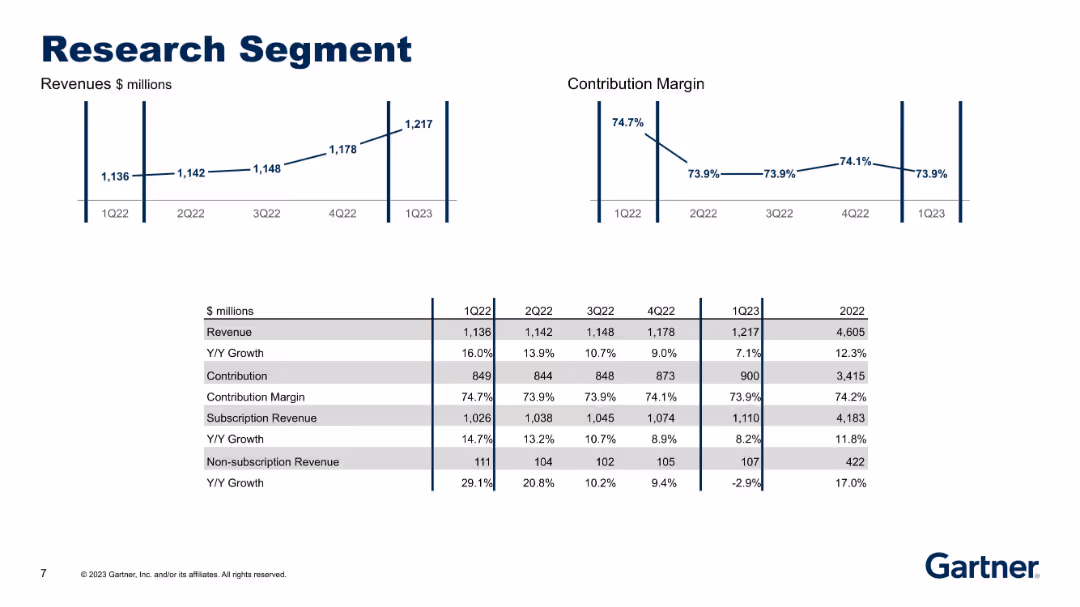
Bar and line charts with tabular financial data; left side features revenue metrics while the right shows contribution margin trends.
Performance Metrics and KPIs
Technology & Software
This slide breaks down the Research segment's quarterly and yearly revenue, contribution, and margin metrics from 1Q22 to 4Q23. It highlights stable growth in subscription revenues with declining non-subscription revenue and presents FX-neutral metrics.
Research, Revenue, Contribution, FX Neutral Growth, Subscription
false
Performance Metrics and KPIs
Technology & Software
Multiple Chart
Gartner
Add to my slides
Remove from favorites
Two line charts (Revenue, Contribution Margin) above a detailed data table; simple vertical data layout with bold titles and alternating row shading.
Performance Metrics and KPIs
Technology & Software
Shows quarterly revenue and contribution margin performance for the Research segment, supported by metrics such as subscription/non-subscription revenue, Y/Y growth, and contribution figures. Visuals and tables provide granular insights into segment profitability and trends.
research, revenue, contribution margin, growth, KPIs, subscription
false
Performance Metrics and KPIs
Technology & Software
Multiple Chart
Gartner
Add to my slides
Remove from favorites
Charts showing revenue and contribution margins above a detailed table. Table includes growth metrics and breakdown into subscription categories.
Performance Metrics and KPIs
Technology & Software
Provides updated data for the Research segment through 2Q24. Tracks sustained subscription growth and contraction in non-subscription revenue, alongside steady contribution margins and FX-neutral growth.
Research, Revenue, Contribution Margin, Subscription, FX Growth
false
Performance Metrics and KPIs
Technology & Software
Multiple Chart
Gartner
Add to my slides
Remove from favorites
The slide combines a table and two line charts to show revenue and contribution margin trends over several quarters.
Market Analysis and Trends
Technology & Software
It details the performance of the research segment, including revenue, growth rates, contribution margins, and subscription revenue trends.
Research, Revenue, Contribution Margin, Subscription, Non-subscription, Growth
false
Market Analysis and Trends
Technology & Software
Multiple Chart
Gartner
Add to my slides
Remove from favorites
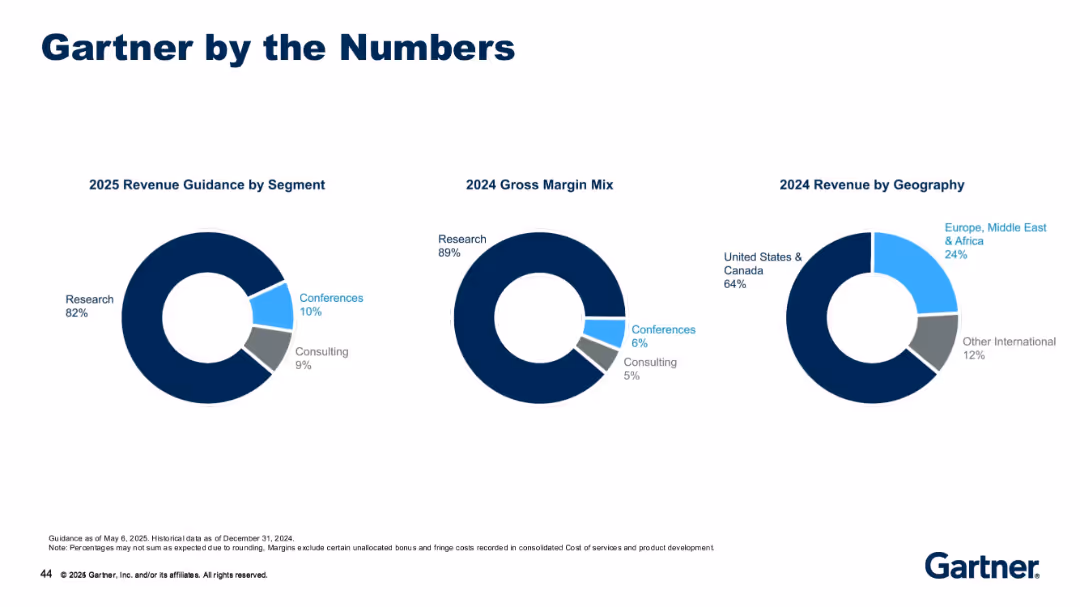
Three donut charts showing revenue by segment (2025), margin mix (2024), and revenue by geography (2024).
Strategic Planning
Technology & Software
This slide provides a high-level financial snapshot, showing the dominance of Research in revenue and margin mix, as well as U.S. and Canada as the major revenue sources. It illustrates Gartner’s business composition by segment/geography.
research, revenue mix, consulting, conferences, gross margin, geography, segment split, 2024, 2025
false
Strategic Planning
Technology & Software
Single Chart
Gartner
Add to my slides
Remove from favorites
Two line graphs (Revenue and Contribution Margin) and a comparison table for revenue, contribution, subscription performance over 5 quarters.
Performance Metrics and KPIs
Technology & Software
This slide focuses on financial details of the Research segment, including steady growth in revenue and margins over time. Subscription revenue trends and Y/Y growth rates are provided for both subscription and non-subscription income streams.
research, segment analysis, subscription revenue, contribution margin
false
Performance Metrics and KPIs
Technology & Software
Multiple Chart
Gartner
Add to my slides
Remove from favorites
Shows a bar chart with sources used for research before purchasing crypto assets, including friends, media, and advisors.
Market Analysis and Trends
Financial Services
The slide outlines the main sources Canadians rely on for researching crypto assets, such as friends, social media, financial press, and advisors, highlighting the varying reliance on these sources across different demographics.
Research sources, crypto assets, Canadians
false
Market Analysis and Trends
Financial Services
Multiple Chart
IPSOS
Add to my slides
Remove from favorites
The slide displays bar charts and column charts to show the various sources of information used by Canadians to research crypto assets before purchase, comparing data from 2023 and 2022.
Market Analysis and Trends
Financial Services
This slide identifies the different sources of information used by Canadians to research crypto assets before making a purchase, highlighting trends and changes in source usage from 2022 to 2023.
research sources, crypto assets, purchase, information, comparison
false
Market Analysis and Trends
Financial Services
Multiple Chart
IPSOS
Add to my slides
Remove from favorites
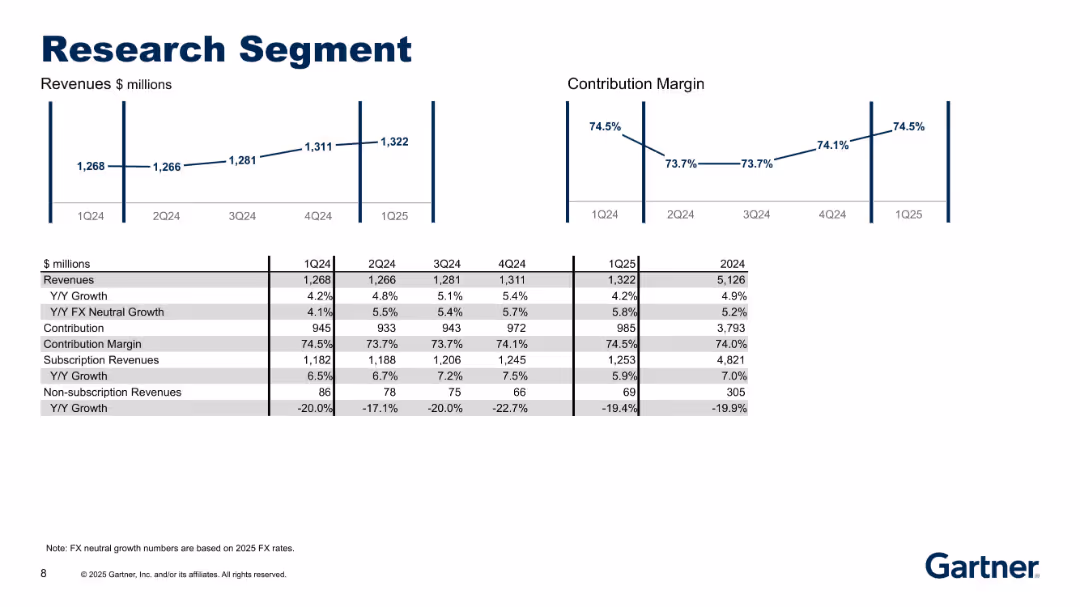
Line charts for revenues and margin, and detailed financial table covering 1Q24–1Q25 and full year 2024.
Performance Metrics and KPIs
Technology & Software
Detailed performance metrics for Gartner’s Research segment, including revenue growth (YoY), FX-neutral growth, subscription vs non-subscription splits, and contribution margins. Shows consistent growth and strong profitability.
research, subscription, revenue growth, margin, KPIs, FX neutral, contribution, segment analysis, Gartner
false
Performance Metrics and KPIs
Technology & Software
Multiple Chart
Gartner
Add to my slides
Remove from favorites
Slide features a column chart and annotations about reserve releases' impacts on Lloyd's financial health across segments.
Regulatory and Compliance
Financial Services
Explores the increase in reserve releases at Lloyd's, its impact by segment, and implications for financial stability and regulatory compliance.
Reserves, Financial, Compliance, Trends, Increase
false
Regulatory and Compliance
Financial Services
Mixed Chart
PwC/Strategy&
Add to my slides
Remove from favorites
Slide includes bar graphs showing a decrease in reserve strength and increased numbers of firms with "no margin".
Risk Assessment and Management
Financial Services
Discusses the declining margin within reserves at Lloyd's, emphasizing the potential risks and future implications for reserve releases and financial stability.
Reserves, Margin, Decline, Financial, Risk
false
Risk Assessment and Management
Financial Services
Mixed Chart
PwC/Strategy&
Add to my slides
Remove from favorites
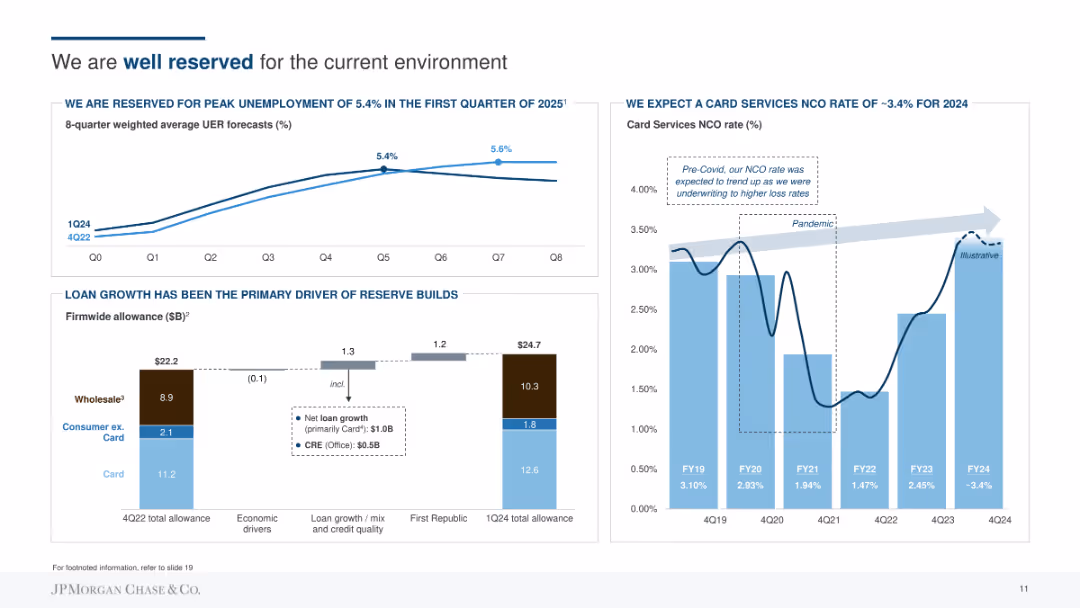
Combination of line chart showing unemployment rate forecasts, column chart for loan growth, and bar chart for card services NCO rate. Uses blue and gray tones to differentiate data sets.
Risk Assessment and Management
Financial Services
Discusses JP Morgan's preparedness for economic conditions, including expected peak unemployment, loan growth driving reserve builds, and projected card services NCO rate for 2024.
Reserve, Unemployment, Loan, Growth, Card, Economic, Forecast
false
Risk Assessment and Management
Financial Services
Multiple Chart
JP Morgan
Add to my slides
Remove from favorites
The slide shows two charts. The left chart presents the percentage of rented occupied housing units from 1Q00 to 1Q24. The right chart depicts investor market share by property type for the 50 most populous U.S. metro areas from 1Q00 to 1Q24.
Market Analysis and Trends
Real Estate & Construction
The slide analyzes trends in rented occupied housing units and investor market share across different property types in major U.S. metro areas, offering insights into the residential real estate market's dynamics and investment patterns.
residential real estate, rented housing, investor market share, property types, market trends
false
Market Analysis and Trends
Real Estate & Construction
Multiple Chart
JP Morgan
Add to my slides
Remove from favorites
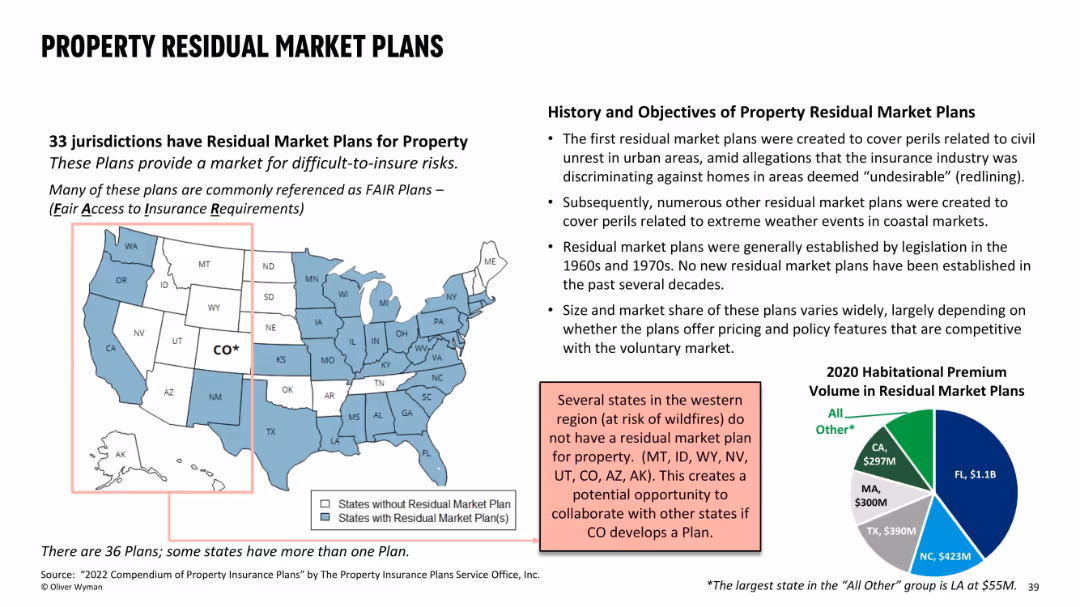
A US map showing states with and without residual market plans for property insurance, supplemented with textual and pie chart explanations. Blue and grey color scheme, bolded state labels, and callouts.
Regulatory and Compliance
Financial Services
This slide explains residual market plans (RMPs) for property insurance, emphasizing their role in covering difficult-to-insure risks. It highlights that 33 jurisdictions have RMPs and discusses the opportunity for Colorado to establish one, especially in wildfire-prone regions. A pie chart shows 2020 premium volumes by state.
residual market, insurance, FAIR plans, wildfire risk, coverage gaps, regulation, premium volume, US states
false
Regulatory and Compliance
Financial Services
Mixed Chart
Oliver Wyman
Add to my slides
Remove from favorites
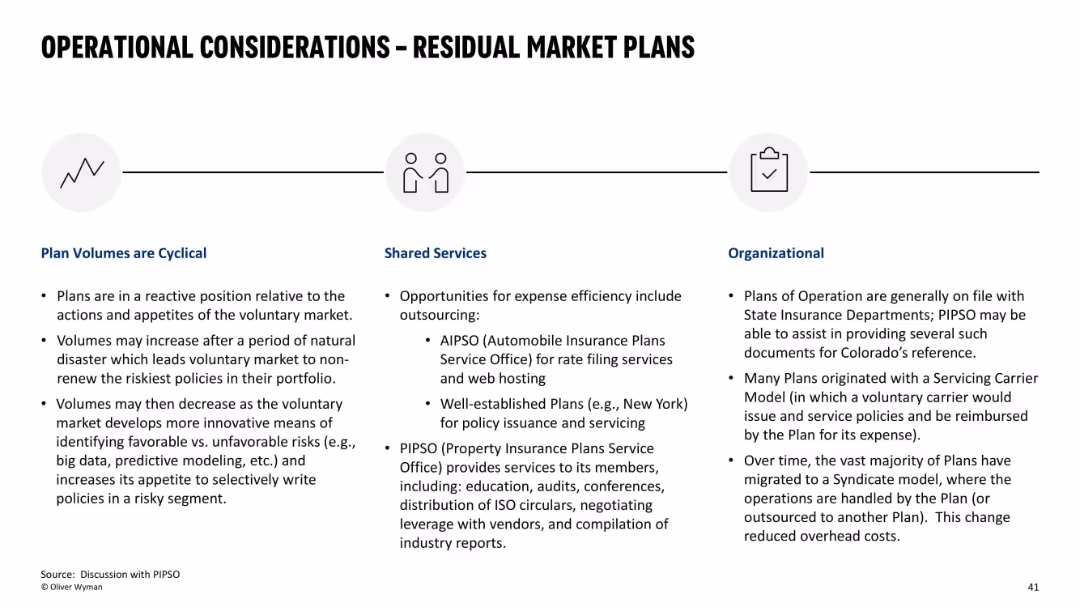
Horizontal infographic layout with three segments, each featuring icons and bullet points. Clean, structured design with a focus on text.
Operational Efficiency
Financial Services
This slide details the operational aspects of Residual Market Plans, covering plan volume cycles, shared services like PIPSO and AIPSO, and organizational models. It explains how plan volumes react to market dynamics, opportunities for cost-sharing, and evolving models for administration, all critical for states considering establishing new plans.
residual market, operations, efficiency, plan cycles, AIPSO, PIPSO, servicing, syndicate model, insurance
false
Operational Efficiency
Financial Services
Pillar
Oliver Wyman
Add to my slides
Remove from favorites
The slide contains multiple text boxes with headers and bullet points, contrasting 'Talent resignation' and 'Talent retrenchment', and providing key considerations for the company on the right.
Human Resources and Talent Management
Professional Services
This slide compares different aspects of talent retention and exit, including resignation and retrenchment, and outlines the company's imperatives in managing these situations. It serves as an informational slide for management and HR professionals.
Resignation, Retrenchment, Talent Management, Company Strategy
false
Human Resources and Talent Management
Professional Services
Header Vertical
Kearney
Add to my slides
Remove from favorites
A triangular diagram divided into three segments (Prediction, Adaptability, Resilience) with descriptive text, emphasizing the importance of each in thriving through uncertainty.
Strategic Planning
Professional Services
Highlights the importance of adaptability, prediction, and resilience in navigating uncertainty in business environments. Useful for strategic planning and change management discussions.
resilience, adaptability, prediction, uncertainty, business strategy, change management, thrive
false
Strategic Planning
Professional Services
Framework
Bain
Add to my slides
Remove from favorites
The slide features a dark background with teal and white text. It has a column chart showing organizational understanding of resilience, and text on organizational pivoting.
Strategic Planning
Professional Services
Discusses preparing organizations to pivot in unexpected events, emphasizing the need for agility and strong financial management, and evaluates understanding of resilience.
resilience, agility, organizational pivot, COVID-19
false
Strategic Planning
Professional Services
Mixed Chart
Deloitte
Add to my slides
Remove from favorites
Column chart showing the Bain Resilience Index scores across various industries like Consumer Products, Industrials, and Retail, with benchmarks for Nordics and advanced economies, presented in grey and purple bars.
Performance Metrics and KPIs
Professional Services
Introduces the Bain Resilience Index, comparing resilience scores across different industries. Valuable for discussions on industry performance, resilience benchmarking, and strategic planning.
resilience, Bain Resilience Index, industry comparison, benchmarking, performance metrics, strategic planning
false
Performance Metrics and KPIs
Professional Services
Single Chart
Bain
Add to my slides
Remove from favorites
The slide includes two main sections: one on the left with text and bullet points, and one on the right with three column charts showing percentages of boards' responses to various ESG-related actions.
Operational Efficiency
Environmental Services & Sustainability
It explains the different behaviors of highly resilient boards compared to less resilient ones, focusing on their actions and perceptions towards ESG issues, including climate change and governance.
resilience, behavior, climate change, governance, ESG
false
Operational Efficiency
Environmental Services & Sustainability
Multiple Chart
EY
Add to my slides
Remove from favorites
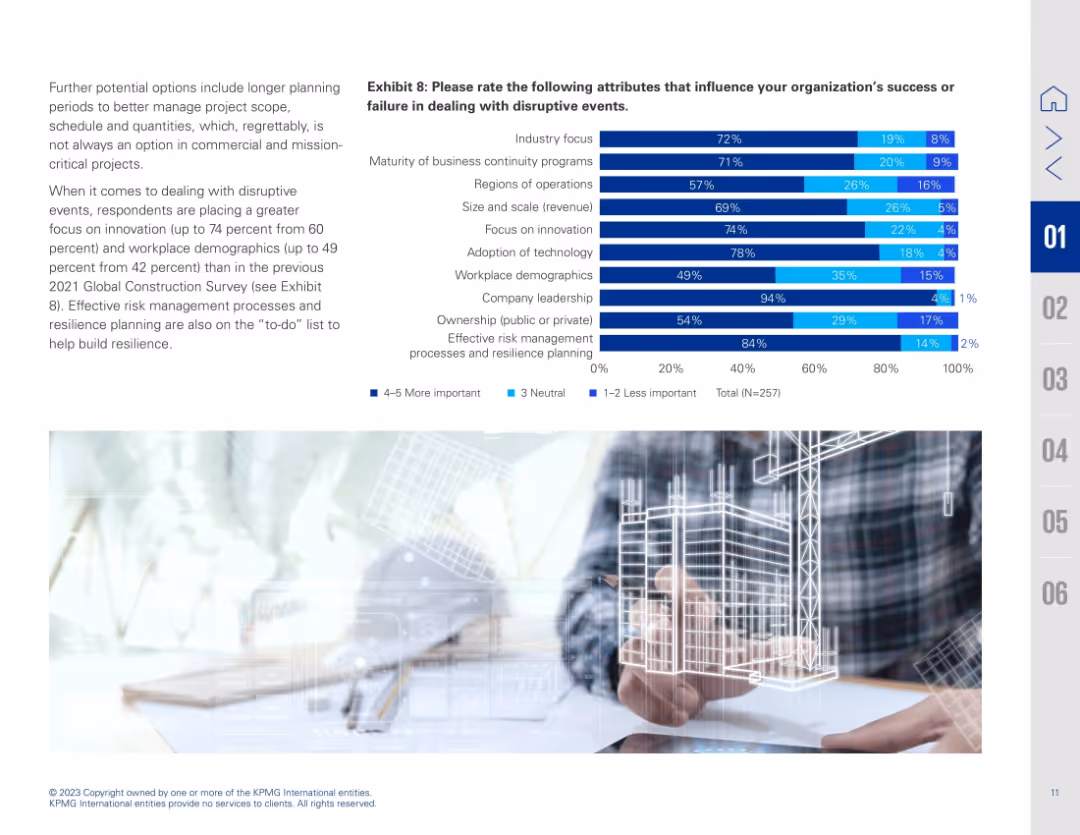
Left-aligned paragraph and right-aligned stacked bar chart (Exhibit 8). Chart evaluates attributes influencing success during disruption. Light background image of a digital building model on bottom right.
Operational Efficiency
Real Estate & Construction
The slide evaluates key attributes contributing to organizational resilience during disruptive events. Effective risk management, innovation, and company leadership were rated as most important. There's emphasis on adopting a holistic and tech-forward strategy, increasing the role of planning, innovation, and workforce demographics in enhancing resilience and performance.
resilience, business continuity, innovation, disruption, leadership, demographics, planning, construction success, risk management
false
Operational Efficiency
Real Estate & Construction
Mixed Chart
KPMG
Add to my slides
Remove from favorites
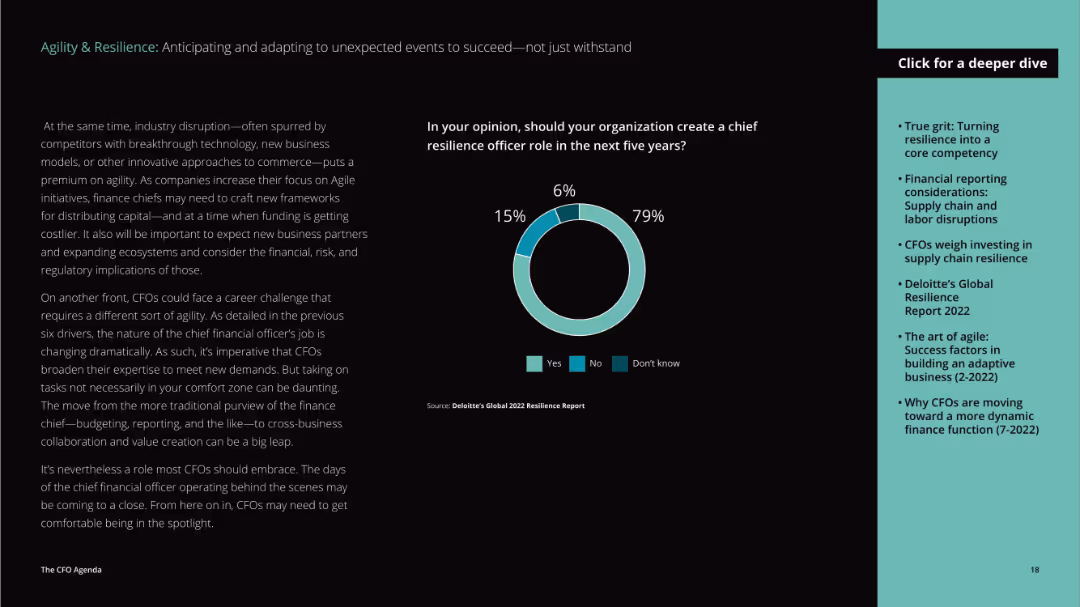
This slide has a dark background with teal and white text. It features a donut chart showing opinions on creating a chief resilience officer role, and text on industry disruption.
Strategic Planning
Professional Services
Examines the need for a chief resilience officer, highlighting industry disruption and evolving CFO roles, and evaluates opinions on resilience roles.
resilience, CFO, industry disruption, agility
false
Strategic Planning
Professional Services
Mixed Chart
Deloitte
Add to my slides
Remove from favorites
Dominated by green hues, this slide details the concept of systemic resilience across a multi-point list.
Organizational Structure and Change
Professional Services
It provides a deep dive into building resilience, with six points explaining the approach, including seeking advantage in adversity and valuing diversity.
resilience, collaboration, performance, diversity, change, advantage
false
Organizational Structure and Change
Professional Services
Boxed
BCG
Add to my slides
Remove from favorites
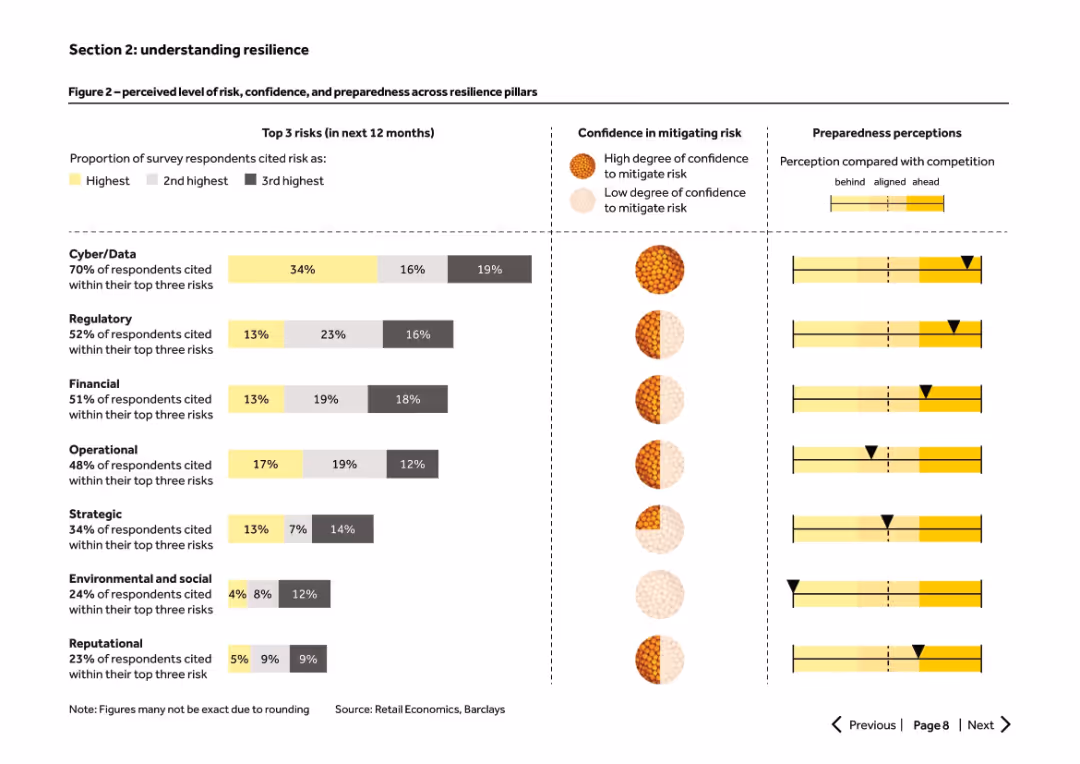
Horizontal bar chart with color-coded risks, confidence indicators, and preparedness perceptions. Visual-heavy slide.
Risk Assessment and Management
Retail & E-commerce
Survey-based data shows retailers' perceived top risks (cyber, regulatory, financial), their confidence in mitigating them, and how they compare to peers. Combines qualitative and quantitative elements to assess resilience.
resilience, cyber risk, preparedness, confidence, retailer, survey
false
Risk Assessment and Management
Retail & E-commerce
Multiple Chart
Barclays
Add to my slides
Remove from favorites
This slide features four circular diagrams with titles and supporting text, evenly spaced on a dark background.
Strategic Planning
Professional Services
The slide suggests strategies for businesses to enhance capabilities to thrive in new realities, such as developing resilience and scaling digital experiences.
resilience, demand-sensing, omnichannel, future scenarios, strategy
false
Strategic Planning
Professional Services
Pillar
BCG
Add to my slides
Remove from favorites
Two distinct sections; left part discusses asset divestitures with a column chart of capital raised per quarter. Right part deals with SKU rationalization, illustrated by a bar chart of percentage changes in different retail categories.
Strategic Planning
Financial Services
Exploring strategies businesses adopt to increase financial resilience, including selling off assets and optimizing product offerings in response to economic challenges.
resilience, divestitures, SKU, retail, capital
false
Strategic Planning
Financial Services
Multiple Chart
McKinsey
Add to my slides
Remove from favorites
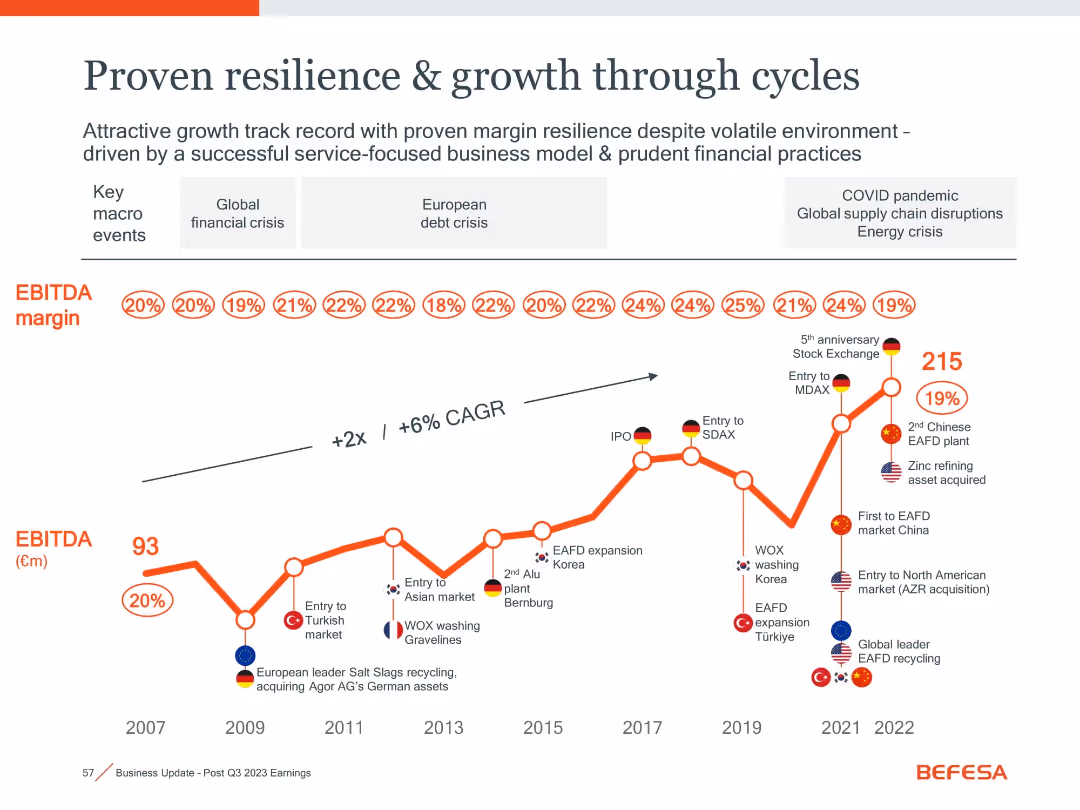
Timeline chart from 2007–2022 with EBITDA and EBITDA margin, annotated with macro events and strategic milestones.
Strategic Planning
Industrial & Manufacturing
Illustrates Befesa's EBITDA growth and margin resilience through financial crises, COVID, and energy shocks. Milestones include IPO, international expansion, and plant additions.
resilience, EBITDA, growth, crises, expansion, strategic milestones
false
Strategic Planning
Industrial & Manufacturing
Single Chart
Goldman Sachs
Add to my slides
Remove from favorites
Previous
Next
You don't have any favorites yet.
Please wait loading your favorites slides...
Create a FREE account to continue browsing
Receive Instant Access to 1,000+ slides from companies like McKinsey, Google, and Goldman Sachs
First Name
Last Name
Email
Password
I agree to all
Terms & Privacy Policy
Thank you! Your submission has been received!
Oops! Something went wrong while submitting the form.
Have an account?
Sign in
Upgrade to PRO to Save slides
Advanced Search and Filters
Access to 15,000+ slides
Access to Category Pages
Save/Bookmark Slides
PowerPoint Template Library
Pick a Plan
MONTHLY
$12/month
Billed every month, Cancel anytime.
YEARLY
$9/year
Billed $108 annually, Cancel anytime.
Checkout for $12/month
Checkout for $108/yr
Secured by Stripe | AES-256 bit encryption