My Account
My Slides
Search by Category
Pricing
Templates
View All Templates
Download Template Slides
✦ AI Search
Feedback
Login
Logout
Get Started
Browse all Slides
Browse all Slides
Create a FREE Account
Instant access to 1,000+ real slides from top companies like McKinsey, BCG, Goldman Sachs, Google and many more!
First Name
Last Name
Email
Password
I agree to all
Terms & Privacy Policy
Thank you! Your submission has been received!
Oops! Something went wrong while submitting the form.
Have an account?
Sign in
Saved Slides
Total No. of slides saved
0
↻ Refresh
✖ Clear all
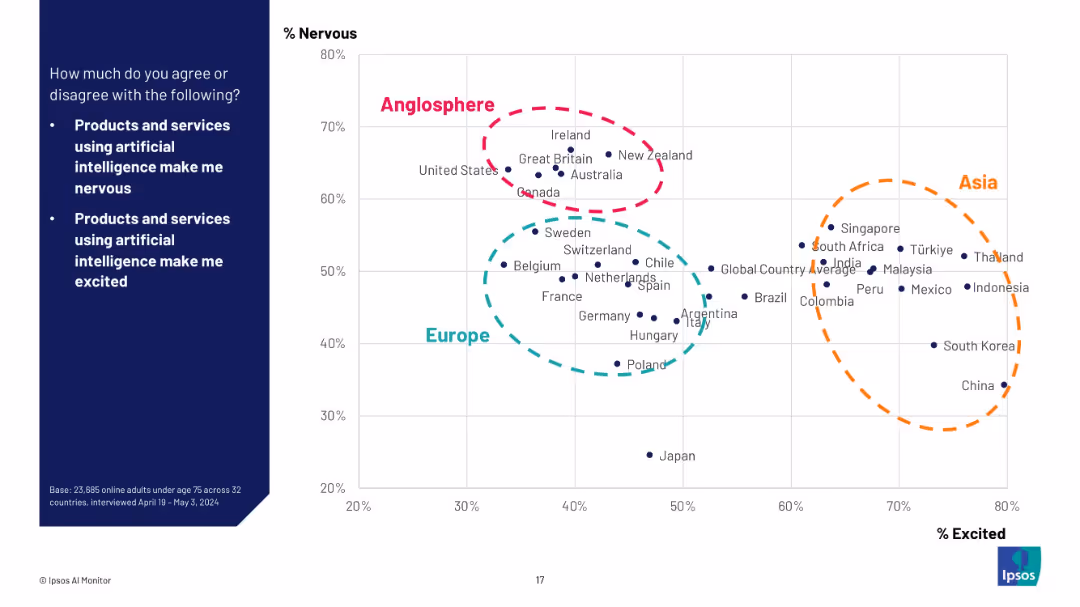
Scatterplot chart mapping countries by % Nervous (Y-axis) vs % Excited (X-axis); regions grouped (Anglosphere, Asia, Europe) using colored dashed circles.
Market Analysis and Trends
Artificial Intelligence
This visual plots countries’ attitudes toward AI on two dimensions—nervousness and excitement—highlighting regional clusters like Anglosphere, Asia, and Europe. It illustrates nuanced public opinion beyond binary agreement/disagreement.
scatterplot, sentiment mapping, AI perception, regional analysis, Ipsos, emotion, excitement vs fear, geopolitical comparison, global survey
false
Market Analysis and Trends
Artificial Intelligence
Mixed Chart
IPSOS
Add to my slides
Remove from favorites
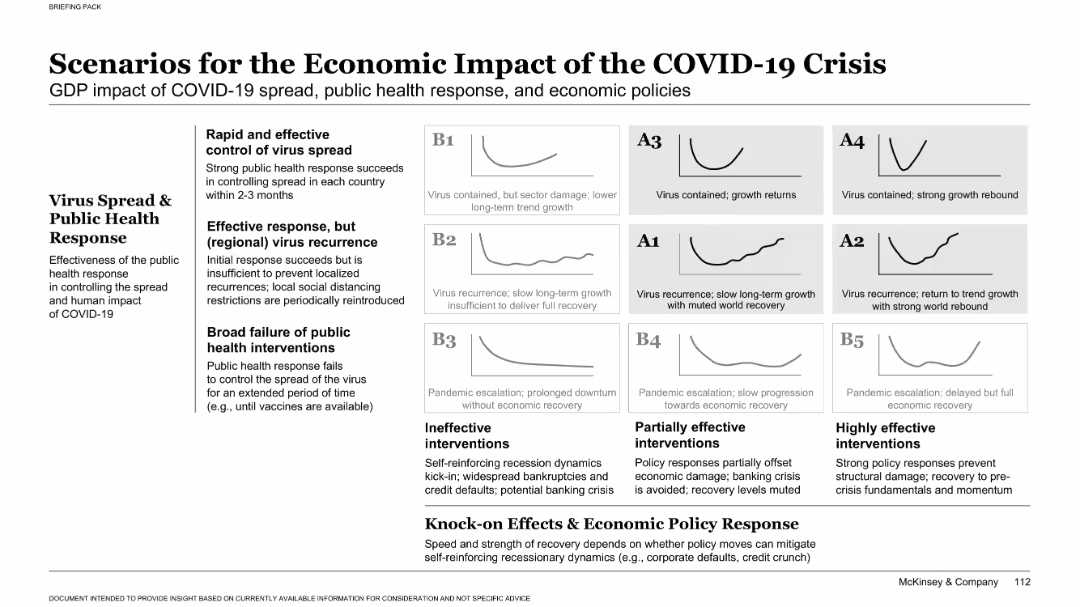
Matrix-style layout showing 9 scenarios based on public health response and policy effectiveness, each represented with a simple trend line.
Investment Analysis
Government & Public Sector
This slide presents 9 possible GDP impact scenarios from the COVID-19 crisis. It cross-tabulates virus containment effectiveness with economic intervention success, providing visual trends for each and labeling them from A1 to B5.
scenarios, COVID-19, GDP, trends, economic impact, public health, policy, recession, interventions, matrix
false
Investment Analysis
Government & Public Sector
Single Chart
McKinsey
Add to my slides
Remove from favorites
The slide features a matrix on the right that categorizes different energy transition scenarios, with text on the left explaining the significance of each scenario.
Technology and Digital Transformation
Energy & Utilities
This slide explores various scenarios presented in the "Global Energy Perspective 2022," each with different assumptions about technological progress and policy enforcement. It outlines the potential CO2 prices required, the global temperature increase expected, and the speed of the energy transition. The content is strategically designed to provide stakeholders with a range of possible futures, facilitating strategic planning and policy making in an uncertain energy landscape.
Scenarios, Energy Transition, CO2 Pricing, Climate Impact
false
Technology and Digital Transformation
Energy & Utilities
Header Horizontal
McKinsey
Add to my slides
Remove from favorites
Features a flow diagram and text blocks assessing multiple scenarios based on vaccine characteristics and global response strategies.
Strategic Planning
Healthcare & Pharmaceuticals
Offers strategic insights into potential futures depending on vaccine and therapeutic developments, including impact on public health and policy decisions.
scenarios, vaccine, planning, COVID-19
false
Strategic Planning
Healthcare & Pharmaceuticals
Table
BCG
Add to my slides
Remove from favorites
Slide features a complex column chart comparing various funding strategies to achieve school connectivity with different assumed conditions. Colorful text boxes provide additional contextual information.
Strategic Planning
Education & Training
The slide offers a theoretical approach to combining different funding models to achieve school connectivity in Java, Bali, and Sumatra, addressing potential surplus and challenges.
school connectivity, funding models, Java, Bali, Sumatra, theoretical surplus, financial analysis, government subsidy, practical hurdles, strategy planning
false
Strategic Planning
Education & Training
Mixed Chart
BCG
Add to my slides
Remove from favorites
Includes maps and column charts detailing school connectivity and population distribution across Indonesian regions. Color gradations indicate connectivity levels and population densities, with annotations providing regional data and trends.
Market Analysis and Trends
Education & Training
Details the disparity in school connectivity across Indonesia, with a focus on Sumatra's lag in internet access despite high connectivity in more populated regions like Java. Discusses the implications for educational equity and digital access.
school connectivity, internet access, regional disparity, Sumatra, Java
false
Market Analysis and Trends
Education & Training
Multiple Chart
BCG
Add to my slides
Remove from favorites
This slide includes a map and bar graphs illustrating school connectivity rates across different regions, highlighting areas with significant connectivity issues.
Strategic Planning
Education & Training
Focuses on the challenges of improving internet connectivity in schools across Indonesia's less populated islands, underlining the geographical disparities.
school connectivity, internet access, sparsely populated, Indonesia, structural challenges
false
Strategic Planning
Education & Training
Graphic
BCG
Add to my slides
Remove from favorites
Two large column charts detailing population and spending, accompanied by a colored map of Indonesia showing school connectivity rates. Visual elements are clear and neatly organized, using blues and oranges to differentiate data points.
Strategic Planning
Education & Training
Explains the connectivity challenges faced by schools across various Indonesian islands, showing the correlation between population size, economic contributions, and school connectivity.
school connectivity, population data, economic analysis, Indonesia, mapping
false
Strategic Planning
Education & Training
Multiple Chart
BCG
Add to my slides
Remove from favorites
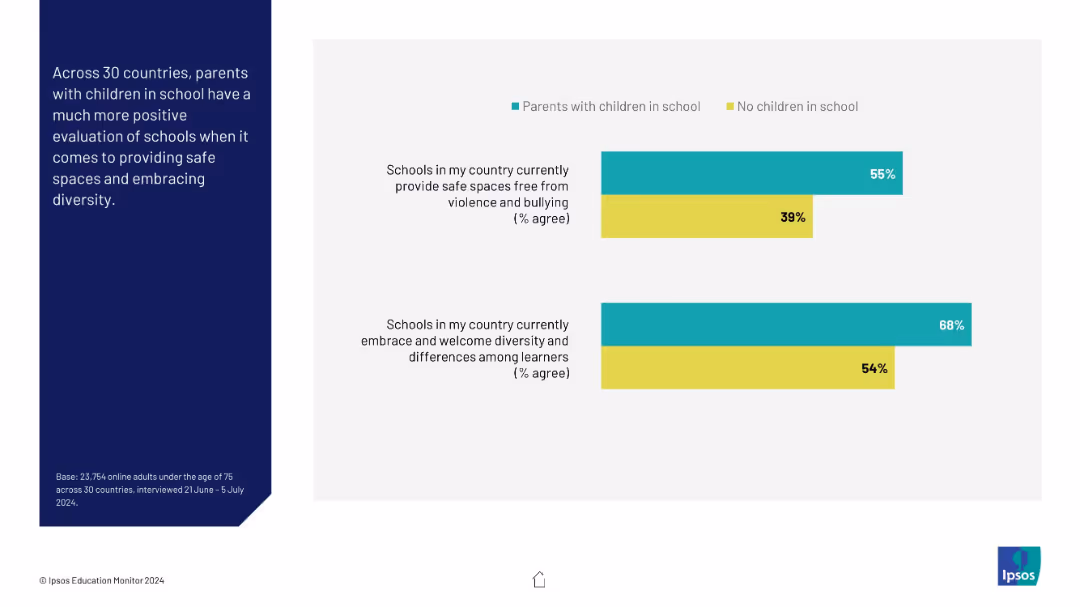
Two horizontal bar charts comparing parents with/without school-age children; clean two-column layout with side panel explanation.
Performance Metrics and KPIs
Education & Training
This slide compares perceptions of school safety and inclusiveness between parents of school children and others. Parents with children in school report more favorable views on both measures.
school safety, diversity, parent opinions, comparison, education metrics, Ipsos, survey insights
false
Performance Metrics and KPIs
Education & Training
Mixed Chart
IPSOS
Add to my slides
Remove from favorites
The slide features a text box with a quote and a circular diagram showing the stakeholder consultation process, with various industry icons.
Strategic Planning
Environmental Services & Sustainability
The slide discusses the company's commitment to Science Based Targets and the recurring themes from stakeholder consultations on fashion returns.
Science Based Targets, sustainability, stakeholder, consultation, themes
false
Strategic Planning
Environmental Services & Sustainability
Diagram
Roland Berger
Add to my slides
Remove from favorites
Horizontal bar chart showing the belief in science versus the desire for control over health decisions by age groups.
Market Analysis and Trends
Healthcare & Pharmaceuticals
The slide presents data on people's belief in science and their desire to retain control over health decisions.
science, health control, age differences, healthcare, public opinion
false
Market Analysis and Trends
Healthcare & Pharmaceuticals
Multiple Chart
IPSOS
Add to my slides
Remove from favorites
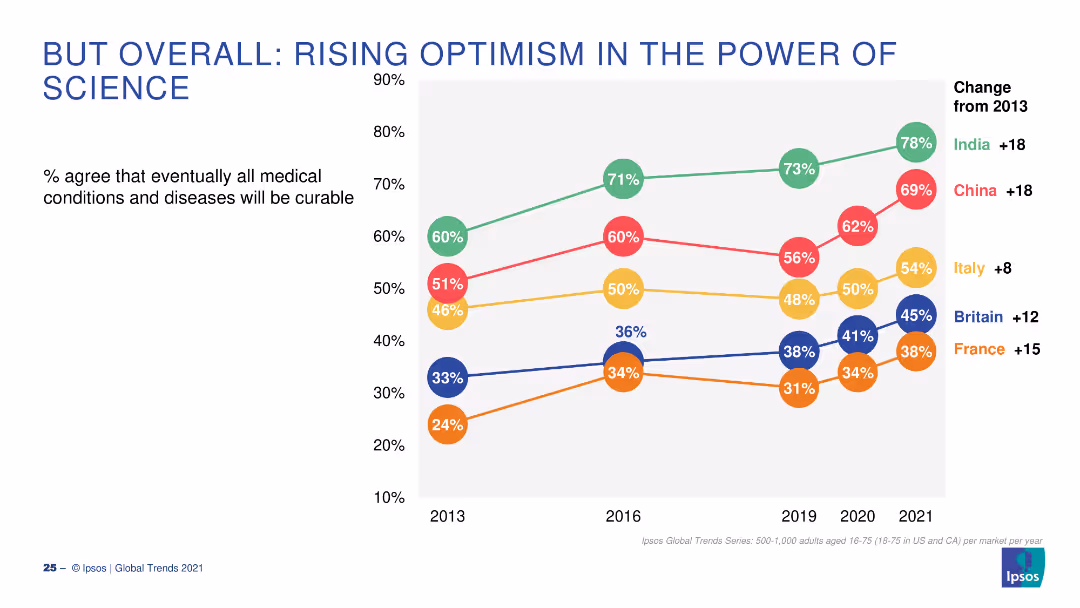
A line graph showing the percentage agreement over time (2013-2021) that all medical conditions will eventually be curable, with trends per country.
Market Analysis and Trends
Healthcare & Pharmaceuticals
The slide presents data on the rising optimism in the curability of all medical conditions, comparing several countries from 2013 to 2021.
Science, Optimism, Curability, Trends, Countries
false
Market Analysis and Trends
Healthcare & Pharmaceuticals
Single Chart
IPSOS
Add to my slides
Remove from favorites
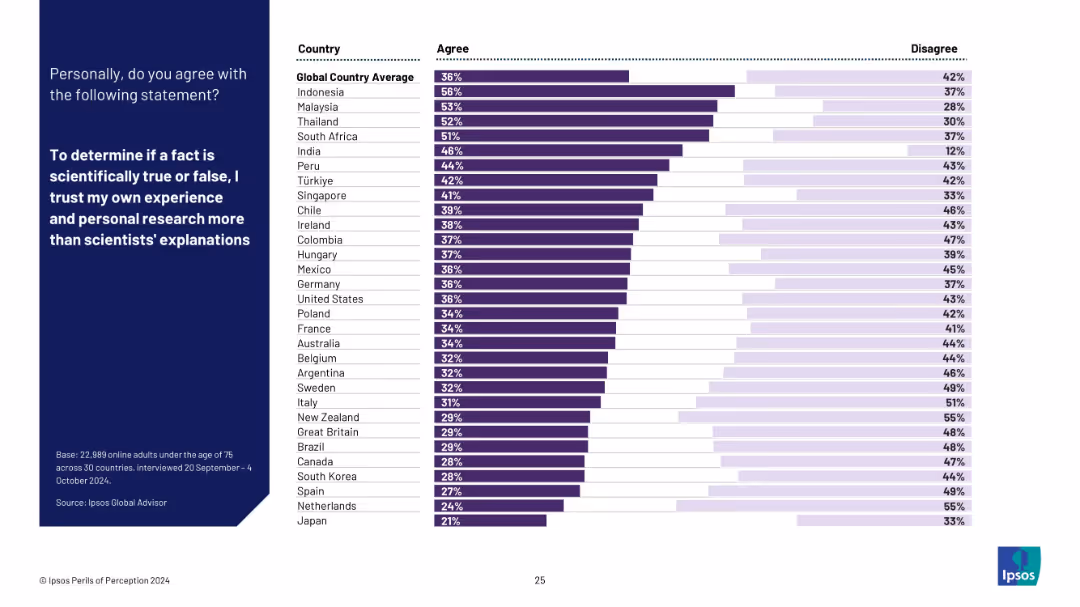
Horizontal bar chart ranking countries by agreement with the statement: “I trust my own experience and personal research more than scientists’ explanations.” Blue panel on left for question, with white background chart.
Strategic Planning
Education & Training
This slide ranks countries by trust in personal research over scientific consensus. A significant portion of global respondents (especially in Indonesia, Malaysia, Thailand) value personal experience more, raising concerns about misinformation resilience.
science skepticism, personal research, trust in experts, misinformation, public belief, education, Ipsos survey, international ranking
false
Strategic Planning
Education & Training
Mixed Chart
IPSOS
Add to my slides
Remove from favorites
Column chart showing agreement and disagreement percentages on the belief in scientific advancements curing diseases across countries.
Market Analysis and Trends
Healthcare & Pharmaceuticals
This slide presents data on the varying belief in the power of science to cure diseases, highlighting regional differences, particularly in Europe.
science skepticism, public opinion, healthcare, Europe, scientific advancements
false
Market Analysis and Trends
Healthcare & Pharmaceuticals
Multiple Chart
IPSOS
Add to my slides
Remove from favorites
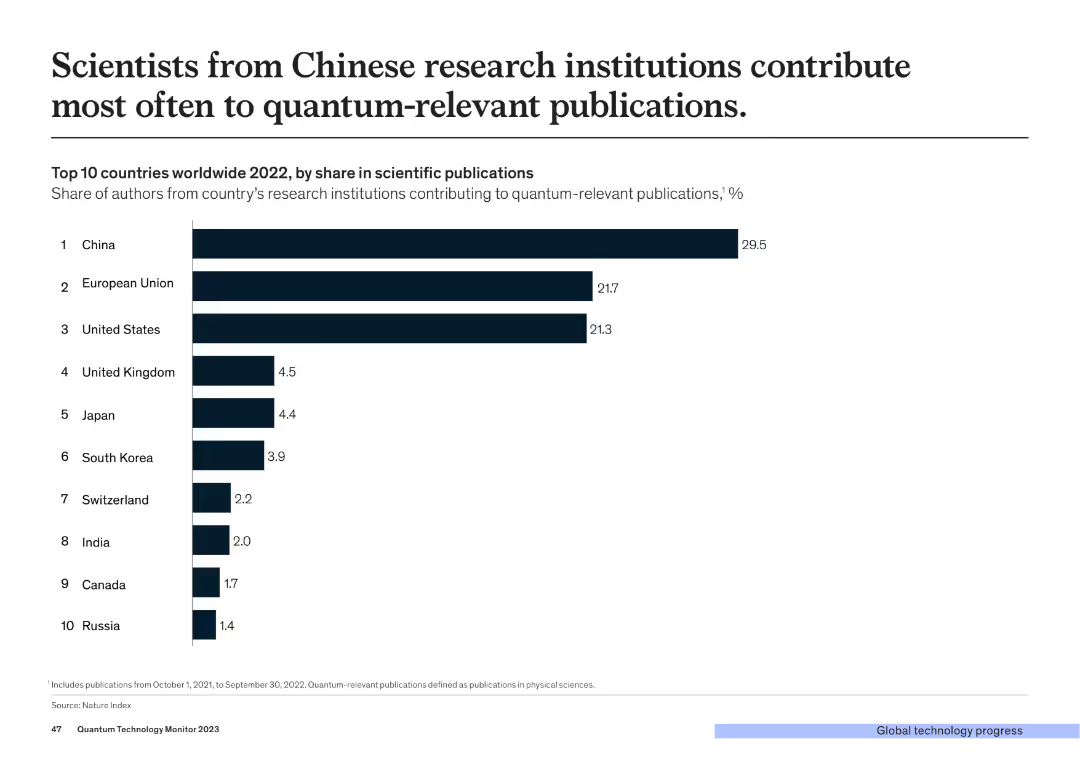
This slide displays a column chart ranking the top 10 countries by share of authors contributing to quantum-relevant publications in 2022. Countries include China, EU, USA, UK, Japan, and others.
Market Analysis and Trends
Technology & Software
The slide illustrates the leading countries in terms of contributions to quantum-relevant scientific publications, with China and the European Union topping the list.
Scientists, Publications, Quantum, China, EU
false
Market Analysis and Trends
Technology & Software
Single Chart
McKinsey
Add to my slides
Remove from favorites
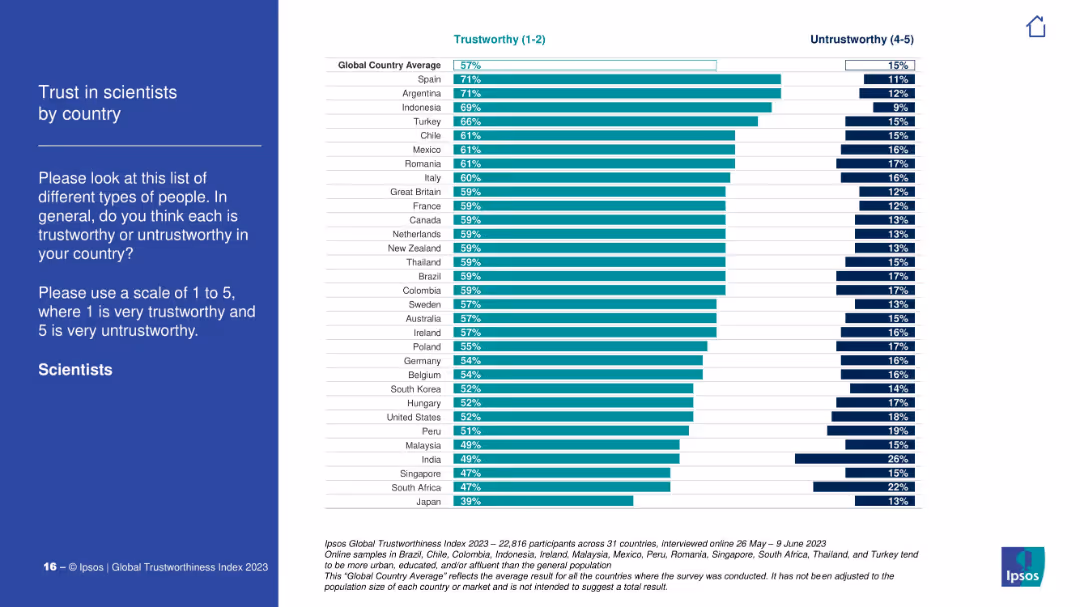
Vertical bar chart ranking countries by % trust in scientists. Similar visual format to previous slide. Countries ordered highest to lowest.
Customer and Market Segmentation
Education & Training
Highlights variation in public trust in scientists by country. Spain and Argentina top the list, while Japan ranks the lowest. The global average trust level is 57%. The chart also displays untrustworthy ratings on the right side.
scientists, trust levels, global survey, Ipsos, country comparison, public perception
false
Customer and Market Segmentation
Education & Training
Mixed Chart
IPSOS
Add to my slides
Remove from favorites
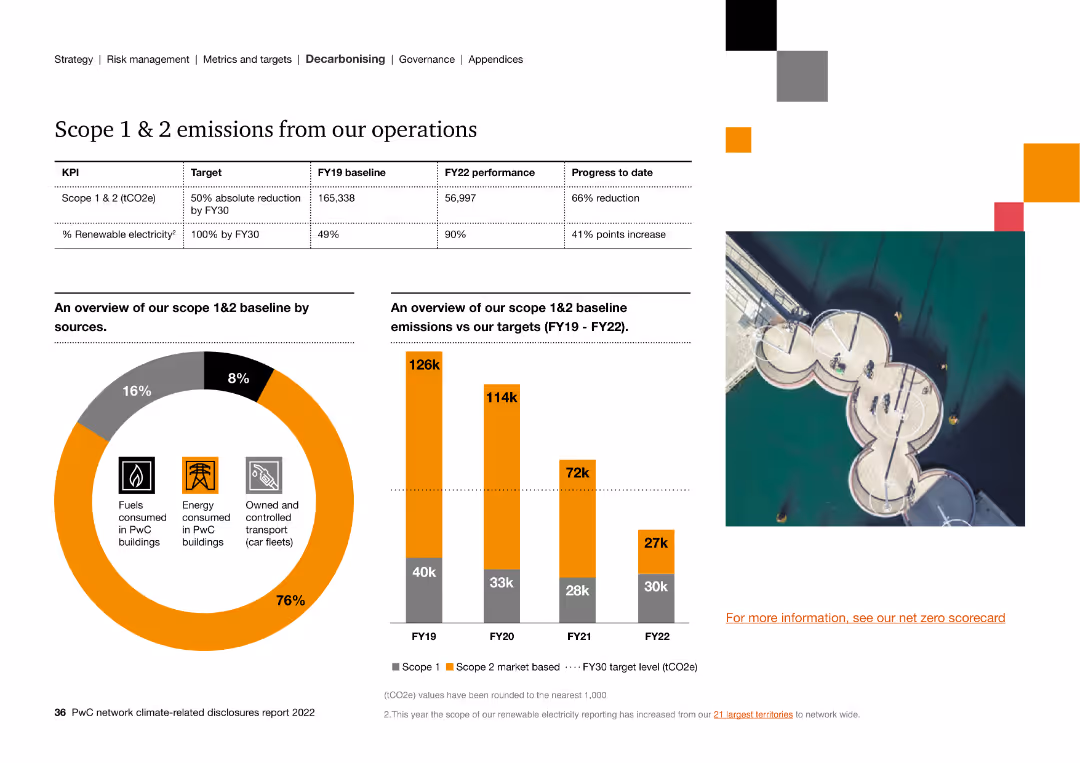
The slide includes column charts and a circular graph detailing the breakdown and reduction of Scope 1 & 2 emissions, and progress towards renewable electricity.
Strategic Planning
Energy & Utilities
The slide outlines Scope 1 & 2 emissions reduction progress, highlighting a 66% reduction target and the increase in renewable electricity usage to 90%.
scope 1, scope 2, emissions, renewable electricity, targets, operations, progress
false
Strategic Planning
Energy & Utilities
Multiple Chart
PwC/Strategy&
Add to my slides
Remove from favorites
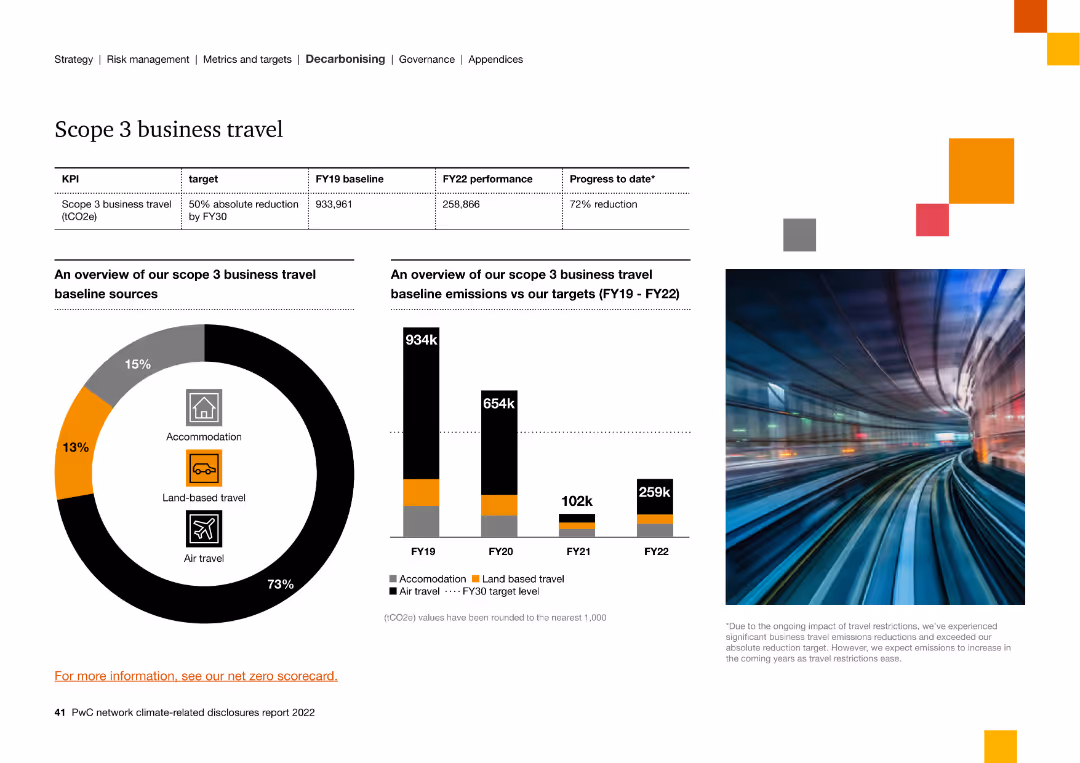
The slide features a circular graph and column charts, showing the sources and reductions of Scope 3 business travel emissions from FY19 to FY22.
Strategic Planning
Energy & Utilities
The slide provides an overview of Scope 3 business travel emissions, showing a 72% reduction target by FY30, and the breakdown of emission sources.
scope 3, business travel, emissions, reduction, sources, targets, overview
false
Strategic Planning
Energy & Utilities
Multiple Chart
PwC/Strategy&
Add to my slides
Remove from favorites
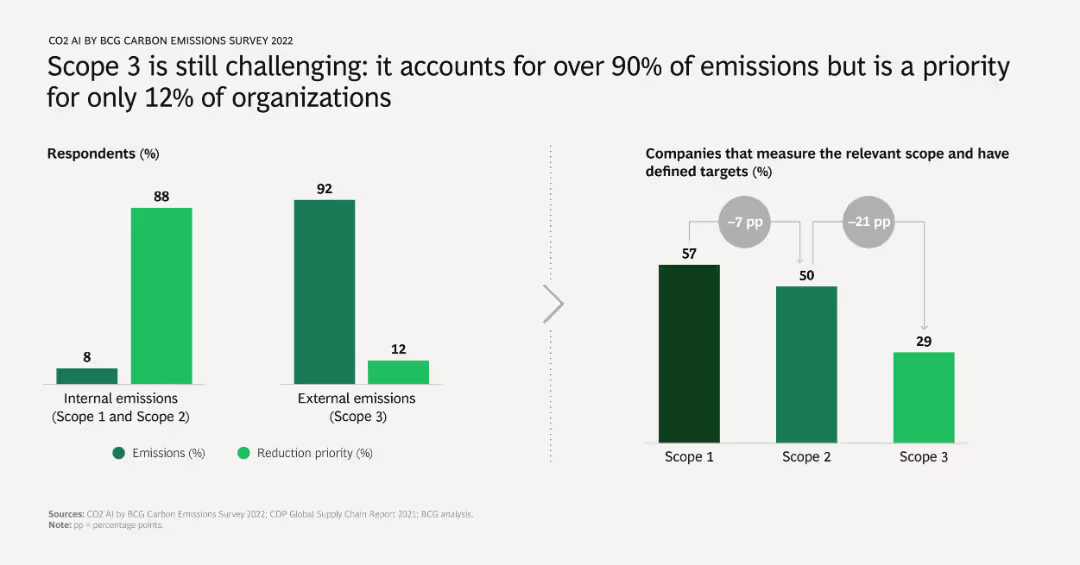
The slide has two bar charts: one showing the distribution of emissions between internal (Scope 1 and 2) and external (Scope 3), and the other showing the prioritization of reduction efforts. Highlights the significant challenge of addressing Scope 3 emissions.
Risk Assessment and Management
Environmental Services & Sustainability
Addresses the difficulty organizations face in managing Scope 3 emissions, which make up the majority of total emissions but are prioritized by a minority of companies. Stresses the importance of focusing on these external emissions.
Scope 3, emissions, internal, external, reduction priority, survey results
false
Risk Assessment and Management
Environmental Services & Sustainability
Multiple Chart
BCG
Add to my slides
Remove from favorites
The slide presents a series of bar charts showing the estimated ratio of scope 1, 2, and 3 emissions for various sectors such as chemicals, cement, car manufacturers, and energy production.
Regulatory and Compliance
Government & Public Sector
The slide highlights the importance of scope 3 emissions, showing their significant impact across various industries. It provides data on the proportion of emissions from different scopes for sectors like chemicals, cement, car manufacturers, and energy production, stressing the need for comprehensive emissions reduction strategies.
scope 3, emissions, sectors, ratio
false
Regulatory and Compliance
Government & Public Sector
Mixed Chart
Kearney
Add to my slides
Remove from favorites
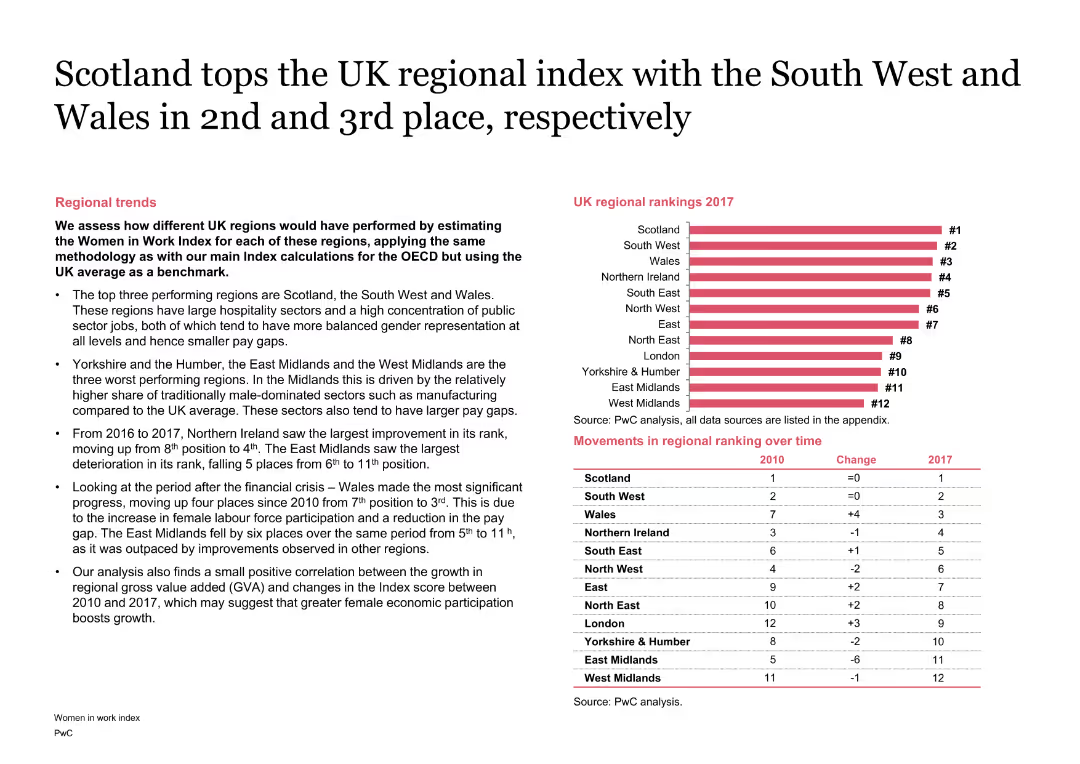
The slide combines text with a column chart showing the regional rankings within the UK. It highlights changes over time with a table and discusses the performance of different regions.
Market Analysis and Trends
Financial Services
It analyzes the regional rankings within the UK on the Women in Work Index, highlighting the top-performing regions like Scotland and factors contributing to their performance.
Scotland, Regional, Index, UK, Performance, Ranking
false
Market Analysis and Trends
Financial Services
Mixed Chart
PwC/Strategy&
Add to my slides
Remove from favorites
Contains a table and column charts comparing different scenarios for scrap usage in steel production by 2025, highlighting potential strategies.
Operational Efficiency
Industrial & Manufacturing
The slide proposes strategies for optimizing scrap usage in steel production, with projections and technological implications for 2025.
scrap usage, steel production, strategies, 2025, table, column chart
false
Operational Efficiency
Industrial & Manufacturing
Mixed Chart
McKinsey
Add to my slides
Remove from favorites
Features a diagram depicting the transition from the current state to the future state of an organization through SCT, using labels and connecting arrows.
Strategic Planning
Professional Services
Describes the objective of Strategic Cost Transformation, which aims to align the business model, operating, and capital model for enhanced organizational performance and efficiency.
SCT, Business Model, Operational Efficiency, Alignment, Future State
false
Strategic Planning
Professional Services
Framework
Deloitte
Add to my slides
Remove from favorites
Contains a descriptive block on the left about Palsgaard's focus, a complex table in the center with checkboxes marking the strategic direction in relation to specific SDGs, and the SDG logos for 'Responsible Consumption' and 'Climate Action'.
Strategic Planning
Environmental Services & Sustainability
This slide details Palsgaard’s strategic focus on SDG 12 and 13, highlighting initiatives like responsible resource use and CO2 emissions reduction. The central table checks align Palsgaard’s operations with these SDGs, pointing out their commitment to innovation in sustainability and the impact on operational costs and global CO2 management.
SDG 12, SDG 13, Sustainability, CO2 Reduction, Resource Management
false
Strategic Planning
Environmental Services & Sustainability
Table
McKinsey
Add to my slides
Remove from favorites
A pie chart shows the proportion of SDG-aligned investments against other investments, with associated text blocks. A color-coded list describes contributions to SDG goals.
Regulatory and Compliance
Government & Public Sector
Communicates the company's commitment to sustainability through SDG-aligned investments. It highlights the yearly investment averages and the main areas of contribution, suitable for reports on corporate responsibility and sustainability initiatives.
SDG Goals, Investments, Sustainability, Corporate Responsibility, Innovation
false
Regulatory and Compliance
Government & Public Sector
Table
Goldman Sachs
Add to my slides
Remove from favorites
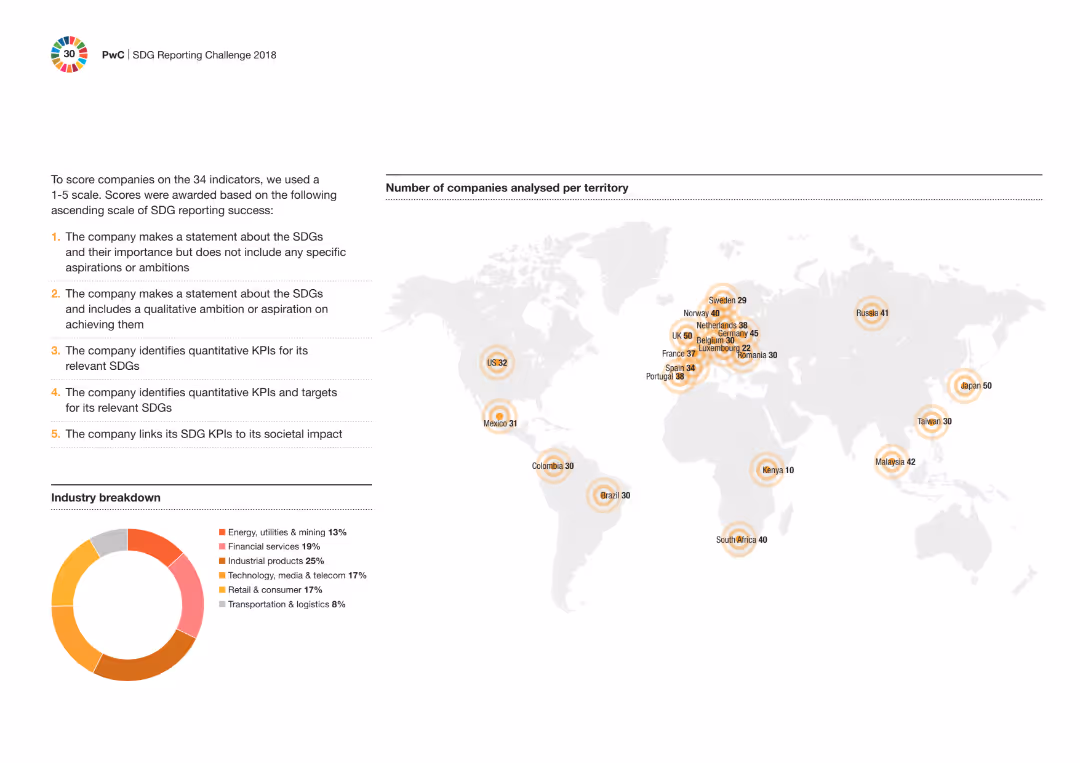
The slide includes a world map showing the number of companies analyzed per territory and a donut chart with industry breakdown. Text details the scoring criteria for SDG indicators.
Performance Metrics and KPIs
Professional Services
The slide describes the scoring methodology for companies on SDG indicators using a 1-5 scale. It includes a geographic and industry breakdown of the companies analyzed, showing a global perspective on SDG reporting practices.
SDG indicators, scoring, global analysis, companies, professional services, industry breakdown, donut chart, map
false
Performance Metrics and KPIs
Professional Services
Mixed Chart
PwC/Strategy&
Add to my slides
Remove from favorites
The slide includes a circular flow diagram, bullet points detailing initiatives, and a textbox with key product highlights. It's designed with a clean look using red and grey colors.
Operational Efficiency
Environmental Services & Sustainability
Highlights initiatives contributing to the Sustainable Development Goals (SDG) and showcases new products that align with the company's sustainability portfolio.
SDG, initiatives, industrial process efficiency, energy efficiency, digitalization, innovation, AW609, AW169, integrated sensors, sustainability portfolio
false
Operational Efficiency
Environmental Services & Sustainability
Header Horizontal
Goldman Sachs
Add to my slides
Remove from favorites
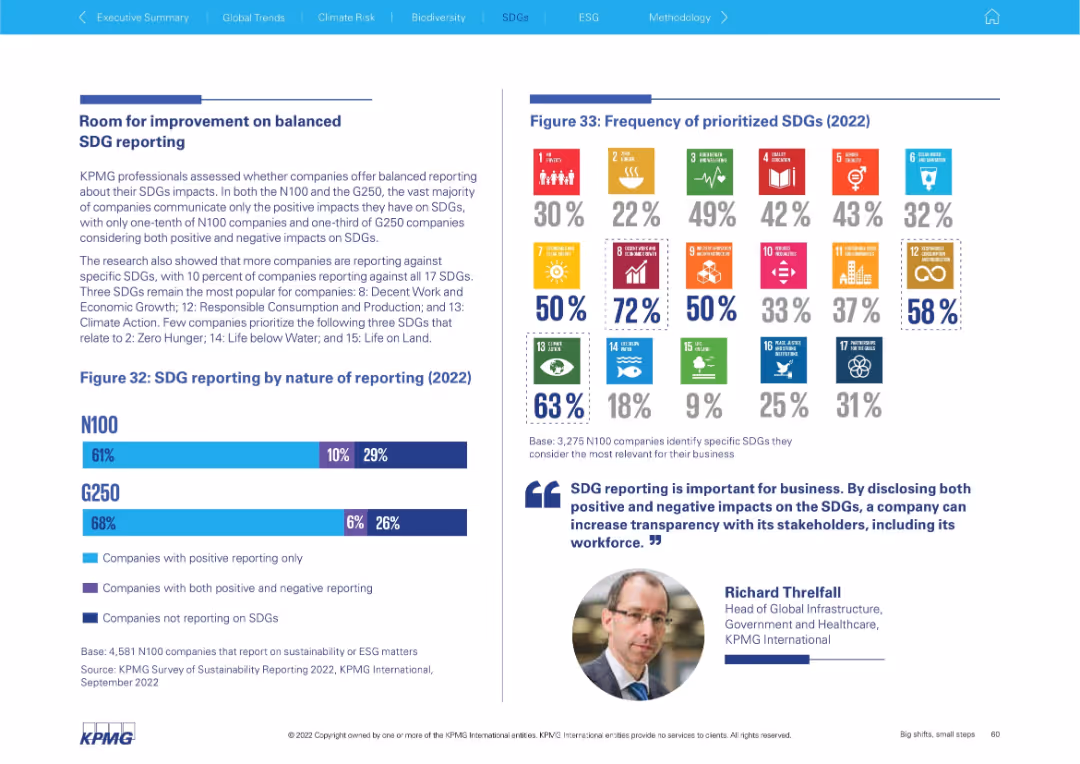
Left-aligned paragraph explanation with bar chart below showing nature of SDG reporting, and a colorful SDG icon grid on the right depicting frequency of prioritization.
Performance Metrics and KPIs
Professional Services
This slide examines the balance in SDG reporting, noting most companies report only positive impacts. It shows which SDGs are most commonly prioritized and provides figures for how many companies disclose both positive and negative impacts.
SDG prioritization, reporting balance, impact disclosure, G250, N100, sustainability metrics, ESG, SDG icons, transparency
false
Performance Metrics and KPIs
Professional Services
Mixed Chart
KPMG
Add to my slides
Remove from favorites
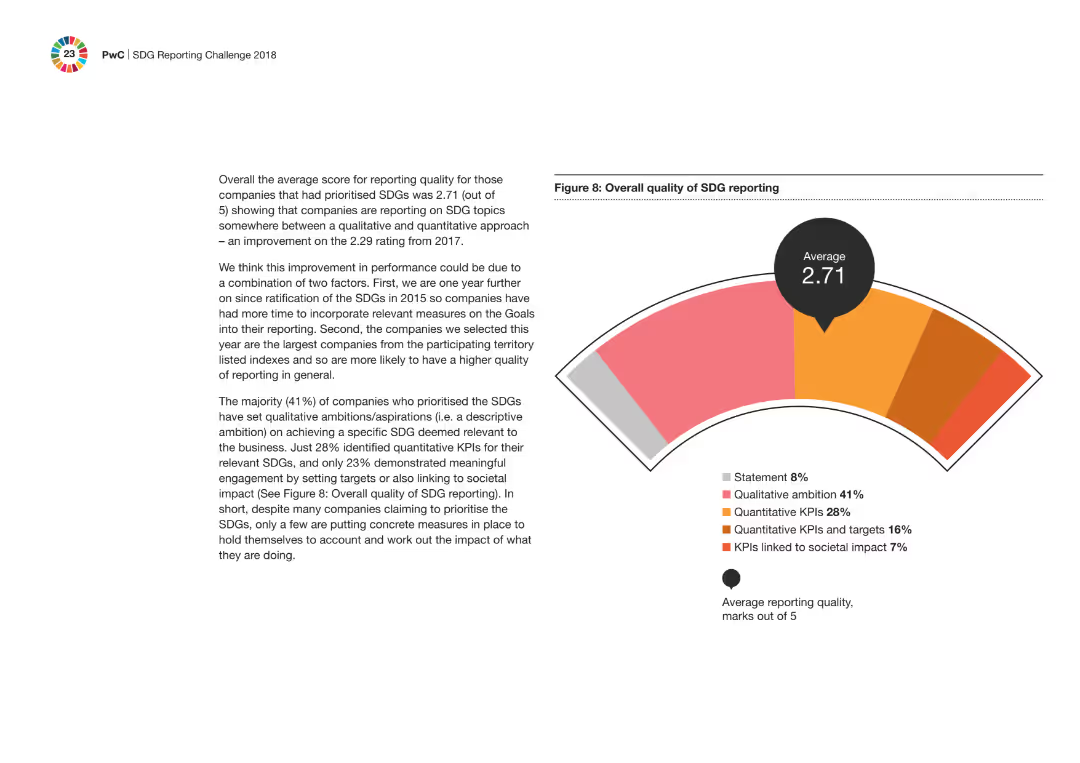
This slide contains a gauge chart displaying an average score of 2.71 for SDG reporting quality, with a breakdown of qualitative and quantitative measures.
Regulatory and Compliance
Professional Services
It discusses the average score for reporting quality of companies prioritizing SDGs, highlighting improvements from the previous year and the importance of setting qualitative and quantitative KPIs.
SDG reporting, quality score, qualitative, quantitative, professional services, gauge chart, improvements, compliance
false
Regulatory and Compliance
Professional Services
Mixed Chart
PwC/Strategy&
Add to my slides
Remove from favorites
The circular diagram is split into four quadrants with icons, blue and gray color themes, and focused text blocks.
Strategic Planning
Environmental Services & Sustainability
Details how SDGs can enhance business strategies in four key areas: organizational performance, growth, risk management, and return on capital.
SDGs, business growth, risk management, sustainability, return on capital
false
Strategic Planning
Environmental Services & Sustainability
Framework
McKinsey
Add to my slides
Remove from favorites
Compares potential business opportunities arising from the UN Sustainable Development Goals globally and specifically for Denmark. Uses maps and icons to visualize areas such as new market opportunities and job creation, highlighting both global and national impacts.
Strategic Planning
Government & Public Sector
Analyzes how the UN Sustainable Development Goals can generate significant business opportunities by 2030, both globally and in Denmark. The slide details the potential for new jobs and market growth, providing a strategic perspective for businesses looking to align with global sustainability efforts and capitalize on emerging trends in responsible business practices.
SDGs, business opportunities, global markets, Denmark
false
Strategic Planning
Government & Public Sector
Table
McKinsey
Add to my slides
Remove from favorites
Circular diagram with twelve segments, each labeled with different strategic focuses, comprehensive design.
Strategic Planning
Government & Public Sector
Describes twelve primary areas where companies can derive business value from SDGs, including partnerships and operational improvements.
SDGs, business strategy, partnerships, operational improvements
false
Strategic Planning
Government & Public Sector
Diagram
McKinsey
Add to my slides
Remove from favorites
The slide includes a bar chart comparing the roles of various corporate leaders in driving SDG initiatives, prominently highlighting the role of CEOs with a backdrop of subtle blue tones.
Market Analysis and Trends
Professional Services
This slide presents survey data on the driving forces behind SDG implementation in companies, emphasizing the significant role of CEOs compared to other leadership roles like CSR managers and sustainability project managers.
SDGs, CEO, leadership, corporate governance
false
Market Analysis and Trends
Professional Services
Single Chart
McKinsey
Add to my slides
Remove from favorites
Contains a series of bar charts that represent the percentage of the largest Danish companies engaging with various SDGs, with color-coding corresponding to different SDG goals.
Market Analysis and Trends
Environmental Services & Sustainability
This slide reviews the SDG engagement of top Danish companies, showing high involvement in goals related to industry, innovation, and climate action, as reported in their annual sustainability reports.
SDGs, Danish companies, sustainability reporting, corporate engagement
false
Market Analysis and Trends
Environmental Services & Sustainability
Single Chart
McKinsey
Add to my slides
Remove from favorites
This slide displays the 17 Sustainable Development Goals (SDGs) set by the UN, each represented by an icon and a brief description. The slide provides a comprehensive overview of these goals, which include ending poverty, ensuring education for all, and combating climate change, among others.
Regulatory and Compliance
Government & Public Sector
Provides an overview of the United Nations' Sustainable Development Goals, highlighting their role as a global framework for addressing key challenges like poverty, education, and climate change. The slide serves as a valuable educational tool for discussing global priorities and the collaborative efforts needed to achieve sustainable development across various sectors.
SDGs, global challenges, sustainability, education, poverty
false
Regulatory and Compliance
Government & Public Sector
Table
McKinsey
Add to my slides
Remove from favorites
Presents a series of infographics and icons summarizing global progress on various SDGs, such as poverty reduction, health improvements, and educational advancements, with a focus on statistical changes.
Strategic Planning
Government & Public Sector
This slide summarizes global achievements and ongoing challenges in achieving the Sustainable Development Goals, highlighting significant progress in areas like health and poverty, alongside areas needing more effort like sanitation and renewable energy access.
SDGs, global progress, challenges, health, education
false
Strategic Planning
Government & Public Sector
Table
McKinsey
Add to my slides
Remove from favorites
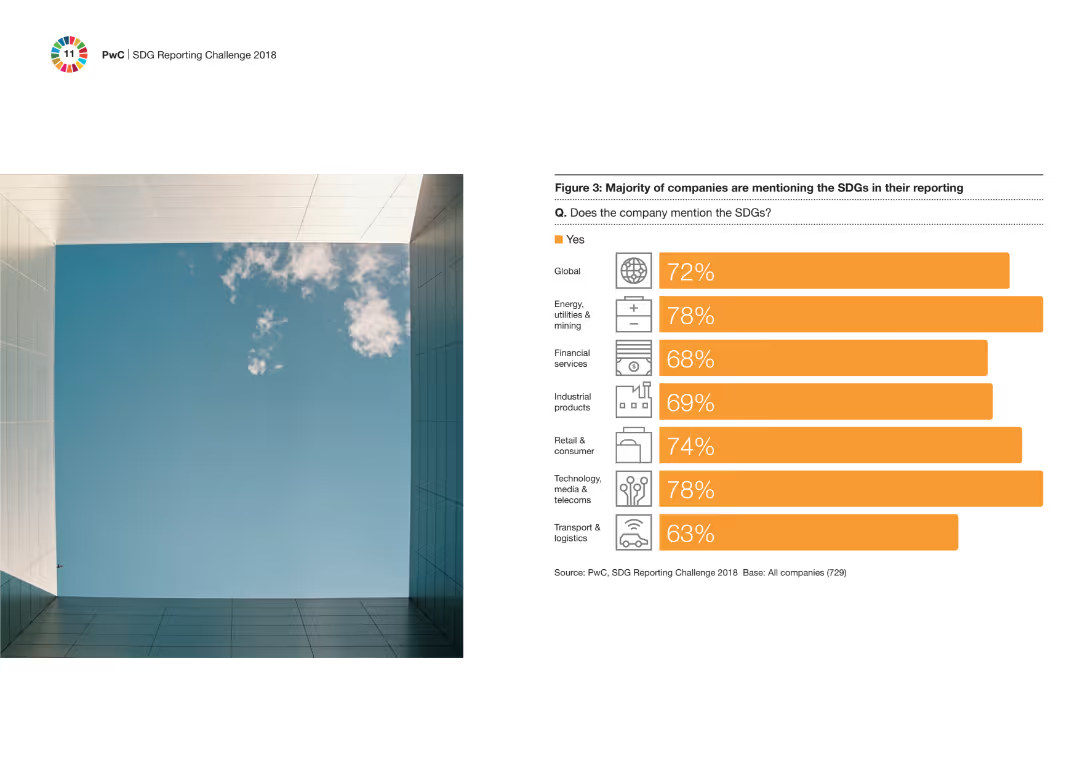
Column chart illustrating the percentage of companies across various industries that mention the SDGs in their reports. Visual includes icons representing different industries on the right side of the chart.
Regulatory and Compliance
Financial Services
The slide details the percentage of companies in various industries that mention the SDGs in their reporting, highlighting that most sectors are engaging with these sustainability goals.
SDGs, industries, reporting, sustainability, companies
false
Regulatory and Compliance
Financial Services
Mixed Chart
PwC/Strategy&
Add to my slides
Remove from favorites
Matrix layout with checkmarks showing SDG relevance across various industries.
Strategic Planning
Government & Public Sector
Provides a matrix mapping SDGs to industry relevance, highlighting key areas for business impact.
SDGs, industry relevance, strategic planning, business impact
false
Strategic Planning
Government & Public Sector
Table
McKinsey
Add to my slides
Remove from favorites
Features a bar chart detailing the incremental value of the 12 largest SDG-related business opportunities by 2030, highlighting sectors like mobility, healthcare, and energy efficiency.
Market Analysis and Trends
Environmental Services & Sustainability
The slide illustrates potential market sizes and savings from SDG-related business opportunities, projecting significant growth in areas like mobility systems and new healthcare solutions by 2030.
SDGs, market opportunities, business growth, sustainability
false
Market Analysis and Trends
Environmental Services & Sustainability
Single Chart
McKinsey
Add to my slides
Remove from favorites
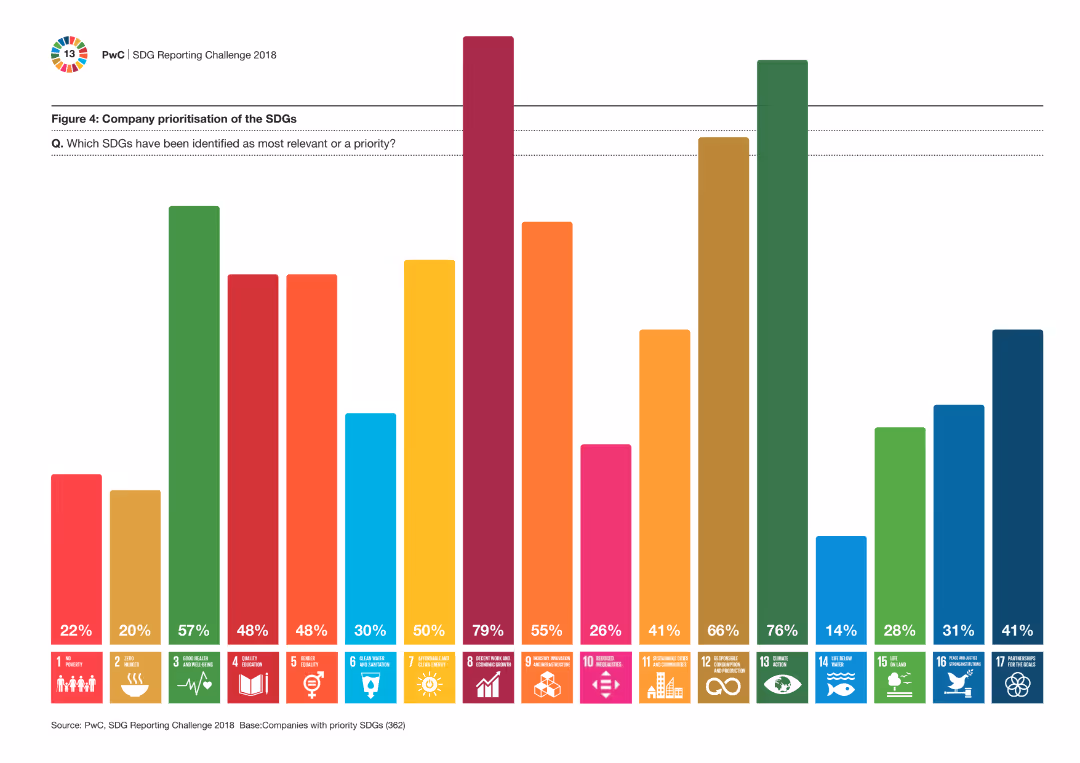
A multi-colored column chart showing the prioritization of various SDGs by companies. Each SDG is represented by a distinct color and percentage, providing a visual representation of company focus areas.
Strategic Planning
Financial Services
This slide highlights which Sustainable Development Goals (SDGs) are prioritized by companies, showing the most relevant and high-priority goals through a colorful visual representation.
SDGs, prioritization, companies, strategic, goals
false
Strategic Planning
Financial Services
Single Chart
PwC/Strategy&
Add to my slides
Remove from favorites
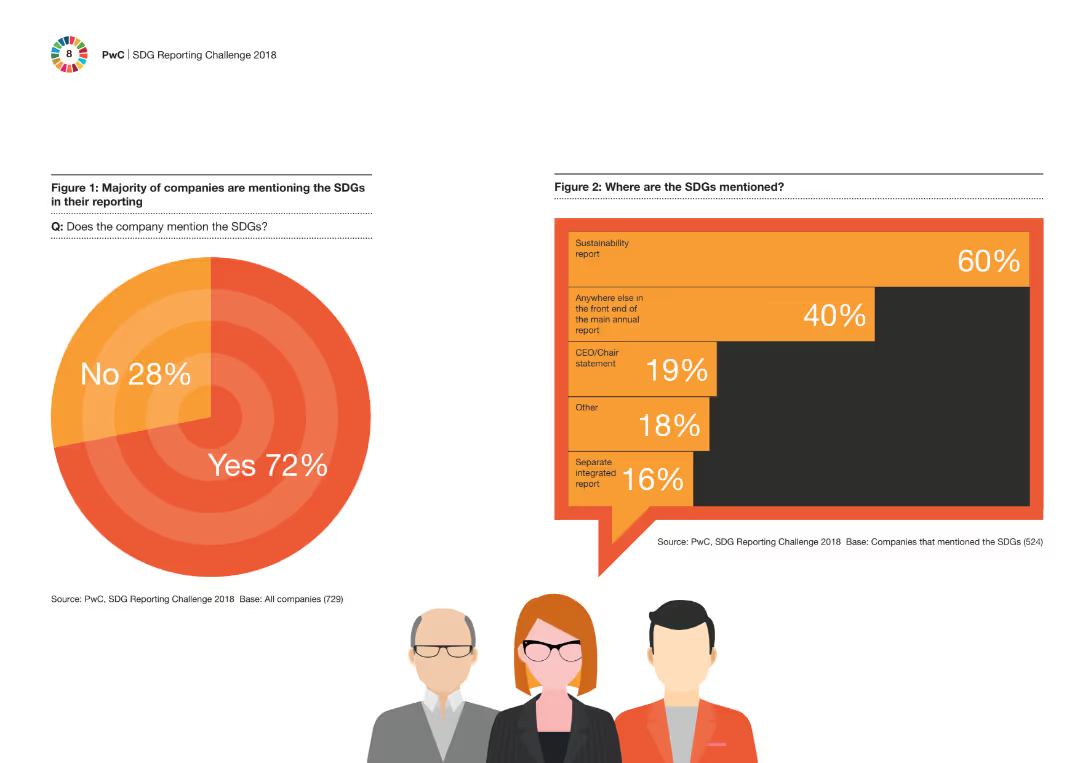
Two column charts presenting data on the extent of SDG mention in company reporting and where they are mentioned. Simple visual layout with one column chart on each side of the slide.
Regulatory and Compliance
Financial Services
This slide shows that the majority of companies mention the Sustainable Development Goals (SDGs) in their reporting, detailing where within the reports these mentions are most frequently found.
SDGs, reporting, companies, compliance, sustainability
false
Regulatory and Compliance
Financial Services
Multiple Chart
PwC/Strategy&
Add to my slides
Remove from favorites
Circular diagram split into four quadrants with icons, focused on strategic business values from SDGs.
Strategic Planning
Government & Public Sector
Highlights four strategic directions from SDGs for business value: growth, risk, return on investment, and organizational performance.
SDGs, strategic directions, business value, growth, risk management
false
Strategic Planning
Government & Public Sector
Framework
McKinsey
Add to my slides
Remove from favorites
Diagram with three main sections: Inspire, Engage, Impact, with supporting icons and text.
Strategic Planning
Environmental Services & Sustainability
Offers a structured guide to inspire and engage executives in SDG strategy implementation, measuring impact via surveys.
SDGs, strategic implementation, executive engagement, guide, impact measurement
false
Strategic Planning
Environmental Services & Sustainability
Pillar
McKinsey
Add to my slides
Remove from favorites
Text-heavy with bullet points, iconography for emphasis, blue and gray color scheme.
Organizational Structure and Change
Professional Services
Discusses the challenges and strategies for successfully implementing SDG-focused plans in businesses.
SDGs, strategic planning, business challenges, organizational change
false
Organizational Structure and Change
Professional Services
Table
McKinsey
Add to my slides
Remove from favorites
Features three numbered steps with corresponding icons, describing the process of operationalizing SDG initiatives, including templates, timelines, and tracking methods.
Strategic Planning
Professional Services
Offering a strategic blueprint, this slide outlines essential steps to operationalize and measure the impact of SDG initiatives, aiming to enhance clarity and accountability in sustainability efforts within corporate strategies.
SDGs, Strategic Planning, Operationalization, Impact Measurement, Accountability
false
Strategic Planning
Professional Services
Pillar
McKinsey
Add to my slides
Remove from favorites
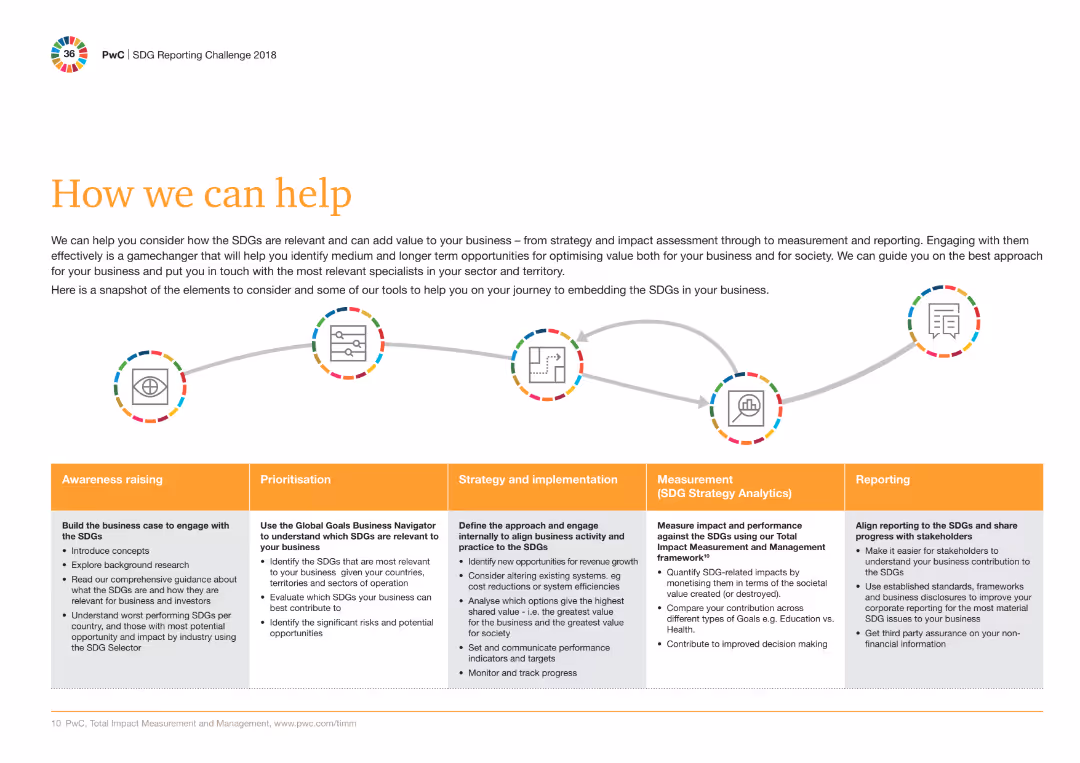
A sequence of five circular icons connected by arrows, each representing a different phase: Awareness raising, Prioritisation, Strategy and implementation, Measurement, Reporting.
Strategic Planning
Professional Services
The slide outlines the approach for embedding SDGs in businesses, highlighting steps from awareness raising to reporting with corresponding actions and tools.
SDGs, Strategy, Implementation, Reporting, Measurement, Tools, Awareness, Business, Value, Specialists
false
Strategic Planning
Professional Services
Mixed Chart
PwC/Strategy&
Add to my slides
Remove from favorites
This slide features a bar chart showing the relevance of various SDGs among Danish executives, coupled with a key takeaway box emphasizing SDG 12, 8, 13, 9, and 3 as most relevant to businesses.
Market Analysis and Trends
Professional Services
The slide displays survey results from Danish executives highlighting the perceived relevance of SDGs to their businesses, emphasizing SDGs related to responsible production, economic growth, and climate action as most pertinent.
SDGs, survey, Danish executives, business relevance
false
Market Analysis and Trends
Professional Services
Single Chart
McKinsey
Add to my slides
Remove from favorites
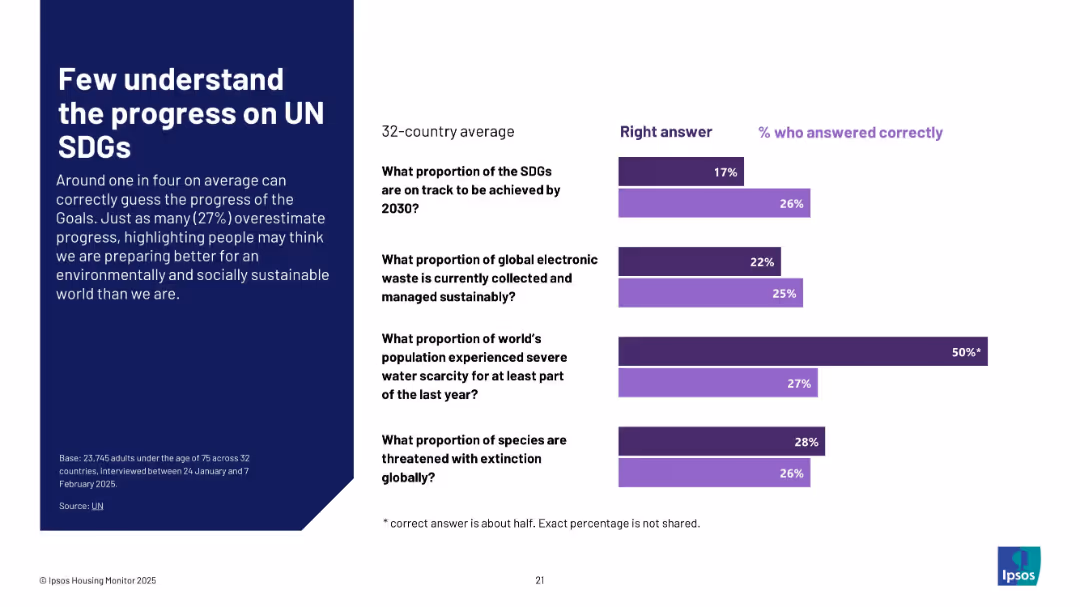
Bar chart comparing actual correct answers to % of people answering correctly across four sustainability-related questions
Regulatory and Compliance
Education & Training
This slide highlights a global gap in awareness regarding progress on UN Sustainable Development Goals. Less than a quarter of people correctly identify real metrics on SDGs, electronic waste, water scarcity, and species extinction.
SDGs, sustainability, awareness, public knowledge, Ipsos, education, UN goals, global average, environmental metrics
false
Regulatory and Compliance
Education & Training
Mixed Chart
IPSOS
Add to my slides
Remove from favorites
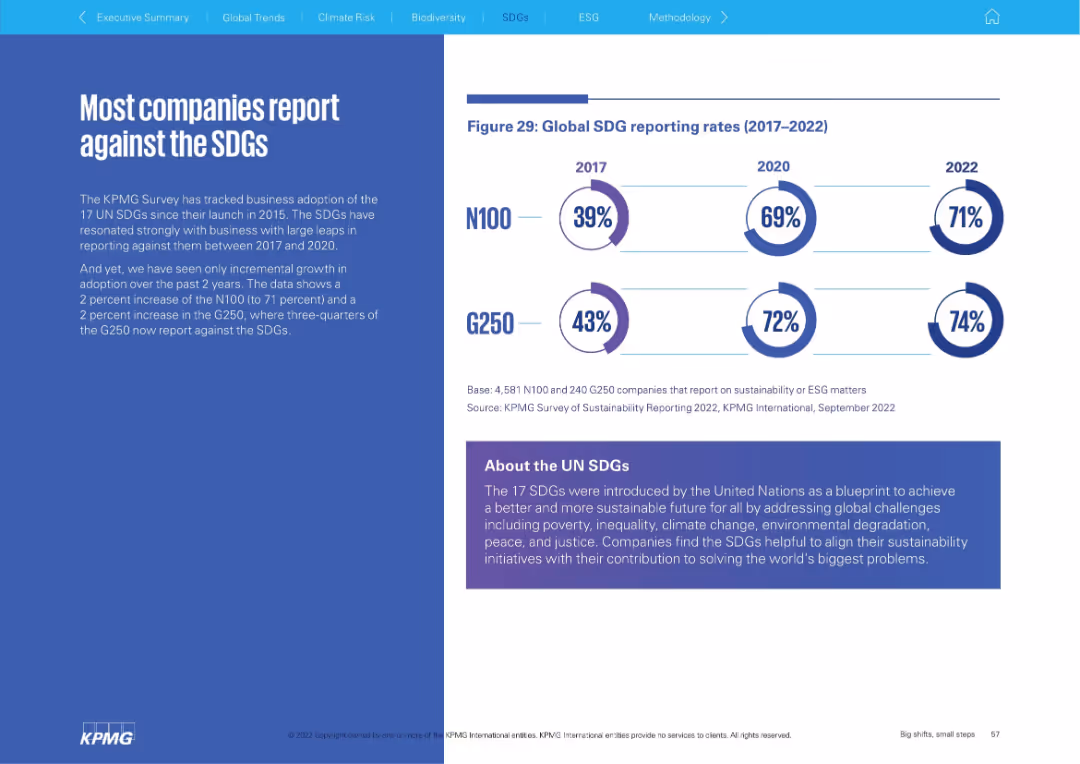
Left: narrative explanation; Right: circular infographic showing SDG reporting rates (2017–2022) for N100 and G250. Bottom panel explains SDGs.
Regulatory and Compliance
Environmental Services & Sustainability
The slide shows a high and gradually increasing rate of corporate reporting against the UN Sustainable Development Goals (SDGs). It explains the relevance of SDGs and highlights that three-quarters of G250 companies now report against them.
SDGs, sustainability goals, reporting, UN, ESG, corporate responsibility
false
Regulatory and Compliance
Environmental Services & Sustainability
Mixed Chart
KPMG
Add to my slides
Remove from favorites
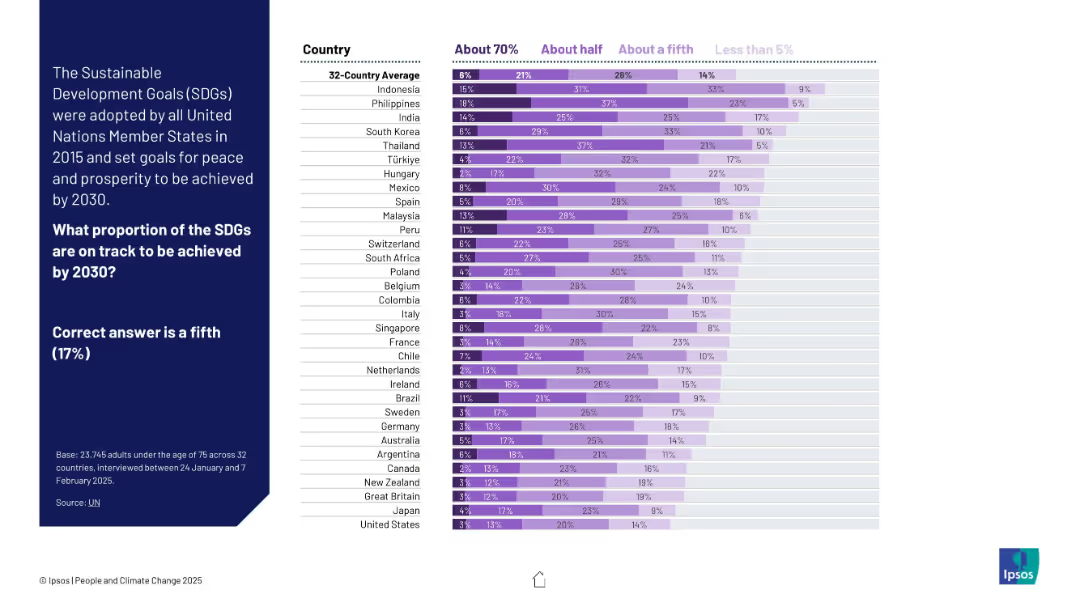
Stacked bar chart using shades of purple to show estimates across countries. Left panel provides correct answer (17%) for reference.
Industry Overview
Government & Public Sector
The chart shows how people estimate progress toward UN Sustainable Development Goals by 2030. Many overestimate; few select the accurate proportion (about one-fifth).
SDGs, sustainable development, UN goals, public awareness, global perception, Ipsos, progress tracking, purple chart, development targets, 2030 goals
false
Industry Overview
Government & Public Sector
Mixed Chart
IPSOS
Add to my slides
Remove from favorites
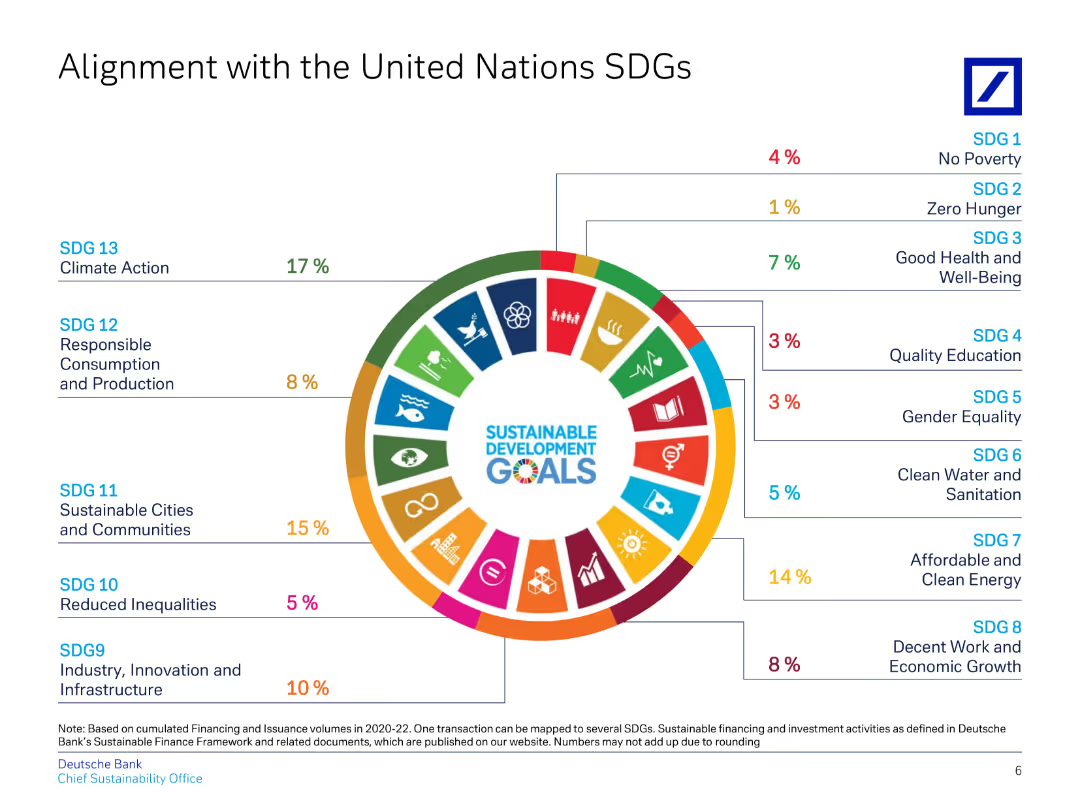
This slide uses a circular diagram to align Deutsche Bank's initiatives with various UN Sustainable Development Goals (SDGs).
Regulatory and Compliance
Financial Services
Highlights Deutsche Bank's contributions to specific UN SDGs, detailing percentages for each goal, showcasing commitment to ESG.
SDGs, UN, alignment, sustainability, ESG
false
Regulatory and Compliance
Financial Services
Single Chart
Deutsche Bank
Add to my slides
Remove from favorites
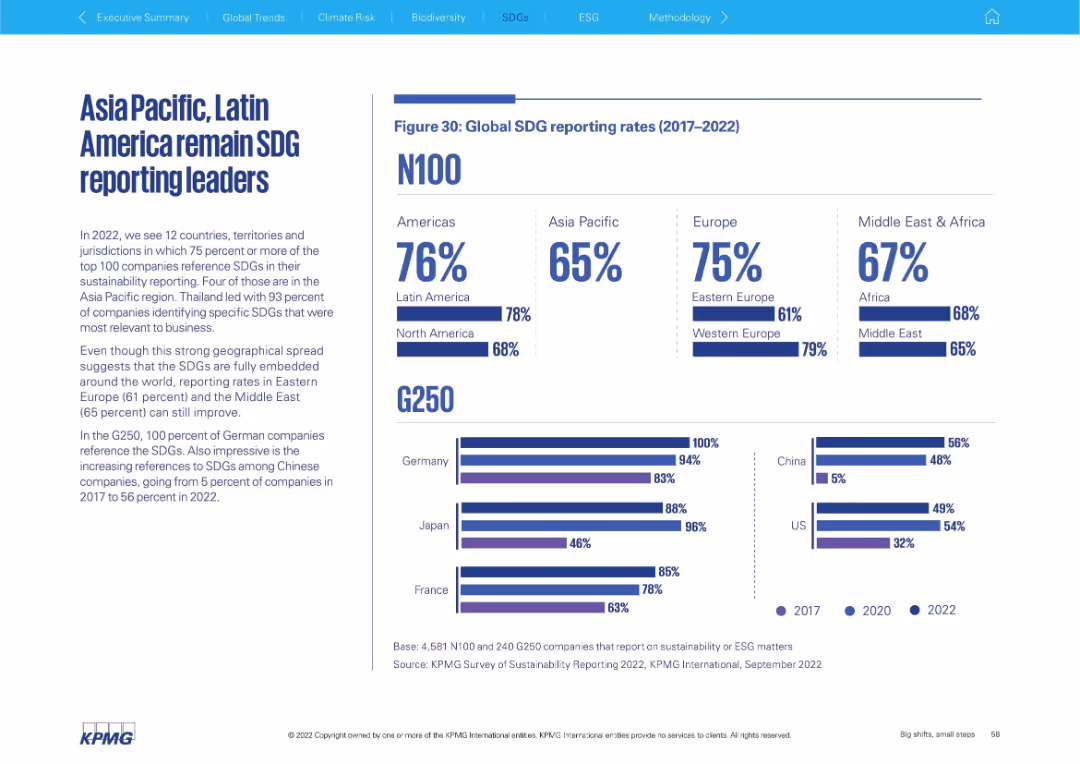
Two-column layout with text on the left and a data-rich infographic on the right, including bar graphs and percentage stats comparing global SDG reporting by region and country.
Strategic Planning
Professional Services
This slide presents SDG reporting rates globally (2017–2022), highlighting regional leaders and laggards. It compares N100 and G250 companies by region and includes national-level insights, notably Germany’s 100% G250 reporting rate and China’s rapid growth.
SDG, sustainability, G250, N100, regional comparison, ESG, Latin America, Asia Pacific, Europe, corporate reporting
false
Strategic Planning
Professional Services
Multiple Chart
KPMG
Add to my slides
Remove from favorites
This slide features a complex table correlating SDG goals with business metrics like new markets, sustainable operations, and risk management, indicating areas of high and low potential for value creation with color shading.
Strategic Planning
Professional Services
Discusses how businesses perceive the potential for value creation through responsible consumption and production, decent work, and partnerships, according to SDGs, focusing on sectors with significant operational and strategic impacts.
SDGs, value creation, business strategy, operational efficiency
false
Strategic Planning
Professional Services
Table
McKinsey
Add to my slides
Remove from favorites
The slide is text-centric with a table format highlighting stages of the software development life cycle (SDLC) and corresponding technologies. Each technology is paired with a real-world company example, and the layout is direct with a clear delineation of information, utilizing minimal design elements for clarity.
Technology and Digital Transformation
Technology & Software
Highlighting successful industry applications of next-gen software development tools, this slide gives examples of companies like Decathlon and Atlassian leveraging technologies such as infrastructure-as-code and AI-based reviews. It serves as a practical insight into how these tools are applied in business contexts.
SDLC, Case Studies, Software Development, Infrastructure-as-Code, AI, Atlassian, Decathlon
false
Technology and Digital Transformation
Technology & Software
Header Vertical
McKinsey
Add to my slides
Remove from favorites
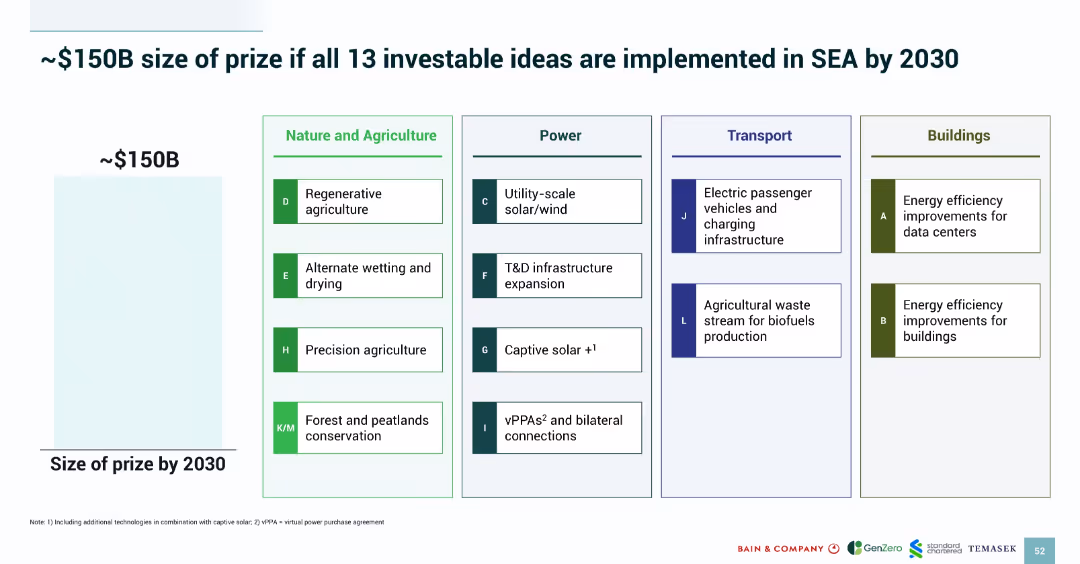
Grid-style layout categorizing 13 priority ideas by sector: Nature & Agriculture, Power, Transport, Buildings; left side shows potential value.
Strategic Planning
Environmental Services & Sustainability
The slide estimates a ~$150B opportunity if 13 prioritized green investments are implemented across SEA by 2030. It categorizes each idea under sectors like agriculture and power, listing initiatives such as solar, biofuels, and energy-efficient buildings. A visual grid aids clarity and sector association.
SEA 2030 strategy, investment opportunity, decarbonization, priority ideas, emissions reduction, value projection
false
Strategic Planning
Environmental Services & Sustainability
Mixed Chart
Bain
Add to my slides
Remove from favorites
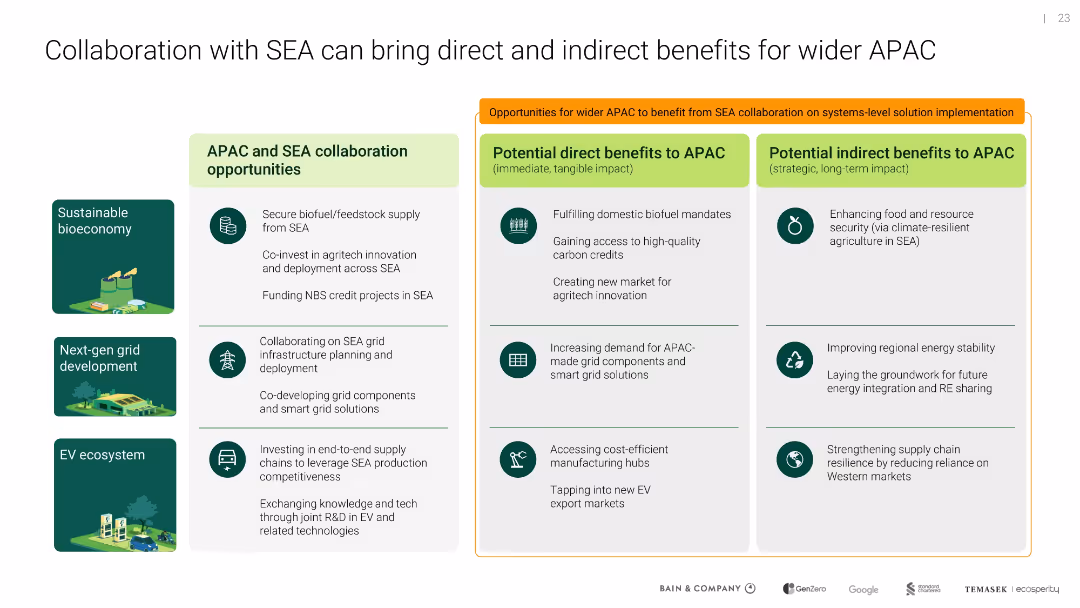
Three-column layout with icons; left shows collaboration areas, middle shows direct benefits, right lists indirect benefits
Sales and Business Development
Environmental Services & Sustainability
Outlines mutual benefits of SEA-APAC collaboration in bioeconomy, energy, and EV infrastructure, with both immediate market and long-term stability impacts for the broader region.
SEA, APAC, collaboration, energy grid, EV, bioeconomy, benefits
false
Sales and Business Development
Environmental Services & Sustainability
Table
Bain
Add to my slides
Remove from favorites
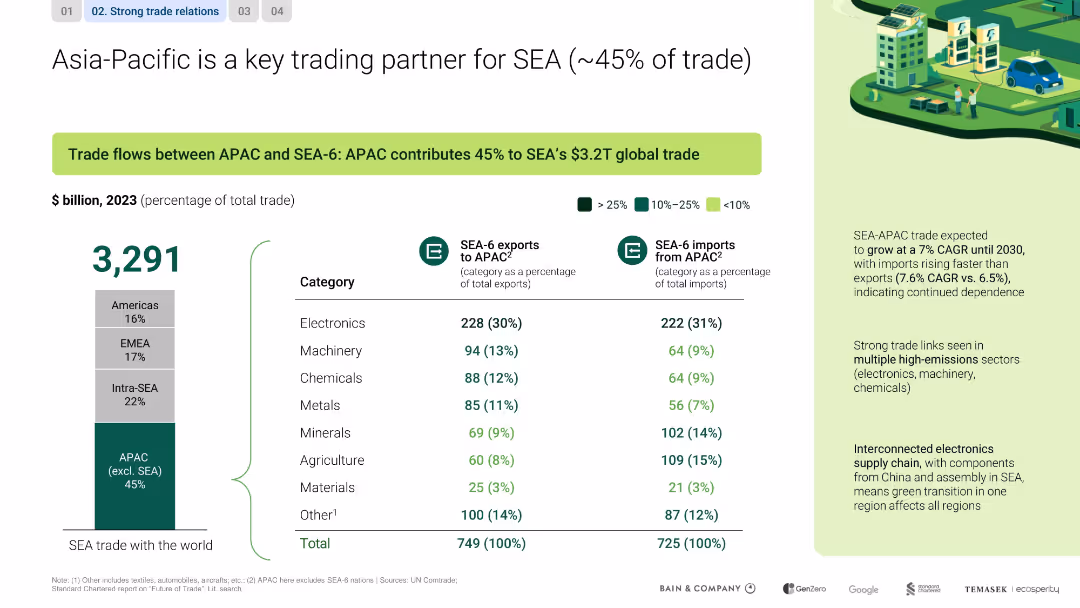
Split layout with left-side chart and right-side analysis; includes data table, bar graph, and callout highlights
Market Analysis and Trends
Transportation & Logistics
This slide emphasizes APAC’s dominant share (45%) in SEA’s global trade, highlighting electronics, machinery, and chemicals. It notes strong trade growth (7% CAGR) and interdependence in electronics supply chains between regions.
SEA, APAC, trade, electronics, CAGR, interdependence, supply chain
false
Market Analysis and Trends
Transportation & Logistics
Mixed Chart
Bain
Add to my slides
Remove from favorites
Includes column charts and bar graphs detailing the growth and segmentation of SEA’s carbon market, highlighted with annotations for clarity.
Market Analysis and Trends
Environmental Services & Sustainability
Analyzes the growth trends of the voluntary carbon market in SEA, emphasizing forestry credits and future projections, useful for investors and policy makers in environmental sectors.
SEA, carbon market, growth, voluntary, forestry credits, projections, column charts, bar graphs, annotations, investment
false
Market Analysis and Trends
Environmental Services & Sustainability
Multiple Chart
Bain
Add to my slides
Remove from favorites
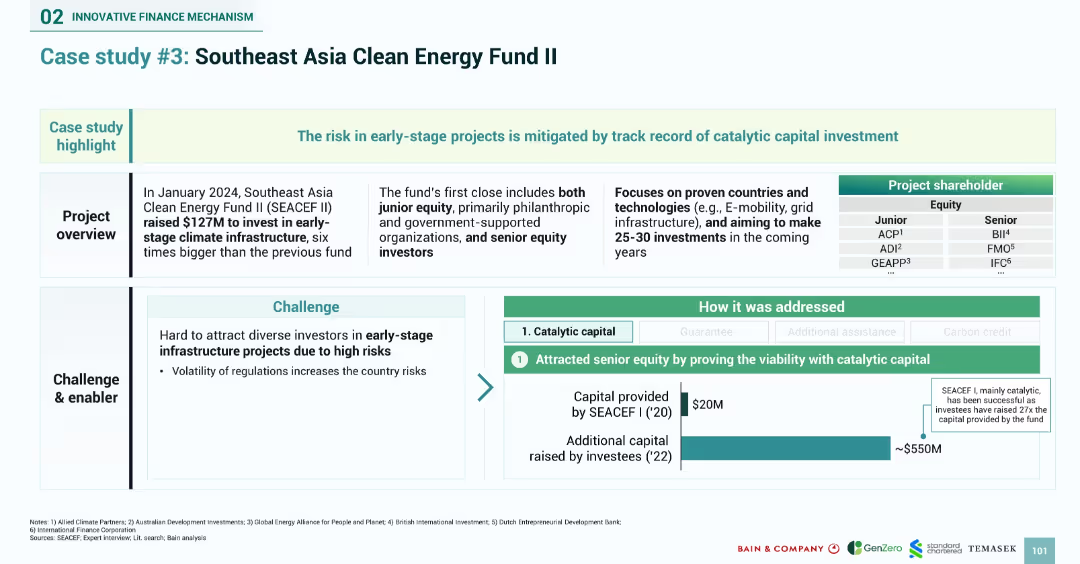
Split layout with a boxed project overview, fund structure (junior/senior equity), and bar graph showing capital leverage. Key challenges and solutions listed below.
Investment Analysis
Financial Services
Presents the Southeast Asia Clean Energy Fund II (SEACEF II) as a catalytic capital model for early-stage infrastructure. Describes how $127M raised in 2024 aims to support 25–30 projects by using junior equity to attract senior equity. Addresses the challenge of high-risk perception by showing 27x capital leverage from original SEACEF I investments.
SEACEF, catalytic capital, infrastructure fund, clean energy, equity investment, Southeast Asia, case study, blended finance
false
Investment Analysis
Financial Services
Mixed Chart
Bain
Add to my slides
Remove from favorites
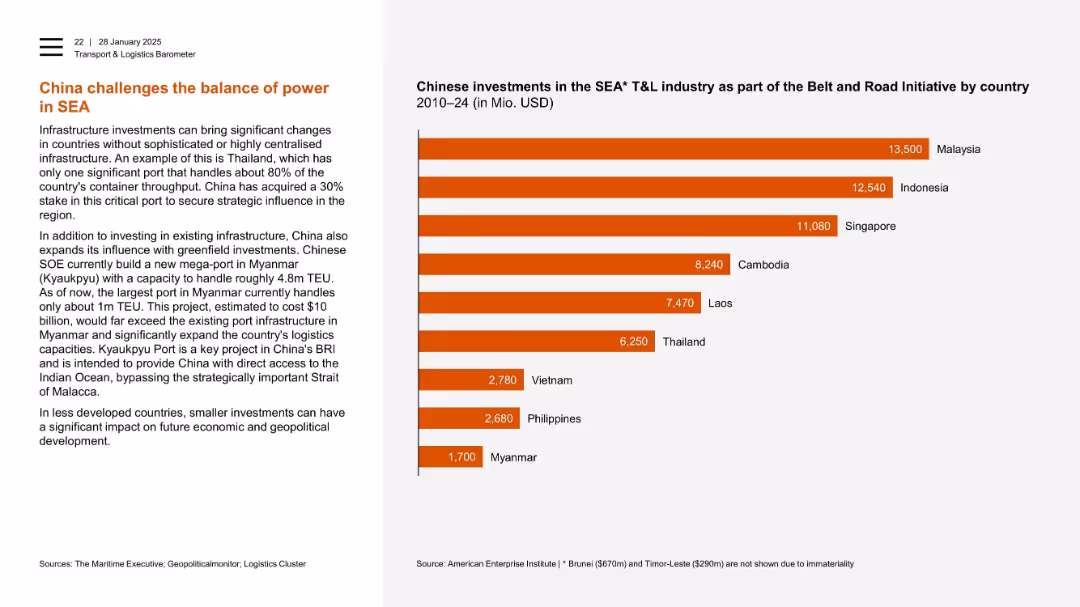
Left-aligned text with horizontal bar chart on right ranking investments by country.
Strategic Planning
Transportation & Logistics
China’s influence in Southeast Asia’s logistics is illustrated through investments in strategic ports. A chart ranks Malaysia, Indonesia, and Singapore as top recipients. Myanmar’s Kyaukpyu port is a key future asset, underscoring China’s regional ambitions.
SEA, Chinese investment, ports, Myanmar, Kyaukpyu, Thailand, infrastructure, geopolitical influence
false
Strategic Planning
Transportation & Logistics
Mixed Chart
PwC/Strategy&
Add to my slides
Remove from favorites
Slide presents multiple bar graphs. Color-coded elements distinguish different data sets and regions. Clear, structured layout with annotations.
Market Analysis and Trends
Environmental Services & Sustainability
This slide analyzes South East Asia's climate commitments compared to global benchmarks using graphs showing emissions changes, carbon pricing, and corporate climate ambitions. Aimed at environmental policy analysts.
SEA, climate, emissions, carbon pricing, NDC, corporate ambitions, global comparison, bar graphs, column charts, map
false
Market Analysis and Trends
Environmental Services & Sustainability
Multiple Chart
Bain
Add to my slides
Remove from favorites
This slide has a column chart illustrating the deal values for SEA, with a distinction between unicorn and other deals, as well as the number of deals annually and for half-years. It features a clear title and key points in a side text block.
Market Analysis and Trends
Financial Services
Analyzes the deal landscape in Southeast Asia, noting a significant increase in deal values and the influx of global capital. It comments on the positive outlook due to tech company activities, enhancing investor confidence in the region.
SEA, deal value, unicorn, global capital, investment confidence
false
Market Analysis and Trends
Financial Services
Single Chart
Bain
Add to my slides
Remove from favorites
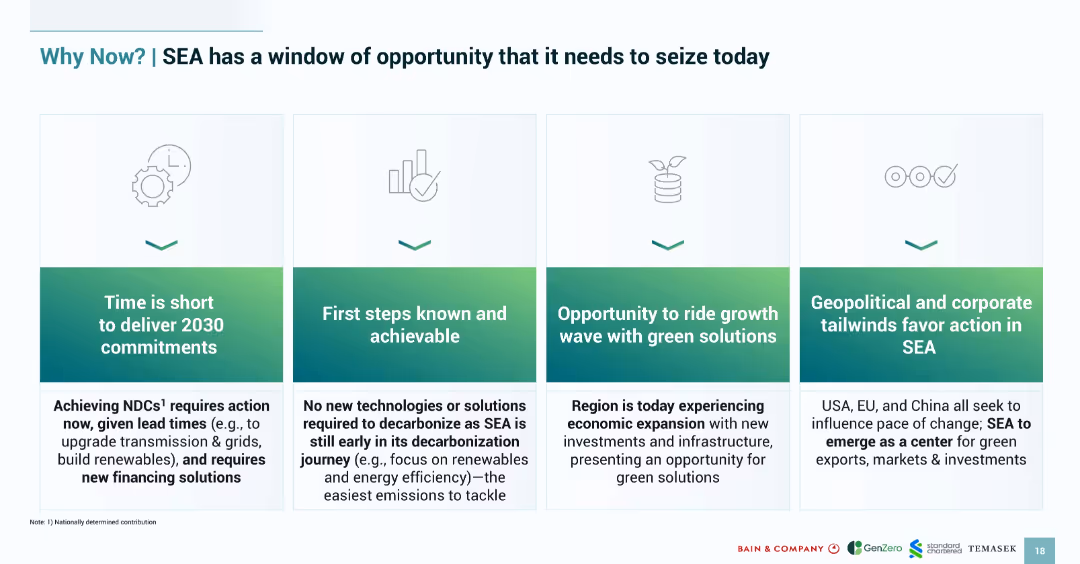
Four-tile layout with icons and captions outlining urgent reasons for SEA to act on green transition; soft green gradient background.
Strategic Planning
Environmental Services & Sustainability
Lays out four reasons why Southeast Asia must act now on decarbonization: short timelines, actionable steps, economic growth synergy, and geopolitical support. Emphasizes urgency and achievability.
SEA, decarbonization, urgency, opportunity, strategic timing, green transition
false
Strategic Planning
Environmental Services & Sustainability
Pillar
Bain
Add to my slides
Remove from favorites
Column charts with blue bars represent the digital economy GMV of SEA countries from 2022 to 2030.
Market Analysis and Trends
Technology & Software
The slide shows projected growth in the digital economy GMV for different SEA countries, highlighting Vietnam and the Philippines.
SEA, digital economy, GMV, growth forecast, Vietnam, Philippines
false
Market Analysis and Trends
Technology & Software
Multiple Chart
Bain
Add to my slides
Remove from favorites
The slide presents a clear and structured column chart showcasing the trend of SEA-based dry powder funds over five years. The design is minimal with a distinct separation of sections and prominent titles.
Investment Analysis
Financial Services
This slide analyzes the growth of SEA-based dry powder funds from 2016 to 2020, indicating a positive trend and setting the stage for continued deal activity in 2021 and beyond. The $14B dry powder in the region signifies a strong investment landscape.
SEA, Dry Powder, Funds, Investment, Growth
false
Investment Analysis
Financial Services
Single Chart
Bain
Add to my slides
Remove from favorites
This slide displays two sets of column charts for the years 2015 and 2025, indicating eComm market sizes and percentages.
Market Analysis and Trends
Retail & E-commerce
The slide presents a forecast for the eComm market growth in SEA by 2025, focusing on the increase in market value and percentage of retail. Indonesia's significant market share is highlighted, as are the growth rates for other SEA countries.
SEA, eCommerce, Indonesia, growth, forecast
false
Market Analysis and Trends
Retail & E-commerce
Multiple Chart
Bain
Add to my slides
Remove from favorites
Slide includes stacked column charts depicting sectorial carbon emissions across SEA countries, complemented by a pie chart showing regional emissions distribution.
Market Analysis and Trends
Environmental Services & Sustainability
Provides a detailed visual breakdown of carbon emissions by sector in SEA, essential for environmental researchers and policy makers focusing on targeted emission reduction strategies.
SEA, emissions, carbon, sectors, bar graphs, pie chart, energy, agriculture, forestry, land use change, data presentation
false
Market Analysis and Trends
Environmental Services & Sustainability
Multiple Chart
Bain
Add to my slides
Remove from favorites
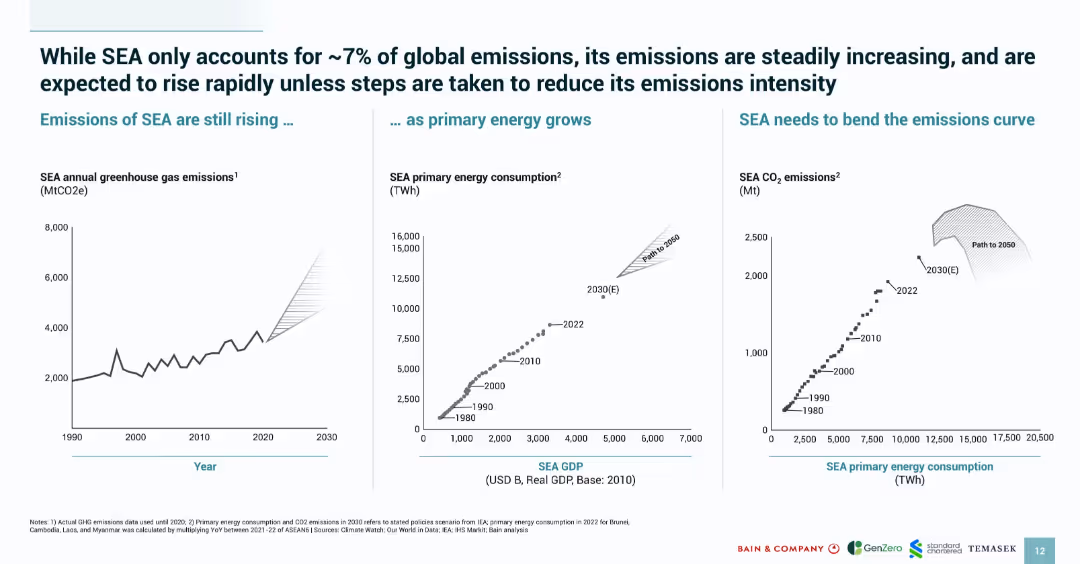
Three-panel graph layout with emission trends, GDP vs. energy, and energy vs. CO₂; green-blue branding with minimal text.
Risk Assessment and Management
Environmental Services & Sustainability
Shows SEA’s increasing greenhouse emissions linked to growing energy consumption and economic activity. Warns that emissions will rise significantly unless curve is bent by 2050. Serves as a call to action for emission intensity reduction.
SEA, emissions, CO₂, energy consumption, GDP, risk, sustainability
false
Risk Assessment and Management
Environmental Services & Sustainability
Multiple Chart
Bain
Add to my slides
Remove from favorites
Detailed slide with multiple bar charts, graphs, and text annotations reviewing SEA's current status and the gap to meeting global emissions targets.
Regulatory and Compliance
Government & Public Sector
Analyzes the shortcomings in SEA's efforts to meet global climate commitments, emphasizing the need for increased action and policy adjustments.
SEA, emissions gap, climate targets, policy adjustments, bar charts
false
Regulatory and Compliance
Government & Public Sector
Multiple Chart
Bain
Add to my slides
Remove from favorites
The slide contains a mix of textual content and icons representing environmental and economic challenges, including emissions data and investment needs. It's structured to emphasize the strategic planning required to address these issues.
Strategic Planning
Environmental Services & Sustainability
Discusses the strategic environmental and economic challenges faced by Southeast Asia, highlighting the region's need to address a significant emission gap and the financial investment required to meet sustainability goals by 2030.
SEA, emissions, investment, sustainability, strategic planning
false
Strategic Planning
Environmental Services & Sustainability
Header Horizontal
Bain
Add to my slides
Remove from favorites
Vertical stacked bar chart visualizing 2020 GHG emissions in Southeast Asia by category and sub-sources; minimal text.
Market Analysis and Trends
Environmental Services & Sustainability
Visual representation of emission sources in Southeast Asia in 2020. Major contributors include land use change, power, cement, and livestock. Aims to inform investment decisions by showing emission-heavy sectors.
SEA, emissions, land use, cement, power, livestock, GHG, chart
false
Market Analysis and Trends
Environmental Services & Sustainability
Single Chart
Bain
Add to my slides
Remove from favorites
Incorporates a detailed comparative chart mapping out emissions targets and carbon policies across several SEA countries.
Regulatory and Compliance
Government & Public Sector
Discusses the formation of national climate ambitions within SEA, focusing on emissions targets and carbon pricing strategies.
SEA, emissions targets, carbon pricing, climate policy
false
Regulatory and Compliance
Government & Public Sector
Table
Bain
Add to my slides
Remove from favorites
The slide presents a blue and white color scheme with a column chart showing the SEA food delivery GMV from 2019 to 2025, including a CAGR percentage. Text blocks provide additional insights aligned with bullet points. The layout is clear, utilizing both graphical and textual information efficiently.
Market Analysis and Trends
Technology & Software
This slide provides an overview of the food delivery market growth in Southeast Asia, highlighting trends during and after the pandemic, consumer behavior changes, and strategic focus areas for companies for sustainable growth. It's suitable for market analysis and strategy planning.
SEA, food delivery, pandemic, market growth, consumer behavior, profitability, underpenetrated market, sustainability
false
Market Analysis and Trends
Technology & Software
Mixed Chart
Bain
Add to my slides
Remove from favorites
Column charts comparing GDP growth and inflation rates.
Market Analysis and Trends
Technology & Software
Compares SEA's economic resilience to other regions, useful in evaluating regional economic stability and investment potential.
SEA, GDP growth, inflation rates, economic stability, comparative analysis
false
Market Analysis and Trends
Technology & Software
Multiple Chart
Bain
Add to my slides
Remove from favorites
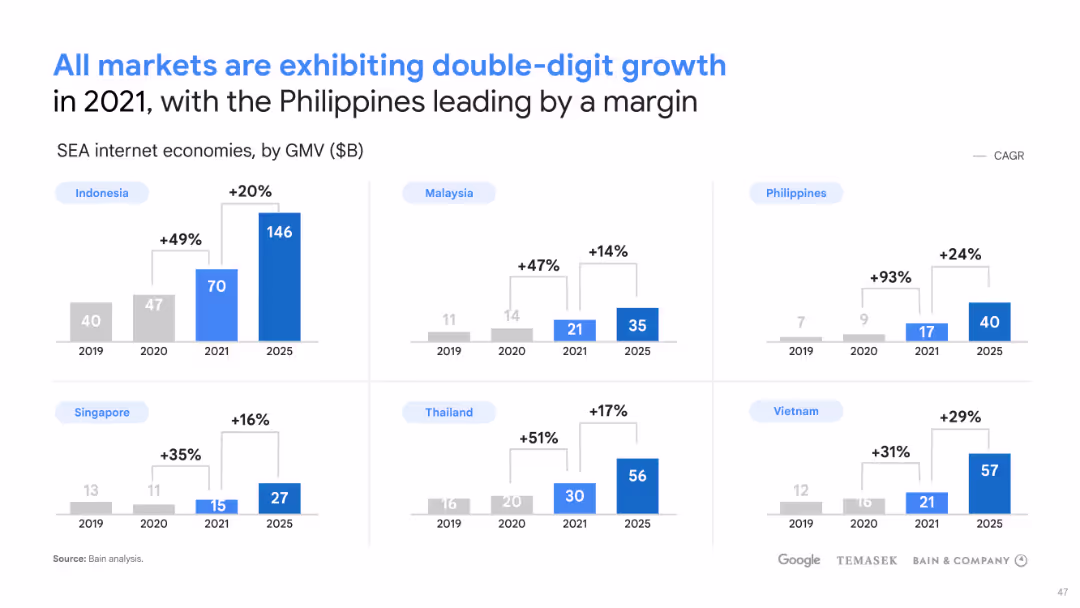
The slide has a title at the top, six paired bars (column charts) with projections for 2021, 2030 high case, and 2030 base case. Below each pair is the name of a Southeast Asian country. On the right side are bulleted points with projections for each country’s internet economy growth. The slide is clean, with a white background and blue elements.
Market Analysis and Trends
Technology & Software
This slide provides a comparison of the projected internet economy GMV in various Southeast Asian countries for 2030. It serves as an analytical tool for understanding the potential economic scale and growth in different SEA markets, making it useful for strategic planning and investment decisions targeting these regions' internet economies.
SEA, GMV, 2030, Internet Economy, Growth Projections, Indonesia, Malaysia, Philippines, Singapore, Thailand, Vietnam
false
Market Analysis and Trends
Technology & Software
Multiple Chart
Bain
Add to my slides
Remove from favorites
This slide displays column charts for internet economy sizes by country with projected growth. Colored bars represent different years.
Financial Performance
Financial Services
The slide shows historical and projected growth in Gross Merchandise Volume (GMV) for Southeast Asian internet economies. It highlights the Philippines' significant lead in growth, indicating a potential focus area for market investment and expansion strategies.
SEA, GMV, Growth, Internet, Economy
false
Financial Performance
Financial Services
Multiple Chart
Bain
Add to my slides
Remove from favorites
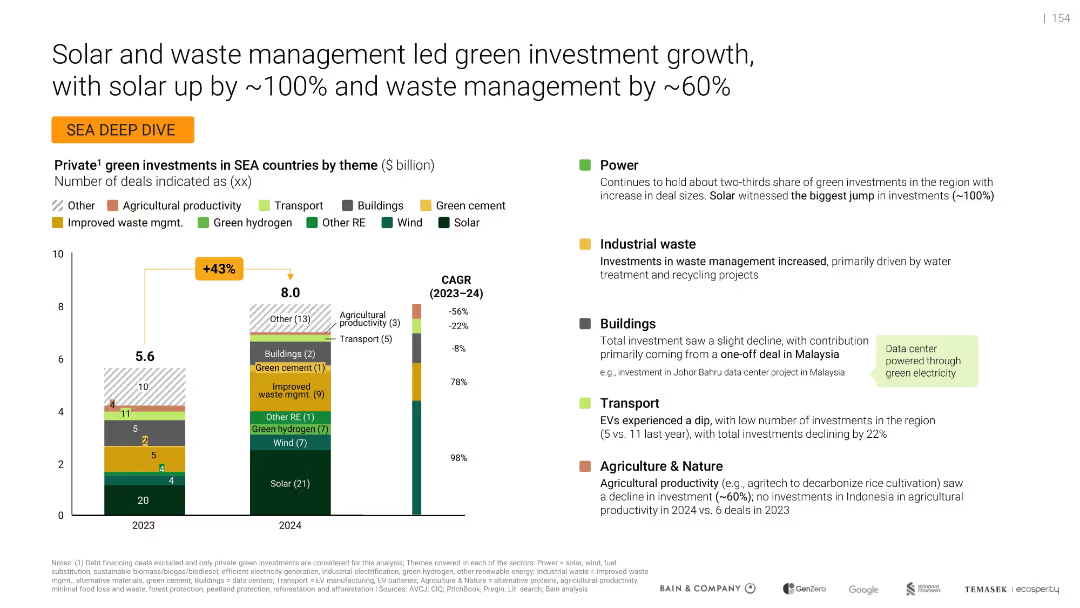
Vertical bar charts with CAGR callouts; text commentary on sector-level trends
Market Analysis and Trends
Environmental Services & Sustainability
Analyzes green investment trends in SEA from 2023–2024. Solar investments nearly doubled while waste management rose 60%. Transport investments declined. Key investment themes include renewables and industrial waste, with commentary on sector performance and country-specific highlights.
SEA, green investment, solar, waste management, CAGR, transport, industrial waste, renewables, buildings
false
Market Analysis and Trends
Environmental Services & Sustainability
Mixed Chart
Bain
Add to my slides
Remove from favorites
Slide with a stacked column chart showing the growth of the SEA Internet economy GMV from 2015, projecting significant growth by 2025, categorized by sectors like e-Commerce and Online Travel.
Financial Performance
Technology & Software
Presents the growth trajectory of the SEA Internet economy, highlighting resilience and future potential in various digital sectors, important for investment and economic forecasts.
SEA, Internet economy, GMV, growth, e-Commerce, Online Travel, forecast, resilience
false
Financial Performance
Technology & Software
Single Chart
Bain
Add to my slides
Remove from favorites
The slide shows a bar chart with VC investment percentages relative to GDP in different regions and a descriptive text block.
Investment Analysis
Financial Services
Highlighting the investment needed to grow the SEA internet economy to $200 billion, the slide compares VC investment as a percentage of GDP among various regions.
SEA, internet economy, investment, VC, GDP
false
Investment Analysis
Financial Services
Single Chart
Bain
Add to my slides
Remove from favorites
Includes two column charts and a map visualizing internet user growth in SEA compared to other regions and countries, with descriptive text boxes.
Market Analysis and Trends
Technology & Software
Analysis of the Southeast Asian internet market, highlighting its rapid growth with a focus on Indonesia. The use of column charts and regional maps illustrates the comparative analysis with other countries.
SEA, internet, growth, Indonesia, column chart, comparative
false
Market Analysis and Trends
Technology & Software
Multiple Chart
Bain
Add to my slides
Remove from favorites
Slide features colored blocks diagramming key strategies for SEA's Net Zero journey, including energy transition and nature valuation, with supportive icons.
Strategic Planning
Environmental Services & Sustainability
Outlines strategic initiatives for achieving Net Zero in SEA, focusing on energy, agriculture, and waste management, useful for environmental strategists and policy makers.
SEA, Net Zero, strategy, energy transition, nature valuation, waste management, diagram, strategic planning, icons
false
Strategic Planning
Environmental Services & Sustainability
Pillar
Bain
Add to my slides
Remove from favorites
Showcases multiple corporate profiles detailing their sustainability commitments and strategies with visual aids like logos and icons.
Market Analysis and Trends
Environmental Services & Sustainability
Details the sustainability strategies and commitments of leading SEA companies in their journey to Net Zero, targeting corporate strategists and sustainability advocates.
SEA, Net Zero, sustainability, corporate strategies, case studies, visual aids, profiles, commitments, corporate
false
Market Analysis and Trends
Environmental Services & Sustainability
Table
Bain
Add to my slides
Remove from favorites
Features line graphs for travel-related search trends in six SEA countries against a dashed line indicating average pre-pandemic interest. The layout is uncluttered, prioritizing clarity.
Market Analysis and Trends
Hospitality & Tourism
Highlights the resurgence in online travel interest in SEA countries, comparing current search trends to pre-pandemic levels to predict market demand.
SEA, online travel, search trends, market demand, pre-pandemic levels, Indonesia, Malaysia, Philippines
false
Market Analysis and Trends
Hospitality & Tourism
Multiple Chart
Bain
Add to my slides
Remove from favorites
Features a timeline layout with icons and brief descriptions of significant environmental and policy announcements across SEA countries.
Industry Overview
Government & Public Sector
Highlights key environmental and policy initiatives taken by SEA countries over the past year to address climate and sustainability challenges.
SEA, policy, environmental initiatives, timeline, climate strategy
false
Industry Overview
Government & Public Sector
Vertical Flow
Bain
Add to my slides
Remove from favorites
This slide includes a box plot and a column chart showing the distribution of average daily time spent on search engines. Two tables provide detailed statistics about the time and proportion of online time spent on search engines.
Market Analysis and Trends
Technology & Software
The slide presents information on the average daily time spent on Search Engines, with detailed statistics including mean, median, and percentile distributions, based on data from Ipsos Iris Clickstream Data.
Search Engines, Daily Time, Statistics, Box Plot, Column Chart
false
Market Analysis and Trends
Technology & Software
Mixed Chart
IPSOS
Add to my slides
Remove from favorites
Six line graphs showing search volumes for food delivery services, indexed to 2016 levels, with annotations for specific multipliers. Each graph represents a different country.
Market Analysis and Trends
Technology & Software
Provides insight into the search trends for food delivery services over several years across different countries. Useful for understanding the growth of interest in food delivery and market potential for e-commerce in the food sector.
Search trends, Food delivery services, Market analysis, E-commerce growth, Indexed data
false
Market Analysis and Trends
Technology & Software
Multiple Chart
Bain
Add to my slides
Remove from favorites
Includes text descriptions with accompanying icons related to survey insights on hospital priorities in SEA.
Market Analysis and Trends
Healthcare & Pharmaceuticals
Provides an overview of an annual survey conducted by L.E.K. to understand hospital priorities in the SEA region, highlighting key decision areas.
SEA region, hospital priorities, survey, healthcare, MedTech
false
Market Analysis and Trends
Healthcare & Pharmaceuticals
Diagram
LEK
Add to my slides
Remove from favorites
Contains bullet points and icons related to renewables, electric mobility, and sustainable farming, aligned in a clear, engaging format.
Strategic Planning
Environmental Services & Sustainability
Provides insights into future investment focuses in Southeast Asia, particularly in sustainable and renewable sectors.
SEA, renewable energy, investment focus, sustainability, strategic planning
false
Strategic Planning
Environmental Services & Sustainability
Header Vertical
Bain
Add to my slides
Remove from favorites
The slide features a line chart showing average grain exports by month for Australia, Ukraine, and Canada. The chart uses blue lines to differentiate between the countries. Text is present on the right side with bullet points explaining the seasonal patterns and opportunities for Australian grain exports.
Market Analysis and Trends
Agriculture & Food Production
The slide explains the seasonal patterns of Australian grain exports compared to the Northern Hemisphere, highlighting opportunities for export during specific months. It discusses the counter-cyclical nature of exports and the importance of timing in maximizing value.
Seasonal exports, grain export patterns, market opportunity, Northern Hemisphere, counter-cyclical export patterns
false
Market Analysis and Trends
Agriculture & Food Production
Mixed Chart
LEK
Add to my slides
Remove from favorites
Slide with number 2, several column charts showing startups by country and stage, a pie chart depicting startup distribution by sector, and bullet points summarizing the data.
Market Analysis and Trends
Technology & Software
This slide offers a detailed view of startups in Southeast Asia, focusing on their distribution across countries, development stages, and sectors. It highlights the concentration of startups in Singapore, Indonesia, and Vietnam, mainly in the eCommerce sector, reflecting market trends and potential investment targets.
SEA, startups, concentration, stages, eCommerce, market distribution, sector analysis
false
Market Analysis and Trends
Technology & Software
Multiple Chart
Bain
Add to my slides
Remove from favorites
Dense layout with column chart and icons detailing corporate sustainability efforts and partnerships across the SEA region.
Strategic Planning
Government & Public Sector
Outlines the roles of businesses in SEA in advancing sustainability, including commitments, partnerships, and innovations.
SEA, sustainability, business leadership, corporate initiatives
false
Strategic Planning
Government & Public Sector
Mixed Chart
Bain
Add to my slides
Remove from favorites
Icons detailing significant sustainability milestones and regional collaboration efforts within SEA nations.
Industry Overview
Government & Public Sector
Reviews recent sustainability progress and ongoing challenges in Southeast Asia, emphasizing the need for further efforts towards achieving Net Zero.
SEA, sustainability, government actions, regional collaboration, Net Zero
false
Industry Overview
Government & Public Sector
Header Vertical
Bain
Add to my slides
Remove from favorites
Contains icons and brief text blocks in a clean layout highlighting key opportunities for SEA in sustainability sectors like energy, nature, and corporate structure.
Market Analysis and Trends
Environmental Services & Sustainability
Discusses SEA's potential for sustainability leadership, focusing on renewable energy, infrastructural improvements, and corporate roles in sustainability, targeting business strategists and environmental advocates.
SEA, sustainability, renewable energy, corporate strategies, icons, opportunities, market analysis, text blocks, clean layout
false
Market Analysis and Trends
Environmental Services & Sustainability
Pillar
Bain
Add to my slides
Remove from favorites
Features a column chart detailing SEA transport GMV ($B) with projected figures from 2019 to 2025 and accompanying CAGR. A blue and white design, text is arranged in bullet points next to yellow markers for easy reading.
Market Analysis and Trends
Transportation & Logistics
Discusses the post-pandemic recovery of the SEA transport sector, emphasizing the uptick in mobility and associated profitability, with strategic insights on overcoming market challenges and achieving growth.
SEA, transport, recovery, mobility, profitability, supply shortages, penetration, urbanization
false
Market Analysis and Trends
Transportation & Logistics
Mixed Chart
Bain
Add to my slides
Remove from favorites
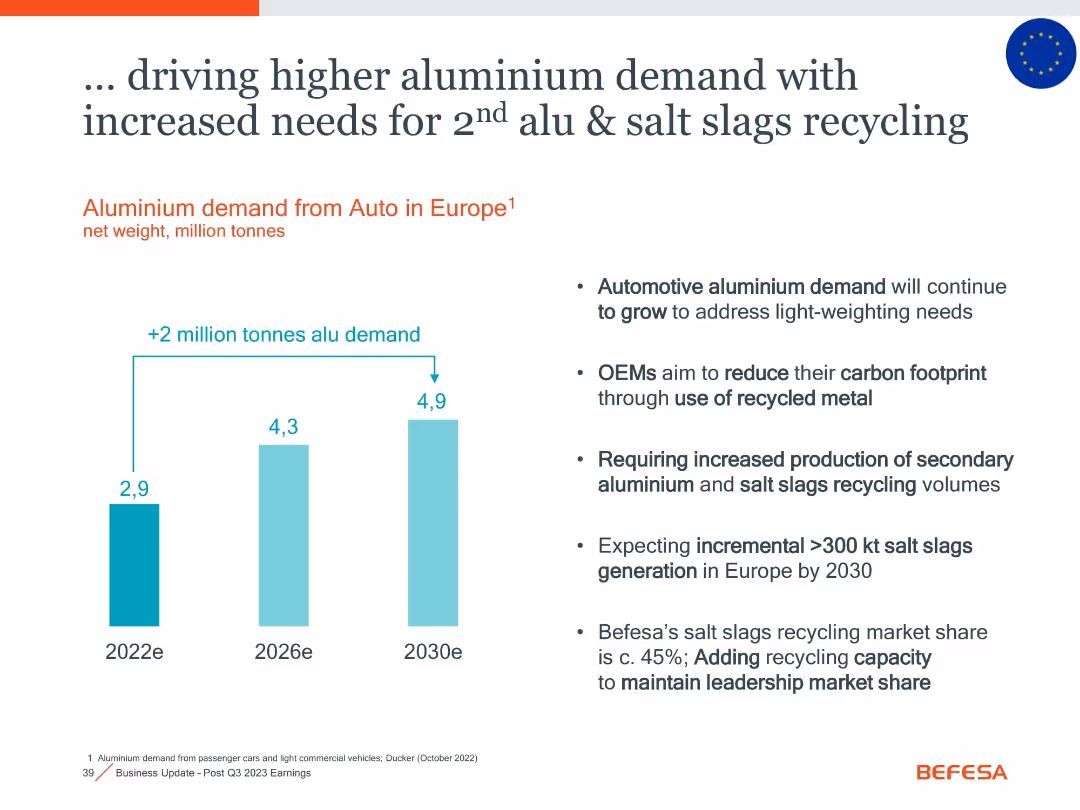
Bar chart showing aluminium demand growth 2022e–2030e; right-hand text describes OEMs’ goals and recycling growth
Product and Service Analysis
Industrial & Manufacturing
Projects 2 million tonne increase in European auto aluminium demand by 2030, emphasizing OEM carbon reduction through recycled metal and salt slags. Underscores Befesa’s leadership and capacity plans.
secondary aluminium, OEM, recycling, salt slags, demand growth, automotive, sustainability
false
Product and Service Analysis
Industrial & Manufacturing
Mixed Chart
Goldman Sachs
Add to my slides
Remove from favorites
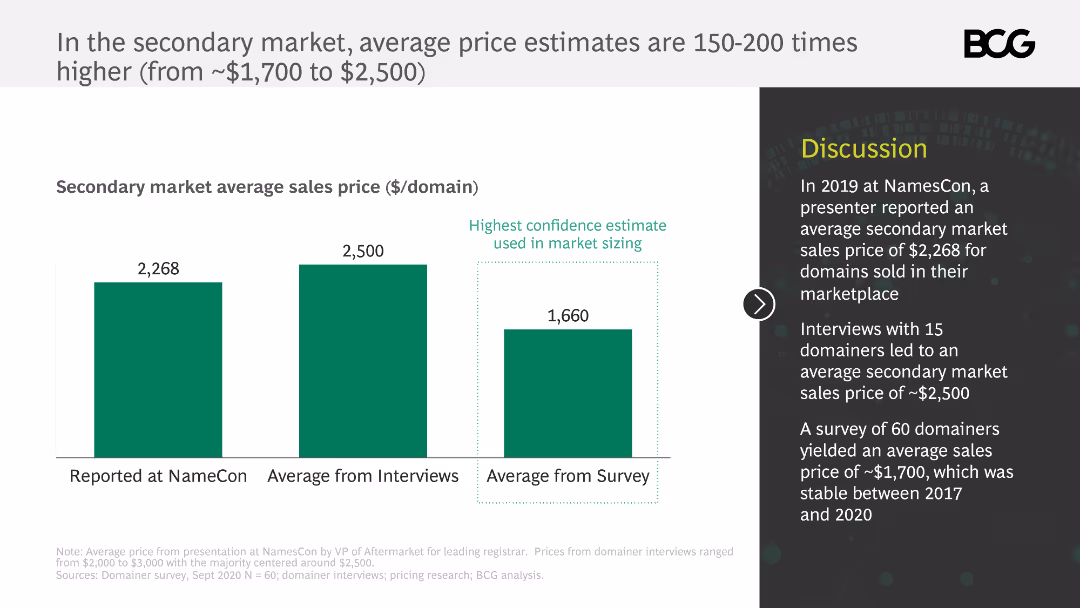
The slide presents three column charts comparing secondary market average sales prices from NameCon, interviews, and surveys. The highest confidence estimate is highlighted.
Market Analysis and Trends
Retail & E-commerce
It compares average secondary market sales prices from different sources, indicating the range and highest confidence estimate used for market sizing.
secondary market, average price, sales, estimates, domains
false
Market Analysis and Trends
Retail & E-commerce
Mixed Chart
BCG
Add to my slides
Remove from favorites
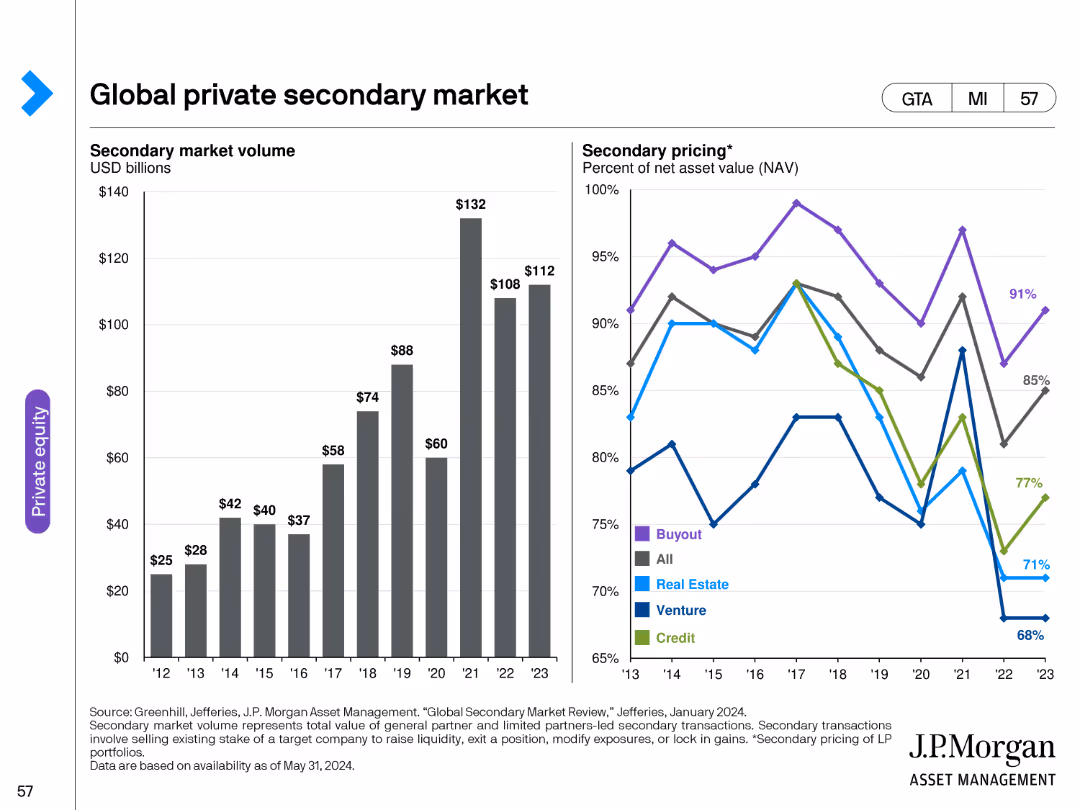
This slide includes a column chart showing secondary market volume and a line chart depicting secondary pricing trends for various investment types.
Market Analysis and Trends
Financial Services
It examines the global private secondary market, providing data on market volume and pricing trends across different types of secondary transactions.
secondary market, global, volume, pricing, trends, investment types, data analysis, financial
false
Market Analysis and Trends
Financial Services
Multiple Chart
JP Morgan
Add to my slides
Remove from favorites
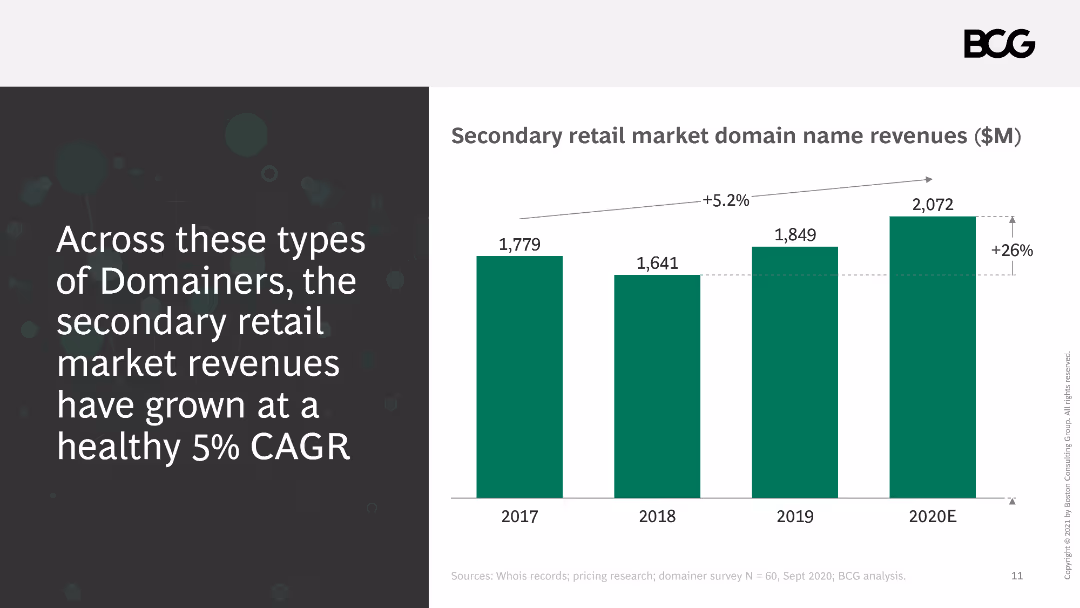
The slide features a column chart illustrating the growth of secondary retail market domain name revenues from 2017 to 2020E. Observations are noted on the left.
Market Analysis and Trends
Retail & E-commerce
It highlights the steady growth in secondary retail market domain name revenues, driven by various types of domainers, with a CAGR of 5%.
secondary market, revenue, domainers, CAGR, growth
false
Market Analysis and Trends
Retail & E-commerce
Mixed Chart
BCG
Add to my slides
Remove from favorites
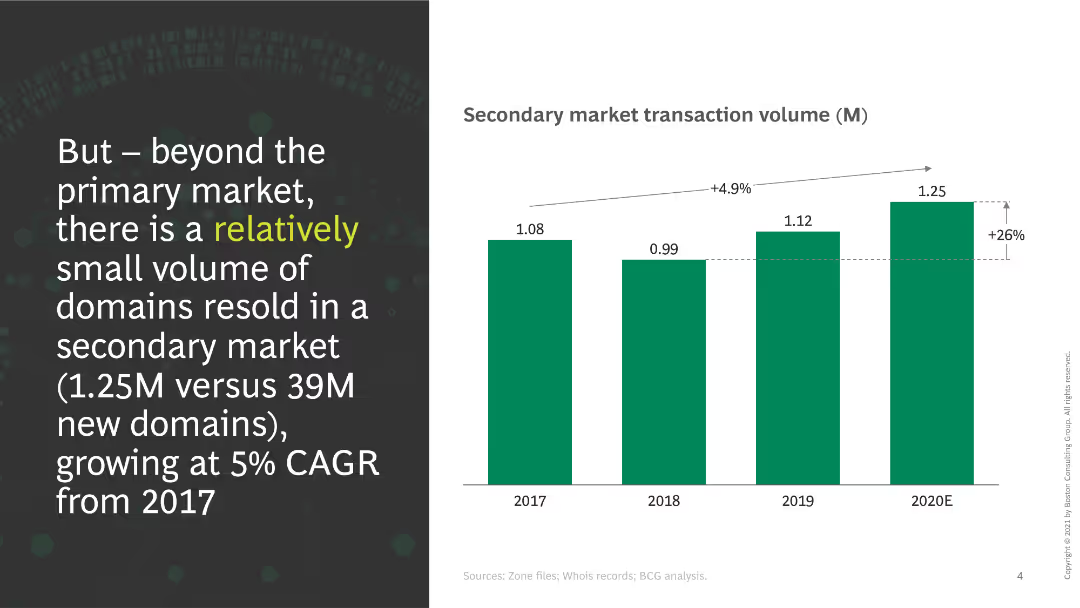
This slide shows a column chart indicating secondary market transaction volumes from 2017 to 2020E. A significant increase in transactions is noted, with a CAGR of 5%.
Market Analysis and Trends
Retail & E-commerce
The slide discusses the volume of domains resold in the secondary market, emphasizing the growth rate and the small volume compared to the primary market.
secondary market, transactions, growth, domains, volume, CAGR
false
Market Analysis and Trends
Retail & E-commerce
Mixed Chart
BCG
Add to my slides
Remove from favorites
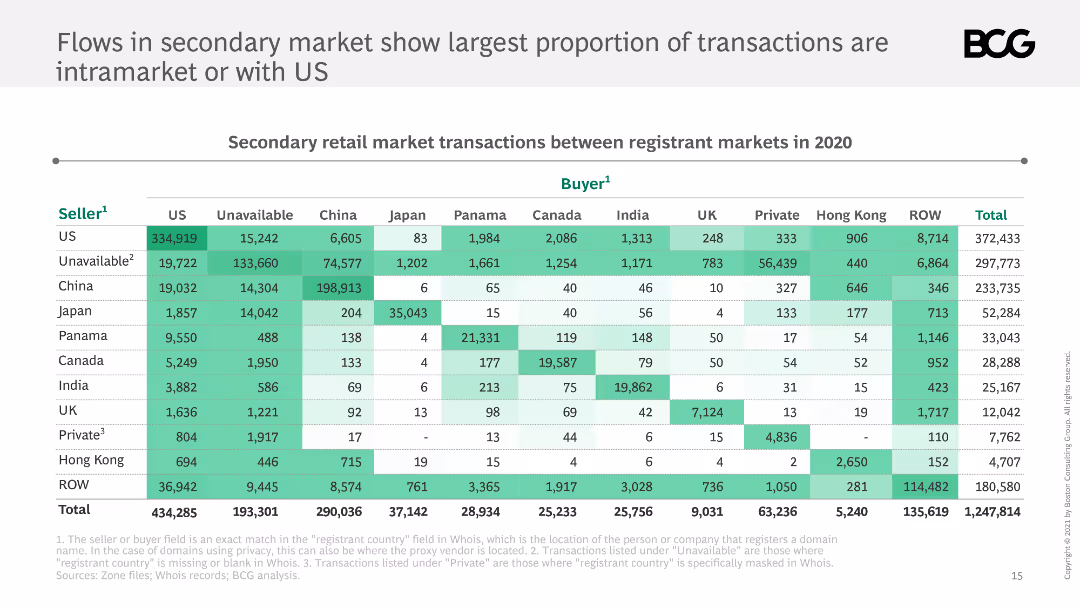
The slide features a table showing secondary retail market transactions between registrant markets in 2020. The table is color-coded with shades of green indicating transaction volumes.
Market Analysis and Trends
Financial Services
This slide presents data on secondary retail market transactions between various registrant markets in 2020, highlighting that the largest proportion of transactions are intramarket or with the US.
secondary market, transactions, registrant markets, US, 2020, intramarket, table, data visualization, BCG
false
Market Analysis and Trends
Financial Services
Table
BCG
Add to my slides
Remove from favorites
Previous
Next
You don't have any favorites yet.
Please wait loading your favorites slides...
Create a FREE account to continue browsing
Receive Instant Access to 1,000+ slides from companies like McKinsey, Google, and Goldman Sachs
First Name
Last Name
Email
Password
I agree to all
Terms & Privacy Policy
Thank you! Your submission has been received!
Oops! Something went wrong while submitting the form.
Have an account?
Sign in
Upgrade to PRO to Save slides
Advanced Search and Filters
Access to 15,000+ slides
Access to Category Pages
Save/Bookmark Slides
PowerPoint Template Library
Pick a Plan
MONTHLY
$12/month
Billed every month, Cancel anytime.
YEARLY
$9/year
Billed $108 annually, Cancel anytime.
Checkout for $12/month
Checkout for $108/yr
Secured by Stripe | AES-256 bit encryption


![Backup] Investable Ideas Assessment: Nature and Agriculture, Power, Transport, Buildings, and Industrial and Waste are the major sources of emissions for SEA](https://cdn.prod.website-files.com/654e70fb59937215cac87b19/6899953ad33fac82f2cba73e_mmbgON3bQK6pWFTjrUO0vLt6dHvW1rEcz_-rQsJtocs.avif)