My Account
My Slides
Search by Category
Pricing
Templates
View All Templates
Download Template Slides
✦ AI Search
Feedback
Login
Logout
Get Started
Browse all Slides
Browse all Slides
Create a FREE Account
Instant access to 1,000+ real slides from top companies like McKinsey, BCG, Goldman Sachs, Google and many more!
First Name
Last Name
Email
Password
I agree to all
Terms & Privacy Policy
Thank you! Your submission has been received!
Oops! Something went wrong while submitting the form.
Have an account?
Sign in
Saved Slides
Total No. of slides saved
0
↻ Refresh
✖ Clear all
Bar charts, color-coded data, comparative analysis.
Financial Performance
Financial Services
Outlines progress towards business targets and the financial returns for shareholders.
Targets, returns, growth, investment banking, equity, overhead, discipline, finance
false
Financial Performance
Financial Services
Table
JP Morgan
Add to my slides
Remove from favorites
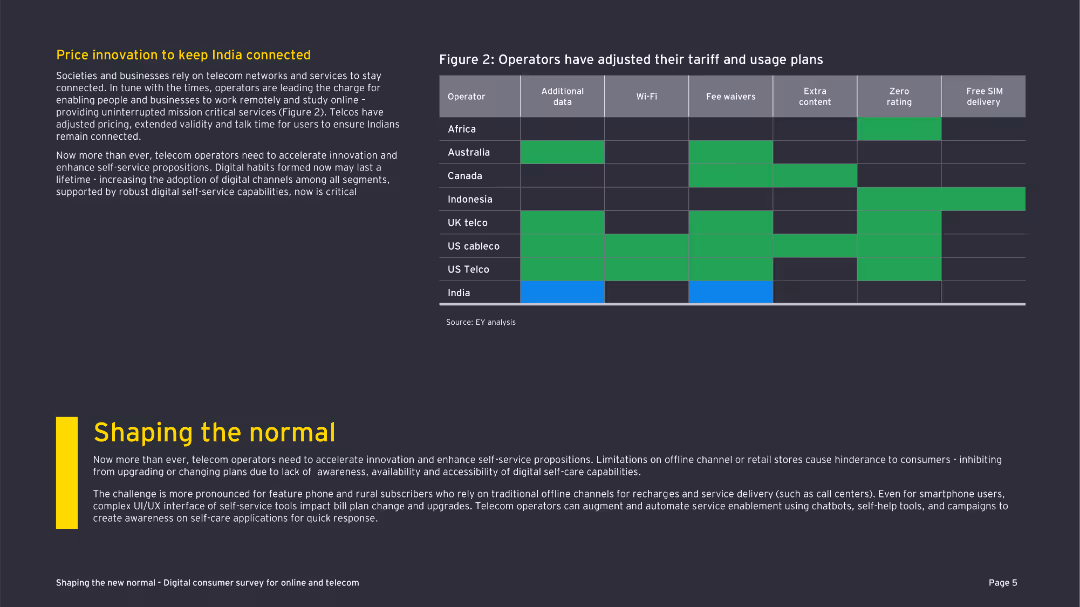
The slide includes a table comparing operators' tariff adjustments and a textual explanation. The visual elements are straightforward but informative.
Market Analysis and Trends
Telecommunications
The slide presents how various telecom operators have adjusted their tariff and usage plans to keep consumers connected during COVID-19.
tariff adjustments, telecom operators, COVID-19, India, connectivity, digital channels, pricing strategies, customer retention
false
Market Analysis and Trends
Telecommunications
Header Vertical
EY
Add to my slides
Remove from favorites
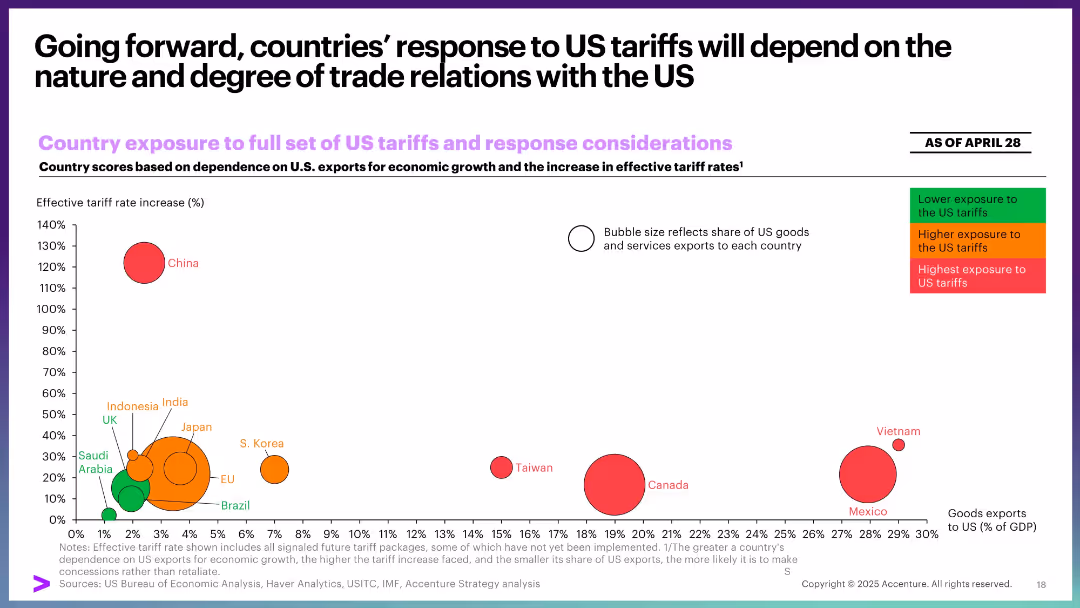
Bubble chart with x-axis for export dependence, y-axis for effective tariff increase, and color-coded exposure risk.
Strategic Planning
Government & Public Sector
This slide visualizes country-specific vulnerability to US tariffs, balancing tariff impact against export reliance. It highlights countries at highest risk (e.g., China, Vietnam) and those more insulated (e.g., Saudi Arabia, Brazil).
tariff exposure, exports, trade relations, country impact, bubble chart, dependence, economic risk
false
Strategic Planning
Government & Public Sector
Single Chart
Accenture
Add to my slides
Remove from favorites
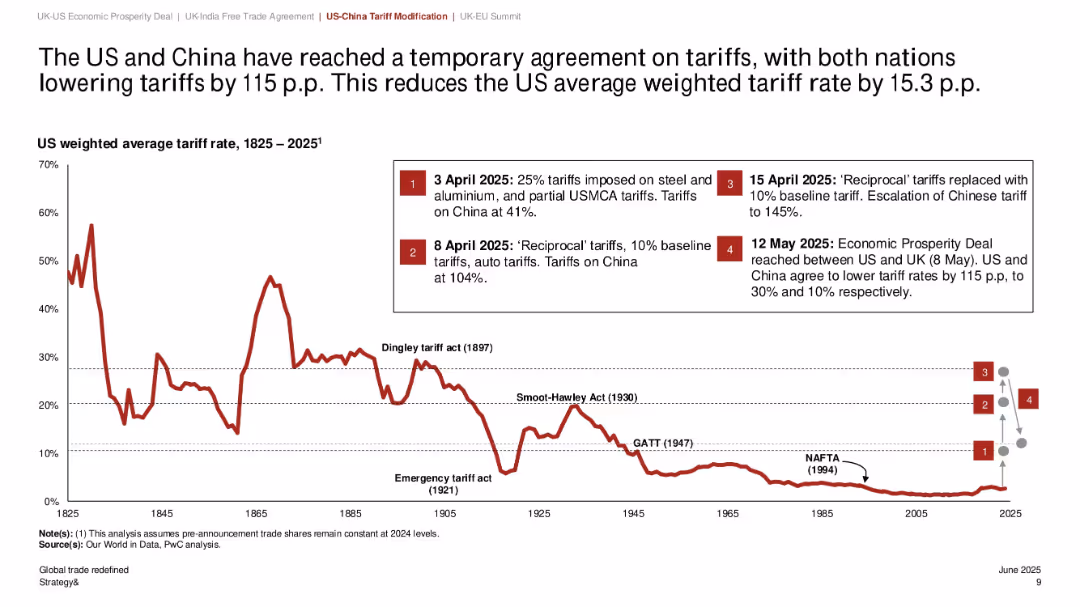
Historical line graph of US weighted average tariff rate from 1825 to 2025; annotations for policy events; red downward trend; right-side callouts summarize April-May 2025 tariff shifts
Regulatory and Compliance
Government & Public Sector
This slide provides historical context and recent developments in US trade policy, focusing on the reduction of tariffs between the US and China. The 2025 agreements lower tariffs by 115 p.p., significantly reducing average tariff rates. Key historical trade acts are also marked to show the evolution of trade liberalization.
tariff history, US-China trade, policy timeline, reciprocal tariffs, Economic Prosperity Deal, weighted average
false
Regulatory and Compliance
Government & Public Sector
Single Chart
PwC/Strategy&
Add to my slides
Remove from favorites
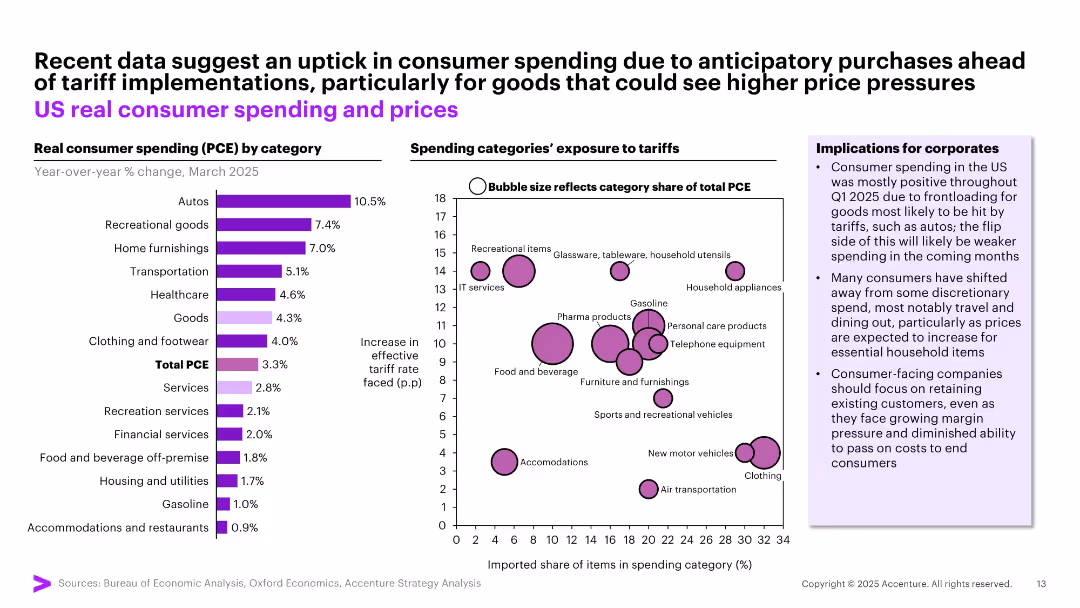
Left: Bar chart of real consumer spending by category. Right: Bubble chart showing spending category exposure to tariffs.
Pricing Strategies
Consumer Goods
Indicates temporary increases in US consumer spending due to anticipatory purchases ahead of tariffs—especially for autos and recreational goods. Accompanied by bubble plot detailing categories most exposed to tariff hikes, highlighting risks and opportunities for pricing strategy.
tariff impact, consumer behavior, pricing, spending categories, strategy
false
Pricing Strategies
Consumer Goods
Multiple Chart
Accenture
Add to my slides
Remove from favorites
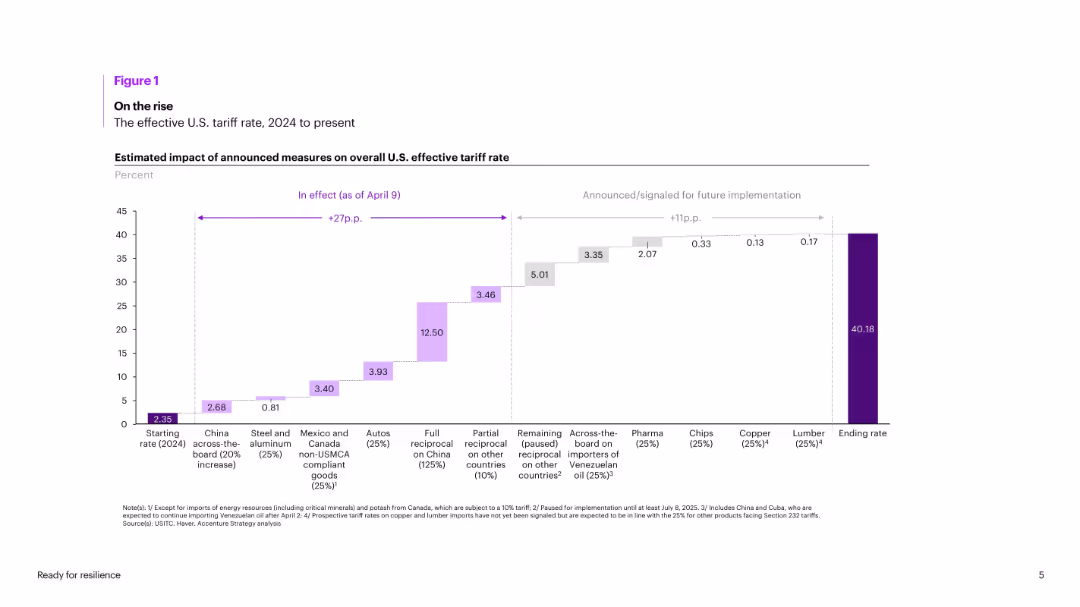
Waterfall chart showing cumulative changes in U.S. effective tariff rates in 2024, categorized by sector/product and implementation phase.
Regulatory and Compliance
Government & Public Sector
Visualizes the stepwise impact of announced tariff measures, starting from 2.35% in 2024 and potentially reaching 40.18%. Highlights include full reciprocity on China, auto tariffs, and future implementation on chips and pharmaceuticals.
tariff rates, U.S., China, trade policy, regulation, autos, steel, pharmaceuticals, chips, implementation
false
Regulatory and Compliance
Government & Public Sector
Single Chart
Accenture
Add to my slides
Remove from favorites
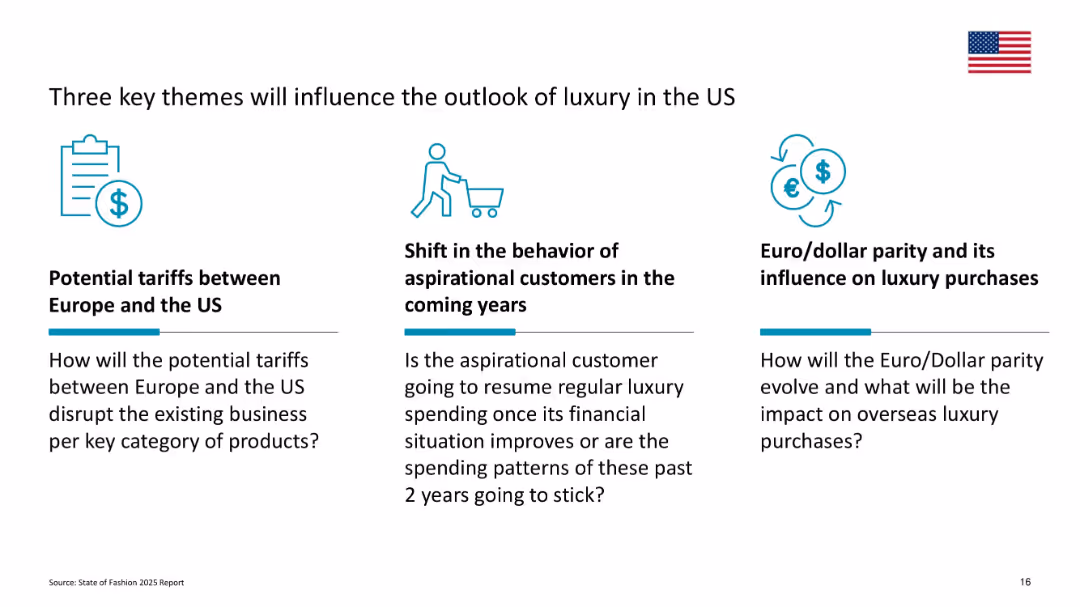
Three-column layout highlighting tariffs, aspirational behavior, and Euro/Dollar parity
Strategic Planning
Consumer Goods
This slide identifies three macroeconomic and consumer behavior themes—trade tariffs, consumer behavior shifts, and currency parity—that may affect the future of US luxury.
tariffs, aspirational consumers, dollar parity, macro themes, US outlook, purchasing behavior
false
Strategic Planning
Consumer Goods
Pillar
McKinsey
Add to my slides
Remove from favorites
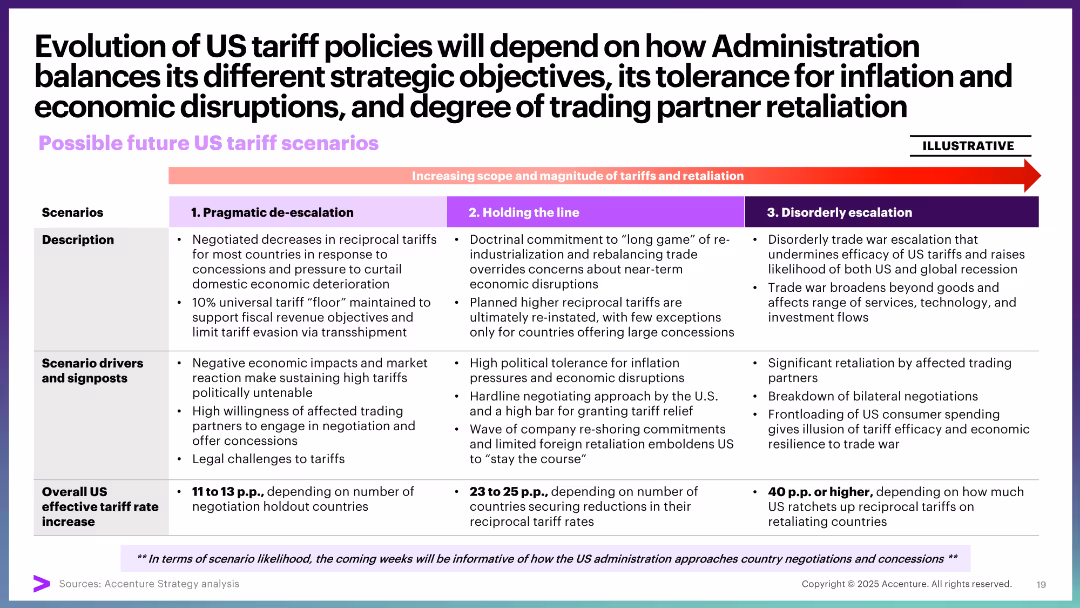
Comparative scenario table outlining three future tariff paths: de-escalation, holding line, and disorderly escalation.
Strategic Planning
Government & Public Sector
This slide outlines three potential US tariff trajectories, based on different political, economic, and strategic drivers. Each scenario includes a description, drivers, and estimated effective tariff range, helping stakeholders anticipate outcomes.
tariff scenarios, policy outlook, strategic objectives, escalation, de-escalation, trade war, future planning
false
Strategic Planning
Government & Public Sector
Table
Accenture
Add to my slides
Remove from favorites
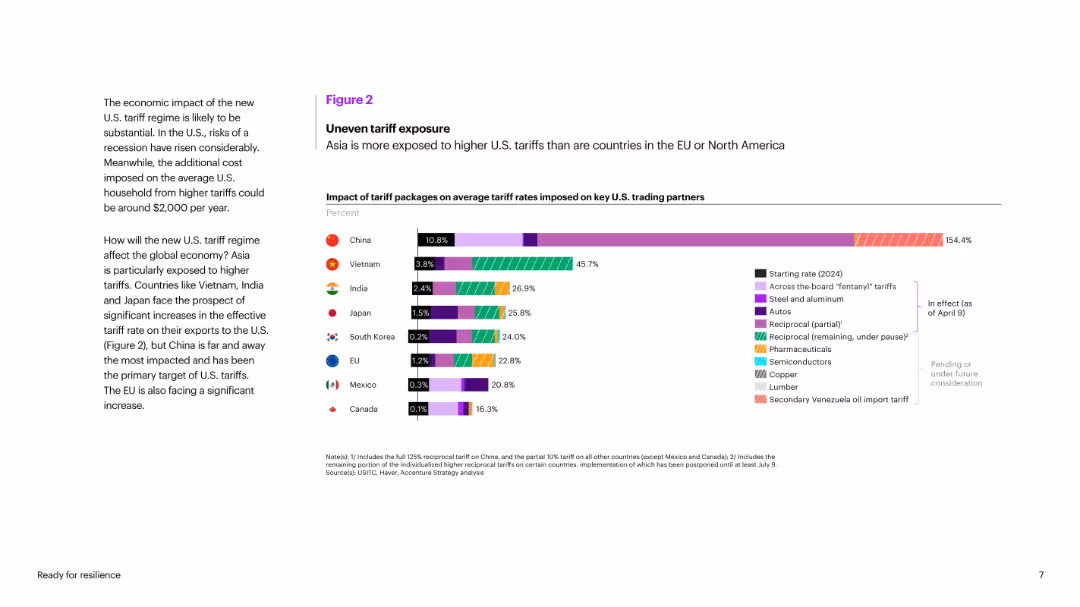
Bar chart comparing average tariff rate increases for key U.S. trading partners, color-coded by tariff category.
Risk Assessment and Management
Government & Public Sector
Illustrates asymmetric exposure of countries to U.S. tariffs, showing Asia is more affected than EU/North America. China faces the highest increase (154.4%), with Vietnam and India also highly impacted. Shows segmentation of tariffs across industries.
tariffs, China, trade exposure, Vietnam, India, trade war, U.S. partners, risk, import duties, policy impact
false
Risk Assessment and Management
Government & Public Sector
Mixed Chart
Accenture
Add to my slides
Remove from favorites
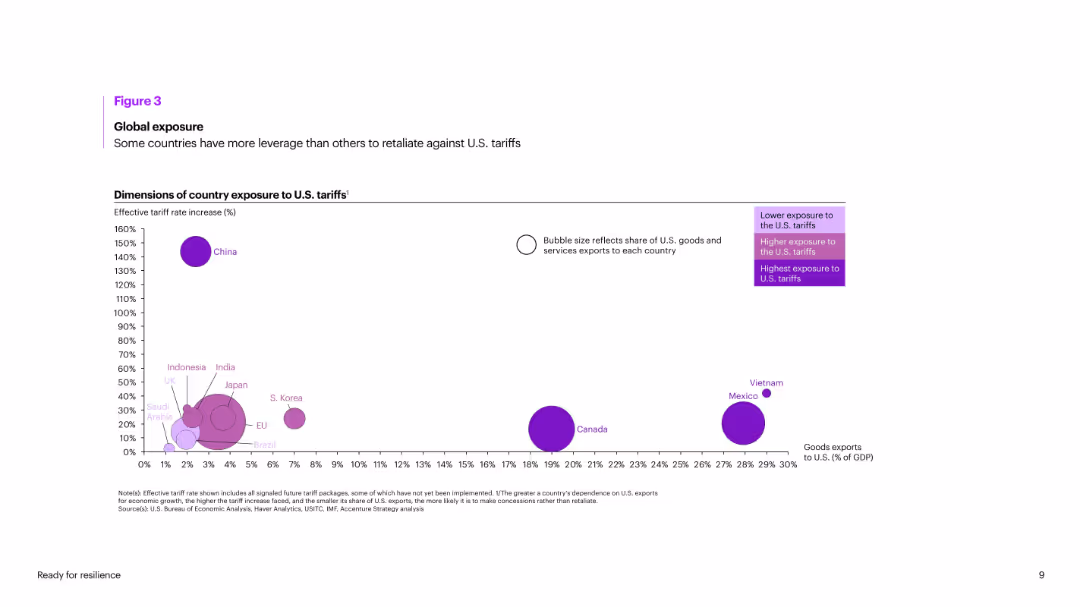
Bubble chart showing countries’ exposure to U.S. tariffs based on increase % and goods export share to the U.S. Bubble size reflects trade dependence.
Risk Assessment and Management
Government & Public Sector
Visualizes tariff impact using effective rate increases and share of exports to the U.S. China, Vietnam, and Mexico are the most exposed. Canada has high dependence but moderate rate impact. EU, Japan, and India show varying degrees of vulnerability.
tariffs, exposure, exports, U.S. trade, vulnerability, retaliation, global impact, China, Vietnam, GDP
false
Risk Assessment and Management
Government & Public Sector
Single Chart
Accenture
Add to my slides
Remove from favorites
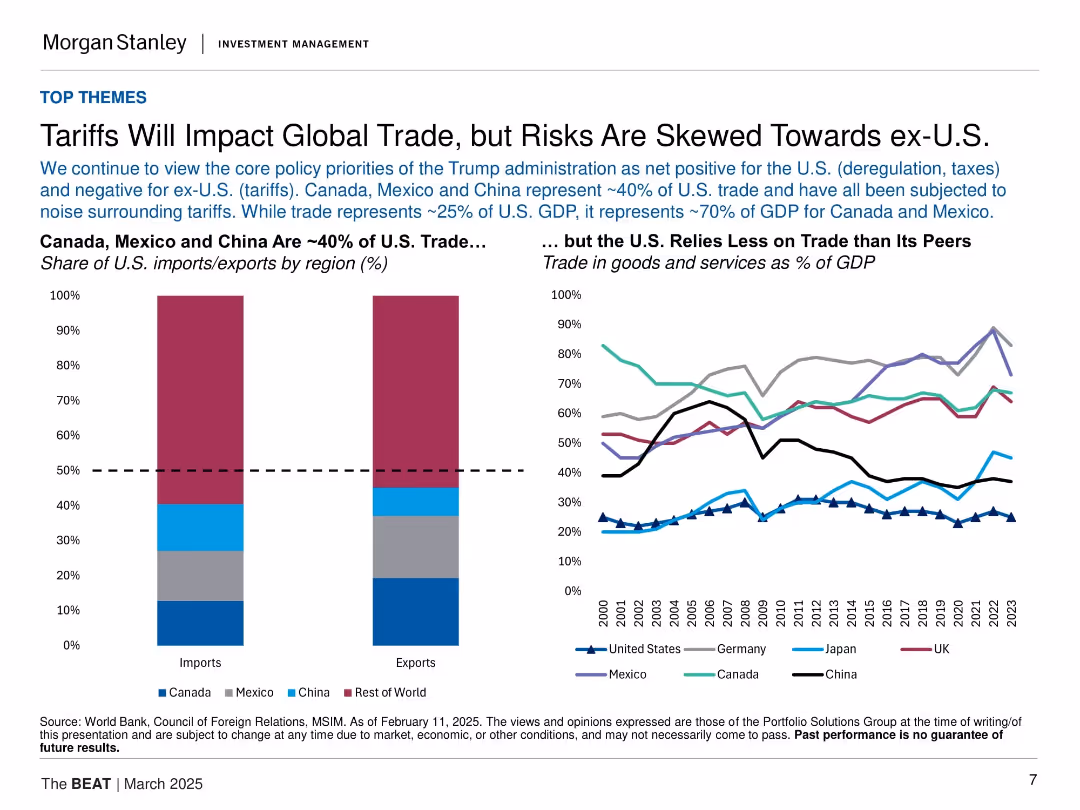
Split layout: bar chart on the left (share of U.S. trade by region), line chart on the right (trade as % of GDP by country). Clean, structured design.
Market Analysis and Trends
Government & Public Sector
Highlights the concentration of U.S. trade with Canada, Mexico, and China, and compares trade dependence globally. It underscores the Trump administration's trade policies, noting greater risk to ex-U.S. economies than to the U.S. itself.
tariffs, global trade, U.S., Canada, China, Mexico, imports, exports, GDP, policy risk
false
Market Analysis and Trends
Government & Public Sector
Multiple Chart
Morgan Stanley
Add to my slides
Remove from favorites
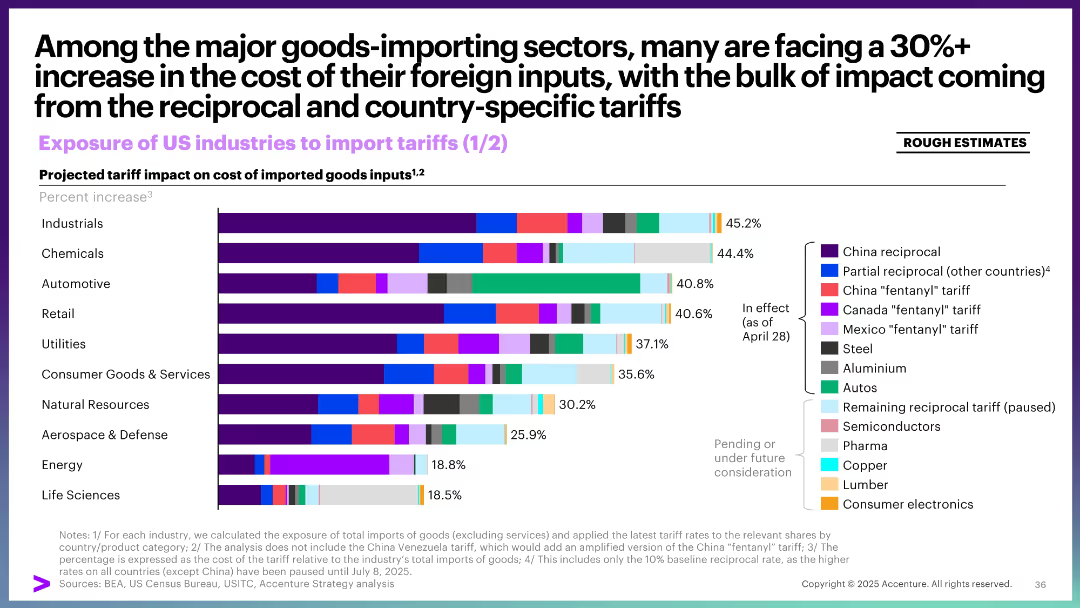
Bar graph comparing industry sectors with stacked color-coded tariff sources
Risk Assessment and Management
Industrial & Manufacturing
This slide quantifies the estimated impact of tariffs on cost of imported goods inputs across major U.S. industries, showing many sectors facing over 30% increases. It attributes the cost to various country-specific and reciprocal tariffs and categorizes them by source (e.g., China, steel, autos, semiconductors).
tariffs, import costs, U.S. industries, China, reciprocal, steel, semiconductors, autos
false
Risk Assessment and Management
Industrial & Manufacturing
Single Chart
Accenture
Add to my slides
Remove from favorites
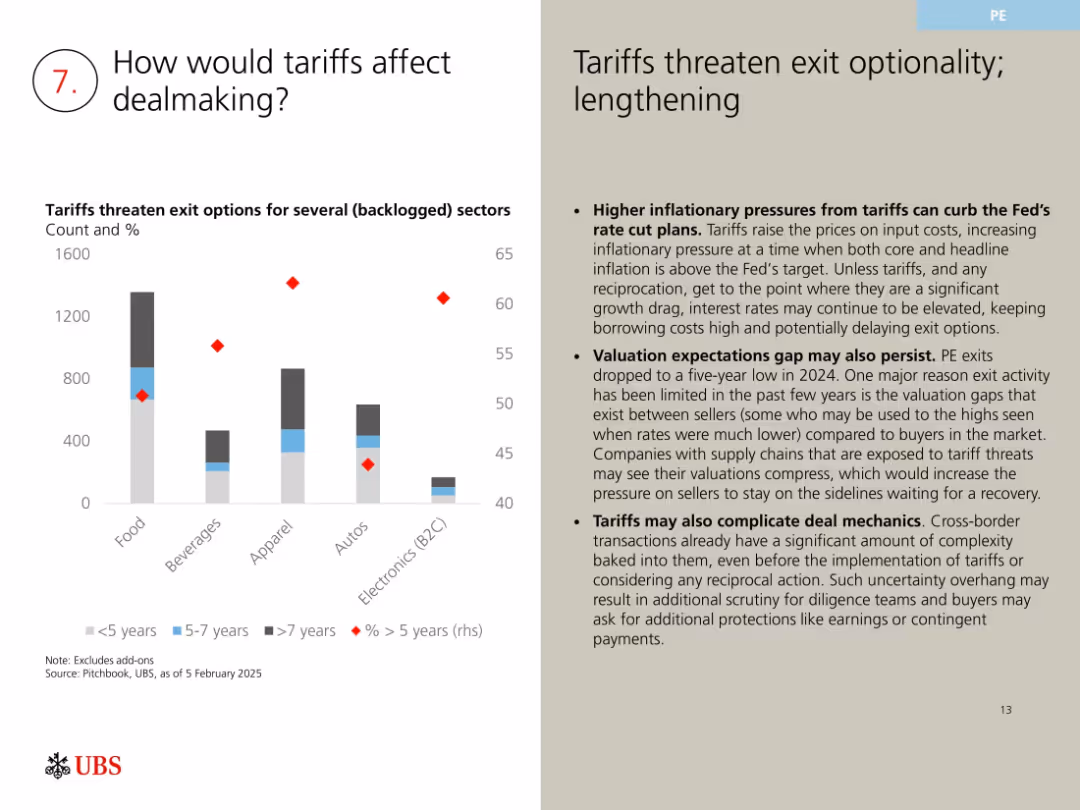
Bar and scatter chart showing deal aging by sector; commentary to the right
Regulatory and Compliance
Financial Services
Examines how tariffs may impact M&A by increasing inflationary pressure, complicating deal structures, and widening valuation gaps. Highlights sectoral risks and suggests potential delays in deal execution due to uncertainty.
tariffs, M&A risk, regulatory pressure, deal timing, exit optionality, valuation gap
false
Regulatory and Compliance
Financial Services
Mixed Chart
UBS
Add to my slides
Remove from favorites
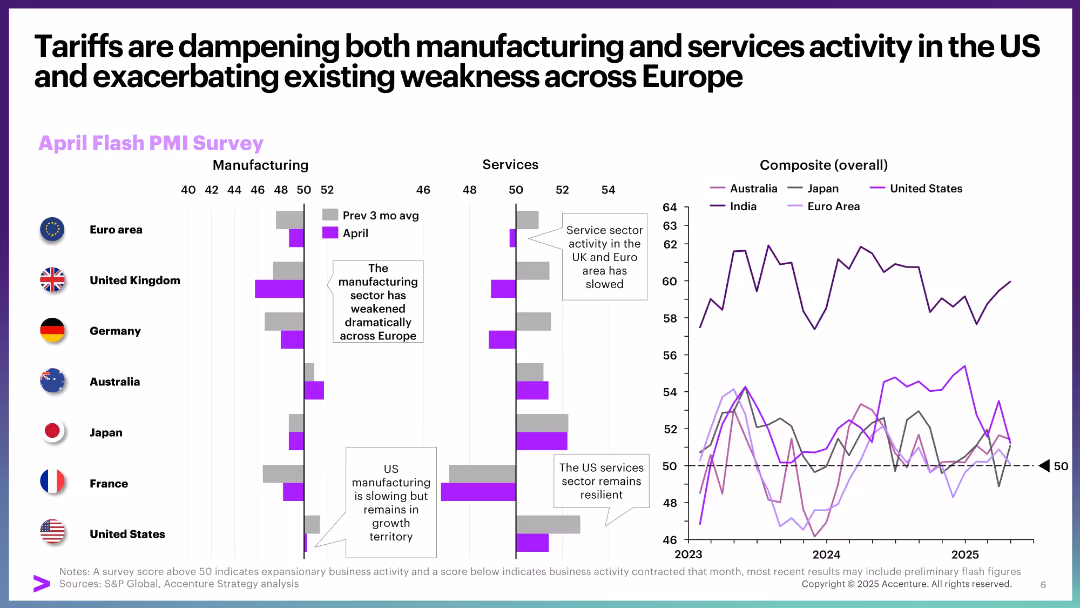
Bar and line charts showing April Flash PMI Survey for manufacturing and services by country, and composite trends over time. Clean, data-rich layout with annotations and vertical split design.
Performance Metrics and KPIs
Professional Services
This slide visualizes the impact of tariffs on business activity, highlighting contraction in Europe and resilience in US services. It uses PMI data to show declining manufacturing and service activity, especially in Europe and the UK, with a comparative composite line chart for multiple regions.
tariffs, PMI, services, manufacturing, Europe, US, business activity, slowdown, resilience, composite index
false
Performance Metrics and KPIs
Professional Services
Multiple Chart
Accenture
Add to my slides
Remove from favorites
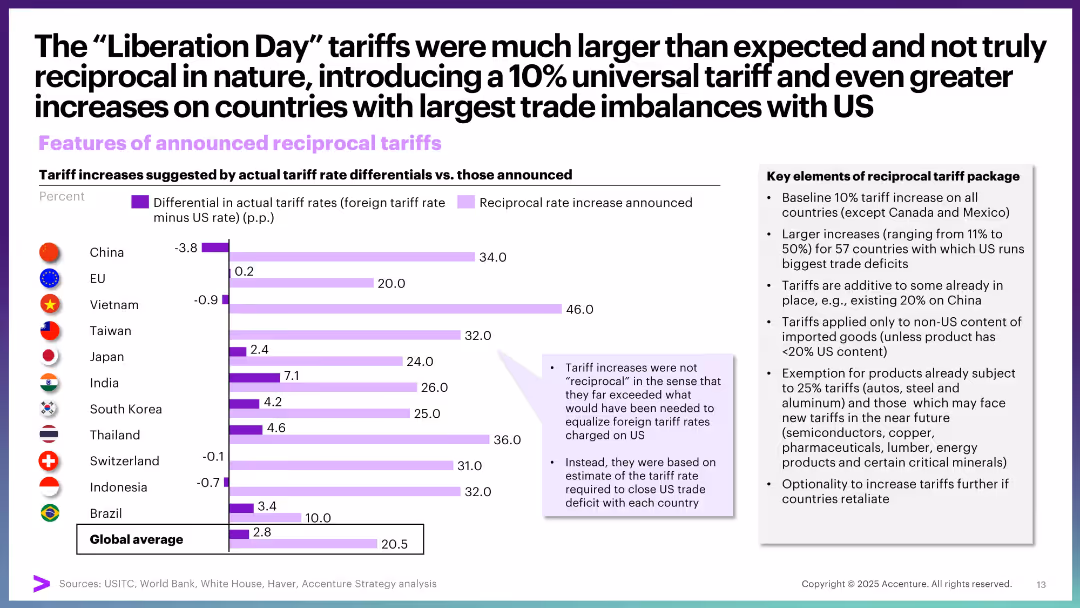
Bar chart comparing tariff rate differentials vs. announced reciprocal increases by country, with a sidebar summarizing key points.
Strategic Planning
Government & Public Sector
This slide evaluates how US reciprocal tariffs deviate from true reciprocity. It shows that tariffs imposed far exceed foreign rates, reflecting imbalances based on US trade deficits rather than mutual rate parity.
tariffs, reciprocal, trade imbalances, Liberation Day, policy analysis, strategic planning, rate differentials
false
Strategic Planning
Government & Public Sector
Mixed Chart
Accenture
Add to my slides
Remove from favorites
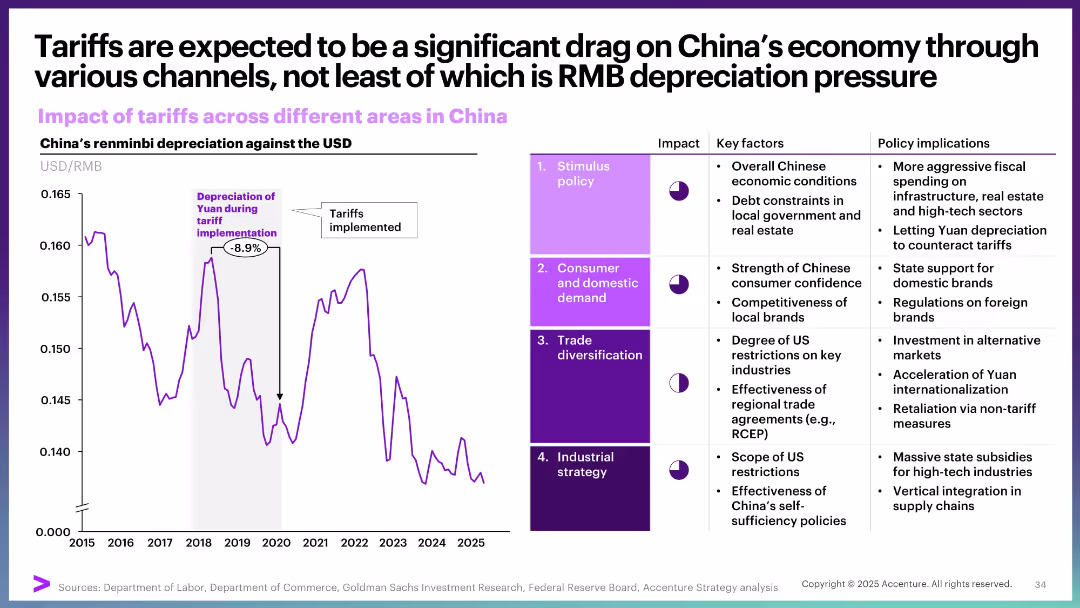
Dual-pane layout: left side shows a line graph of RMB depreciation; right side has a 4-row table with impact assessments
Market Analysis and Trends
Government & Public Sector
The slide highlights how tariffs are pressuring China’s economy via RMB depreciation and other channels like stimulus policy, consumer demand, trade diversification, and industrial strategy. It shows an 8.9% yuan depreciation during tariff periods and details policy responses across four sectors.
tariffs, RMB, depreciation, China, fiscal policy, trade, consumer, industrial strategy
false
Market Analysis and Trends
Government & Public Sector
Multiple Chart
Accenture
Add to my slides
Remove from favorites
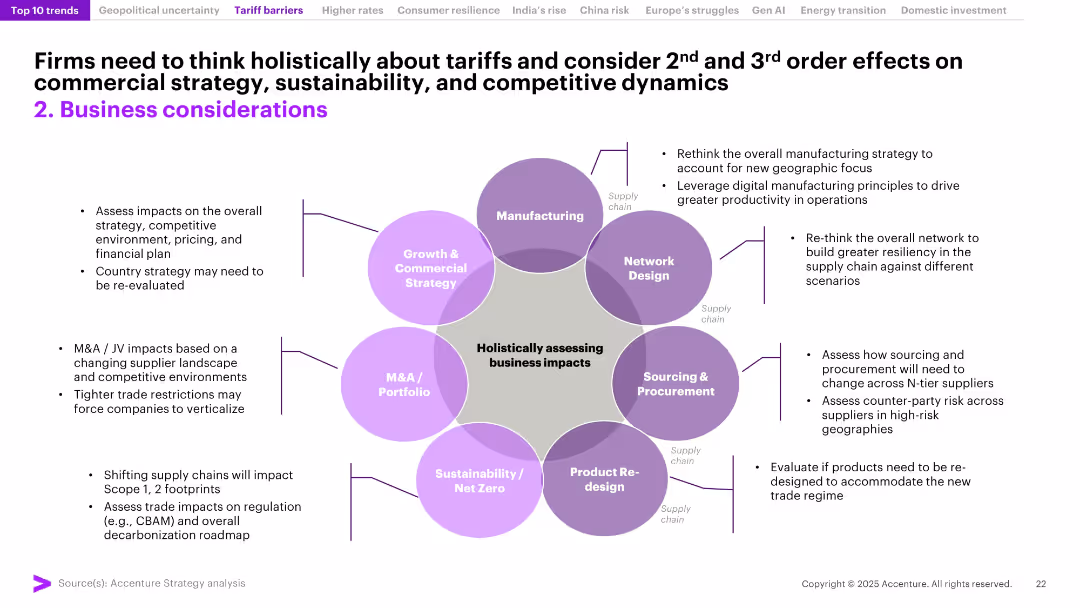
Central circular framework with six connected business functions, each surrounded by detailed impacts of tariffs. Clean, strategy-style slide with purple highlights.
Regulatory and Compliance
Professional Services
This slide emphasizes the second- and third-order impacts of tariffs on key business areas such as supply chains, procurement, sustainability, and manufacturing. Encourages firms to re-evaluate strategies across their operations in response to trade and tariff shifts.
Tariffs, Supply Chain, Strategy, Compliance, Procurement, M&A, Net Zero, Business Impact, 2025, Trade Risk
false
Regulatory and Compliance
Professional Services
Framework
Accenture
Add to my slides
Remove from favorites
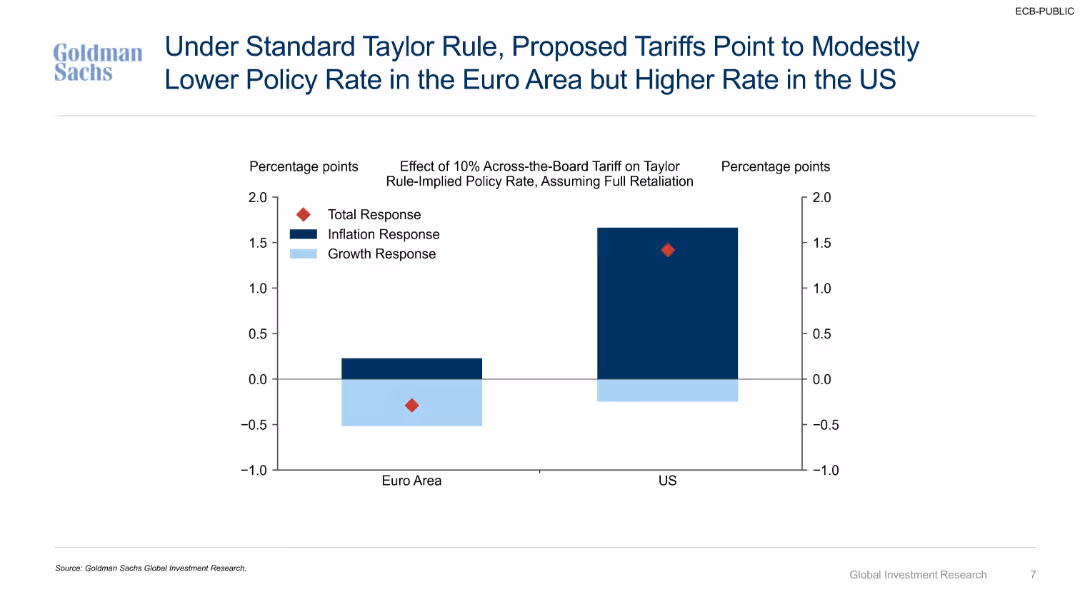
Two-bar comparative chart with color-coded segments (Inflation, Growth, Total response) for Euro Area and US. Branded by Goldman Sachs.
Investment Analysis
Financial Services
This slide shows the impact of a 10% tariff (with retaliation) on Taylor Rule-implied policy rates. It indicates that tariffs would lower rates in the Euro area while raising them in the US, due to differences in inflation and growth responses.
tariffs, Taylor Rule, interest rates, Euro Area, US policy, inflation, growth, Goldman Sachs, monetary policy
false
Investment Analysis
Financial Services
Single Chart
Goldman Sachs
Add to my slides
Remove from favorites
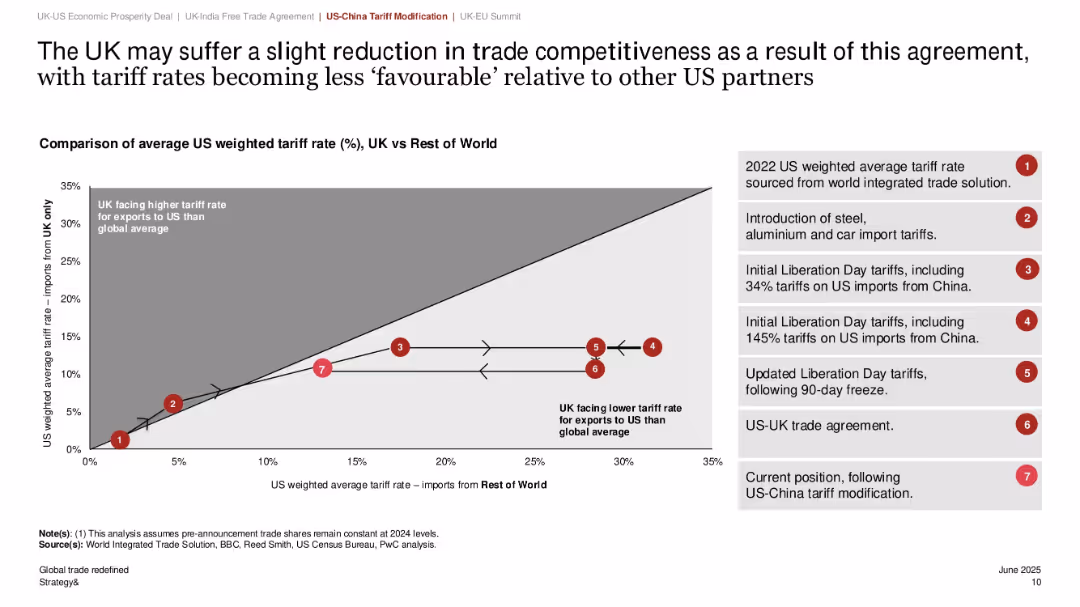
Line graph with arrows and numbered labels showing shifts in tariff positioning; side legend explains stages of tariff policy; grey-white shaded chart background.
Market Analysis and Trends
Government & Public Sector
This slide explains how recent changes to US-China tariffs may reduce UK trade competitiveness with the US. It compares the US weighted average tariff rates on UK vs. rest of world imports over time, with reference points detailing key policy changes. The UK is shown to be facing a relatively higher tariff rate under the current policy setup.
tariffs, trade competitiveness, UK-US trade, China, policy shift, weighted average, imports, global trade, protectionism, economic agreement
false
Market Analysis and Trends
Government & Public Sector
Single Chart
PwC/Strategy&
Add to my slides
Remove from favorites
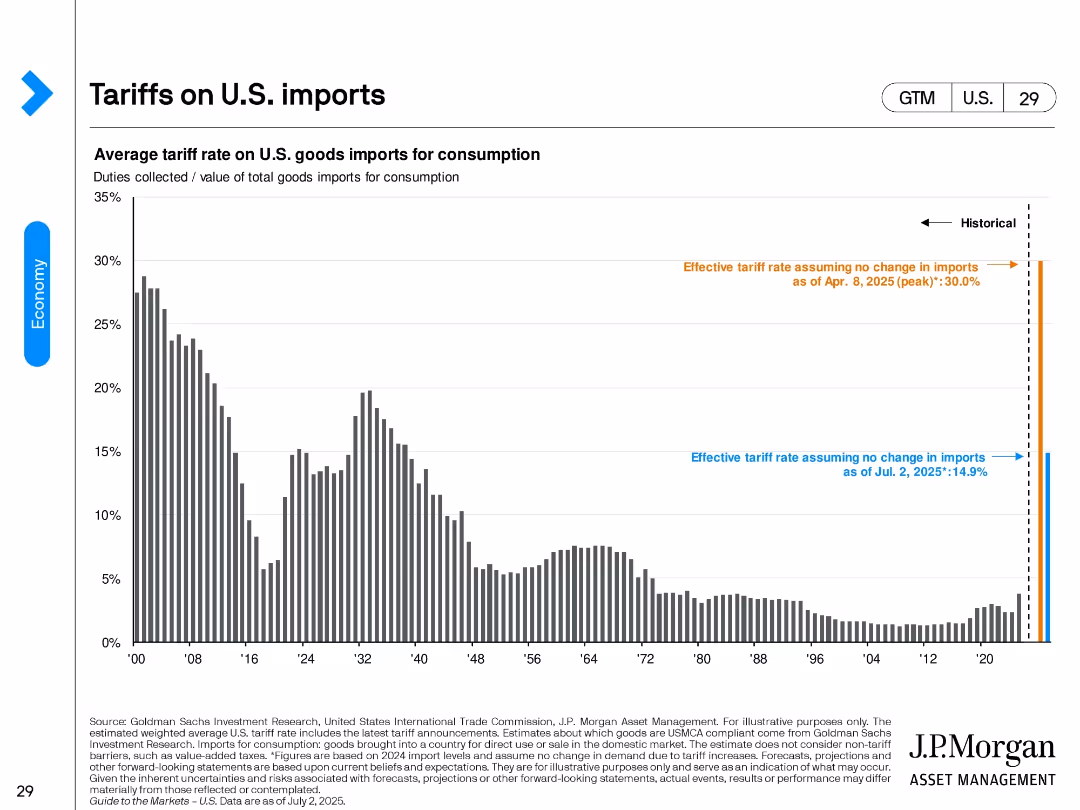
A vertical bar chart displaying the historical average tariff rates on U.S. imports with 2025 estimates highlighted using color-coded annotations.
Regulatory and Compliance
Government & Public Sector
This slide shows average tariff rates on U.S. imports for consumption from 1900 to 2025. It includes forecasts for 2025 assuming no change in imports and illustrates the spike in effective tariff rates under new policy conditions.
tariffs, trade, imports, regulation, policy, duties, 2025 forecast, economic impact
false
Regulatory and Compliance
Government & Public Sector
Single Chart
JP Morgan
Add to my slides
Remove from favorites
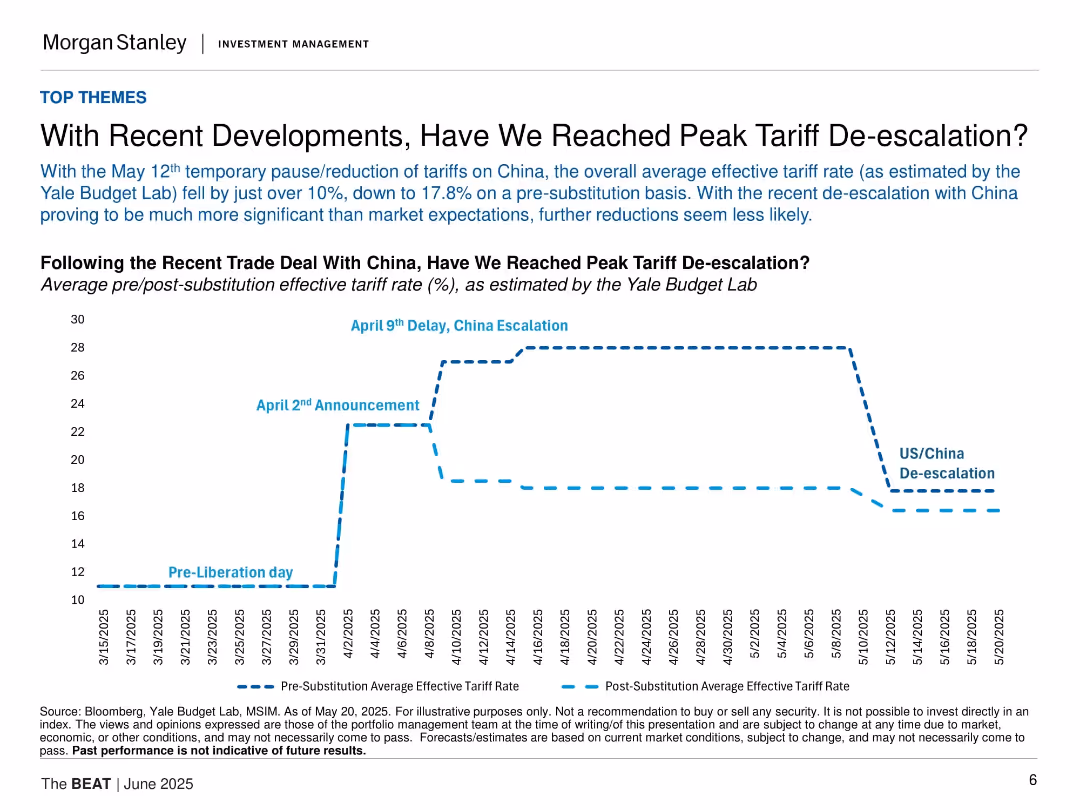
Time-series line chart tracking average tariff rates before and after recent US/China trade developments; vertical event markers show major dates; clear progression of data.
Regulatory and Compliance
Government & Public Sector
Analyzes effective tariff rate changes due to recent U.S.-China trade developments. With de-escalation events in May 2025, tariffs dropped to 17.8%, possibly marking peak de-escalation. The chart provides a timeline of trade-related announcements and their impacts.
tariffs, trade policy, China, de-escalation, economic impact
false
Regulatory and Compliance
Government & Public Sector
Single Chart
Morgan Stanley
Add to my slides
Remove from favorites
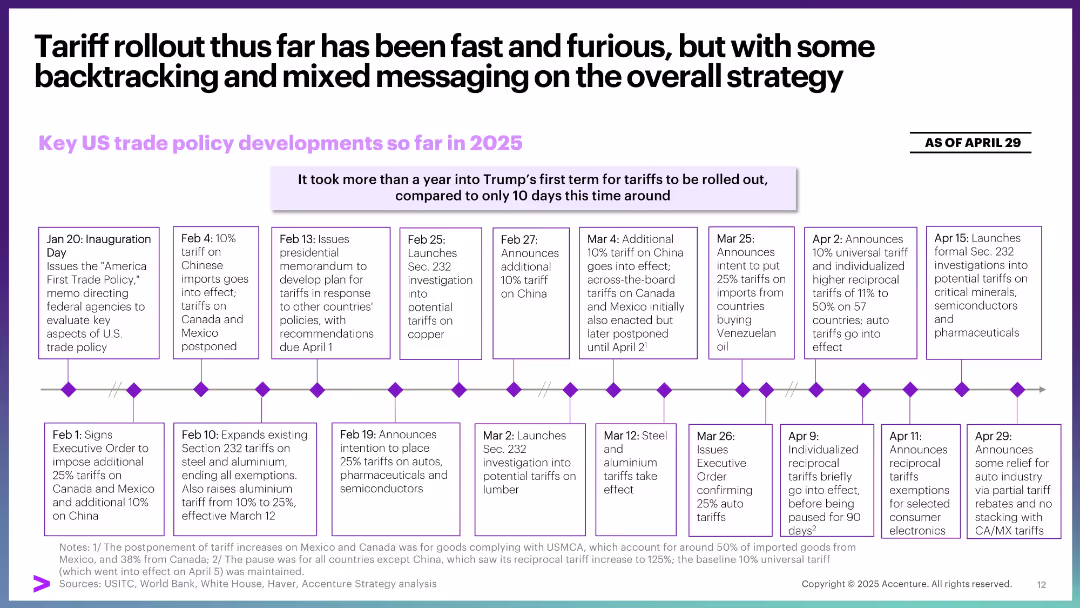
Timeline chart with colored boxes and detailed policy milestones, annotated with key developments from Jan to Apr 2025.
Regulatory and Compliance
Government & Public Sector
This timeline outlines major US trade policy moves in early 2025, showing rapid escalation and occasional reversals. It compares this rollout to prior tariff timelines and emphasizes inconsistencies in messaging and implementation.
tariffs, trade policy, timeline, regulation, US government, 2025, compliance, policy development
false
Regulatory and Compliance
Government & Public Sector
Linear Flow
Accenture
Add to my slides
Remove from favorites
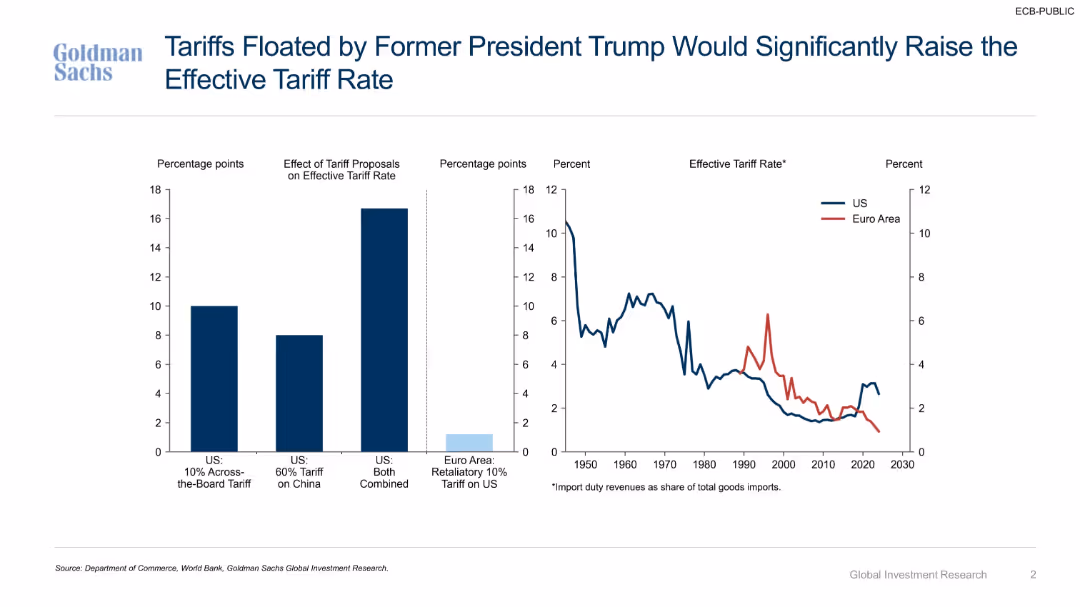
Two-panel slide with bar chart on left (projected increases) and line chart on right (historical effective tariff rates).
Regulatory and Compliance
Government & Public Sector
Analyzes projected impacts of proposed tariffs by former President Trump, including combined effects of U.S. tariffs and Euro Area retaliation. Shows historical comparison of effective tariff rates for US vs Euro Area.
tariffs, Trump proposal, effective rate, historical trends, trade policy, import duties, US, EU, China
false
Regulatory and Compliance
Government & Public Sector
Multiple Chart
Goldman Sachs
Add to my slides
Remove from favorites
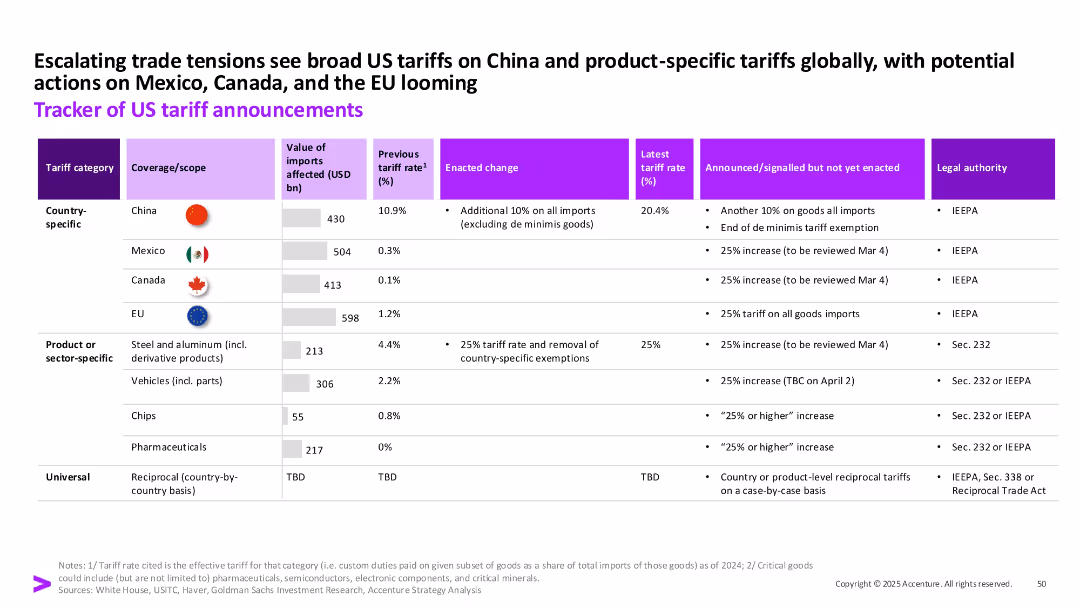
Tabular layout with icons and color-coded cells, detailing tariff categories, coverage, rates, changes, and legal authorities across countries and sectors.
Regulatory and Compliance
Government & Public Sector
This slide provides a structured tracker of US tariff policies across countries and sectors, including changes in tariff rates, enactment timelines, and legal authorities. It emphasizes the broadening scope of US trade measures in 2024–2025.
tariffs, US trade, China, Mexico, EU, regulations, compliance, imports
false
Regulatory and Compliance
Government & Public Sector
Single Chart
Accenture
Add to my slides
Remove from favorites
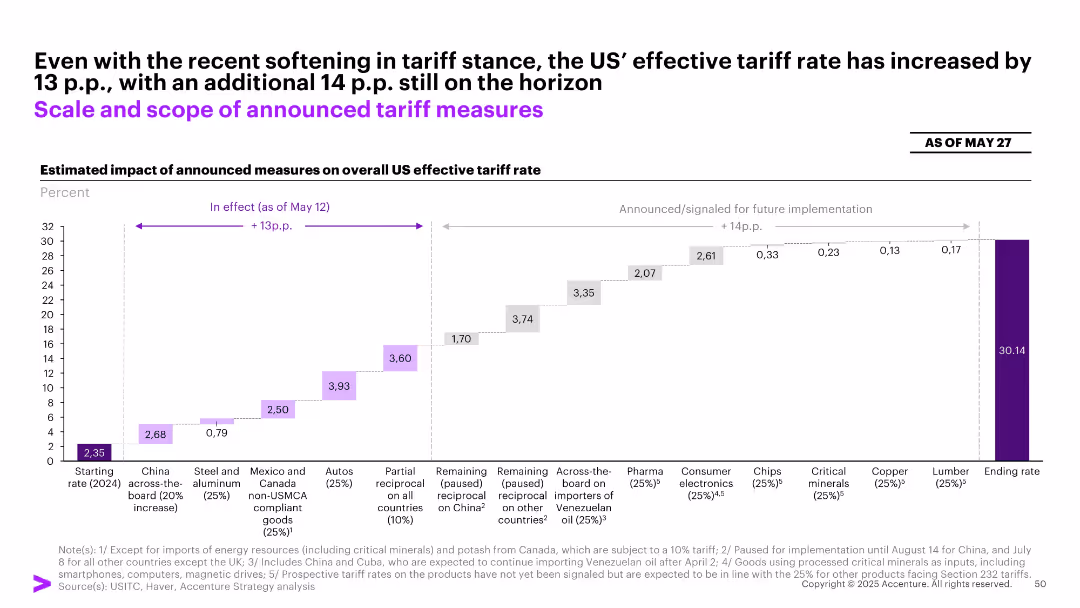
Waterfall chart illustrating cumulative percentage increases to US effective tariff rate; bars in purple and gray, with source notes below
Regulatory and Compliance
Government & Public Sector
The slide details the impact of announced US tariff measures as of May 27, 2025. It shows a 13 percentage point increase already in effect and another 14 points anticipated, driven by measures against China, autos, tech products, and critical minerals, indicating growing trade protectionism.
tariffs, US trade, protectionism, effective rate, China, technology, policy
false
Regulatory and Compliance
Government & Public Sector
Single Chart
Accenture
Add to my slides
Remove from favorites
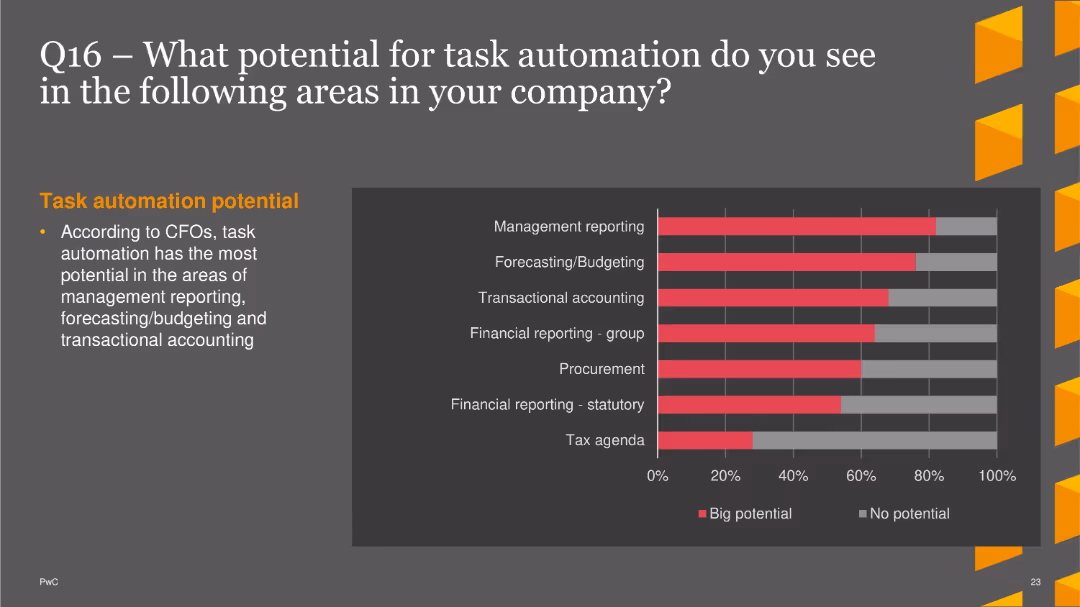
The slide displays a column chart indicating the potential for task automation in various company areas. Areas include management reporting, forecasting/budgeting, transactional accounting, financial reporting (group and statutory), procurement, and tax agenda. The potential is categorized as big potential (red) and no potential (gray). A short text section on the left side explains task automation potential according to CFOs.
Operational Efficiency
Financial Services
This slide shows survey data on the perceived potential for task automation in different company functions, with management reporting and forecasting/budgeting identified as areas with the highest potential. It provides insights for companies looking to enhance operational efficiency through automation.
task automation, management reporting, forecasting, transactional accounting, finance
false
Operational Efficiency
Financial Services
Single Chart
PwC/Strategy&
Add to my slides
Remove from favorites
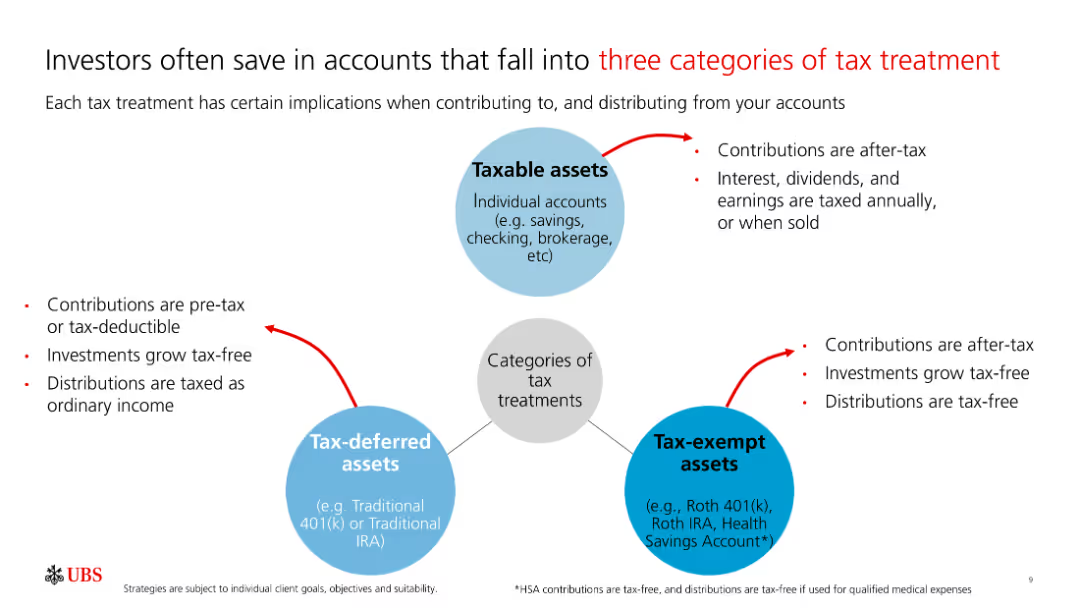
The slide includes three connected diagrams representing taxable, tax-deferred, and tax-exempt assets with descriptions of their tax implications.
Financial Performance
Financial Services
The slide details different tax treatment categories for investment accounts, explaining the tax benefits and considerations of each type.
Taxable, Tax-deferred, Tax-exempt, Investment, Tax
false
Financial Performance
Financial Services
Diagram
UBS
Add to my slides
Remove from favorites
Similar to the previous slide, this uses a split circular diagram with segments highlighted in orange and red, focusing on different tax proposals like Betting activities and VAT on asset managers. Icons and minimal text enhance clarity.
Regulatory and Compliance
Government & Public Sector
Further tax amendments for Namibia in 2018 are shown, discussing betting and gaming taxes, VAT changes for asset managers, and fuel levy increases. It helps in reviewing the expected financial outcomes from these legislative changes.
tax, amendments, revenue, betting, VAT, asset managers, fuel levy, Namibia, 2018
false
Regulatory and Compliance
Government & Public Sector
Framework
PwC/Strategy&
Add to my slides
Remove from favorites
The slide displays a split circular diagram divided into four segments, each with icons representing different tax amendments for 2018. The design uses bold colors like orange and red to denote different areas like Charitable activities and Foreign income taxation.
Regulatory and Compliance
Government & Public Sector
This slide presents proposed tax amendments for Namibia in 2018, detailing changes in taxation for dividends, trusts, foreign income, and charitable activities, aimed at discussing potential revenue impacts and legislative changes in a budget review.
tax, amendments, revenue, Namibia, 2018, dividend, trust, foreign, income, charitable
false
Regulatory and Compliance
Government & Public Sector
Framework
PwC/Strategy&
Add to my slides
Remove from favorites
Incorporates icons and split arrows to visualize proposed changes in tax regulations for 2018, focusing on manufacturing, economic zones, and individual tax brackets.
Regulatory and Compliance
Government & Public Sector
Details proposed tax amendments in Namibia and their expected revenue impacts, essential for stakeholders in policy-making and fiscal planning. The slide outlines changes aimed at enhancing revenue through adjustments in tax structures.
Tax, Amendments, Revenue, Policy, Law
false
Regulatory and Compliance
Government & Public Sector
Framework
PwC/Strategy&
Add to my slides
Remove from favorites
Slide with comparative column chart showing corporate income tax rates across ASEAN countries. Professional layout with a focus on clear data presentation.
Regulatory and Compliance
Financial Services
Discusses the changes in corporate income tax in the Philippines and compares it with other ASEAN countries, relevant for financial analysis.
Taxation, ASEAN, Philippines, corporate tax, comparative analysis
false
Regulatory and Compliance
Financial Services
Mixed Chart
Deloitte
Add to my slides
Remove from favorites
The slide shows a packet of cigarettes broken down into cost components (VAT, excise duty, actual cost) alongside a column chart displaying the number of cigarettes per cost component.
Regulatory and Compliance
Government & Public Sector
Explains the taxation and cost structure of cigarettes with a detailed graphical breakdown of each component's financial contribution to the total cost.
Taxation, cigarettes, VAT, excise duty, consumer cost
false
Regulatory and Compliance
Government & Public Sector
Mixed Chart
PwC/Strategy&
Add to my slides
Remove from favorites
Slide contains detailed tables comparing corporate income tax rates and their applicability, formatted with color highlights.
Regulatory and Compliance
Financial Services
Explains the new income tax rates on regular and passive income for corporations under the CREATE Law in the Philippines.
taxation, corporate, income, rates, law, CREATE, regulatory, Philippines, tax reform
false
Regulatory and Compliance
Financial Services
Table
Deloitte
Add to my slides
Remove from favorites
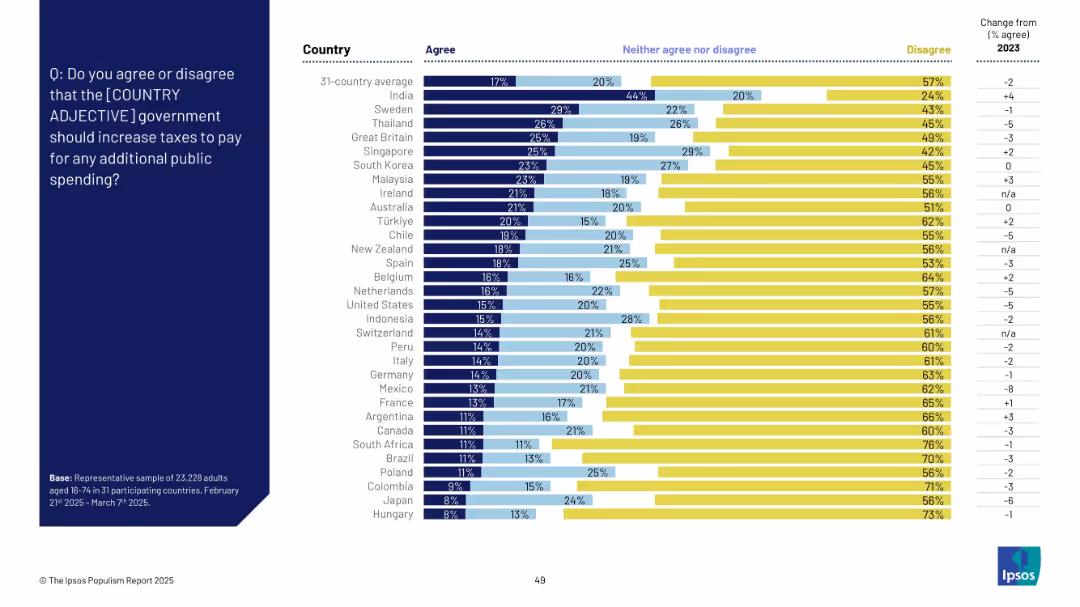
Horizontal bar chart divided into "Agree", "Neither agree nor disagree", and "Disagree", with an additional column showing change from 2023.
Regulatory and Compliance
Government & Public Sector
This slide explores agreement with increasing taxes for added public spending. Agreement is relatively low globally (17% average), with most respondents disagreeing, particularly in Western countries. Trends show minimal change from 2023, with India showing a slight increase.
taxation, public spending, fiscal policy, opinion, governance, global, survey, disagreement
false
Regulatory and Compliance
Government & Public Sector
Mixed Chart
IPSOS
Add to my slides
Remove from favorites
Features a female character next to a large table with data explaining reforms in passive income taxation.
Regulatory and Compliance
Financial Services
Summarizes major tax reforms, focusing on changes in tax rates for foreign and domestic corporations, highlighting exemptions and reductions.
taxation, reforms, corporate, passive income, tax rates, CREATE, Philippines
false
Regulatory and Compliance
Financial Services
Table
Deloitte
Add to my slides
Remove from favorites
Includes a bar chart showing different taxes ranked by their likelihood of causing significant audit exposures. Accompanied by textual analysis and key takeaways.
Regulatory and Compliance
Financial Services
This slide presents potential tax exposure areas during audits in the financial services industry, emphasizing the high risk associated with specific taxes and the need for effective management and compliance strategies.
tax, audits, exposure, financial services, compliance, column chart
false
Regulatory and Compliance
Financial Services
Mixed Chart
PwC/Strategy&
Add to my slides
Remove from favorites
This slide includes three pie charts and textual analysis. The layout is structured with headers and bullet points discussing survey data.
Strategic Planning
Financial Services
Highlights the lack of tax function involvement in strategic decision-making related to new business or product lines. The slide provides survey data and emphasizes the need for proactive tax role in business strategy to avoid costly retractions.
tax, business development, product lines, strategy, pie chart, involvement
false
Strategic Planning
Financial Services
Multiple Chart
PwC/Strategy&
Add to my slides
Remove from favorites
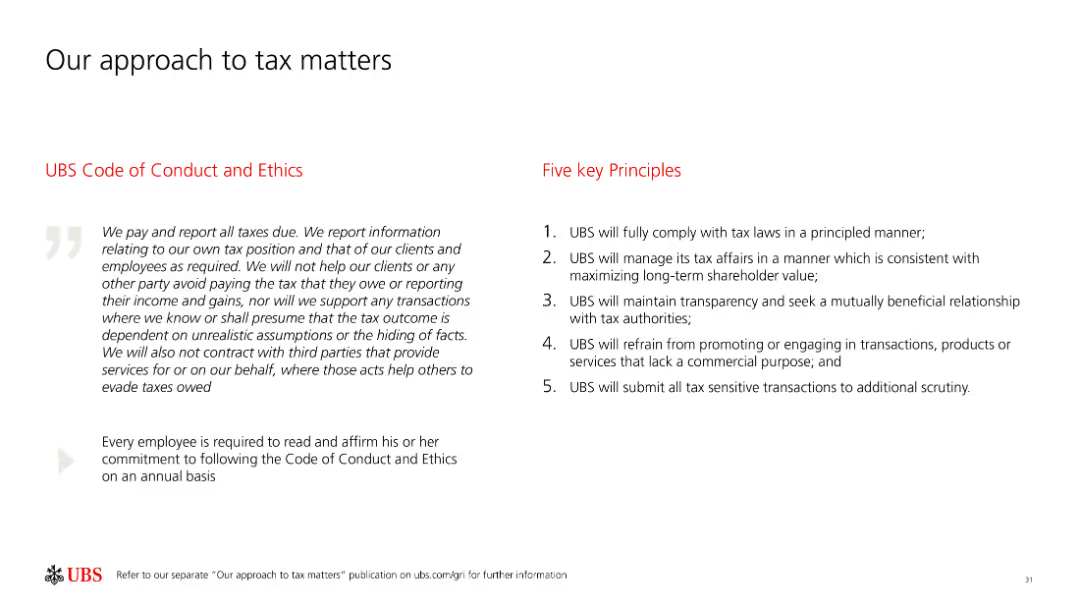
The slide presents text outlining UBS's Code of Conduct and Ethics along with five key principles related to tax compliance and ethical tax practices.
Regulatory and Compliance
Financial Services
It outlines UBS's approach to tax compliance, emphasizing ethical practices, transparency, and adherence to tax laws through a clear code of conduct and guiding principles.
Tax compliance, UBS, ethics, transparency, principles
false
Regulatory and Compliance
Financial Services
Header Horizontal
UBS
Add to my slides
Remove from favorites
This slide displays a comparative column chart of corporate tax rates across multiple Southern African countries, color-coded by country.
Competitive Landscape
Government & Public Sector
Compares corporate tax rates between Namibia and its neighboring countries to evaluate Namibia's competitive position in attracting business investments relative to regional peers.
Tax, Corporate, Comparison, Africa
false
Competitive Landscape
Government & Public Sector
Single Chart
PwC/Strategy&
Add to my slides
Remove from favorites
Shows a scatter plot diagrams and timelines illustrating the potential increase in emissions coverage with new tax credits.
Regulatory and Compliance
Environmental Services & Sustainability
Explores the impact of increased tax credits on emissions reductions across sectors, valuable for environmental policy making.
tax credits, emissions reductions, environmental policy, sustainability, sector analysis, climate change
false
Regulatory and Compliance
Environmental Services & Sustainability
Multiple Chart
BCG
Add to my slides
Remove from favorites
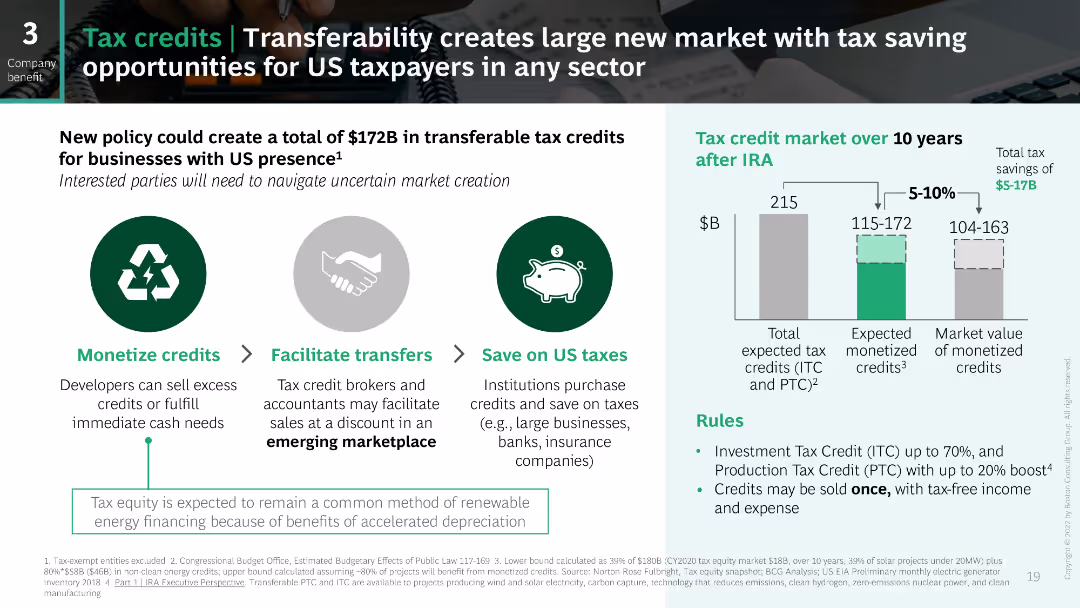
The slide features a column chart showing the potential size of the tax credit market over 10 years following the IRA. It includes icons and text to explain the benefits of transferable tax credits and the expected market value. The design is clean and professional.
Financial Performance
Financial Services
This slide explains the potential financial benefits and market opportunities of transferable tax credits introduced by the IRA, projecting the total market size and the expected monetized value of these credits over the next decade.
tax credits, IRA, financial benefits, market size, transfer
false
Financial Performance
Financial Services
Mixed Chart
BCG
Add to my slides
Remove from favorites
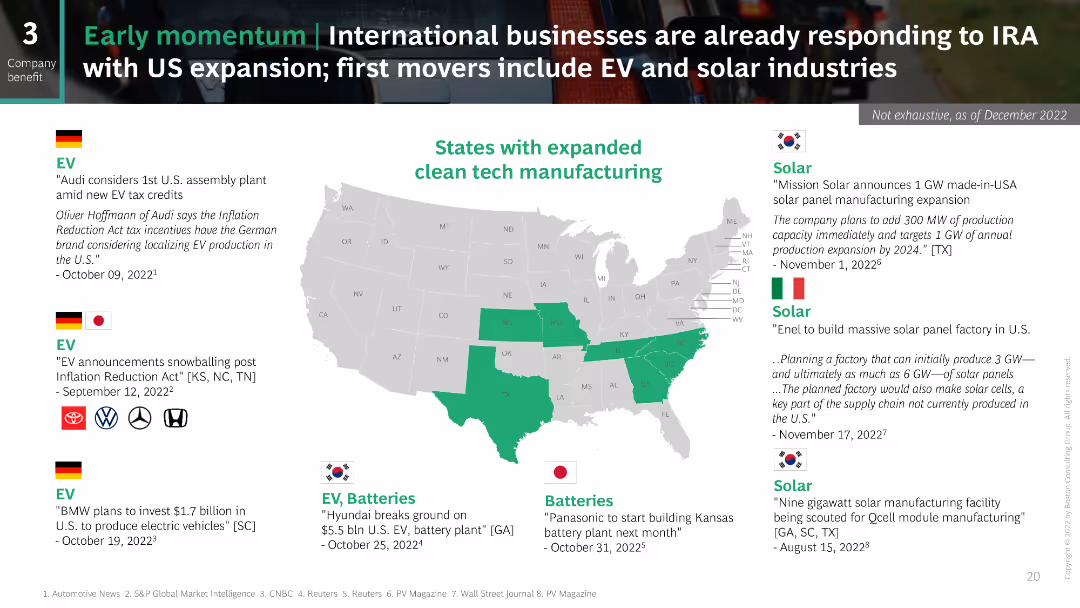
The slide features a US map highlighting states with expanded clean tech manufacturing in green. The left side lists company announcements with their logos and relevant dates. On the right, there are descriptions of solar initiatives.
Market Analysis and Trends
Energy & Utilities
This slide discusses the early response to the Inflation Reduction Act (IRA) by international businesses, specifically focusing on electric vehicles (EV) and solar industries. It highlights various company announcements and planned expansions in the US.
tax credits, IRA, financial benefits, market size, transfer
false
Market Analysis and Trends
Energy & Utilities
Graphic
BCG
Add to my slides
Remove from favorites
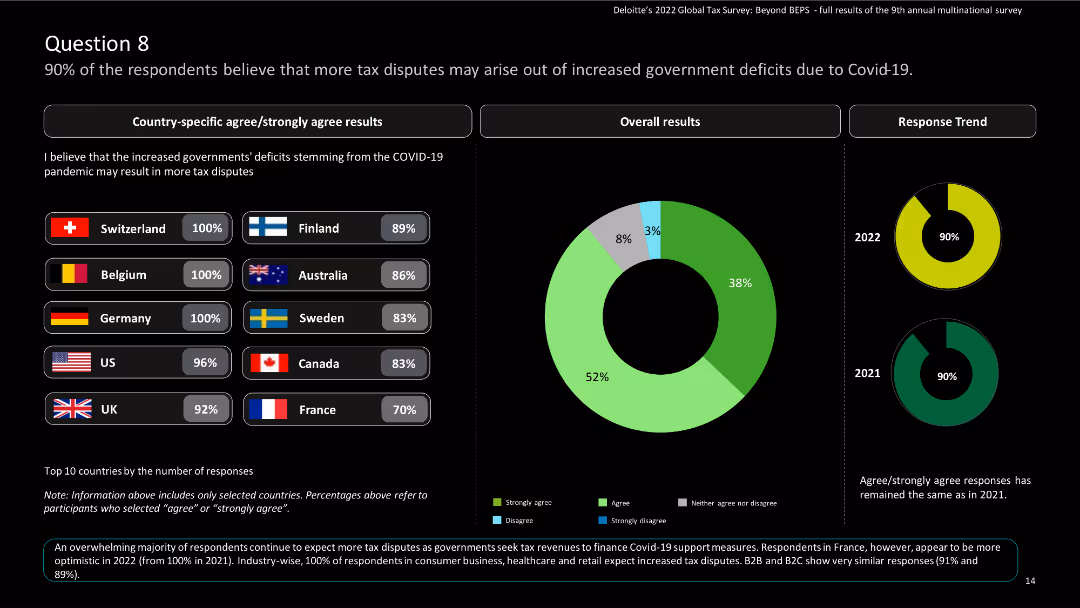
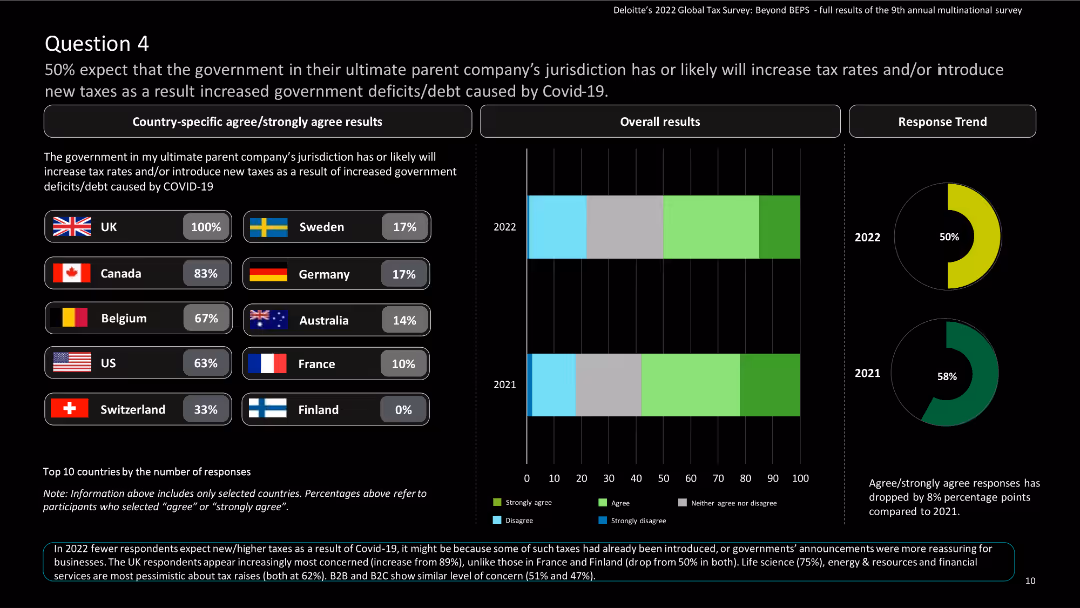
The slide features country-specific results and a pie chart showing overall results and response trend results over the years.
Regulatory and Compliance
Financial Services
The slide emphasizes the expectation of increased tax disputes due to government deficits caused by COVID-19.
Tax disputes, government deficits, COVID-19, global tax, Deloitte, agree, strongly agree, survey, multinational
false
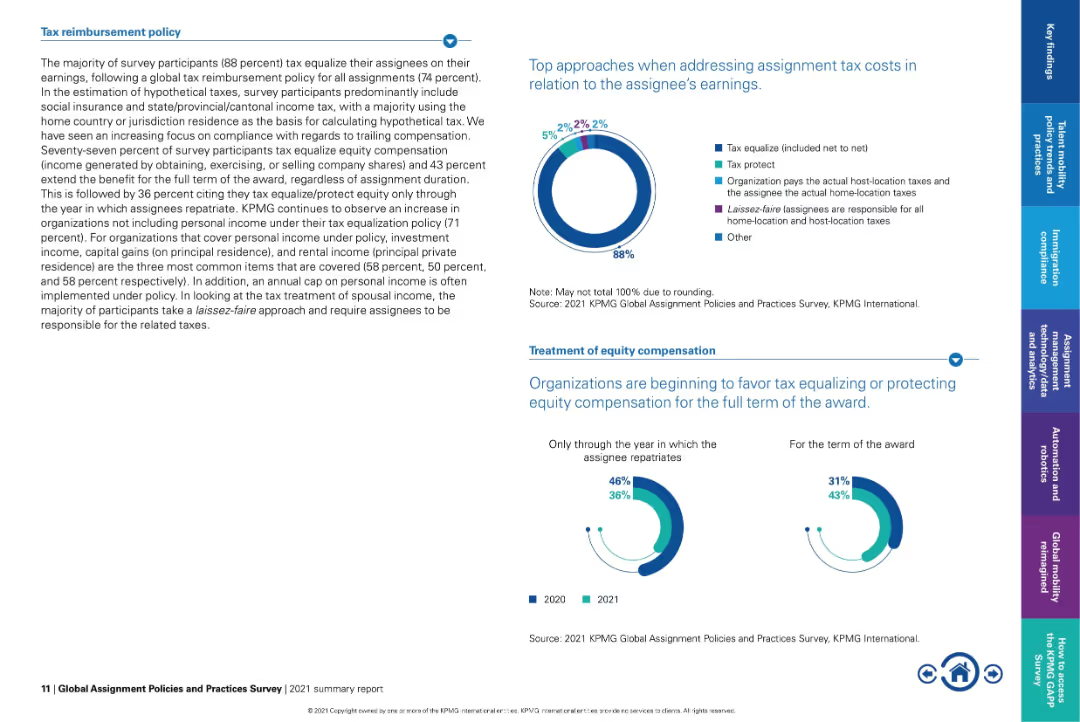
Regulatory and Compliance
Financial Services
Multiple Chart
Deloitte
Add to my slides
Remove from favorites
Left-heavy text panel with explanatory text; right side contains donut charts and dual-year bar charts.
Regulatory and Compliance
Financial Services
Describes how organizations manage tax reimbursement for assignees, showing 88% use tax equalization. Discusses equity compensation treatment trends and highlights a shift towards full-term protection of awards rather than just through repatriation.
tax equalization, equity compensation, global assignments, tax policy, compliance, KPMG, expat tax treatment
false
Regulatory and Compliance
Financial Services
Multiple Chart
KPMG
Add to my slides
Remove from favorites
This slide contains column charts of tax-equivalent yields for various bonds and a second chart for the 5-year correlation with municipal bonds, highlighting investment attractiveness.
Investment Analysis
Financial Services
The slide provides a tax-equivalent yield analysis for various bonds and their correlation, offering insights for tax planning and investment attractiveness in municipal bonds.
tax-equivalent yield, bonds, investment analysis, tax planning, 5-year correlation, municipal bonds, finance
false
Investment Analysis
Financial Services
Multiple Chart
Morgan Stanley
Add to my slides
Remove from favorites
Includes a pie chart and a sectioned content layout with headers and bullet points. Text sections cover key findings and broad overviews.
Operational Efficiency
Financial Services
This slide outlines the limited involvement of tax functions in ERP and software deployment within companies. It details the survey percentages and discusses the necessity for greater integration of tax operations into ERP systems.
tax, ERP, software, deployment, involvement, financial services, pie chart
false
Operational Efficiency
Financial Services
Mixed Chart
PwC/Strategy&
Add to my slides
Remove from favorites
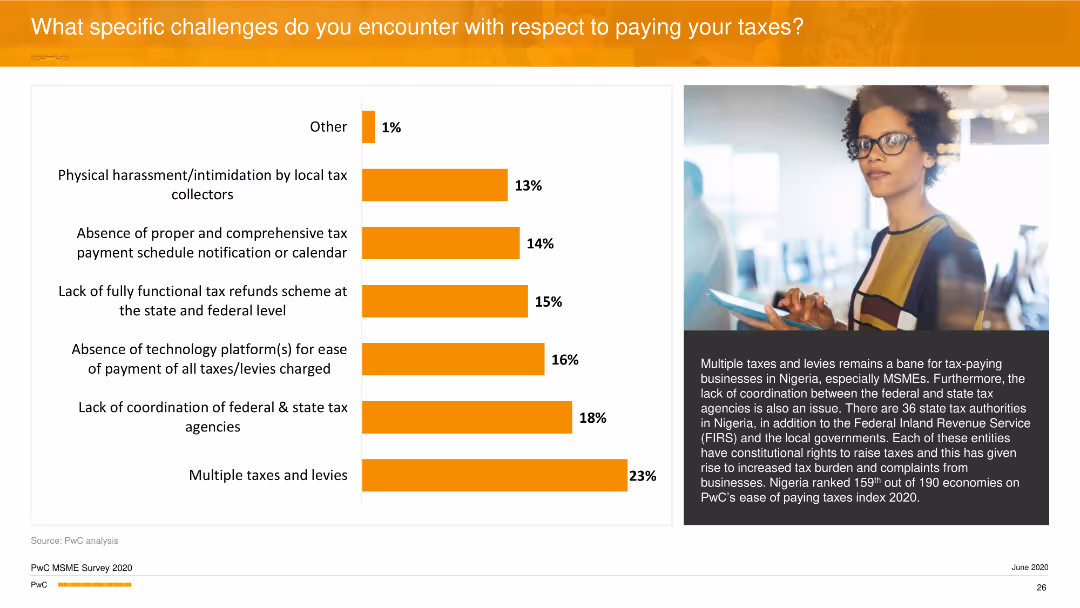
The slide features a horizontal bar chart illustrating challenges in tax payment, such as multiple taxes and lack of coordination. An image of a woman with glasses is on the right side.
Regulatory and Compliance
Financial Services
It highlights the specific tax-related challenges businesses face, with multiple taxes and levies, and lack of coordination between federal and state tax agencies being prominent. It elaborates on the systemic issues in Nigeria's tax system.
Taxes, Challenges, Compliance, Coordination, PwC
false
Regulatory and Compliance
Financial Services
Mixed Chart
PwC/Strategy&
Add to my slides
Remove from favorites
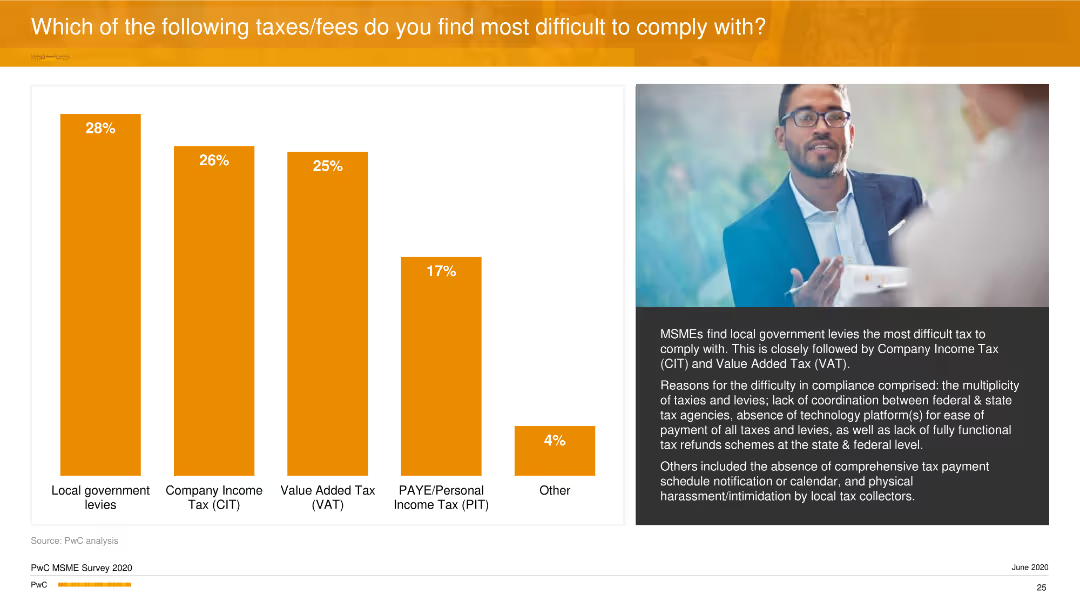
A vertical column chart ranks the difficulty of compliance with various taxes and fees. An image of a man with glasses is featured on the right side.
Regulatory and Compliance
Financial Services
The slide examines the challenges MSMEs face in complying with different taxes, highlighting local government levies and company income tax as the most problematic. It discusses the reasons behind these difficulties.
Taxes, Compliance, MSMEs, Business, PwC
false
Regulatory and Compliance
Financial Services
Mixed Chart
PwC/Strategy&
Add to my slides
Remove from favorites
Slide with a pie chart detailing the breakdown of tax revenue sources such as income, customs, and excise taxes. No property taxes are shown, indicating a specific fiscal focus.
Financial Performance
Government & Public Sector
Analyzes Namibia's tax revenue composition for 2018/19, showing major contributions from income taxes and customs. The slide aids in understanding the emphasis on indirect taxation and customs duties in the country's revenue structure.
Taxes, Income, Customs, Indirect, Revenue
false
Financial Performance
Government & Public Sector
Single Chart
PwC/Strategy&
Add to my slides
Remove from favorites
The slide includes a vertical column chart showing the percentage of income/profits taken up by taxes/levies. An image of a man with a tablet is on the right side.
Financial Performance
Financial Services
It discusses the percentage of income or profits that businesses allocate to taxes and levies, with 49% of SMEs paying between 20-40%. It also highlights the impact of local government charges on overall tax compliance.
Taxes, Income, Profits, Business, PwC
false
Financial Performance
Financial Services
Mixed Chart
PwC/Strategy&
Add to my slides
Remove from favorites
Horizontal bar chart showing agreement levels across countries regarding tax increases for more public spending; grouped responses shown in four colors
Regulatory and Compliance
Government & Public Sector
This slide shows that only 19% globally agree with raising taxes for more public spending. India shows the highest support (40%), while most countries have high disagreement levels, indicating global tax resistance.
taxes, public spending, fiscal policy, taxation, government funding, Ipsos, survey, tax attitudes, economic policy
false
Regulatory and Compliance
Government & Public Sector
Mixed Chart
IPSOS
Add to my slides
Remove from favorites
The slide features country-specific results and a column chart showing overall and response trend results over the years.
Regulatory and Compliance
Financial Services
The slide highlights the increasing rigor of tax examinations by the tax authority in the parent company’s jurisdiction.
Tax examinations, rigor, global tax, Deloitte, agree, strongly agree, survey, multinational
false
Regulatory and Compliance
Financial Services
Multiple Chart
Deloitte
Add to my slides
Remove from favorites
Side-by-side bar chart and donut charts comparing tax-free vs. taxable accounts; callout on state benefits.
Investment Analysis
Financial Services
This slide compares the outcomes of investing in a tax-free 529 plan versus a taxable account over 18 years. It shows how tax advantages can lead to $41,534 more in growth. The slide also details federal and state tax benefits and emphasizes the importance of account selection for educational investing.
tax-free investing, 529 plans, taxable account, education, savings growth
false
Investment Analysis
Financial Services
Multiple Chart
JP Morgan
Add to my slides
Remove from favorites
Slide includes pie charts and textual analysis on the state of tax functions within financial services, focusing on structure and optimization.
Operational Efficiency
Financial Services
Discusses the evolution and optimization of tax functions in financial services, suggesting trends towards more robust functions.
tax functions, financial services, optimization, pie chart, analysis, trends
false
Operational Efficiency
Financial Services
Multiple Chart
PwC/Strategy&
Add to my slides
Remove from favorites
Vertical stacked bar chart showing $394B funding breakdown; simple visual style with a clean left-side explanation.
Corporate Finance and Valuation
Government & Public Sector
The slide outlines how the IRA distributes energy and climate change funding among tax incentives, grants, and loans. Corporate tax incentives receive the largest portion, highlighting a strategy to drive private investment.
tax incentives, corporate funding, grants, loans, IRA, private investment, climate policy
false
Corporate Finance and Valuation
Government & Public Sector
Mixed Chart
McKinsey
Add to my slides
Remove from favorites
Includes two side-by-side section of texts and a table listing tax incentives for domestic and export enterprises under CREATE, with concise bullet point comparisons.
Investment Analysis
Financial Services
Provides details on different tax incentives available for registered enterprises, outlining specific conditions and tax rates.
tax incentives, enterprises, CREATE, fiscal, domestic, export, Philippines
false
Investment Analysis
Financial Services
Table
Deloitte
Add to my slides
Remove from favorites
Displays tiered categorization of industries and a table detailing duration of tax incentives based on location and industry tier.
Investment Analysis
Financial Services
Discusses the structure and duration of tax incentives for enterprises across different industry tiers and geographical locations.
tax incentives, industries, tiers, duration, CREATE, investment, Philippines
false
Investment Analysis
Financial Services
Table
Deloitte
Add to my slides
Remove from favorites
Features a bar chart and explanatory text sections divided by headers. The chart and text provide analysis on key performance indicators for tax functions.
Performance Metrics and KPIs
Financial Services
Examines key performance indicators crucial for tax functions in the financial services industry, discussing misalignments in priorities and the need for strategic alignment of tax KPIs with overall business objectives.
tax, KPIs, performance, financial services, bar chart, alignment
false
Performance Metrics and KPIs
Financial Services
Mixed Chart
PwC/Strategy&
Add to my slides
Remove from favorites
Content slide with numbered sections and a central figure showing various tax and legal implications, with green and blue text and icons.
Regulatory and Compliance
Financial Services
This slide discusses the tax, social security, and legal implications of remote work, covering topics like shifting tax costs, increased tax risk, payroll reporting requirements, and compliance management.
Tax, legal, compliance, social security, remote work
false
Regulatory and Compliance
Financial Services
Diagram
Deloitte
Add to my slides
Remove from favorites
Details tax service offerings along the M&A lifecycle with a structured flowchart that links stages from Funds formation to Exit planning.
Investment Analysis
Professional Services
Explores the comprehensive tax services provided by Alvarez & Marsal throughout the M&A lifecycle, ensuring tax efficiency from start to finish.
Tax, M&A, Lifecycle, Services, Planning
false
Investment Analysis
Professional Services
Table
Alvarez & Marsal
Add to my slides
Remove from favorites
Bar charts and infographics comparing SEA with global coal plant data, case study on Singapore-Asia taxonomy included
Regulatory and Compliance
Financial Services
Emphasizes the importance of a unified green finance taxonomy in SEA to address fossil fuel reliance, reduce risks, and encourage investments, showcasing Singapore’s leadership in sustainable finance standards
taxonomy, coal power, Singapore, green finance, sustainable finance, investor risk, regulation
false
Regulatory and Compliance
Financial Services
Multiple Chart
Bain
Add to my slides
Remove from favorites
Features a world map showing the status of taxonomies in different regions, with accompanying text explaining the varying objectives and eligibility approaches.
Market Analysis and Trends
Financial Services
This slide provides an overview of the global taxonomy landscape, detailing the status and development of taxonomies in different regions and their varying objectives.
Taxonomy, global, finance, ESG, regions, objectives, eligibility, banking, sustainability, landscape
false
Market Analysis and Trends
Financial Services
Graphic
Deutsche Bank
Add to my slides
Remove from favorites
Bar chart showing percentages of family offices not confident in various tax operations, with supporting text.
Regulatory and Compliance
Financial Services
Addresses the lack of confidence in tax operations among APAC family offices, detailing areas of concern.
tax operations, confidence, APAC, family offices, transparency
false
Regulatory and Compliance
Financial Services
Mixed Chart
EY
Add to my slides
Remove from favorites
Column chart comparing percentages of those who believe taxes should be increased on businesses and individuals.
Regulatory and Compliance
Financial Services
Examines opinions on tax policy changes post-pandemic, focusing on who should bear increased tax burdens.
tax policy, pandemic, businesses, high-net worth individuals, tax increases
false
Regulatory and Compliance
Financial Services
Mixed Chart
EY
Add to my slides
Remove from favorites
Horizontal bar chart ranked by % agreement, showing all four response categories. Average agreement noted at the top.
Regulatory and Compliance
Government & Public Sector
This slide reveals how people across 28 countries feel about tax increases for public spending. A majority disagree, with only 19% agreeing on average. The slide includes historical comparisons and visual segmentation by agreement intensity.
tax policy, public finance, taxation sentiment, Ipsos, government spending, fiscal responsibility, global opinion
false
Regulatory and Compliance
Government & Public Sector
Mixed Chart
IPSOS
Add to my slides
Remove from favorites
Horizontal bar chart ranked by countries on likelihood of increased taxes in 2025; includes "Likely" and "Unlikely" percentages.
Market Analysis and Trends
Financial Services
This slide explores expectations of tax increases by country in 2025. It lists survey results indicating where people most strongly believe taxes will rise, including global average.
tax policy, public opinion, economic forecasts, government revenue, Ipsos, survey results, 2025
false
Market Analysis and Trends
Financial Services
Mixed Chart
IPSOS
Add to my slides
Remove from favorites
The slide includes both text and visual elements such as icons and a cartoon character, detailing various tax proposals and policy changes.
Regulatory and Compliance
Government & Public Sector
Outlines proposed tax changes and reforms, focusing on fiscal policy adjustments aimed at improving tax collection and economic recovery.
tax proposals, fiscal policy, government reform
false
Regulatory and Compliance
Government & Public Sector
Table
PwC/Strategy&
Add to my slides
Remove from favorites
The slide shows a column chart with projected tax rate reductions from 2024 to 2026, accompanied by principal considerations for these changes.
Regulatory and Compliance
Financial Services
This slide outlines the expected reduction in effective tax rates following key legal entity mergers, detailing the factors contributing to these changes over the next few years.
tax rate, legal mergers, reduction, compliance, 2026
false
Regulatory and Compliance
Financial Services
Mixed Chart
UBS
Add to my slides
Remove from favorites
The slide features country-specific results and a column chart showing overall and response trend results over the years.
Regulatory and Compliance
Financial Services
The slide discusses the expectation of increased tax rates due to government deficits caused by COVID-19.
Tax rates, government deficits, COVID-19, global tax, Deloitte, agree, strongly agree, survey, multinational
false
Regulatory and Compliance
Financial Services
Multiple Chart
Deloitte
Add to my slides
Remove from favorites
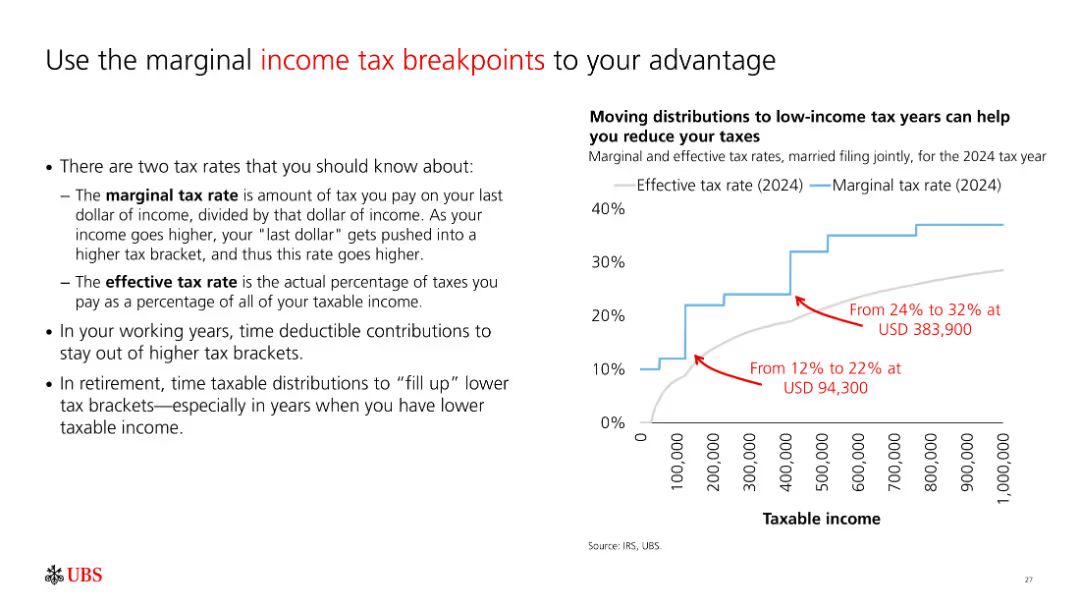
A slide with a column chart and text explaining marginal and effective tax rates. The chart shows tax rates across different income levels with annotations.
Financial Performance
Financial Services
The slide explains the concepts of marginal and effective tax rates, highlighting how to use tax breakpoints to reduce tax liability, supported by a column chart.
tax rates, marginal tax, effective tax, tax planning, financial strategy
false
Financial Performance
Financial Services
Mixed Chart
UBS
Add to my slides
Remove from favorites
Features bulleted recommendations, each highlighted with an icon, against a structured textual layout. Visual elements are minimal but focused on enhancing content comprehension.
Strategic Planning
Financial Services
Provides strategic recommendations for enhancing tax function effectiveness in financial services. It focuses on aligning tax strategy with business strategy and leveraging technology for improved tax management.
tax, recommendations, strategy, financial services, alignment, technology
false
Strategic Planning
Financial Services
Pillar
PwC/Strategy&
Add to my slides
Remove from favorites
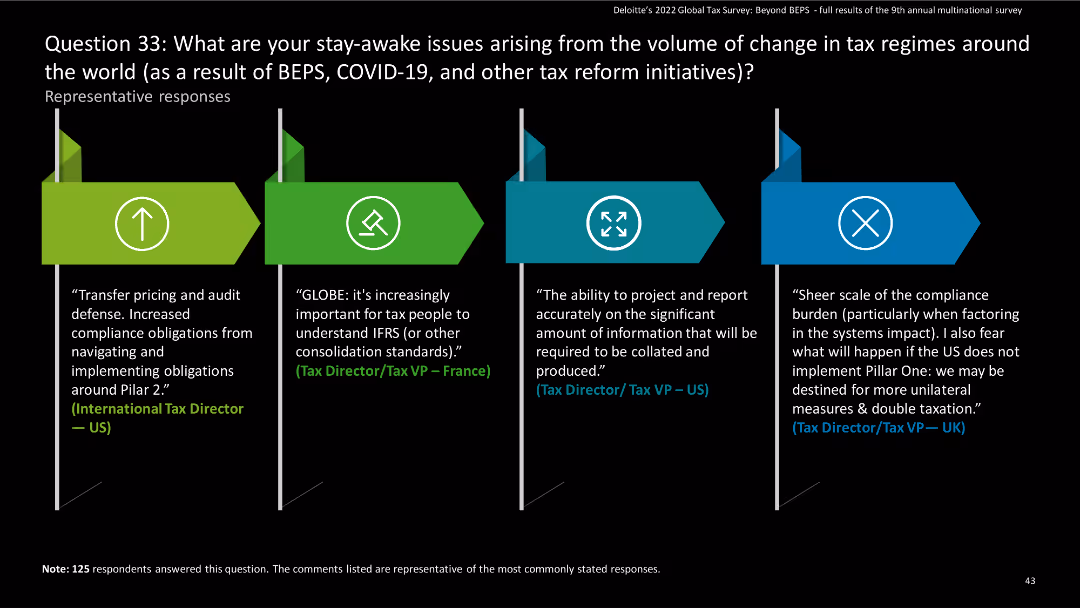
The slide uses a four-column layout with arrows and flag icons to highlight key issues in different colors (green, light blue, dark blue).
Risk Assessment and Management
Financial Services
The slide presents responses from tax directors in the US, France, and UK regarding challenges from BEPS, COVID-19, and other tax reforms.
tax reform, BEPS, compliance, IFRS, consolidation
false
Risk Assessment and Management
Financial Services
Pillar
Deloitte
Add to my slides
Remove from favorites
Contains a circular flow diagram detailing various government reforms in tax policy and international cooperation starting October 2019.
Regulatory and Compliance
Government & Public Sector
Outlines Namibia's recent reforms in tax regulation and international tax agreements, highlighting the strategic focus on improving fiscal policies.
tax reform, Namibia, government policy, international cooperation, fiscal policy
false
Regulatory and Compliance
Government & Public Sector
Linear Flow
PwC/Strategy&
Add to my slides
Remove from favorites
Left side features text discussing tax and regulatory frameworks, while the right side has a vertical bar chart showing expectations of Greece's attractiveness.
Regulatory and Compliance
Government & Public Sector
Analysis of how Greece can improve its investment appeal through modernizing tax and regulatory frameworks, addressing concerns, and simplifying processes.
Tax, regulatory framework, investment, Greece, compliance
false
Regulatory and Compliance
Government & Public Sector
Mixed Chart
EY
Add to my slides
Remove from favorites
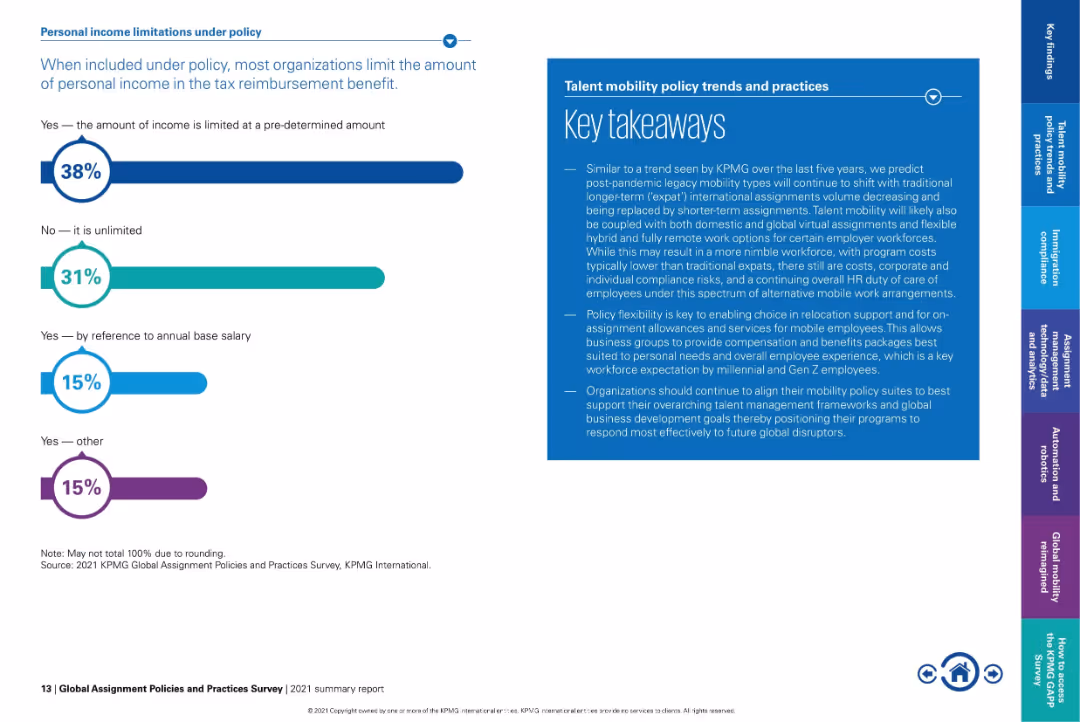
Bar graph on left and text-heavy takeaway box on right in blue.
Regulatory and Compliance
Financial Services
Explains how organizations limit personal income within tax reimbursement policies. 38% impose a predefined cap, while 31% allow unlimited inclusion. Also provides key takeaways on policy flexibility and how mobility policies are evolving post-pandemic.
tax reimbursement, income limitations, expat benefits, flexible mobility, policy caps, compensation policy
false
Regulatory and Compliance
Financial Services
Mixed Chart
KPMG
Add to my slides
Remove from favorites
Features multiple horizontal bars in varying colors representing different tax categories such as VAT, customs, and corporate income, set against a percentage scale.
Regulatory and Compliance
Government & Public Sector
The slide provides a breakdown of tax revenue composition, useful for financial strategists to understand major fiscal contributors and planning.
tax, revenue, composition, VAT, customs, corporate income, financial planning, government, strategy, analysis
false
Regulatory and Compliance
Government & Public Sector
Single Chart
PwC/Strategy&
Add to my slides
Remove from favorites
Displays a bar chart with vertical bars showing different tax categories, including VAT, corporate tax, and customs, with colors distinguishing the tax types.
Regulatory and Compliance
Government & Public Sector
The slide provides a detailed composition of tax revenue sources, quantifying each category such as VAT, individual income tax, and corporate tax. It highlights the fiscal landscape's dependence on various tax revenues, useful for policy analysis and economic planning.
Tax, Revenue, Fiscal analysis, Government, Budget
false
Regulatory and Compliance
Government & Public Sector
Single Chart
PwC/Strategy&
Add to my slides
Remove from favorites
This slide displays a bar graph showing the percentage composition of different tax sources including customs & excise, VAT, individual income tax, and corporate income tax. Each category is represented by a different color and clearly labeled, making it straightforward to interpret.
Financial Performance
Government & Public Sector
This slide provides a breakdown of various sources of tax revenue in Namibia, highlighting the significant contributions of each type. It is commonly used in financial or economic presentations to illustrate how different taxes contribute to the national budget.
tax revenue, fiscal analysis, revenue sources, Namibia
false
Financial Performance
Government & Public Sector
Single Chart
PwC/Strategy&
Add to my slides
Remove from favorites
This slide has multiple line graphs in different colors tracing the historical data of various tax revenues over the years, highlighting trends and changes.
Regulatory and Compliance
Government & Public Sector
Analyzes trends in tax revenue streams over time, aiding in forecasting and fiscal planning, with emphasis on customs, VAT, and corporate taxes.
tax, revenue, historical, forecasting, trends, customs, VAT, corporate, finance, government, analysis
false
Regulatory and Compliance
Government & Public Sector
Single Chart
PwC/Strategy&
Add to my slides
Remove from favorites
Includes line charts showing tax revenue and household consumption over time under low and high growth scenarios. Text explains fiscal and consumption benefits.
Financial Performance
Energy & Utilities
Explains how increased oil and gas investment can bolster tax revenues and household spending, with detailed projections under different growth scenarios.
Tax Revenue, Household Consumption, Economic Growth, Oil and Gas, Investment, Fiscal Impact, Western Australia
false
Financial Performance
Energy & Utilities
Multiple Chart
EY
Add to my slides
Remove from favorites
The slide displays multiple data visualizations including a donut chart showing tax revenue breakdown, and two sets of column charts comparing income and company tax over three years.
Financial Performance
Government & Public Sector
This slide presents Namibia's tax revenue composition and comparisons for income tax on individuals and company tax, illustrating fiscal trends and government financial management.
tax, revenue, Namibia, income tax, company tax, fiscal trends, financial management, government
false
Financial Performance
Government & Public Sector
Multiple Chart
PwC/Strategy&
Add to my slides
Remove from favorites
Contains a large red and black pie chart with labels, detailing the percentage split between tax and non-tax revenue, accompanied by three colored triangles representing different non-tax revenue sources.
Regulatory and Compliance
Government & Public Sector
This slide visually differentiates the proportions of tax and non-tax revenue for a fiscal year, highlighting major sources like administrative fees and entrepreneurial income.
tax, revenue, non-tax, administrative fees, entrepreneurial, finance, government, analysis, proportion, sources
false
Regulatory and Compliance
Government & Public Sector
Mixed Chart
PwC/Strategy&
Add to my slides
Remove from favorites
The slide features a large pie chart that compares tax revenue to non-tax revenue, color-coded in red and pink respectively. The chart is clearly labeled with percentages, making it easy to understand at a glance.
Financial Performance
Government & Public Sector
This slide visually represents the composition of tax versus non-tax revenue in Namibia's budget, providing a quick overview of fiscal sources. It is useful in financial presentations or economic discussions where the focus is on understanding the structure of national revenues.
tax revenue, non-tax revenue, fiscal analysis, budget comparison
false
Financial Performance
Government & Public Sector
Single Chart
PwC/Strategy&
Add to my slides
Remove from favorites
A pie chart showing the percentage distribution between tax revenue and non-tax revenue for the fiscal year 2019/20. The chart is colored in shades of gray, with a clear distinction between the two categories.
Financial Performance
Government & Public Sector
This slide presents a clear visual representation of the revenue sources for a government, highlighting the overwhelming dependence on tax revenue compared to non-tax sources. It provides a foundational understanding for discussions on fiscal policy and revenue management strategies.
tax revenue, non-tax revenue, fiscal policy, government finance, budget
false
Financial Performance
Government & Public Sector
Single Chart
PwC/Strategy&
Add to my slides
Remove from favorites
The slide features a stacked bar chart displaying cumulative undiscounted tax revenues from carbon taxation across various regions and scenarios. The text highlights expected revenue increases from different carbon pricing floors.
Financial Performance
Energy & Utilities
Analyzes expected increases in tax revenues from different carbon pricing floors across various regions, predicting significant revenue generation particularly from regions with higher emission intensity.
tax revenues, carbon taxation, regions, pricing floors, emissions
false
Financial Performance
Energy & Utilities
Mixed Chart
EY
Add to my slides
Remove from favorites
Contains a column chart with listed tax risks ranked by importance. The slide design includes headers and detailed text explanations.
Risk Assessment and Management
Financial Services
Discusses various tax risks faced by the financial services industry in Nigeria, ranking them by significance. It elaborates on the complexities and challenges of managing these risks within the industry.
tax, risks, financial services, assessment, management, column chart
false
Risk Assessment and Management
Financial Services
Vertical Flow
PwC/Strategy&
Add to my slides
Remove from favorites
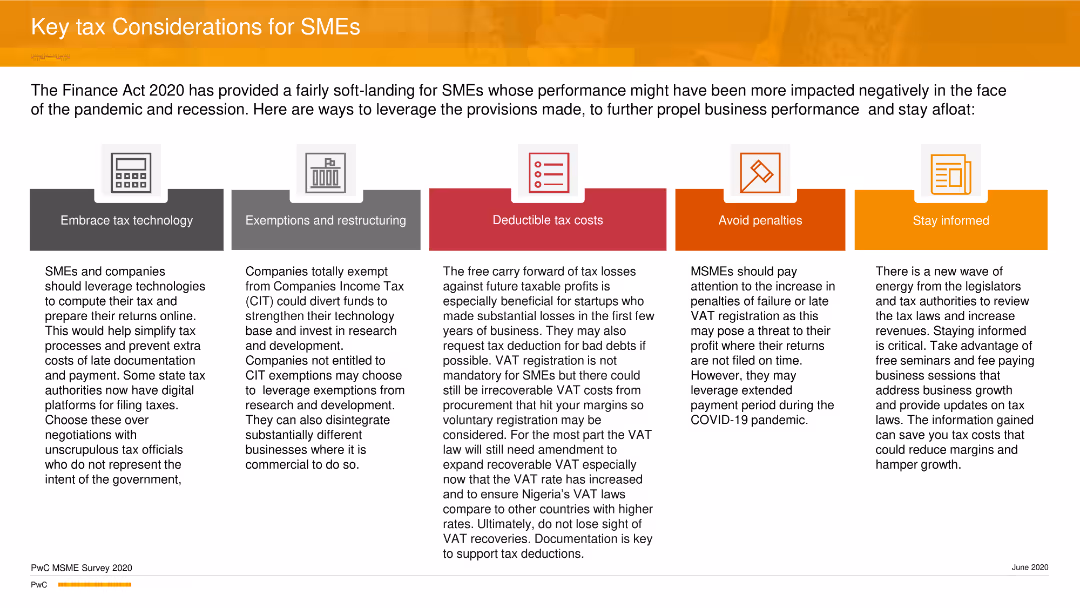
The slide features five icons representing key tax considerations: technology, exemptions, deductible costs, penalties, and staying informed.
Strategic Planning
Financial Services
The slide offers strategic tax considerations for SMEs, focusing on leveraging technology, understanding exemptions, managing deductible costs, avoiding penalties, and staying informed about tax laws to improve business performance during the pandemic and recession.
Tax, SMEs, Strategy, Planning, Business, PwC
false
Strategic Planning
Financial Services
Pillar
PwC/Strategy&
Add to my slides
Remove from favorites
The slide features a pie chart showing survey results about organizations' tax strategies. It includes textual sections for introduction, key takeaways, and detailed findings.
Regulatory and Compliance
Financial Services
This slide presents survey findings on the absence of documented tax strategies in organizations. It emphasizes the need for clear tax strategies in the Nigerian Financial Services Industry and discusses potential impacts of their absence.
tax, strategy, compliance, survey, financial services, documentation, pie chart, organizational policy
false
Regulatory and Compliance
Financial Services
Mixed Chart
PwC/Strategy&
Add to my slides
Remove from favorites
The slide features country-specific results and a column chart showing overall and response trend results over the years.
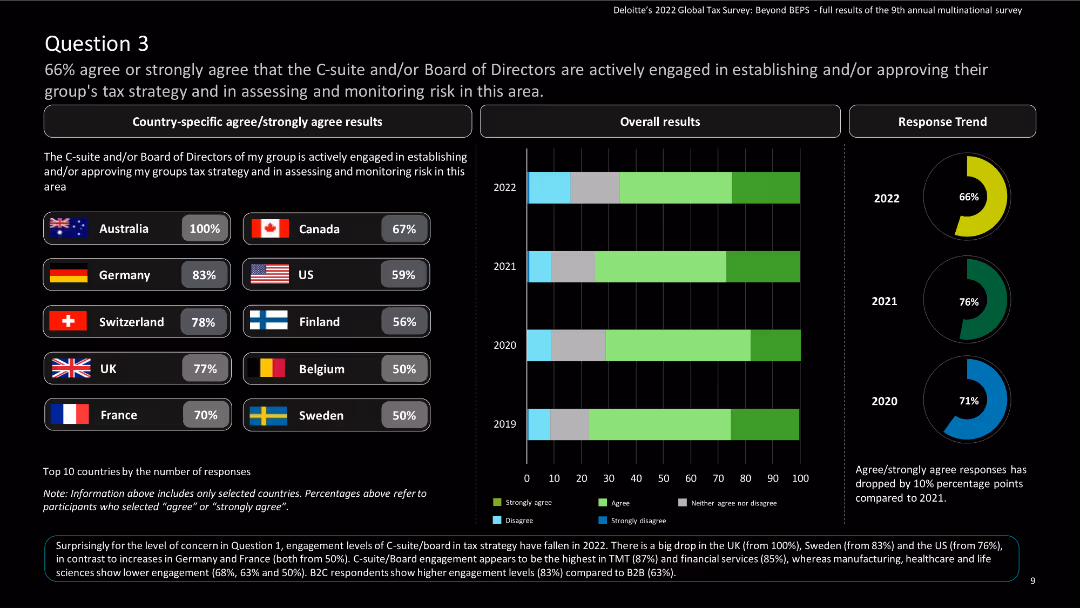
Regulatory and Compliance
Financial Services
The slide highlights C-suite and board engagement in tax strategy and monitoring risk, indicating high engagement in most countries.
Tax strategy, risk monitoring, C-suite, board engagement, global tax, Deloitte, agree, strongly agree, survey, multinational
false
Regulatory and Compliance
Financial Services
Multiple Chart
Deloitte
Add to my slides
Remove from favorites
Contains multiple column charts comparing technology adoption across different tax functions with significant text explanations and a detailed header section.
Technology and Digital Transformation
Financial Services
Discusses the low adoption of technology in tax functions despite its potential to enhance efficiency and compliance. The slide offers a comparative analysis of technology use in various tax-related processes.
tax, technology, compliance, digital transformation, bar charts, adoption
false
Technology and Digital Transformation
Financial Services
Mixed Chart
PwC/Strategy&
Add to my slides
Remove from favorites
The slide includes a waterfall chart depicting changes in tangible book value per share (TBVPS) from 3Q22 to 4Q22.
Financial Performance
Financial Services
This slide explains the impact of the rights issue and net loss on TBVPS, detailing various contributing factors like FX and own credit.
TBVPS, rights issue, net loss, tangible book value, financial impact
false
Financial Performance
Financial Services
Single Chart
Credit Suisse
Add to my slides
Remove from favorites
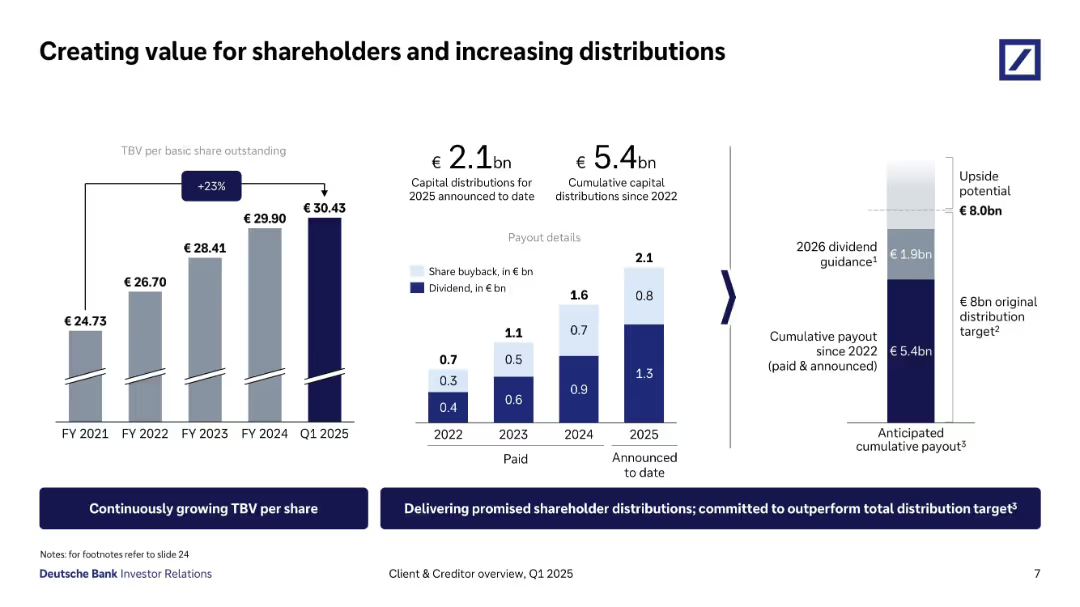
Dual-bar and column charts visualizing TBV/share growth, payout breakdown, and future distribution guidance.
Strategic Planning
Financial Services
This slide shows consistent tangible book value growth per share and cumulative shareholder payouts. It outlines dividend and buyback activity since 2022, reaching €5.4bn, and sets an €8bn distribution target by 2026.
TBV, shareholder returns, dividend, share buyback, capital distribution, 2026 guidance, payout strategy
false
Strategic Planning
Financial Services
Multiple Chart
Deutsche Bank
Add to my slides
Remove from favorites
Features a column chart comparing quarterly TCE rates against a cash flow breakeven rate line, with additional annotations for fiscal benchmarks and estimates.
Financial Performance
Transportation & Logistics
Analyzes the company's freight earnings before interest, taxes, depreciation, and amortization over multiple quarters, highlighting efficiency and financial health.
TCE, financial health, cash flow, breakeven, fiscal performance
false
Financial Performance
Transportation & Logistics
Single Chart
Deutsche Bank
Add to my slides
Remove from favorites
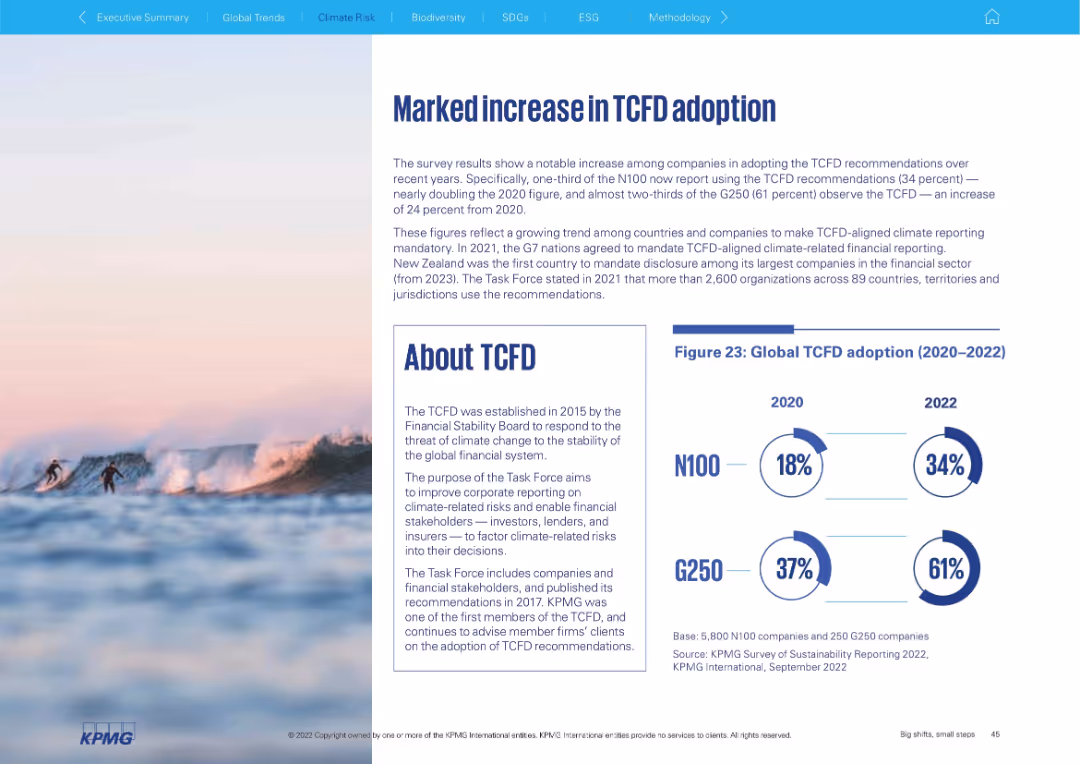
Left: narrative text and About TCFD box; Right: donut chart shows increase in TCFD adoption (2020–2022) for N100 and G250. Surf-themed background adds visual interest.
Regulatory and Compliance
Environmental Services & Sustainability
The slide shows rising corporate adoption of TCFD recommendations between 2020 and 2022. It underscores global efforts to make climate-related disclosures mandatory and presents key facts about TCFD's mission and purpose, with nearly two-thirds of G250 firms now aligned.
TCFD, climate disclosure, ESG, adoption, reporting, G250, N100
false
Regulatory and Compliance
Environmental Services & Sustainability
Mixed Chart
KPMG
Add to my slides
Remove from favorites
Depicts a central graphic with concentric circles detailing governance, strategy, risk management, and targets, accompanied by side text and logos.
Regulatory and Compliance
Industrial & Manufacturing
Discusses how Michelin adheres to the Task Force on Climate-Related Financial Disclosures (TCFD) with a focus on governance, strategy, risk management, and targets related to climate initiatives.
TCFD, Michelin, Climate Change, Financial Disclosures, Risk Management, Strategy, Governance, Environmental Targets, Corporate Responsibility, Sustainability
false
Regulatory and Compliance
Industrial & Manufacturing
Framework
Morgan Stanley
Add to my slides
Remove from favorites
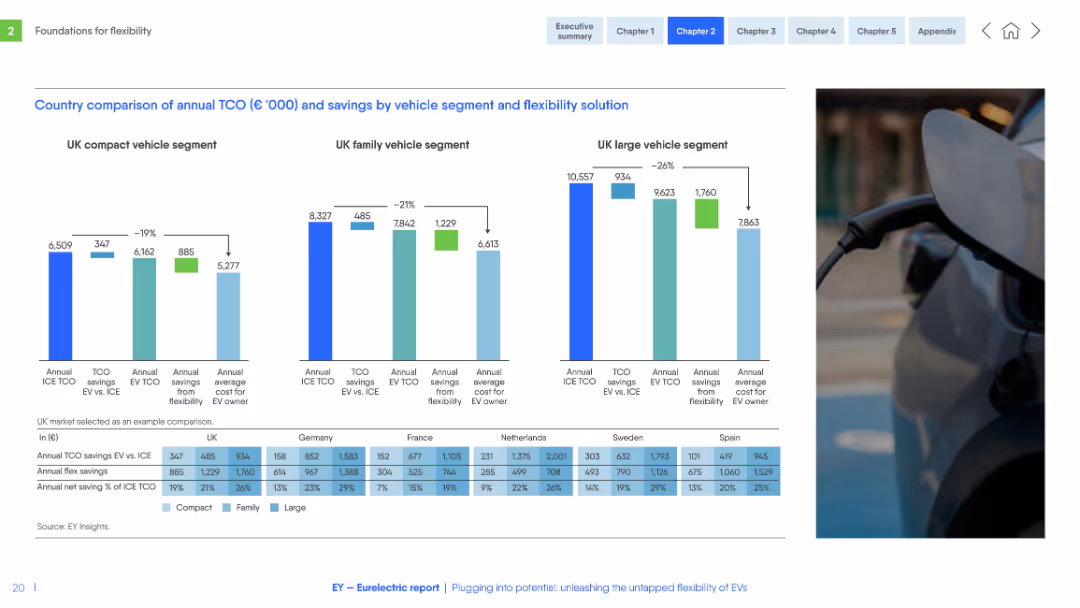
Three side-by-side bar charts for vehicle segments (compact, family, large), with data table below. Consistent color scheme and structured layout.
Financial Performance
Transportation & Logistics
Compares total cost of ownership (TCO) for EVs vs. ICE vehicles in several EU countries across vehicle segments. Shows cost savings from EV flexibility solutions and identifies where EVs are most financially advantageous.
TCO, EV vs ICE, flexibility savings, vehicle segment, Europe, cost analysis, compact, family, large
false
Financial Performance
Transportation & Logistics
Multiple Chart
EY
Add to my slides
Remove from favorites
The slide uses column charts to compare the total cost of ownership (TCO) for trucks (FCEV, BEV, Diesel ICE) in 2019 and long term.
Market Analysis and Trends
Energy & Utilities
The slide compares the total cost of ownership for fuel cell electric trucks, battery electric trucks, and diesel internal combustion engine trucks, highlighting competitiveness.
TCO, FCEV, BEV, diesel, trucks, competitiveness
false
Market Analysis and Trends
Energy & Utilities
Mixed Chart
Kearney
Add to my slides
Remove from favorites
The slide uses column charts to compare the total cost of ownership (TCO) for different car types (FCEV, BEV, ICE hybrid) in 2019 and long term.
Financial Performance
Energy & Utilities
The slide compares the total cost of ownership for fuel cell electric vehicles, battery electric vehicles, and internal combustion engine hybrids, noting the competitiveness of FCEVs.
TCO, FCEV, BEV, ICE, competitiveness, ownership
false
Financial Performance
Energy & Utilities
Mixed Chart
Kearney
Add to my slides
Remove from favorites
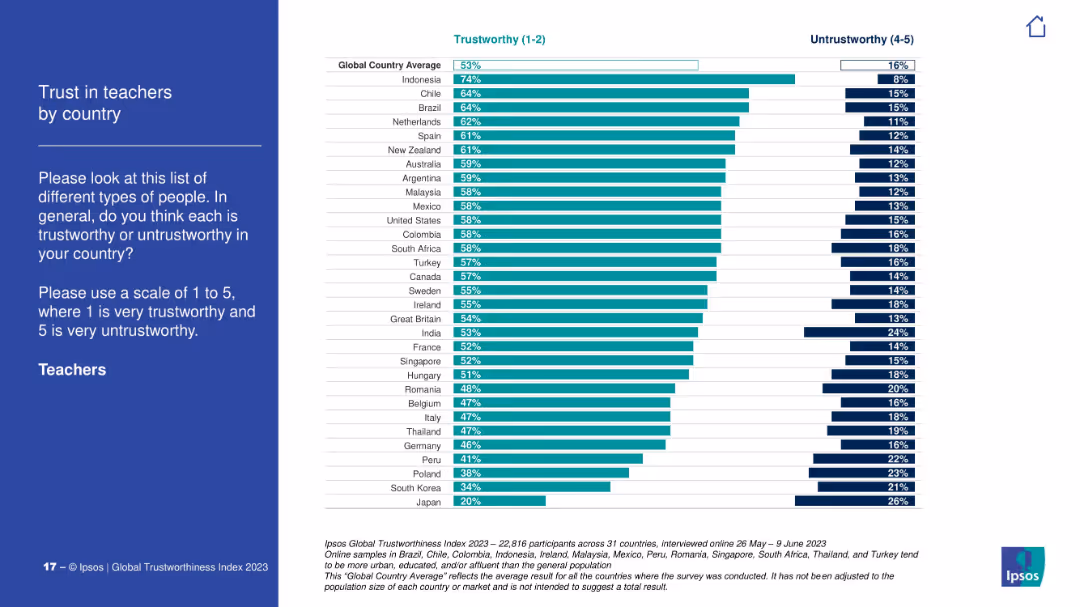
Vertical bar chart ranking countries by trust in teachers. Includes global average. Clean, consistent design with others in the series.
Customer and Market Segmentation
Education & Training
The slide displays the public's trust in teachers across different countries. Indonesia leads with 74% trust, while Japan and South Korea are at the bottom. The global average is 53%, with notable variation across regions.
teachers, trust index, international comparison, Ipsos, education, perception analysis
false
Customer and Market Segmentation
Education & Training
Mixed Chart
IPSOS
Add to my slides
Remove from favorites
Features a central hexagon with various team effectiveness traits surrounded by related icons, a circle graph, and two small bar charts depicting related statistics.
Human Resources and Talent Management
Professional Services
Discussing top team effectiveness, this slide provides a framework for building a capable leadership team aligned with SDG goals. It underscores the importance of strategic alignment, stakeholder perspective, and interpersonal interactions to foster an effective, sustainable leadership environment.
Team Effectiveness, Leadership, SDGs, Strategic Alignment, Stakeholder Engagement
false
Human Resources and Talent Management
Professional Services
Multiple Chart
McKinsey
Add to my slides
Remove from favorites
Previous
Next
You don't have any favorites yet.
Please wait loading your favorites slides...
Create a FREE account to continue browsing
Receive Instant Access to 1,000+ slides from companies like McKinsey, Google, and Goldman Sachs
First Name
Last Name
Email
Password
I agree to all
Terms & Privacy Policy
Thank you! Your submission has been received!
Oops! Something went wrong while submitting the form.
Have an account?
Sign in
Upgrade to PRO to Save slides
Advanced Search and Filters
Access to 15,000+ slides
Access to Category Pages
Save/Bookmark Slides
PowerPoint Template Library
Pick a Plan
MONTHLY
$12/month
Billed every month, Cancel anytime.
YEARLY
$9/year
Billed $108 annually, Cancel anytime.
Checkout for $12/month
Checkout for $108/yr
Secured by Stripe | AES-256 bit encryption


![Do you agree or disagree that the [Country] government should increase taxes to pay for any additional public spending?](https://cdn.prod.website-files.com/654e70fb59937215cac87b19/6899be5a17bfc679827d8cd4_89Dytfk8_m8vVOM4eARuWNL44zIYj1yRNL_qwFczhzU.avif)


![Cumulative undiscounted tax revenues for the power sector for 2020 to 2050 [€t]](https://cdn.prod.website-files.com/654e70fb59937215cac87b19/680b8124d898dfe5a3e4e9a3_eqxN840rjScGYUjcRvFia_6H2A7w4RmnK7QlvsBQ5zw.avif)