My Account
My Slides
Search by Category
Pricing
Templates
View All Templates
Download Template Slides
✦ AI Search
Feedback
Login
Logout
Get Started
Browse all Slides
Browse all Slides
Create a FREE Account
Instant access to 1,000+ real slides from top companies like McKinsey, BCG, Goldman Sachs, Google and many more!
First Name
Last Name
Email
Password
I agree to all
Terms & Privacy Policy
Thank you! Your submission has been received!
Oops! Something went wrong while submitting the form.
Have an account?
Sign in
Saved Slides
Total No. of slides saved
0
↻ Refresh
✖ Clear all
The slide outlines team, category, and supplier excellence pillars with icons and a diagram of Kearney's House of Purchasing and SupplySM.
Human Resources and Talent Management
Professional Services
It describes the pillars for sustained procurement performance, highlighting the roles of team excellence, category excellence, and supplier excellence.
Team excellence, category excellence, supplier excellence, procurement, performance, talent
false
Human Resources and Talent Management
Professional Services
Diagram
Kearney
Add to my slides
Remove from favorites
The slide outlines team, category, and supplier excellence pillars with icons and a diagram of Kearney's House of Purchasing and SupplySM.
Human Resources and Talent Management
Professional Services
It describes the pillars for sustained procurement performance, highlighting the roles of team excellence, category excellence, and supplier excellence.
Team excellence, category excellence, supplier excellence, procurement, performance, talent
false
Human Resources and Talent Management
Professional Services
Header Vertical
Kearney
Add to my slides
Remove from favorites
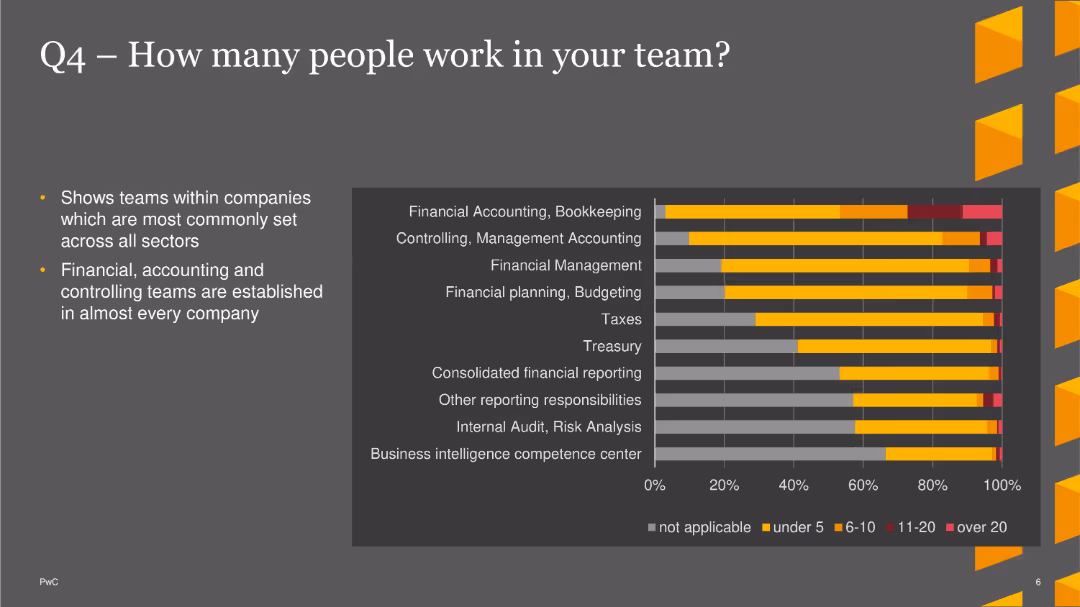
The slide features a bar chart showing the number of people in different teams across various sectors, highlighting common team sizes.
Market Analysis and Trends
Financial Services
This slide shows that financial, accounting, and controlling teams are common across companies, with detailed distribution of team sizes.
Team Size, Financial, Accounting, Bar Chart, PwC, Survey, 2022
false
Market Analysis and Trends
Financial Services
Mixed Chart
PwC/Strategy&
Add to my slides
Remove from favorites
The slide contrasts fintech, metaverse, healthtech, and edtech sectors with lists of top drivers and barriers, and a feature image of a woman using a smartphone.
Market Analysis and Trends
Technology & Software
Highlights the main drivers and barriers to adoption for new technologies like e-wallets, AR, VR, and online courses, essential for strategic planning.
Tech Adoption, Drivers, Barriers, Fintech, Metaverse, Healthtech, Edtech, Strategic Planning
false
Market Analysis and Trends
Technology & Software
Table
Bain
Add to my slides
Remove from favorites
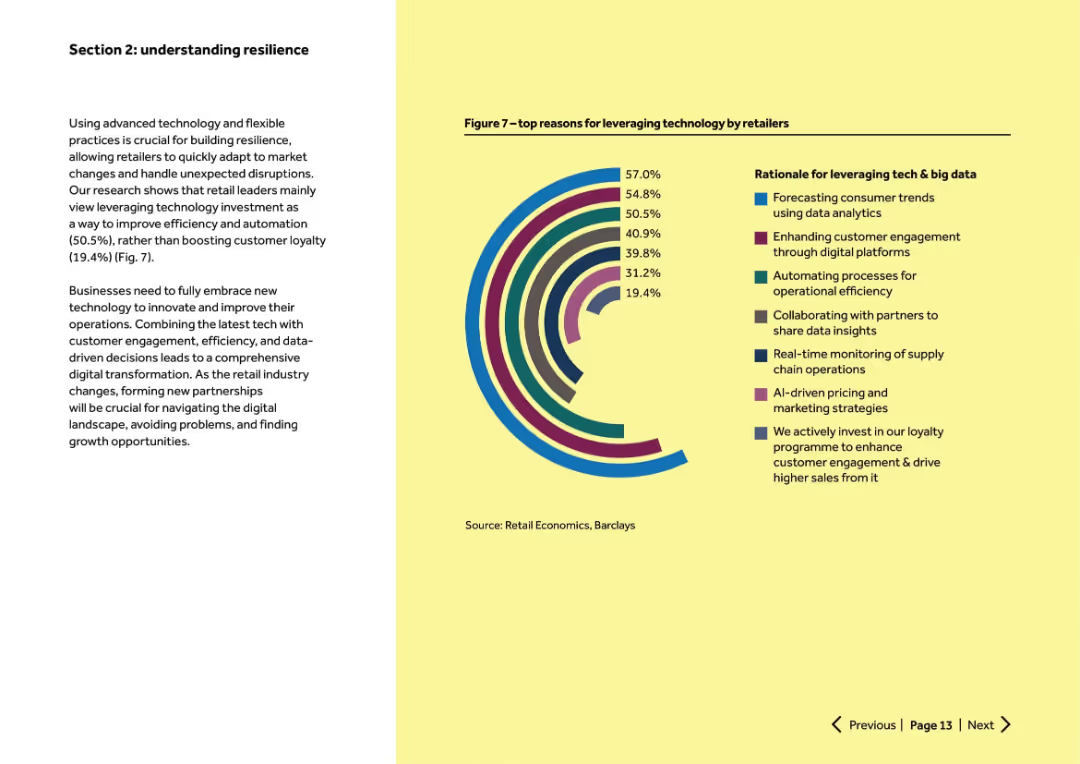
Left column of text discussing benefits of technology use. Right half-circle chart shows top reasons retailers use tech and data.
Technology and Digital Transformation
Retail & E-commerce
Retailers are using tech primarily for efficiency, trend forecasting, and engagement. 50.5% use it to automate processes. Chart highlights multiple strategic reasons for tech investment, showing a strong focus on data-driven decision-making.
tech adoption, retail, efficiency, data analytics, digital transformatio
false
Technology and Digital Transformation
Retail & E-commerce
Mixed Chart
Barclays
Add to my slides
Remove from favorites
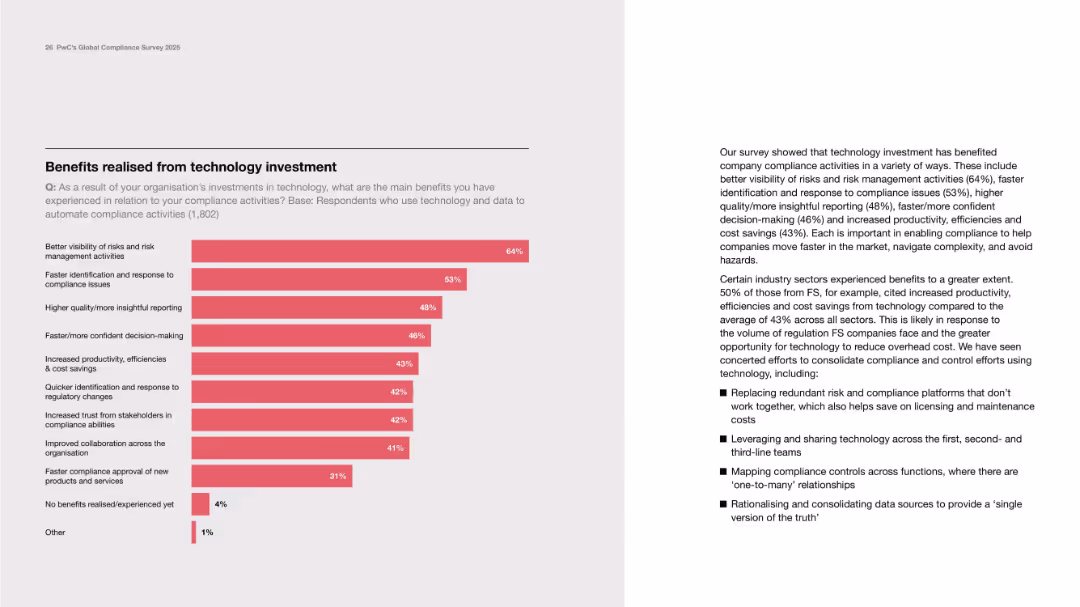
Left-aligned bar chart; right paragraph details sector-specific gains and consolidated strategies.
Financial Performance
Technology & Software
Outlines benefits of tech in compliance including visibility, faster decisions, productivity, and collaboration. Text notes financial sector gains and strategies like platform consolidation and cross-functional tech sharing.
tech benefits, decision-making, reporting, collaboration, cost savings
false
Financial Performance
Technology & Software
Mixed Chart
PwC/Strategy&
Add to my slides
Remove from favorites
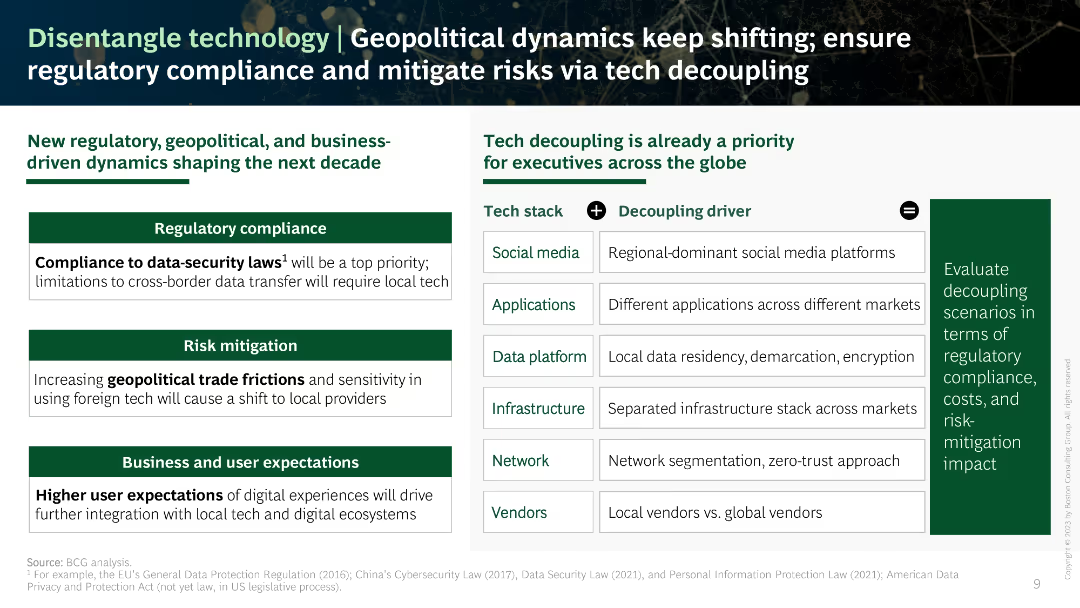
Two-column comparison of tech stacks and decoupling drivers across different categories like social media, applications, and infrastructure, with text descriptions.
Risk Assessment and Management
Technology & Software
The slide discusses the need for tech decoupling to manage geopolitical and regulatory dynamics, comparing different tech stacks and the drivers for decoupling.
tech decoupling, regulation, compliance, risk mitigation
false
Risk Assessment and Management
Technology & Software
Boxed
BCG
Add to my slides
Remove from favorites
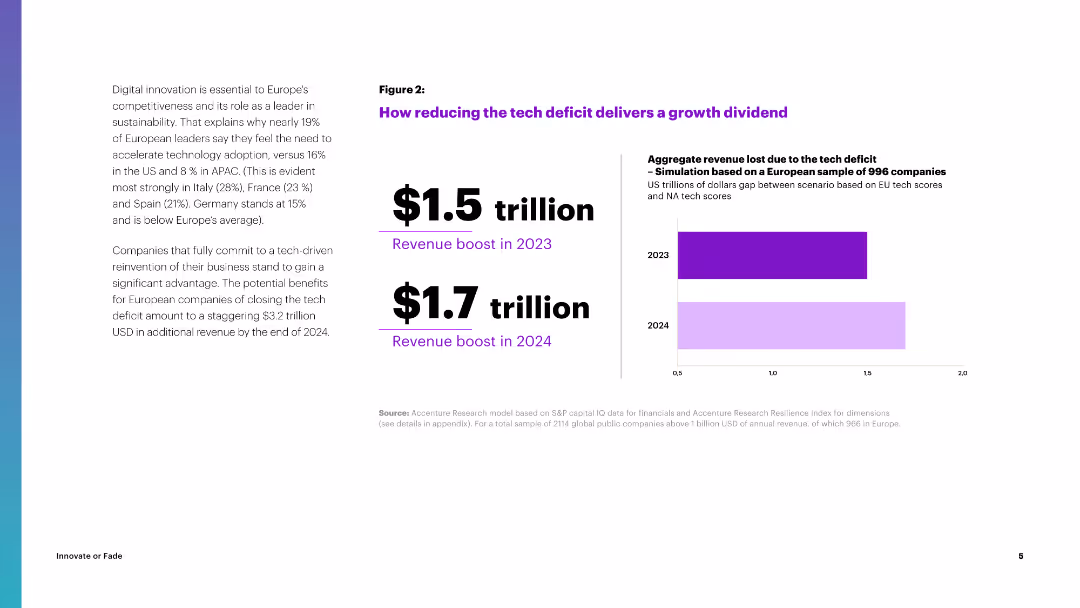
The slide features a column chart illustrating the projected revenue boost from reducing the tech deficit in Europe, with figures for 2023 and 2024.
Strategic Planning
Financial Services
It explains the potential revenue gains from reducing the tech deficit in Europe, projecting significant financial benefits by 2024, emphasizing the importance of tech adoption.
Tech Deficit, Revenue, Growth, Europe, Financial Benefits
false
Strategic Planning
Financial Services
Mixed Chart
Accenture
Add to my slides
Remove from favorites
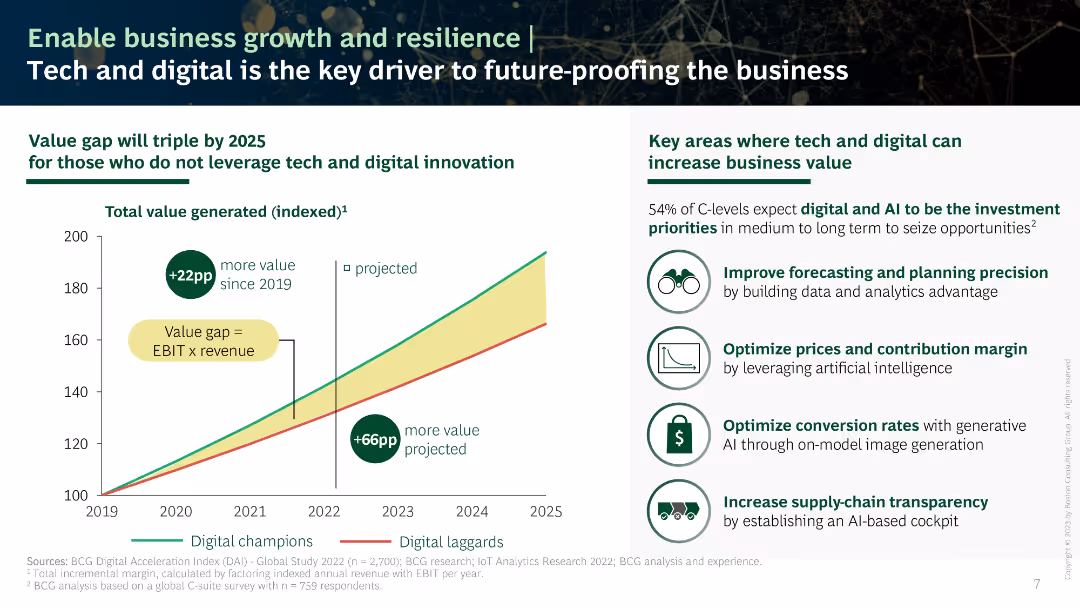
Line chart showing projected value generation for digital champions versus laggards, with bullet points listing key areas where tech and digital can increase business value.
Strategic Planning
Technology & Software
The slide projects a significant value gap by 2025 between companies that leverage tech and digital innovation and those that do not, identifying key investment areas.
tech, digital, business growth, value generation, investment
false
Strategic Planning
Technology & Software
Mixed Chart
BCG
Add to my slides
Remove from favorites
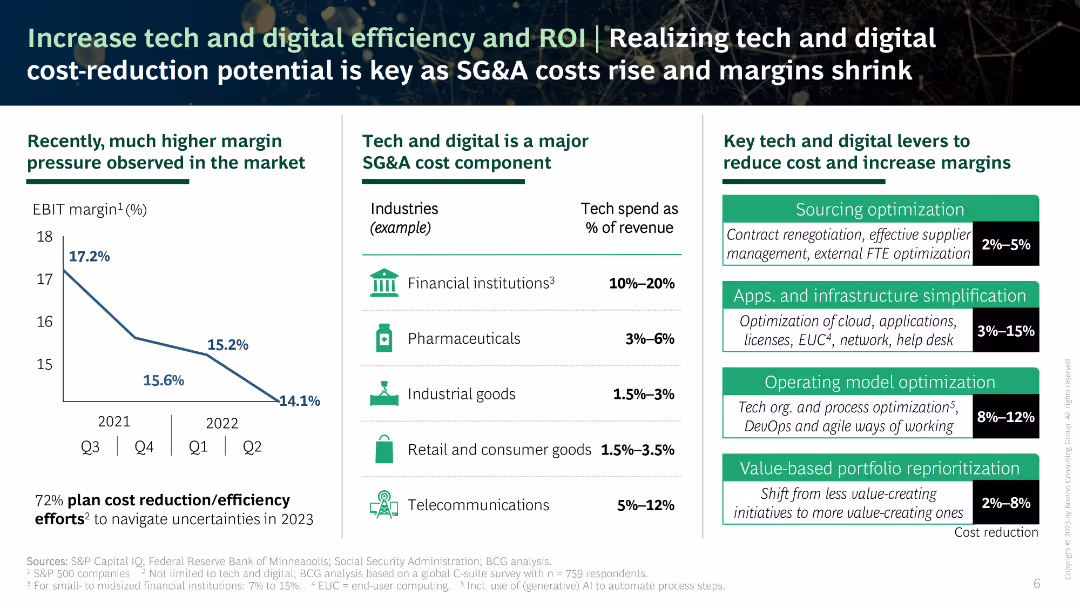
Column chart showing a decline in EBIT margins and a table with tech and digital spending by industry, along with key levers to reduce costs and increase margins.
Operational Efficiency
Technology & Software
This slide highlights the importance of increasing tech and digital efficiency to improve margins, with data on spending and key strategies for cost reduction.
tech, digital, efficiency, cost reduction, margins
false
Operational Efficiency
Technology & Software
Mixed Chart
BCG
Add to my slides
Remove from favorites
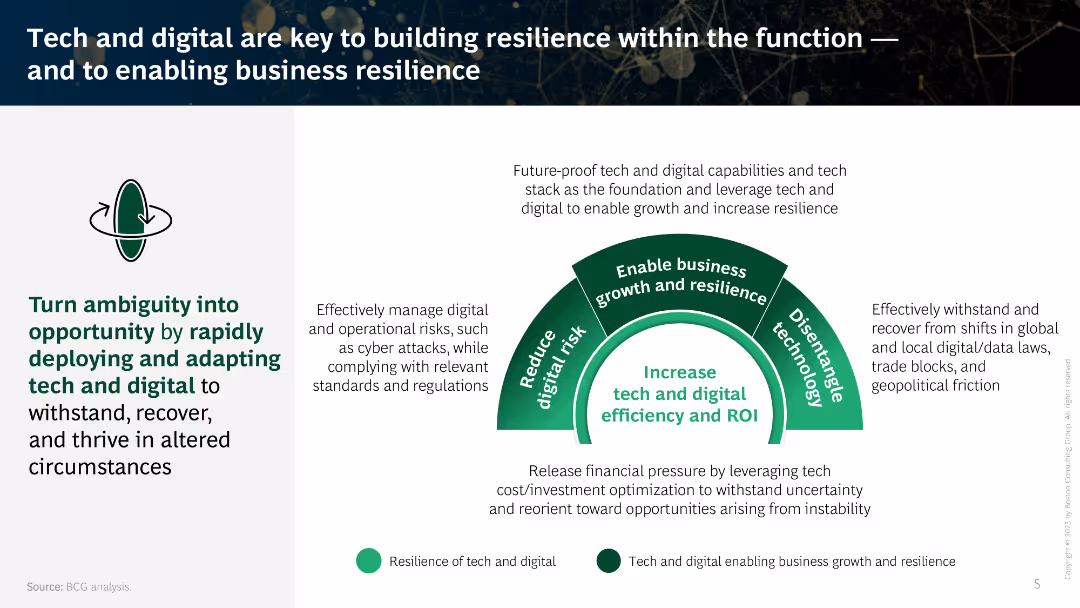
Diagram slide showing a circular process for increasing tech and digital efficiency and ROI, with sections for enabling business growth, reducing risk, and disentangling technology.
Strategic Planning
Technology & Software
The slide emphasizes the importance of tech and digital capabilities in building business resilience, with a focus on efficiency, risk reduction, and enabling growth.
tech, digital, resilience, business growth, efficiency
false
Strategic Planning
Technology & Software
Boxed
BCG
Add to my slides
Remove from favorites
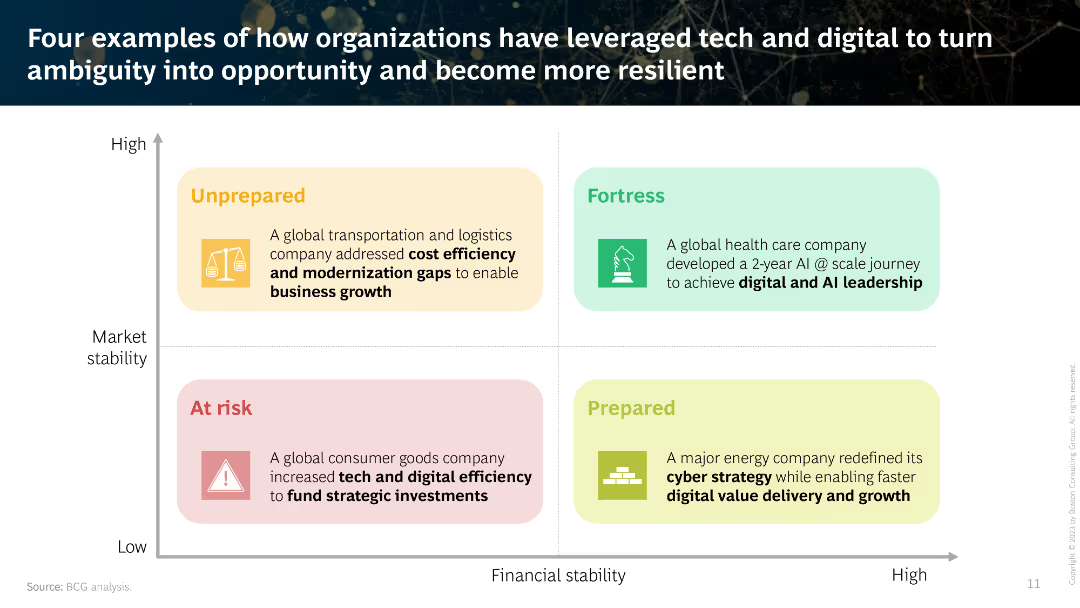
Four-quadrant matrix comparing companies' market and financial stability, with descriptions of how they leveraged tech and digital to become more resilient.
Client Case Studies
Technology & Software
The slide provides examples of companies in different quadrants of market and financial stability, illustrating how they used tech and digital strategies to improve resilience.
tech, digital, resilience, case studies, market stability
false
Client Case Studies
Technology & Software
Diagram
BCG
Add to my slides
Remove from favorites
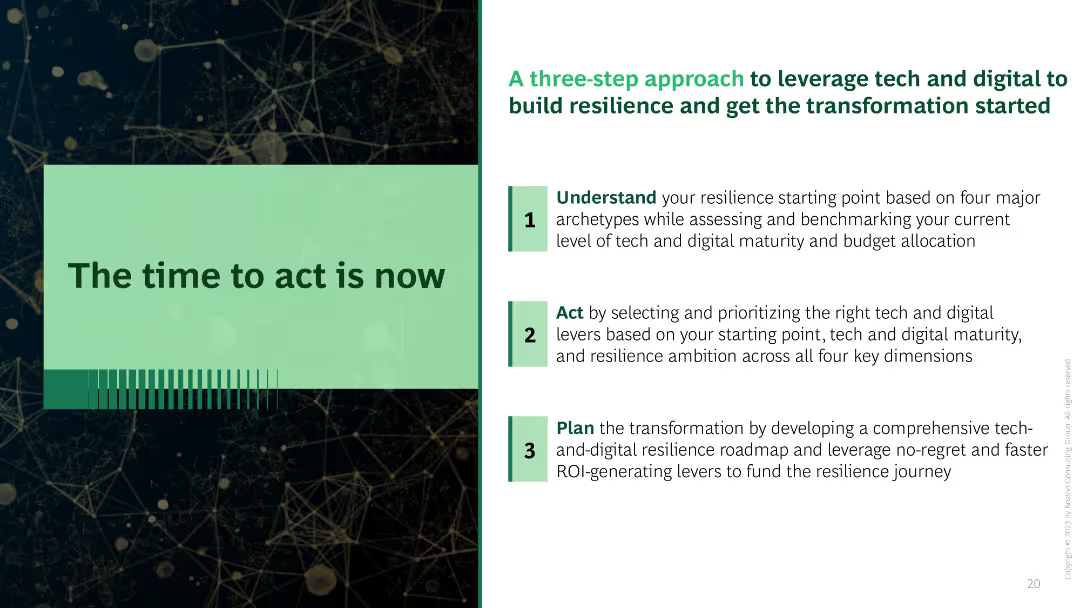
The slide has a green theme with text and icons outlining a three-step approach to leveraging tech and digital to build resilience and start transformation.
Strategic Planning
Technology & Software
This slide emphasizes the urgency of acting now by understanding resilience starting points, acting on tech levers, and planning the transformation.
tech, digital, resilience, transformation, urgency
false
Strategic Planning
Technology & Software
Vertical Flow
BCG
Add to my slides
Remove from favorites
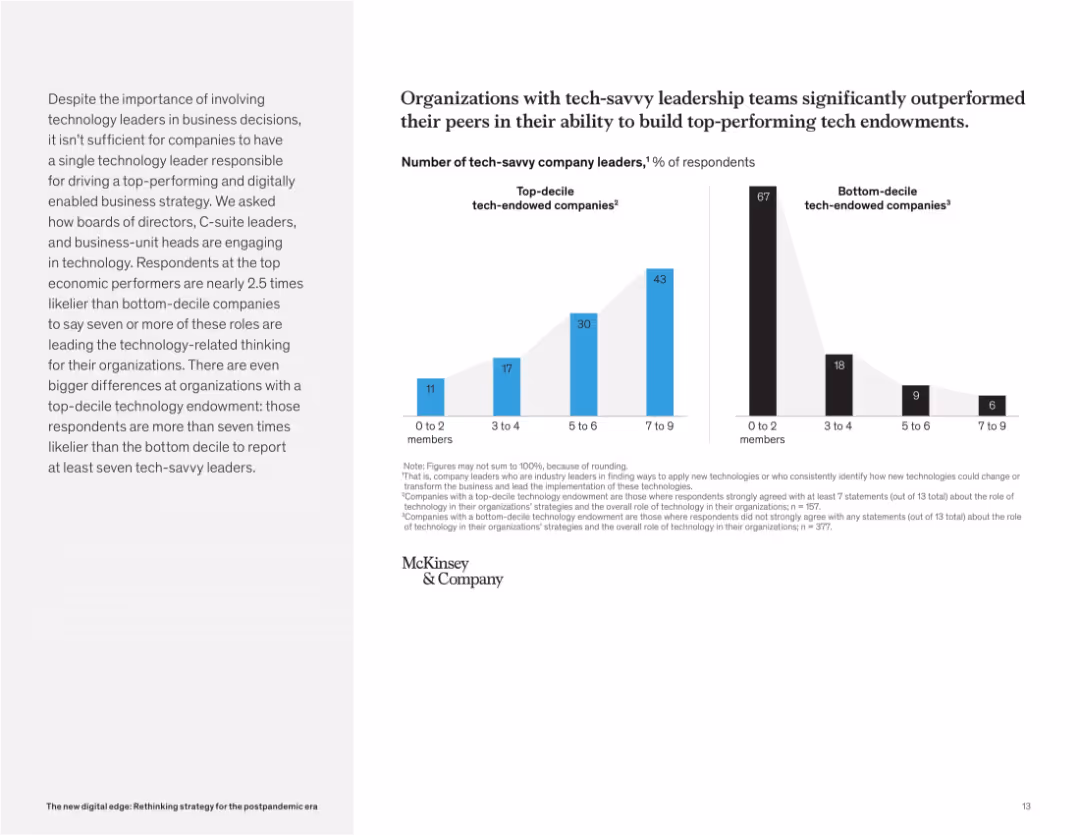
Side-by-side bar charts comparing the number of tech-savvy leaders in top-decile vs. bottom-decile companies. Accompanied by text on the left.
Organizational Structure and Change
Technology & Software
This slide shows that companies with more tech-savvy leaders (across leadership roles) are far more likely to develop strong tech capabilities. Top performers show greater representation of such leadership compared to bottom performers.
tech endowment, leadership, digital strategy, executive roles, McKinsey, performance, C-suite, technology engagement
false
Organizational Structure and Change
Technology & Software
Mixed Chart
McKinsey
Add to my slides
Remove from favorites
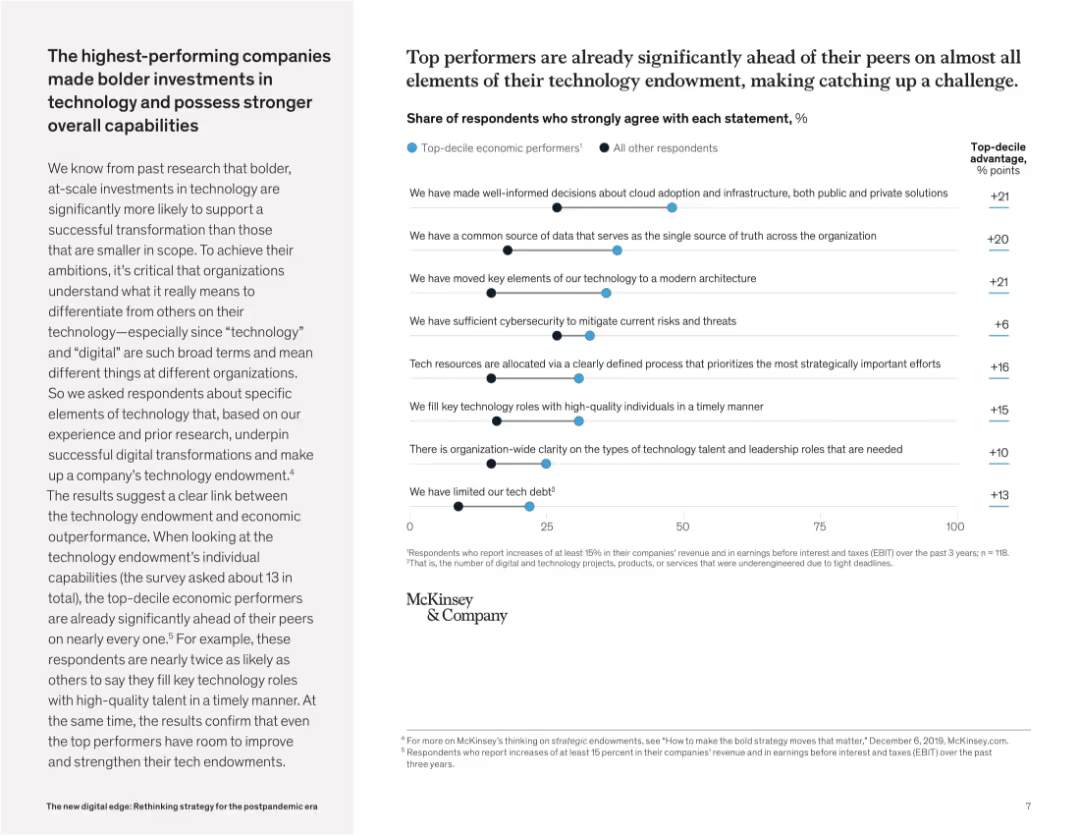
Right-aligned multi-bar chart compares top performers with others across tech-endowment attributes. Left side explains methodology and results.
Performance Metrics and KPIs
Technology & Software
This slide highlights that top-performing companies outperform peers in nearly every technology capability, from architecture decisions to tech role clarity. The insights stress how bold, large-scale tech investments underpin superior business performance.
tech endowment, top performers, digital capabilities, architecture, cybersecurity, cloud strategy, talent clarity, transformation
false
Performance Metrics and KPIs
Technology & Software
Mixed Chart
McKinsey
Add to my slides
Remove from favorites
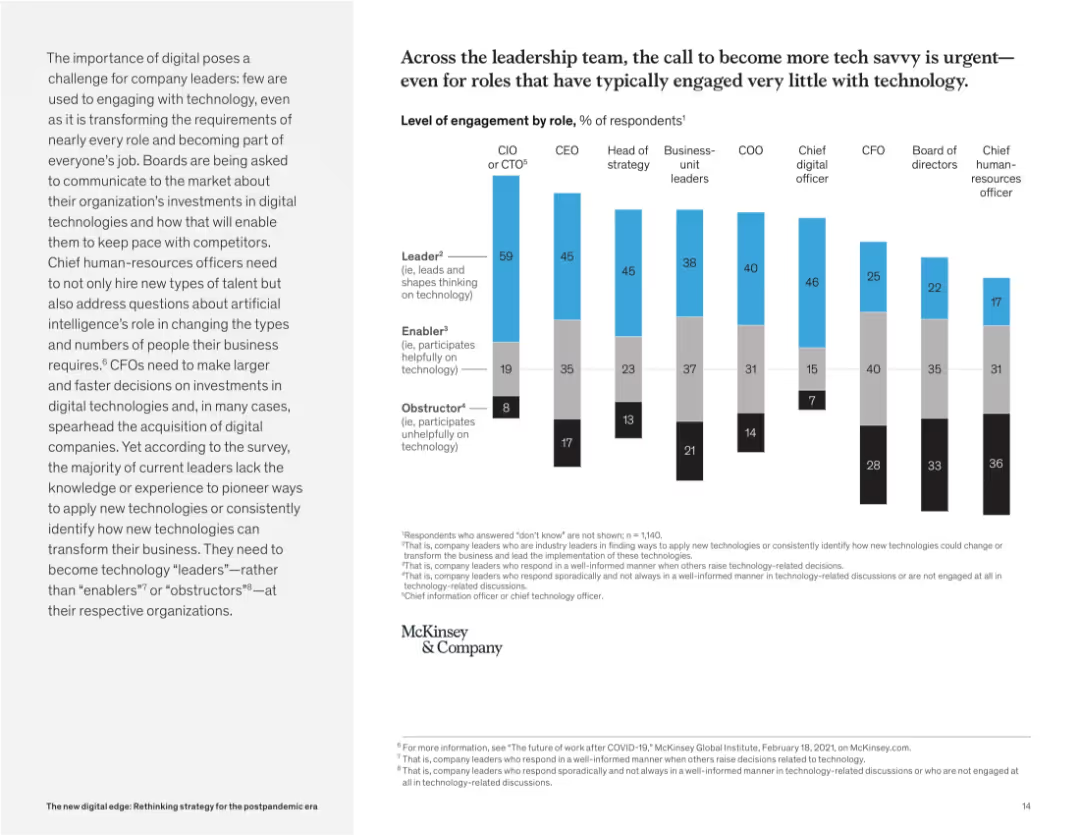
Vertical bar chart illustrating level of tech engagement across executive roles. Left panel contains explanatory paragraph.
Human Resources and Talent Management
Technology & Software
The slide categorizes leadership roles based on how they engage with technology (leader, enabler, or obstructer). It underscores the need for broader tech fluency among leaders, including CFOs and CHROs, to drive digital transformation.
tech fluency, leadership engagement, executive roles, digital transformation, CIO, CTO, enabler, obstructer, McKinsey
false
Human Resources and Talent Management
Technology & Software
Mixed Chart
McKinsey
Add to my slides
Remove from favorites
A bar chart showing the percentage distribution of tech-forward companies across various industries. Text discusses the representation of tech-forward companies in different sectors.
Market Analysis and Trends
Technology & Software
The slide provides an analysis of how tech-forward companies are distributed across multiple industries, with a bar chart highlighting sector representation.
Tech-Forward, Industry Distribution, Sector Analysis, Representation, Trends
false
Market Analysis and Trends
Technology & Software
Mixed Chart
Accenture
Add to my slides
Remove from favorites
Various column charts comparing financial performance metrics (ROIC, shareholder return, resilience index) between tech-forward companies and others. Text explains these performance advantages.
Performance Metrics and KPIs
Technology & Software
The slide compares the performance of tech-forward companies to their peers, highlighting superior financial metrics and resilience.
Tech-Forward, Performance, Financial Metrics, Resilience, Comparison
false
Performance Metrics and KPIs
Technology & Software
Multiple Chart
Accenture
Add to my slides
Remove from favorites
The slide features a column chart showing organizational plans for tech hires in 2023. The layout is moderately dense with text and visual elements.
Human Resources and Talent Management
Professional Services
Discusses organizational plans to increase the number of tech hires in 2023, with data on expected percentage changes.
tech hires, increase, 2023, workforce, planning, employees
false
Human Resources and Talent Management
Professional Services
Mixed Chart
Accenture
Add to my slides
Remove from favorites
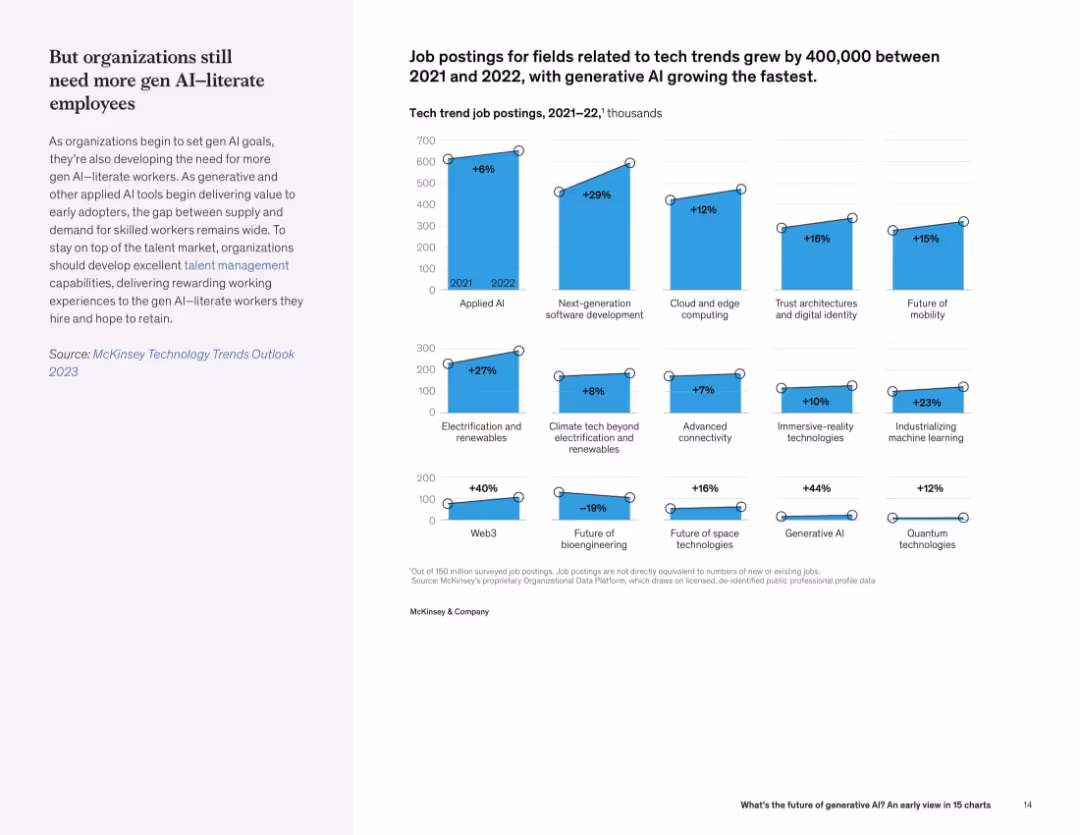
Left-aligned text with a grid of vertical bar charts on the right showing % growth in job postings across various tech fields.
Human Resources and Talent Management
Artificial Intelligence
This slide shows sharp increases in job postings in tech domains, especially for generative AI and Web3. The trend highlights growing demand for AI-literate employees.
tech hiring trends, job growth, generative AI, Web3, talent demand, AI workforce
false
Human Resources and Talent Management
Artificial Intelligence
Mixed Chart
McKinsey
Add to my slides
Remove from favorites
Features a detailed map of the UK highlighting major tech hubs outside London. Includes numerical data points and specific locations marked to emphasize the concentration of tech sectors.
Market Analysis and Trends
Technology & Software
Analyzes the distribution and growth of high-tech ecosystems across the UK, with a specific focus on cities like Edinburgh, Manchester, and Leeds. It highlights the number of high-growth companies in each city.
Tech hubs, UK, ecosystems
false
Market Analysis and Trends
Technology & Software
Mixed Chart
Barclays
Add to my slides
Remove from favorites
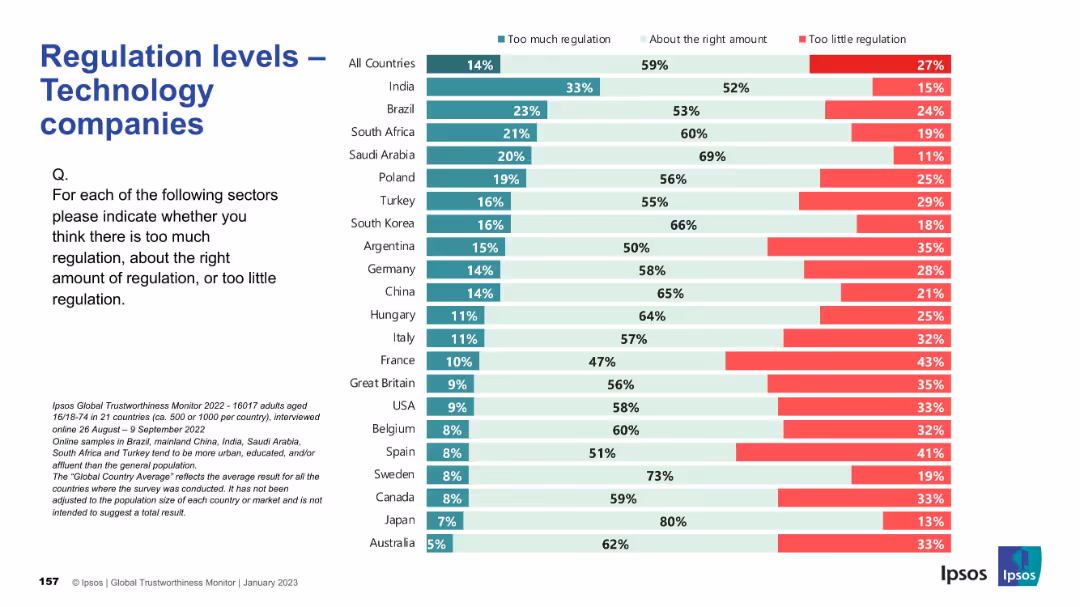
Consistent layout; country ranking by views; colors indicate opinions on regulation sufficiency.
Regulatory and Compliance
Technology & Software
This slide captures opinions on whether technology companies are properly regulated. The majority believe regulation levels are appropriate, but countries like Argentina and France indicate concerns about underregulation, while India and Brazil lean toward thinking there’s too much.
tech industry, regulation, public opinion, Ipsos, governance, compliance, digital policy, international, oversight, perception
false
Regulatory and Compliance
Technology & Software
Mixed Chart
IPSOS
Add to my slides
Remove from favorites
Slide features a bar chart illustrating equity deals by investor in Edinburgh's tech sector. Includes key investor names and deal counts.
Investment Analysis
Technology & Software
Reviews key investors in Edinburgh's tech sector from 2011 to 2020, highlighting their contributions in terms of deal counts and support to the tech ecosystem. Focuses on major investors like Scottish Enterprise.
Tech investment, Edinburgh, investors
false
Investment Analysis
Technology & Software
Mixed Chart
Barclays
Add to my slides
Remove from favorites
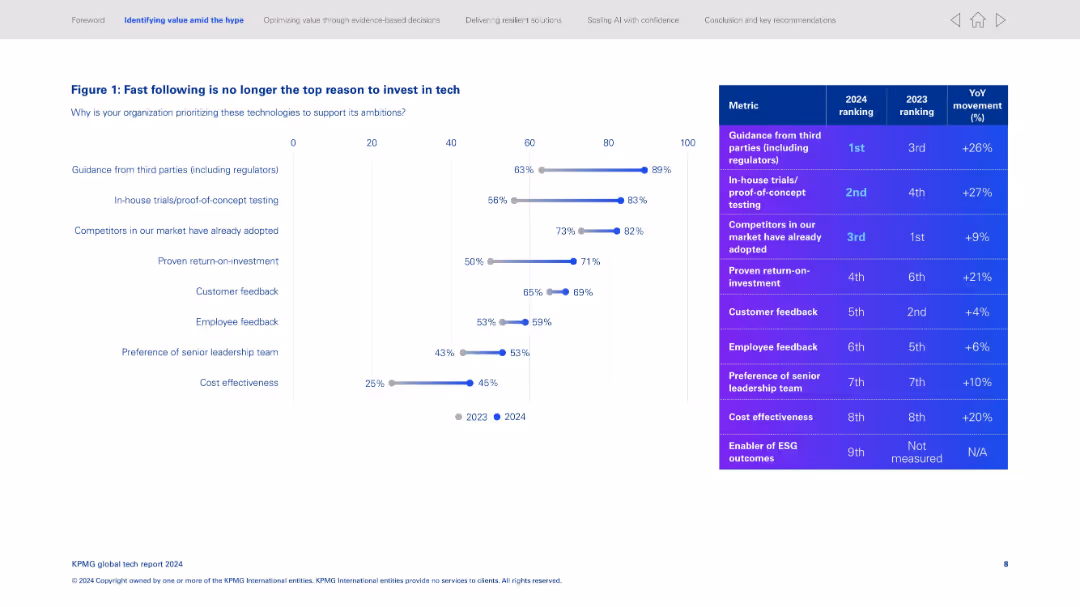
Two-column slide with a bar chart on the left comparing 2023 vs. 2024 priorities. Right column includes ranked metrics table.
Market Analysis and Trends
Technology & Software
Shows shift in top reasons for tech investment. "Guidance from regulators" and "proof-of-concept testing" rise in ranking. Bar chart compares 2023 and 2024 data for various investment drivers. Emphasizes growing influence of regulation and trials over competitor mimicry.
tech investment, guidance, regulation, ROI, competitor analysis, trends
false
Market Analysis and Trends
Technology & Software
Mixed Chart
KPMG
Add to my slides
Remove from favorites
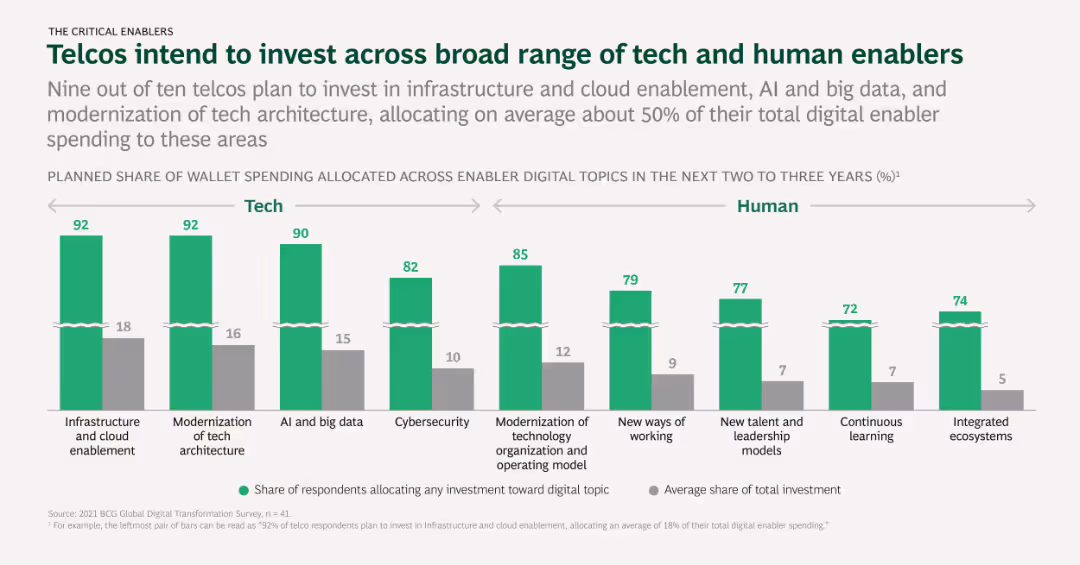
Column chart illustrating telcos' planned investments across tech and human enablers, with percentages indicating allocation and average investment shares.
Investment Analysis
Telecommunications
The slide presents telcos' planned investments in various tech and human enablers over the next two to three years, such as AI, big data, and talent development.
Tech investment, Human enablers, AI, Big data, Talent development
false
Investment Analysis
Telecommunications
Mixed Chart
BCG
Add to my slides
Remove from favorites
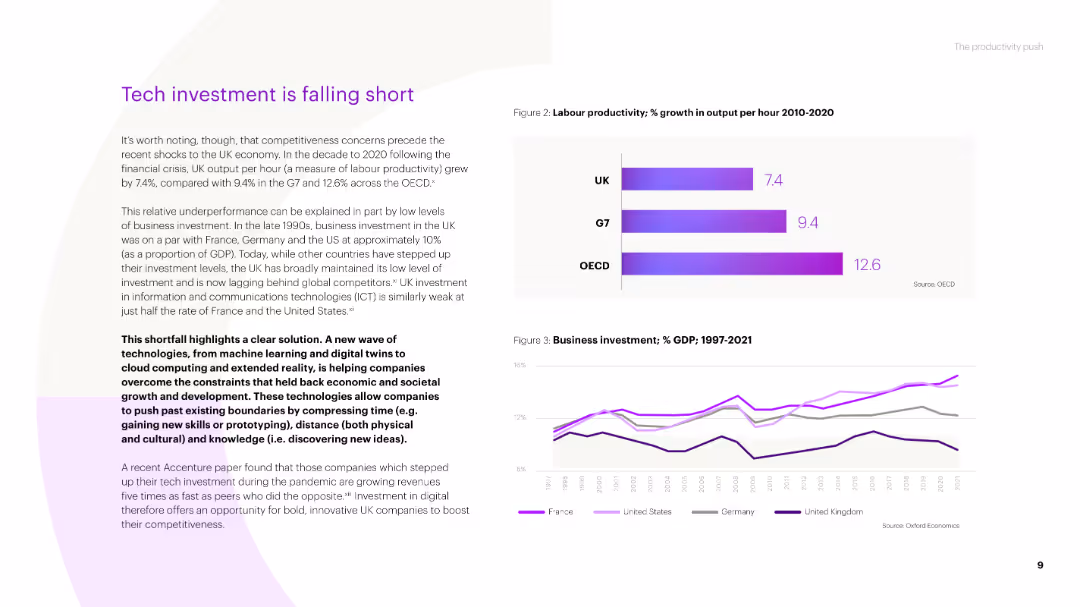
Text-based slide with a title, several paragraphs of text, and two column charts. The charts show labor productivity growth and business investment as a percentage of GDP from 1997 to 2021 for the UK, G7, and OECD.
Market Analysis and Trends
Technology & Software
The slide discusses the challenges in tech investment in the UK, highlighting lower productivity growth compared to G7 and OECD countries, and the impact of business investment on economic performance.
tech investment, productivity, business investment, UK economy, G7, OECD
false
Market Analysis and Trends
Technology & Software
Multiple Chart
Accenture
Add to my slides
Remove from favorites
White background with black and purple column charts comparing tech investment ratios
Investment Analysis
Technology & Software
It compares the technology investment ratios of platform adopters to non-platform companies
Tech Investment, Ratios, Platform, Non-Platform, Technology Spend
false
Investment Analysis
Technology & Software
Mixed Chart
Accenture
Add to my slides
Remove from favorites
A column chart showing the percentage of companies with tech-fluent C-suite and board members. Text elaborates on the importance of tech-savvy leadership in addressing business challenges.
Organizational Structure and Change
Technology & Software
The slide emphasizes the significance of having tech-fluent leadership in the C-suite and board, supported by a column chart comparing tech mindset metrics.
Tech Mindset, Leadership, C-suite, Board, Business Challenges
false
Organizational Structure and Change
Technology & Software
Mixed Chart
Accenture
Add to my slides
Remove from favorites
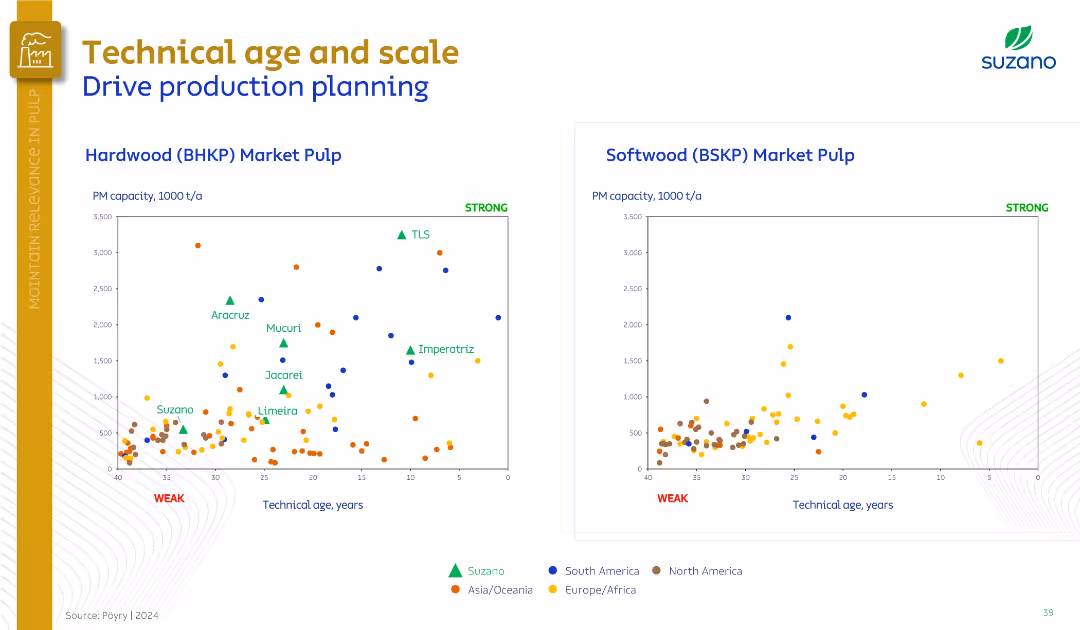
Two scatter plots comparing technical age vs. capacity for BHKP and BSKP markets.
Operational Efficiency
Industrial & Manufacturing
This slide compares global pulp producers' plants by technical age and production scale. It evaluates Suzano’s facilities against regional competitors, emphasizing stronger positioning through newer and larger-scale operations.
technical age, market pulp, Suzano, production planning, BHKP, BSKP
false
Operational Efficiency
Industrial & Manufacturing
Multiple Chart
Goldman Sachs
Add to my slides
Remove from favorites
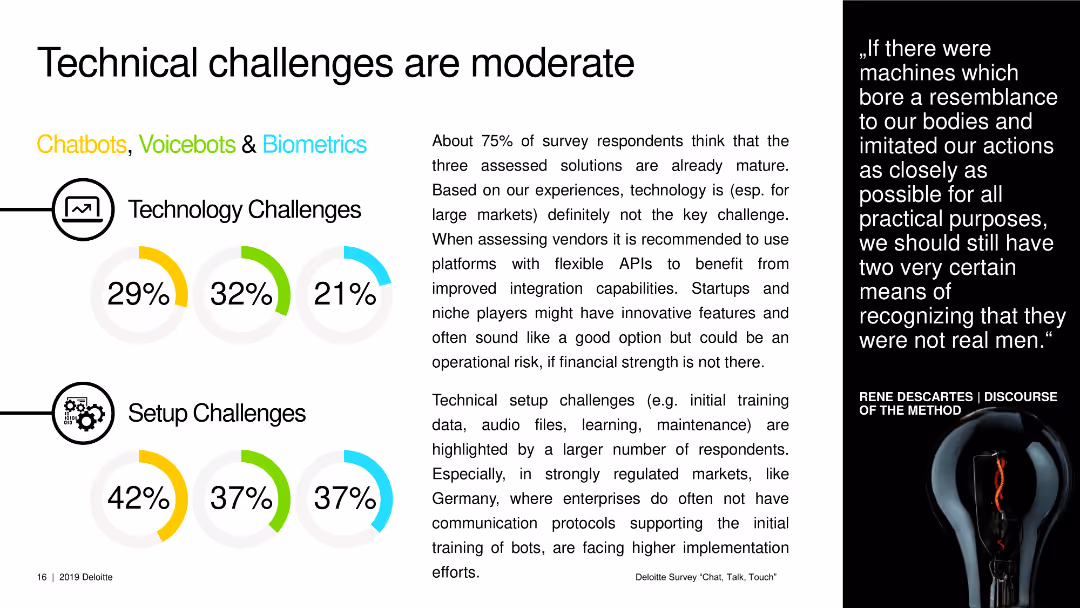
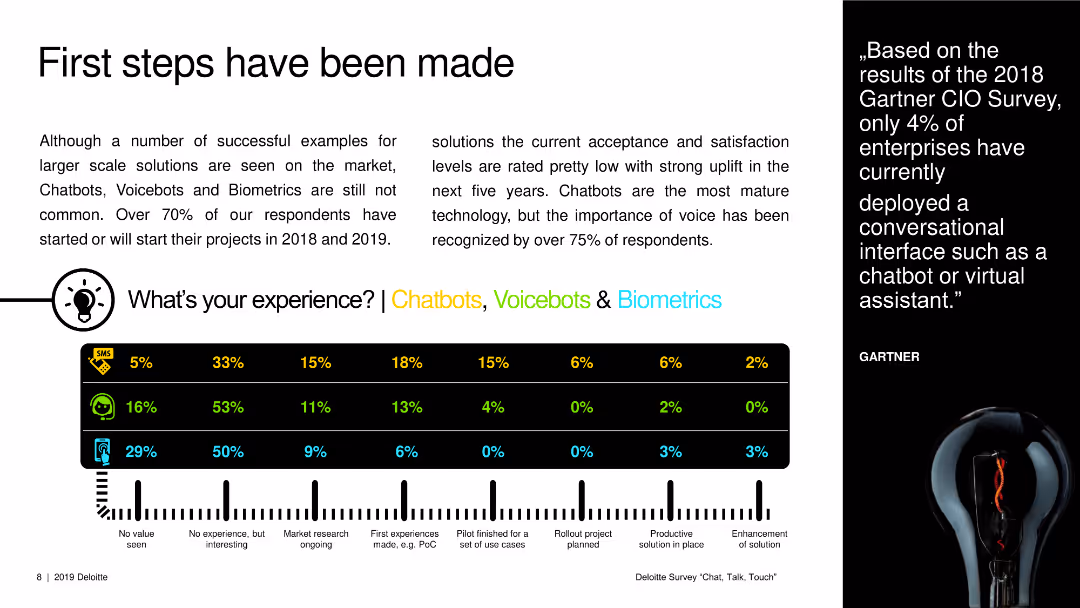
A text slide with pie charts showing percentages of technology and setup challenges for chatbots, voicebots, and biometrics.
Strategic Planning
Technology & Software
The slide highlights the technical and setup challenges faced by enterprises when implementing chatbots, voicebots, and biometrics.
technical challenges, setup challenges, chatbots, voicebots, biometrics, technology implementation
false
Strategic Planning
Technology & Software
Multiple Chart
Deloitte
Add to my slides
Remove from favorites
Line chart showing the GDP per capita from 1820 to 2020 for various regions, segmented by different technological ages (e.g., Industrial Revolution, Age of ICT).
Technology and Digital Transformation
Technology & Software
This slide tracks the historical development of GDP per capita in various regions alongside major technological breakthroughs from the Industrial Revolution to Industry 4.0. It underscores the significant impact of technological advancements on economic growth and prosperity.
Technological Breakthroughs, GDP, Historical Development
false
Technology and Digital Transformation
Technology & Software
Mixed Chart
Roland Berger
Add to my slides
Remove from favorites
Rocket-shaped diagram with five steps explaining how emerging countries can increase their technological competitiveness. Text details each step, from FDI to robust educational systems.
Technology and Digital Transformation
Technology & Software
The slide outlines a five-step approach for emerging countries to enhance their technological competitiveness. It emphasizes the role of FDI, capital inflows, robust educational systems, and sectoral supply chains in transforming these countries into competitive innovation leaders.
Technological Competitiveness, Emerging Countries, FDI
false
Technology and Digital Transformation
Technology & Software
Vertical Flow
Roland Berger
Add to my slides
Remove from favorites
The slide presents a vertical bar chart showing survey responses on the concern that technological progress is destroying lives across various countries.
Market Analysis and Trends
Technology & Software
The slide displays survey data reflecting global concerns about the negative impacts of technological progress on daily life.
Technological progress, global survey, public opinion, technology concerns, survey
false
Market Analysis and Trends
Technology & Software
Multiple Chart
IPSOS
Add to my slides
Remove from favorites
A column chart showing the reduction in cost per private transaction over time, with significant drops from the prototype stage to Nightfall introduction and further with batching. Includes bullet points about the technological progress and regulatory compliance features.
Technology and Digital Transformation
Technology & Software
Details the technological advancements made in reducing transaction costs on public blockchains, highlighting significant milestones and the role of regulatory compliance.
Technological progress, private transactions, business agreements, public blockchains, cost reduction, regulatory compliance
false
Technology and Digital Transformation
Technology & Software
Mixed Chart
EY
Add to my slides
Remove from favorites
Line chart showing the global risks landscape for technological risks, plotting impact versus likelihood.
Technology and Digital Transformation
Technology & Software
The slide presents a global risk assessment for technological advancements, highlighting the perceived risks and their impact versus likelihood. It focuses on the different risk perceptions between generations, particularly regarding tech advances, digital power concentration, and digital inequality.
Technological Risk, Risk Perception, Innovations
false
Technology and Digital Transformation
Technology & Software
Mixed Chart
Roland Berger
Add to my slides
Remove from favorites
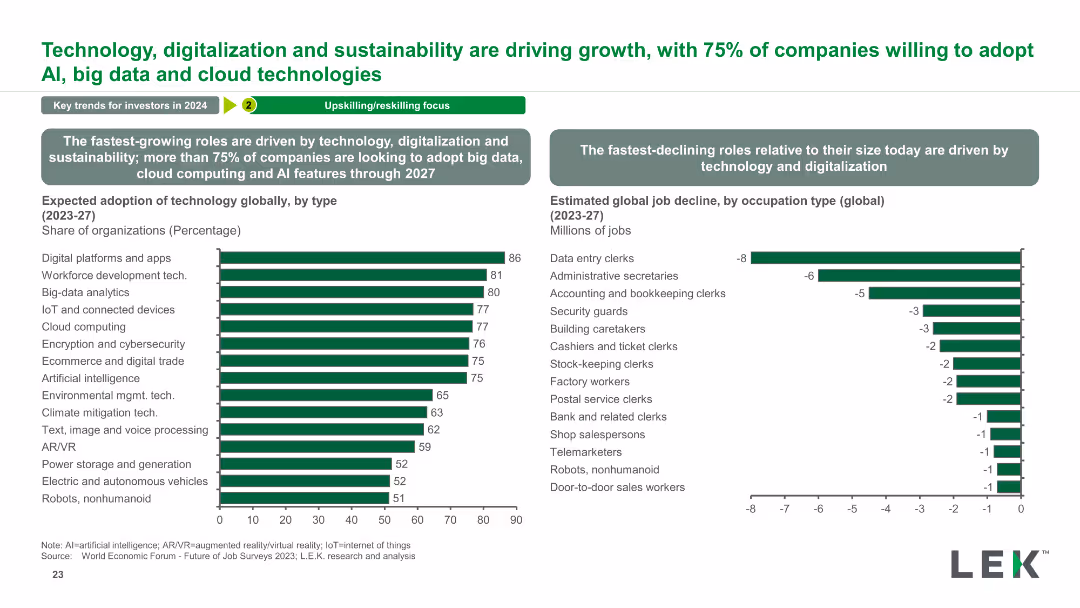
The slide includes two column charts showing the expected adoption of technology and estimated job decline, supported by detailed textual explanations and statistics.
Technology and Digital Transformation
Technology & Software
This slide highlights the drive towards technology adoption, focusing on AI, big data, and cloud technologies, along with the impact on various job types.
technology adoption, AI, big data, cloud technologies, digitalization, sustainability, job decline, workforce development, tech trends
false
Technology and Digital Transformation
Technology & Software
Multiple Chart
LEK
Add to my slides
Remove from favorites
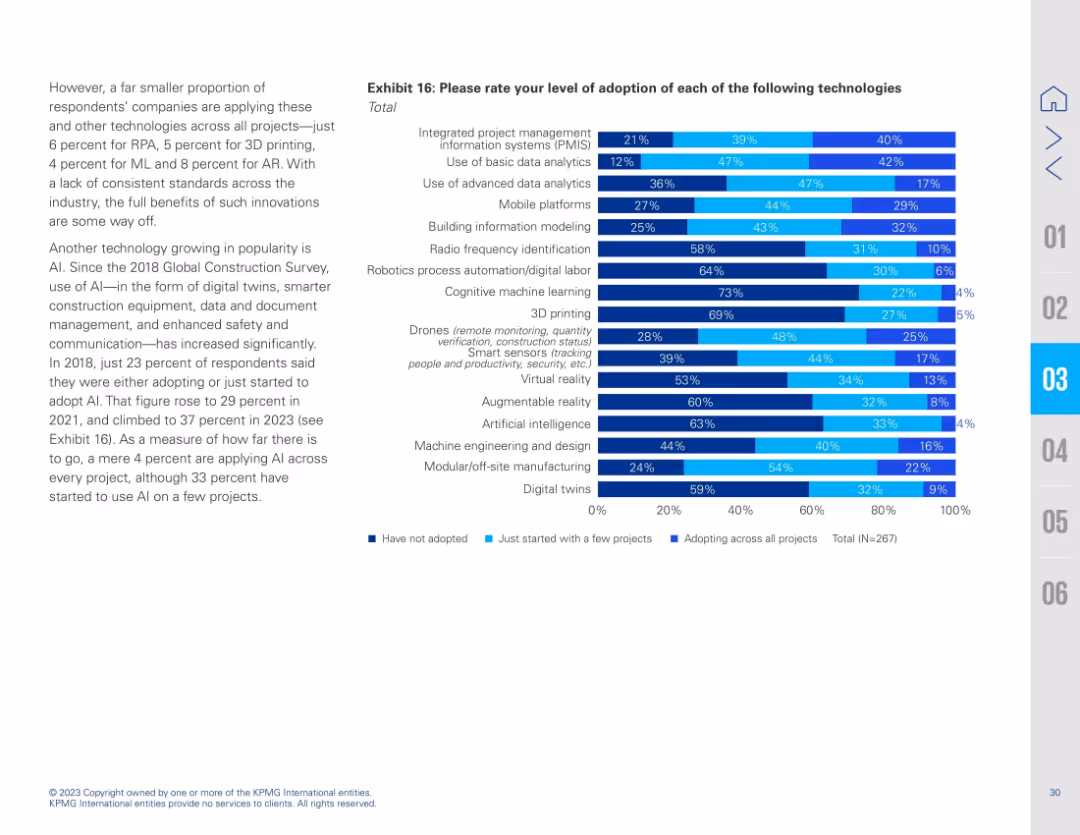
Two-column layout with a bar chart on the right and text explanation on the left. The bar chart uses horizontal stacked bars in different shades of blue to show adoption stages of various technologies.
Technology and Digital Transformation
Real Estate & Construction
Presents a survey of how different digital and emerging technologies are being adopted in capital projects. AI, RPA, AR, ML, digital twins, and PMIS are highlighted. Adoption rates remain low for most technologies, showing potential for growth.
technology adoption, AI, PMIS, construction, survey, analytics, digital twins, robotics, ML, AR, VR
false
Technology and Digital Transformation
Real Estate & Construction
Mixed Chart
KPMG
Add to my slides
Remove from favorites
A text slide with a table showing the levels of experience in using chatbots, voicebots, and biometrics among respondents.
Strategic Planning
Technology & Software
This slide highlights the adoption levels of new technologies like chatbots, voicebots, and biometrics among respondents.
technology adoption, chatbots, voicebots, biometrics, strategic planning, user experience
false
Strategic Planning
Technology & Software
Table
Deloitte
Add to my slides
Remove from favorites
Contains a column chart comparing digital payment adoption across regions. Uses purple tones and is text-heavy with statistical data highlighted.
Market Analysis and Trends
Telecommunications
Compares the speed of technology adoption and investment diversification in high-growth regions like Asia-Pacific, Middle East, Africa, and Latin America. Useful for analyzing regional technology trends and investment opportunities.
technology adoption, high-growth markets, Asia-Pacific, digital payments, investment
false
Market Analysis and Trends
Telecommunications
Mixed Chart
Accenture
Add to my slides
Remove from favorites
Contains dense texts and a bar chart illustrating the dominant technology philosophy among investment providers, with a focus on trends over the past three years and future expectations. The layout is comprehensive and well-detailed.
Technology and Digital Transformation
Financial Services
Discusses the shift towards making technology a core competence within the financial services sector, reflecting on strategies firms might adopt in their IT transformations.
technology adoption, IT strategies, financial services, core competence, future trends
false
Technology and Digital Transformation
Financial Services
Mixed Chart
Deloitte
Add to my slides
Remove from favorites
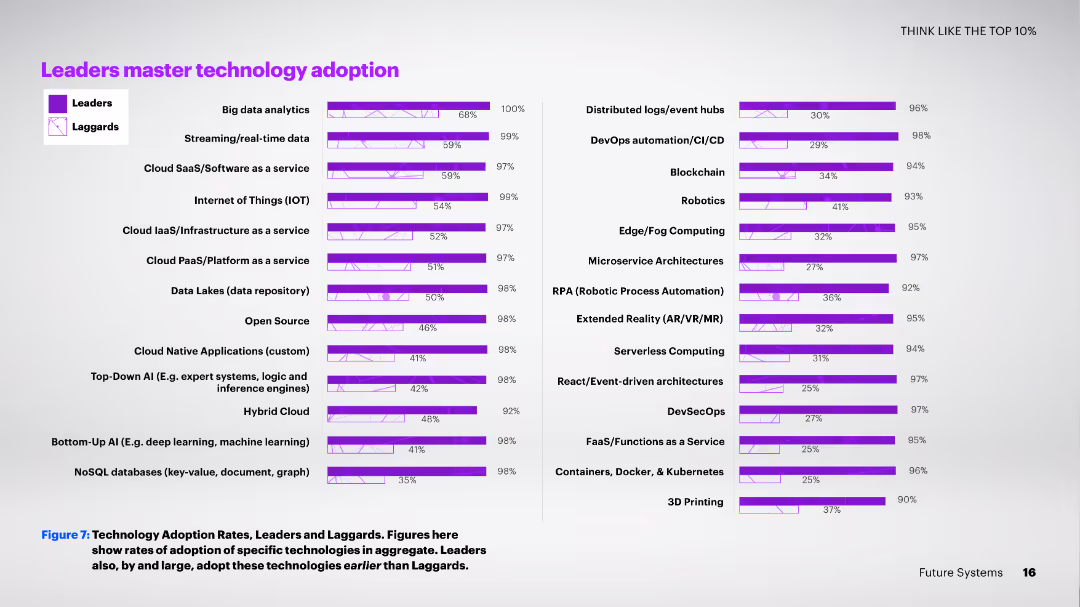
A two-column slide with horizontal bar charts showing the adoption rates of various technologies among leaders and laggards.
Technology and Digital Transformation
Technology & Software
This slide details the high adoption rates of advanced technologies among leaders compared to laggards, showcasing a broad range of technologies from big data analytics to 3D printing.
technology adoption, leaders, laggards, comparison, advanced technologies, big data, 3D printing, rates, broad range
false
Technology and Digital Transformation
Technology & Software
Multiple Chart
Accenture
Add to my slides
Remove from favorites
Column chart displaying survey results with percentages for Europe, United States, and APAC regions. Five main processes listed.
Technology and Digital Transformation
Technology & Software
The slide shows the top five processes companies use to ensure technology adoption, including organizational structure and innovation units.
technology, adoption, processes, survey, Europe, US, APAC, innovation, KPI, skills
false
Technology and Digital Transformation
Technology & Software
Mixed Chart
Accenture
Add to my slides
Remove from favorites
The slide presents a line chart showing technology adoption rates in US households over time, color-coded by technology type. Key observations about the impact of world events on technology adoption are summarized on the right.
Market Analysis and Trends
Technology & Software
This slide examines the historical trends in technology adoption among US households, noting that major world events generally do not hinder technological progress, with some delays observed during WWII.
Technology adoption, US households, historical trends, world events, resilience
false
Market Analysis and Trends
Technology & Software
Mixed Chart
EY
Add to my slides
Remove from favorites
Bar chart showing the number of years until 25% of the US population adopted various technologies, from electricity to tablets. Text discusses the increasing speed of technology adoption over time.
Technology and Digital Transformation
Technology & Software
The slide presents the accelerating pace of technology adoption in the US, comparing different technologies' adoption rates from the late 19th century to the present. It emphasizes how the faster adoption of new technologies is crucial for driving economic growth and adapting to rapid changes in the tech landscape.
Technology Adoption, US, Speed, Economic Growth
false
Technology and Digital Transformation
Technology & Software
Mixed Chart
Roland Berger
Add to my slides
Remove from favorites
The slide features text describing advancements in technology, accompanied by a graphic on renewable power generation costs and a statistic on consumer behavior.
Technology and Digital Transformation
Technology & Software
The slide discusses the rapid advancement in technology, focusing on affordable clean energy solutions and their impact on power generation costs. It also highlights consumer interest in electric vehicles.
technology advancements, clean energy, power generation, renewable energy, consumer trends
false
Technology and Digital Transformation
Technology & Software
Multiple Chart
EY
Add to my slides
Remove from favorites
Slide presents a bar chart comparing investment priorities between larger and smaller companies with emphasis on advanced technology.
Technology and Digital Transformation
Professional Services
Discusses how larger companies prioritize AI and technology investments more compared to smaller companies which focus on diverse operational aspects.
technology, AI, investments, productivity, companies
false
Technology and Digital Transformation
Professional Services
Single Chart
Deloitte
Add to my slides
Remove from favorites
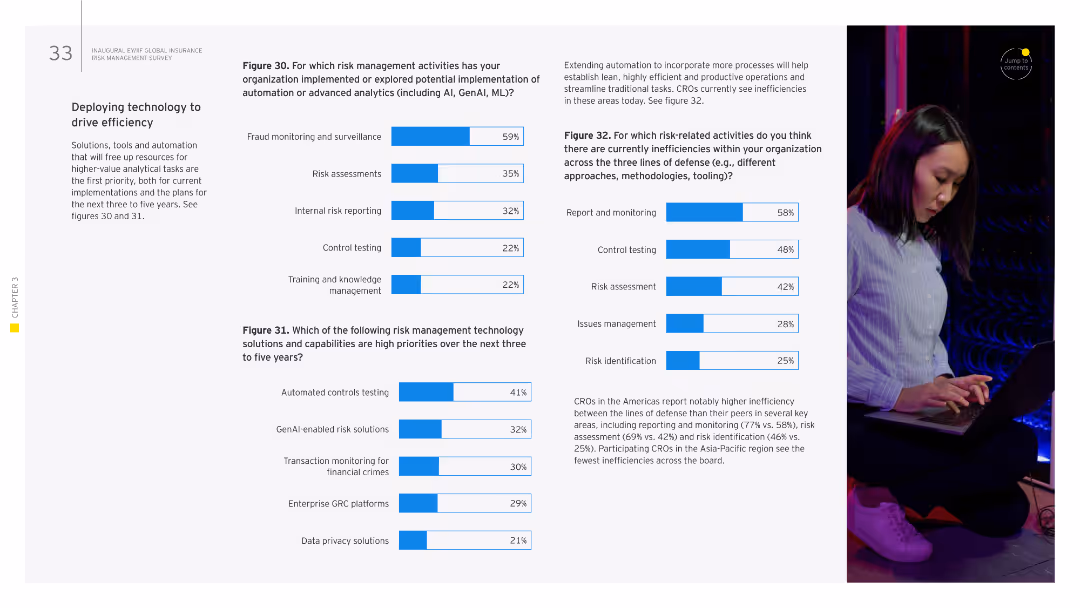
The slide contains several column charts showing the implementation of advanced analytics, AI, ML, and the prioritization of various risk management technologies over the next three to five years.
Technology and Digital Transformation
Financial Services
It focuses on the use of technology, such as AI and ML, to improve efficiency in risk management, detailing the areas where these technologies are being implemented or explored. It is used to illustrate the strategic deployment of technology to enhance risk management.
technology, AI, ML, risk management, efficiency, analytics
false
Technology and Digital Transformation
Financial Services
Multiple Chart
EY
Add to my slides
Remove from favorites
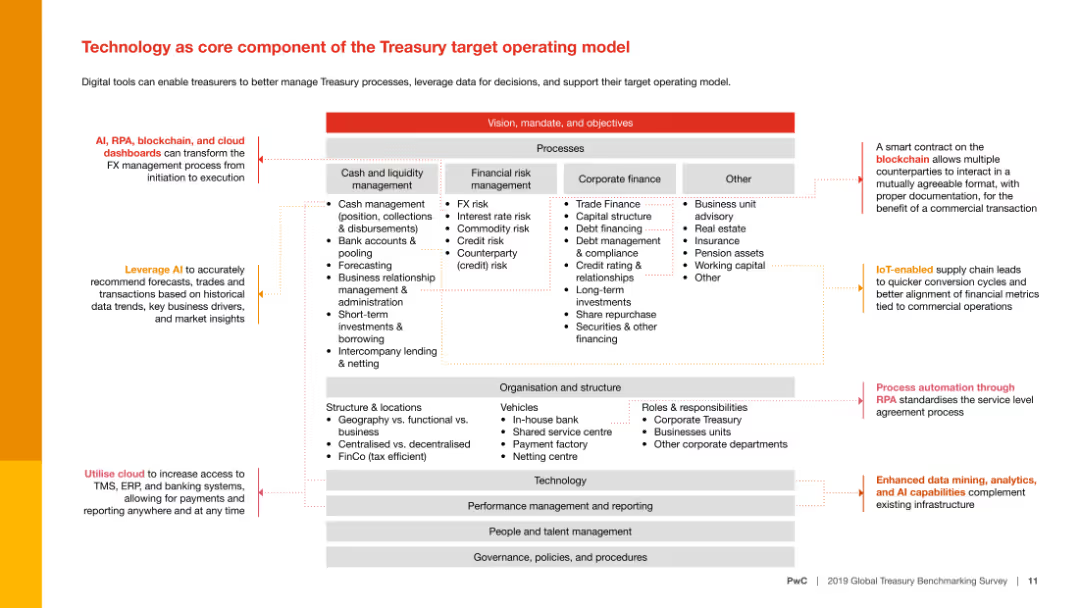
A complex slide with a diagram displaying different processes within the Treasury target operating model. It includes various elements such as arrows and text blocks.
Technology and Digital Transformation
Financial Services
This slide discusses how technology, including AI, RPA, blockchain, and cloud dashboards, can enhance Treasury processes and support decision-making.
Technology, AI, RPA, blockchain, cloud, Treasury
false
Technology and Digital Transformation
Financial Services
Diagram
PwC/Strategy&
Add to my slides
Remove from favorites
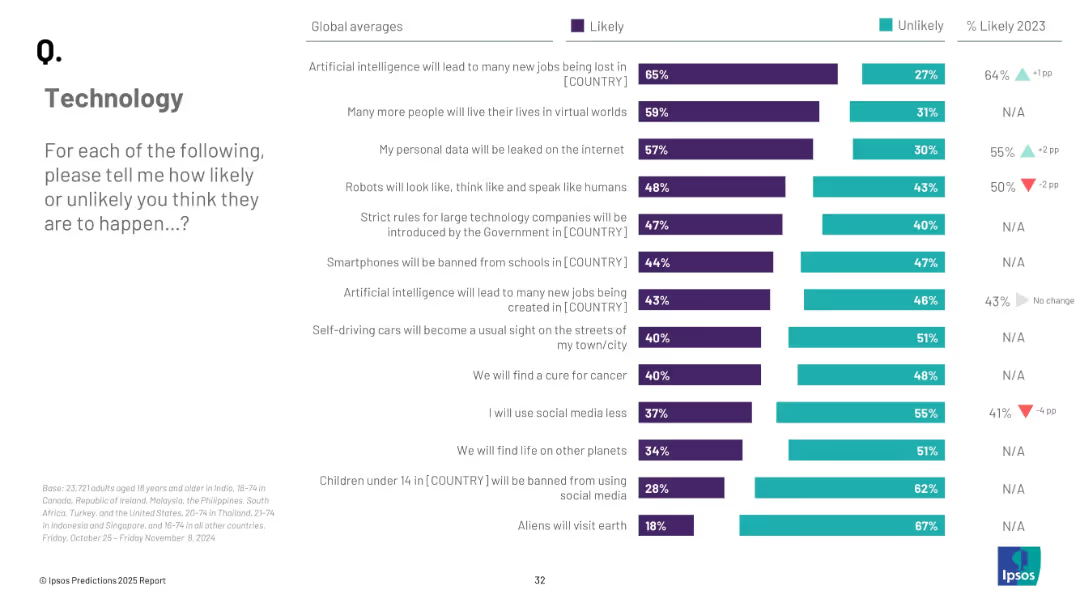
Vertical bar chart with purple (“likely”) and teal (“unlikely”) indicators showing global sentiment on 13 tech-related predictions.
Strategic Planning
Technology & Software
This global view slide presents public perceptions on technological advancements, such as AI’s impact on jobs, virtual worlds, and self-driving cars. It illustrates which innovations the global public believes are most likely to occur in 2025, with AI job loss and virtual living scoring highest in perceived likelihood.
technology, AI, virtual worlds, future predictions, innovation
false
Strategic Planning
Technology & Software
Mixed Chart
IPSOS
Add to my slides
Remove from favorites
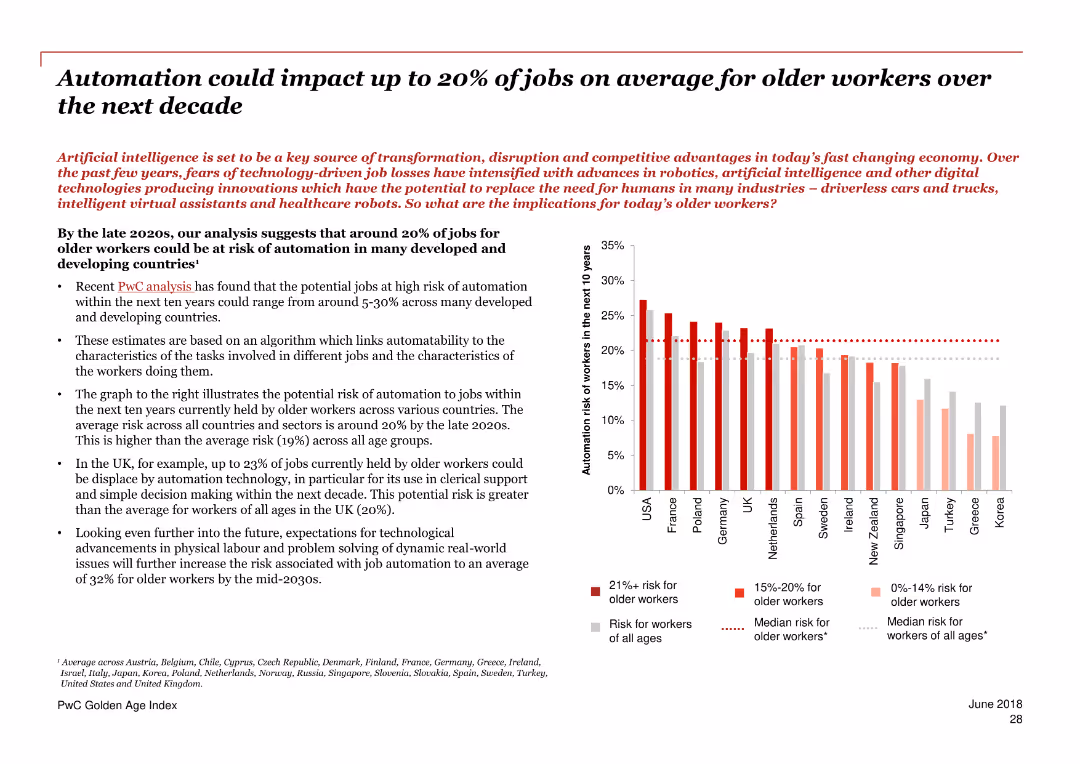
Column chart and text blocks, predominantly red and white color scheme.
Market Analysis and Trends
Government & Public Sector
This slide presents data on how technological advances and automation could impact jobs globally, focusing on the perceived importance of technological innovation.
technology, automation, job impact, global trends, innovation, future of work, employment, digital transformation, analysis, predictions
false
Market Analysis and Trends
Government & Public Sector
Mixed Chart
PwC/Strategy&
Add to my slides
Remove from favorites
A column chart and text blocks, predominantly red and white color scheme.
Technology and Digital Transformation
Government & Public Sector
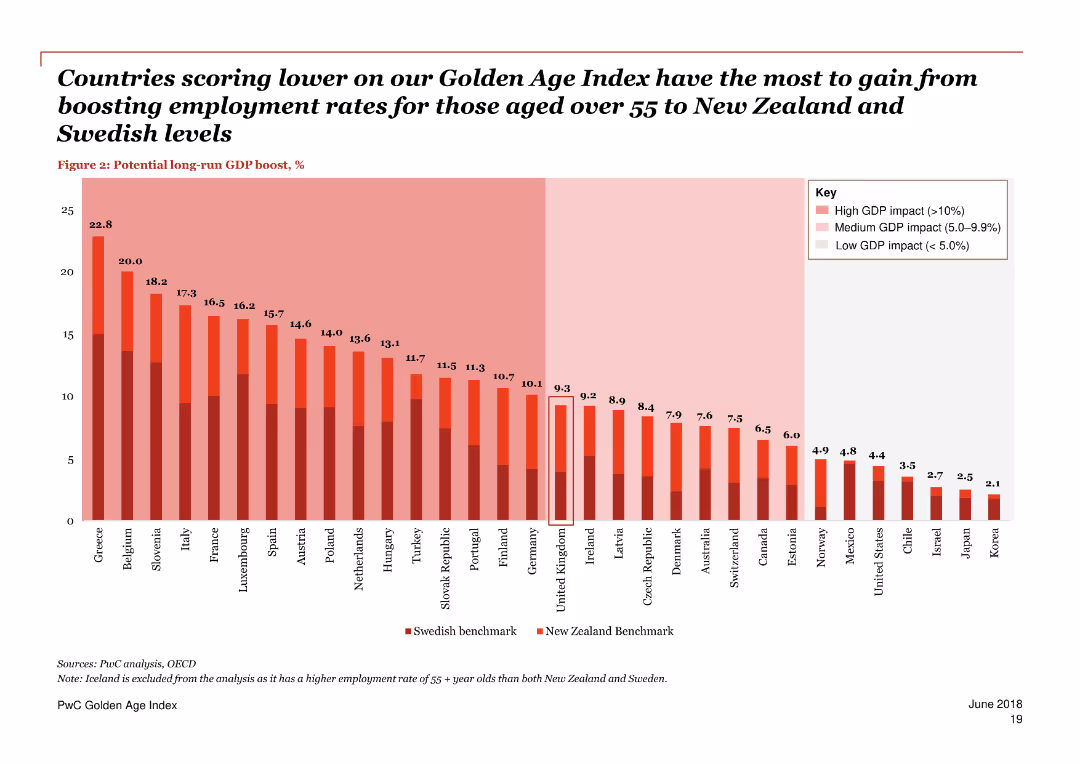
Discusses technological advances like automation and their impact on job prospects, highlighting the need for retraining and lifelong learning for older workers.
technology, automation, jobs, older workers, impact, retraining, lifelong learning, digital transformation, trends, future
false
Technology and Digital Transformation
Government & Public Sector
Single Chart
PwC/Strategy&
Add to my slides
Remove from favorites
This slide presents column charts evaluating leadership confidence in understanding the risks of automating work and the effectiveness of communication on the impact of technology.
Market Analysis and Trends
Professional Services
Explores leaders' preparedness and strategic planning regarding the integration of technology and automation in the workforce. It suggests the need for better communication and risk assessment strategies to ensure a human-centric approach in technology adoption.
technology, automation risks, strategic planning, leadership, communication effectiveness
false
Market Analysis and Trends
Professional Services
Multiple Chart
PwC/Strategy&
Add to my slides
Remove from favorites
Circular diagrams comparing the tech experience of board members in North America, Europe, APAC, and other regions.
Organizational Structure and Change
Professional Services
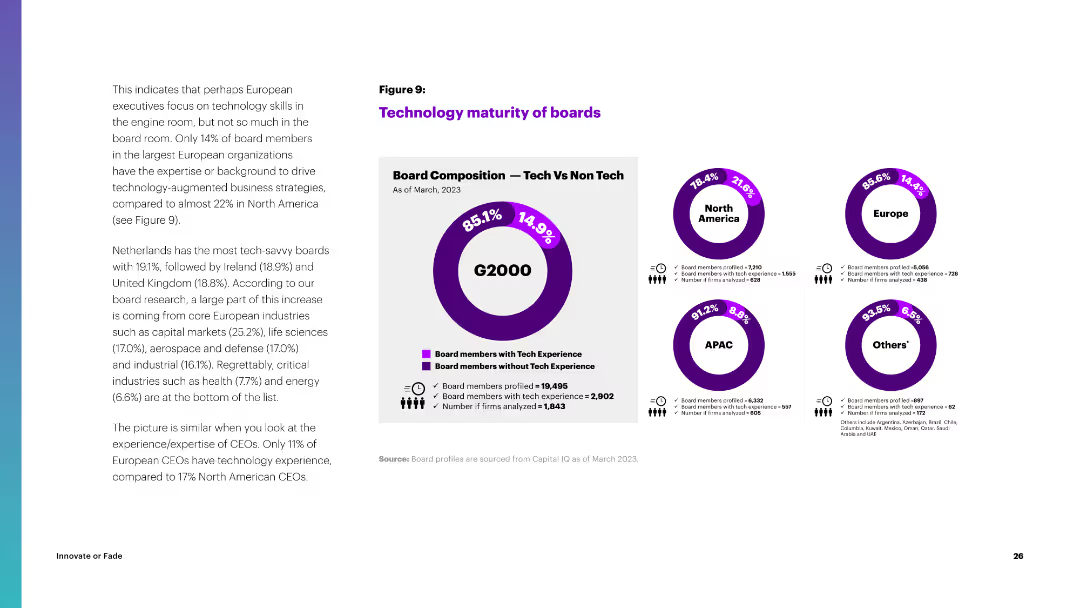
The slide compares the technology maturity of boards across regions, highlighting the percentage of board members with tech experience.
technology, boards, North America, Europe, APAC, tech experience, board composition
false
Organizational Structure and Change
Professional Services
Multiple Chart
Accenture
Add to my slides
Remove from favorites
Two-column layout with text on the left and a column chart illustrating challenges on the right. There is moderate text density.
Market Analysis and Trends
Technology & Software
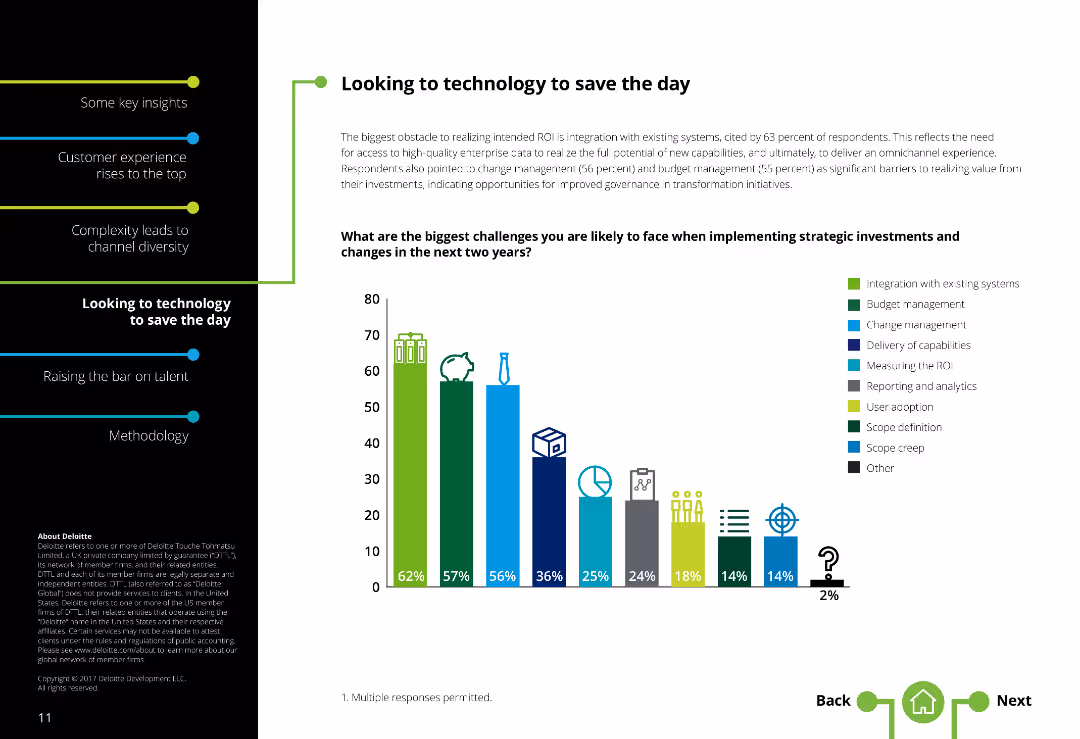
Highlights challenges in implementing strategic investments in contact centers, such as system integration, change management, and budget constraints.
Technology challenges, Contact centers, System integration, Change management, Budget constraints, Strategic investments
false
Market Analysis and Trends
Technology & Software
Single Chart
Deloitte
Add to my slides
Remove from favorites
The slide contains a title with a blue underline, three sections highlighting percentages of progress in technology modernization, and a section with three visuals (speed, agility, stability) alongside column charts showing infrastructure productivity.
Technology and Digital Transformation
Financial Services
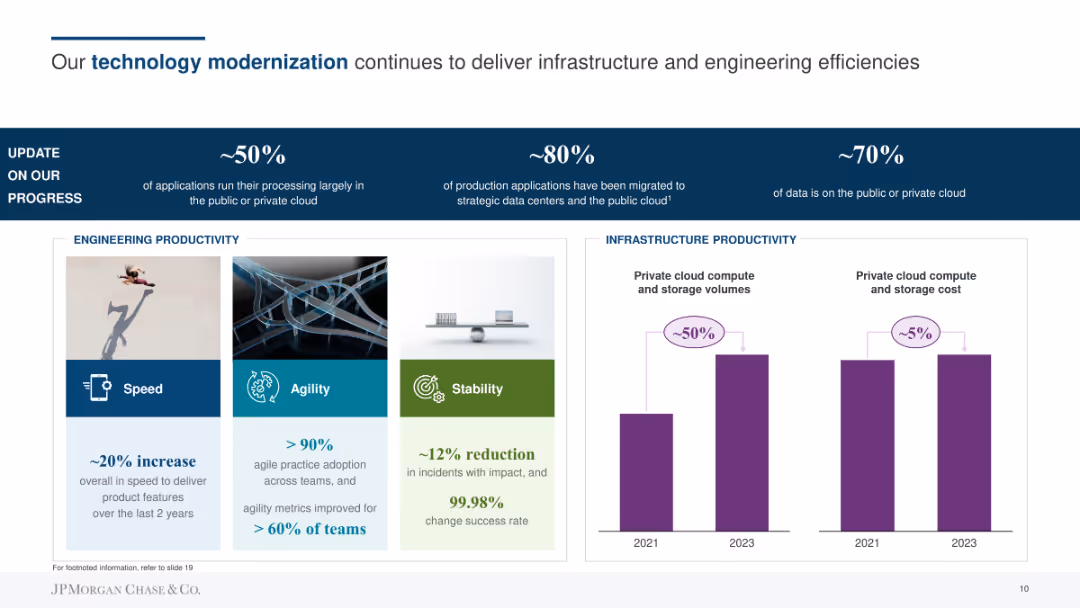
The slide details JPMorgan Chase & Co.'s technology modernization progress, focusing on application processing in the cloud, migration of production applications, and data storage. Highlights improvements in engineering and infrastructure productivity.
technology, cloud, infrastructure, productivity, progress
false
Technology and Digital Transformation
Financial Services
Mixed Chart
JP Morgan
Add to my slides
Remove from favorites
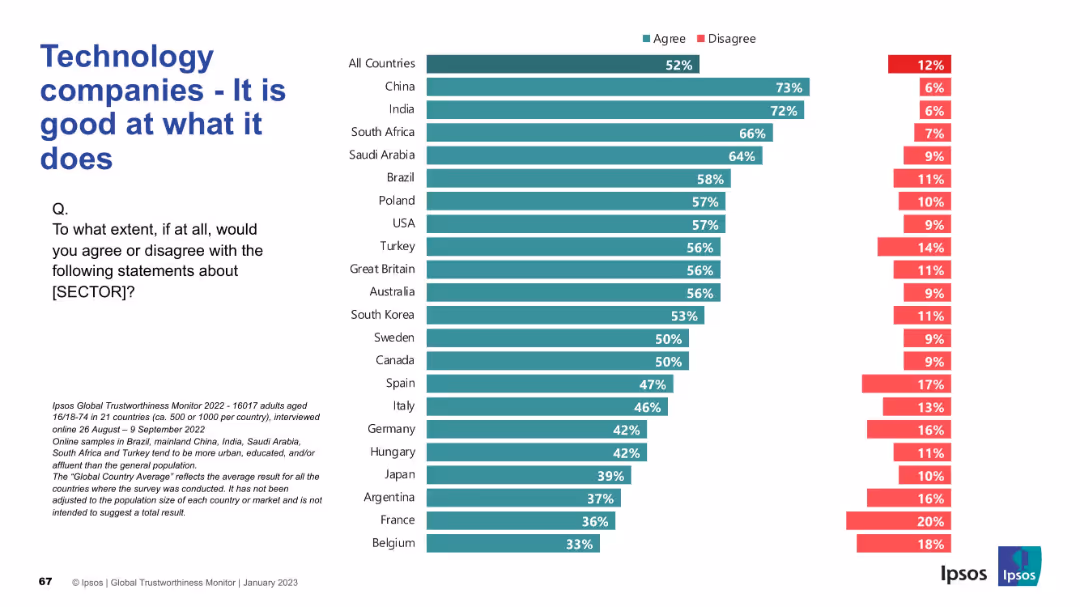
Bar chart ranking countries by agreement/disagreement on sector competence; question on left side.
Market Analysis and Trends
Technology & Software
This slide presents opinions from multiple countries on whether people believe technology companies are competent in their work, showing agreement and disagreement rates.
technology, competence, global opinion, trust, Ipsos, survey, perception, agreement, sector reputation, public trust
false
Market Analysis and Trends
Technology & Software
Mixed Chart
IPSOS
Add to my slides
Remove from favorites
The slide features vertical bar charts comparing survey responses by age groups on their concerns about technology and internet reliance.
Market Analysis and Trends
Technology & Software
The slide presents data showing that younger people are more likely to express concerns about technology and their dependency on the internet.
Technology concerns, age groups, internet reliance, public opinion, survey
false
Market Analysis and Trends
Technology & Software
Multiple Chart
IPSOS
Add to my slides
Remove from favorites
Divided into three columns: Technological evolution, Operating model re-invention, Macro-transformation, each with bullet points and associated icons.
Market Analysis and Trends
Technology & Software
Examines how evolving customer needs and macro shifts are driving technological advances and changes in operating models in the high-tech industry.
technology, customer needs, macro shifts, high-tech, innovation, operating models
false
Market Analysis and Trends
Technology & Software
Table
Accenture
Add to my slides
Remove from favorites
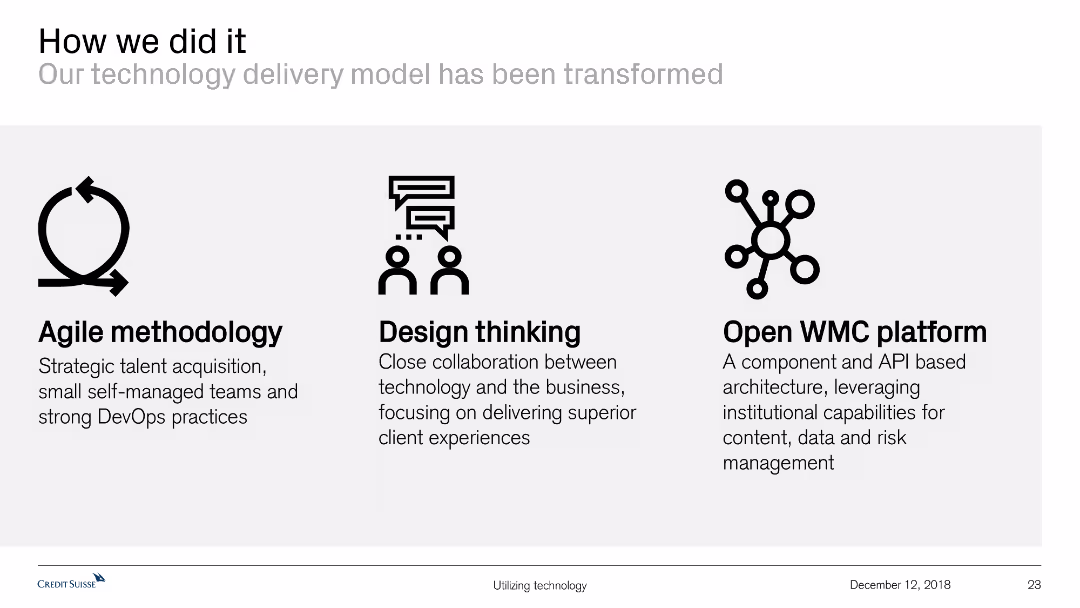
Features icons and text to describe the transformation of the technology delivery model through agile methodology, design thinking, and an open WMC platform.
Technology and Digital Transformation
Technology & Software
This slide explains the transformation of the technology delivery model, highlighting key methodologies and platforms used, such as agile practices and design thinking.
technology delivery, agile methodology, design thinking, open WMC platform, transformation, technology model, collaboration, client experience
false
Technology and Digital Transformation
Technology & Software
Pillar
Credit Suisse
Add to my slides
Remove from favorites
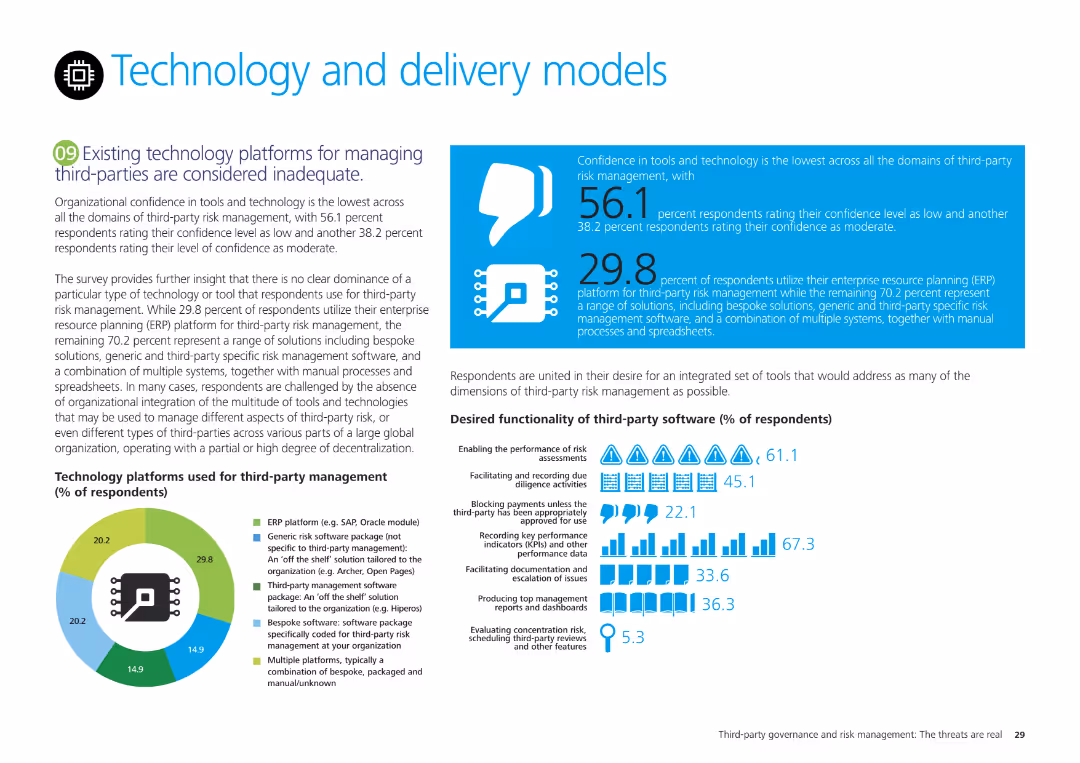
Multiple charts showing confidence levels in technology platforms and desired functionality of third-party software. High visual density with explanatory text boxes.
Technology and Digital Transformation
Technology & Software
Highlights existing inadequacies in technology platforms for third-party management, desired functionalities, and confidence levels, with detailed charts.
technology, delivery models, third-party, software, confidence, functionality
false
Technology and Digital Transformation
Technology & Software
Mixed Chart
Deloitte
Add to my slides
Remove from favorites
A final slide in the disruption series, maintaining a consistent design with the previous slides. The text is organized in two columns, complemented by simple tech iconography. The white, blue, and black color scheme keeps the focus on the content.
Strategic Planning
Technology & Software
Concluding the series on technology-driven disruptions, this slide summarizes the transformative effects on strategy, organization, and operations, providing a high-level view of the strategic considerations necessary to navigate the evolving tech landscape. It is intended for presentations that aim to synthesize and summarize key points from a detailed discussion on cross-industry technological impacts.
Technology, Disruption, Strategy, Summary, Transformative, Organization, Operations, Considerations
false
Strategic Planning
Technology & Software
Header Vertical
McKinsey
Add to my slides
Remove from favorites
This slide features multiple data visualizations: line charts showing the tech expense trend, column charts depicting cloud adoption and account opening metrics, and small multiples for mortgage funding and fraud prevention statistics. Each visualization includes performance indicators like percentage points and cost-to-fund ratios.
Technology and Digital Transformation
Financial Services
Demonstrating the impact of technology investments on operational efficiency, this slide provides an overview of tech-related improvements in processes and outcomes. Suitable for presentations on digital transformation or IT strategy.
technology, efficiency, digital transformation, cloud adoption
false
Technology and Digital Transformation
Financial Services
Multiple Chart
JP Morgan
Add to my slides
Remove from favorites
A two-section slide with text on the left explaining the foundational role of technology in business transformation. The right side features a bar graph, "Technology is foundational," detailing the percentage of executives agreeing with technology's critical role in their organization's reinvention strategies.
Technology and Digital Transformation
Technology & Software
The slide asserts the strategic importance of technology in contemporary business, offering insights on executive perceptions regarding technology as a cornerstone for innovation and growth. It could serve as an argument for increasing tech investments and prioritizing digital transformation initiatives.
technology, enabler, digital transformation, business strategy, executive insights
false
Technology and Digital Transformation
Technology & Software
Multiple Chart
Accenture
Add to my slides
Remove from favorites
The slide includes a bar chart showing the percentage of global IPOs by sector and the number and proceeds of IPOs for 2022 compared to 2021.
Market Analysis and Trends
Financial Services
Shows the dominance of the technology sector in IPO volume and the leading role of the energy sector in IPO proceeds in 2022.
Technology, energy, IPO, sector comparison, 2022
false
Market Analysis and Trends
Financial Services
Multiple Chart
EY
Add to my slides
Remove from favorites
The slide has a dark background with a highlighted yellow text box containing a quote. It includes a question and four circular charts with percentages showing responses.
Technology and Digital Transformation
Healthcare & Pharmaceuticals
The slide discusses Australian consumers' openness to personalized medicine, genetic testing, and non-urgent care in retail locations, using wearables, and sensors.
Technology-enhanced care, personalized medicine, genetic testing, wearables, Australia
false
Technology and Digital Transformation
Healthcare & Pharmaceuticals
Mixed Chart
EY
Add to my slides
Remove from favorites
The slide has a dark background, a yellow text box for the quote, and a question followed by four circular charts with percentages showing consumer preparedness for tech care.
Technology and Digital Transformation
Healthcare & Pharmaceuticals
This slide discusses Canadian consumers' openness to personalized medicine, genetic testing, and non-urgent care in retail locations, using wearables, and sensors.
Technology-enhanced care, personalized medicine, genetic testing, wearables, Canada
false
Technology and Digital Transformation
Healthcare & Pharmaceuticals
Mixed Chart
EY
Add to my slides
Remove from favorites
Similar dark background and white text with circular charts displaying percentages and yellow highlights.
Market Analysis and Trends
Healthcare & Pharmaceuticals
This slide demonstrates consumer openness to personalized medicine and technology-enhanced care, with 66% willing to take genetic tests, 66% open to non-urgent care at mini clinics, 64% willing to take medications made for their genetic profile, and 61% using wearables and mobile apps for health monitoring.
technology-enhanced care, personalized medicine, genetic testing, wearables, U.S. consumers
false
Market Analysis and Trends
Healthcare & Pharmaceuticals
Mixed Chart
EY
Add to my slides
Remove from favorites
Flowcharts and column charts showing technology improvement.
Technology and Digital Transformation
Financial Services
Details improvements in electronic offerings with specific performance metrics.
Technology, Enhancements, Strategy, Performance Metrics, Financial Services
false
Technology and Digital Transformation
Financial Services
Mixed Chart
Barclays
Add to my slides
Remove from favorites
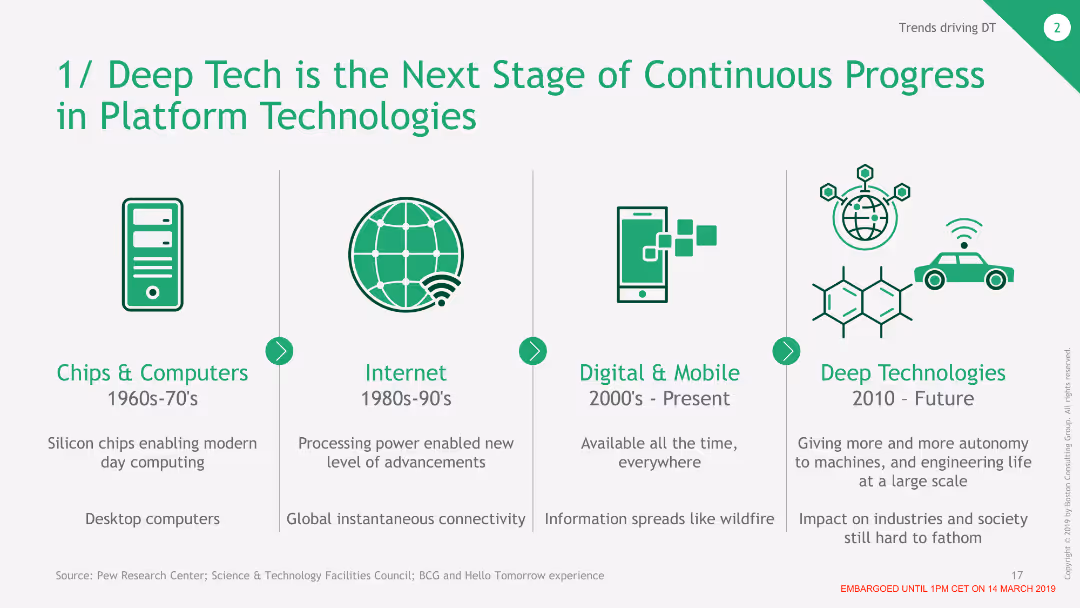
The slide contains four columns each with a graphical icon at the top and explanatory text below. The four columns are evenly spaced, each representing a different technological era.
Market Analysis and Trends
Technology & Software
This slide explains the evolution of platform technologies from the 1960s to the present and predicts future trends. It highlights key developments in chips, the internet, mobile tech, and deep technologies.
Technology, Evolution, Internet, Mobile, Chips
false
Market Analysis and Trends
Technology & Software
Pillar
BCG
Add to my slides
Remove from favorites
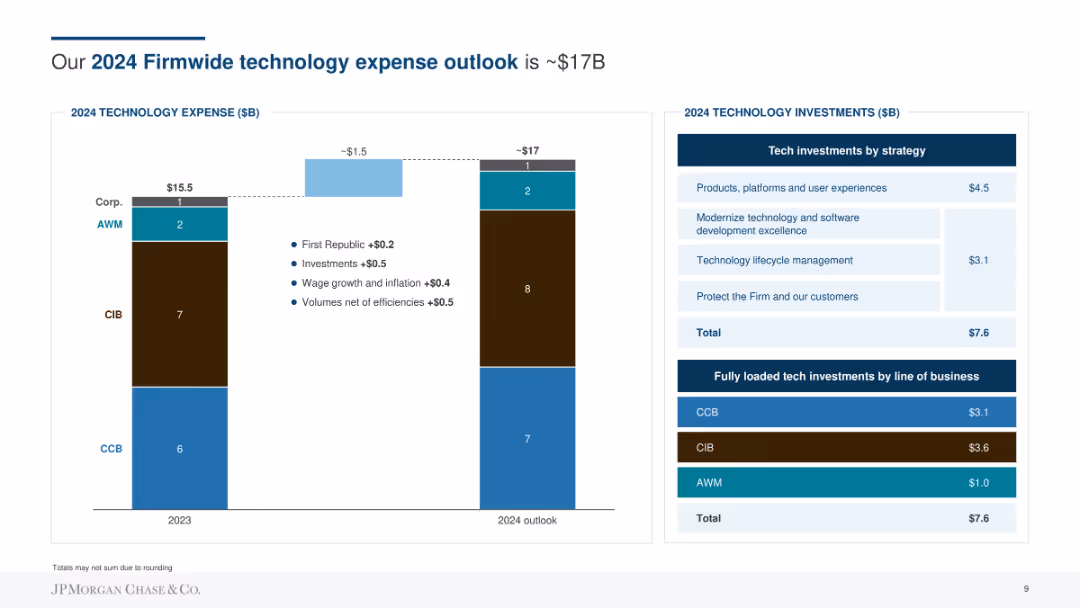
Column chart comparing 2023 and 2024 technology expenses, with breakdowns for AWM, CIB, CCB, and Corp. Includes a detailed side panel with tech investment strategies. Shows a projected increase to ~$17B.
Financial Performance
Financial Services
Provides an outlook for 2024 technology expenses expected to be around $17B. Breaks down investments by strategy, including products, modernization, and protection efforts.
Technology, Expense, Investment, Strategy, Modernization, Protection, Financial
false
Financial Performance
Financial Services
Mixed Chart
JP Morgan
Add to my slides
Remove from favorites
The slide features multiple column charts, a line graph, and various text annotations. Two primary colors, blue and grey, dominate the charts. The slide layout is clean with a balance between graphics and text information.
Financial Performance
Financial Services
This slide shows the total technology expense growth of a financial firm, highlighting the drivers such as investments and volumes. The aim is to depict investment strategies and projected outcomes, which would be of interest to investors or company stakeholders. It breaks down expenses by categories and shows CAGR (compound annual growth rate).
Technology, Expenses, CAGR, Investment, Finance
false
Financial Performance
Financial Services
Mixed Chart
JP Morgan
Add to my slides
Remove from favorites
Text-heavy with table and a bar chart, discussing technology's impact on financial advisors.
Technology and Digital Transformation
Financial Services
Explores how technology will shift the role of financial advisors and the preference for digital solutions.
technology, financial advisors, digital solutions, impact, financial services
false
Technology and Digital Transformation
Financial Services
Mixed Chart
Deloitte
Add to my slides
Remove from favorites
This slide features a bar chart with horizontal bars showcasing various technologies and their impact on foodservice over the next five years, with percentages and changes.
Market Analysis and Trends
Hospitality & Tourism
The slide discusses key technologies influencing the foodservice industry, including online ordering, AI, and automation, highlighting their potential impact over the next five years.
Technology, Foodservice, Innovation, AI, Automation
false
Market Analysis and Trends
Hospitality & Tourism
Mixed Chart
Deloitte
Add to my slides
Remove from favorites
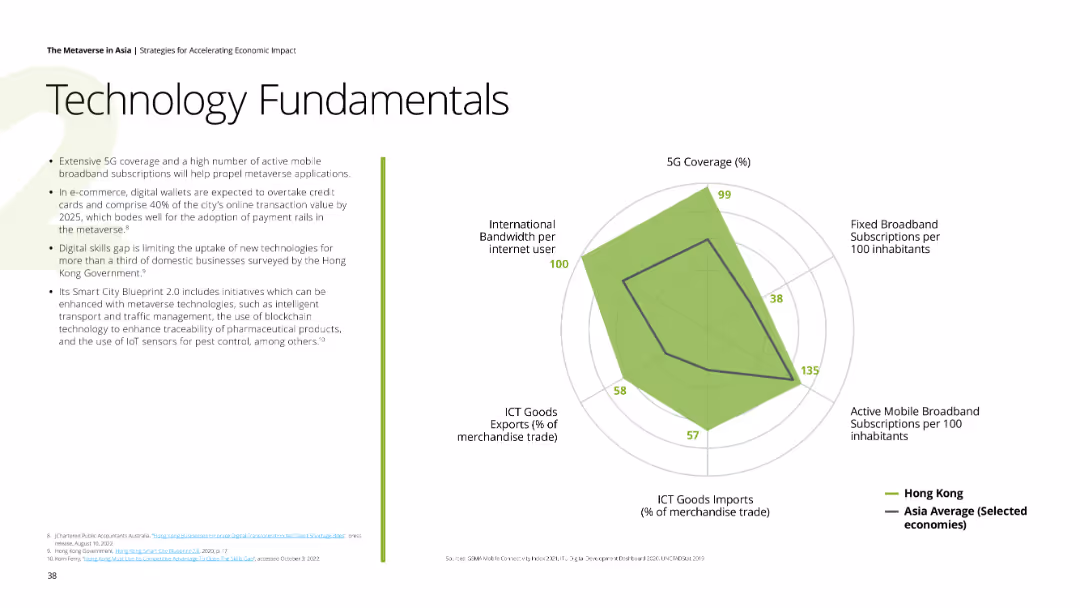
Text and a radar chart showing various technology metrics like 5G coverage and broadband subscriptions for Hong Kong.
Technology and Digital Transformation
Technology & Software
The slide details the technological fundamentals necessary for the metaverse, focusing on Hong Kong’s tech readiness.
technology, fundamentals, 5G, broadband, Hong Kong
false
Technology and Digital Transformation
Technology & Software
Mixed Chart
Deloitte
Add to my slides
Remove from favorites
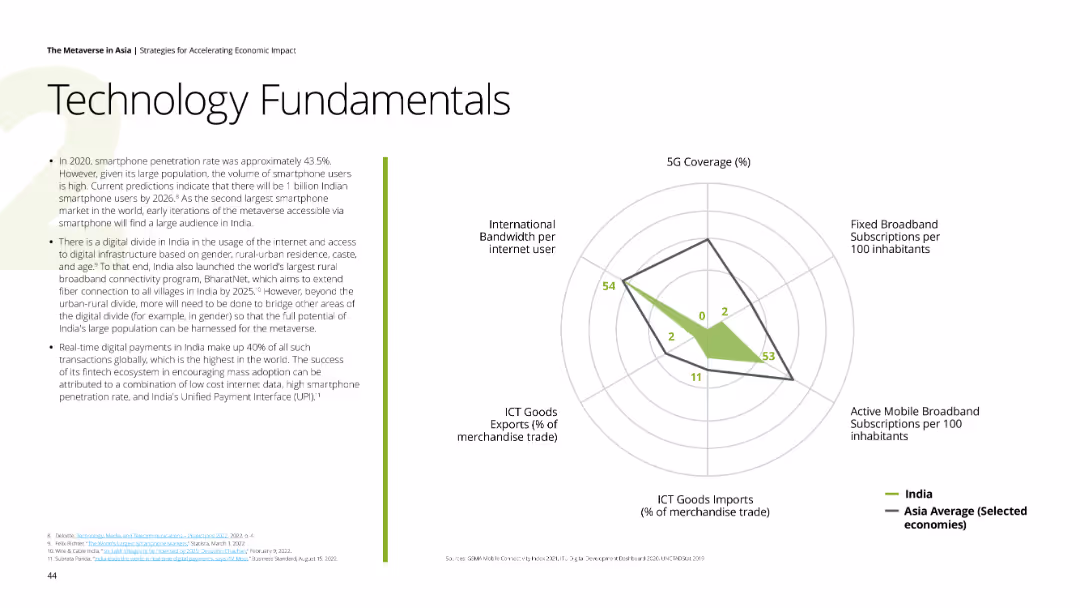
Text and a radar chart showing various technology metrics like 5G coverage and broadband subscriptions for India.
Technology and Digital Transformation
Technology & Software
The slide details the technological fundamentals necessary for the metaverse, focusing on India’s tech readiness.
technology, fundamentals, 5G, broadband, India
false
Technology and Digital Transformation
Technology & Software
Mixed Chart
Deloitte
Add to my slides
Remove from favorites
This slide features two line charts comparing angel & seed and series A funding in technology from 2005 to 2017. It uses a blue and green color scheme and contains a legend, axis labels, and a note.
Market Analysis and Trends
Technology & Software
This slide shows the trend of increasing average funding round sizes in the technology sector over time, with specific focus on early stages and series A funding, suitable for financial and market trend analysis.
Technology, Funding, Trend, Series A, Angel & Seed
false
Market Analysis and Trends
Technology & Software
Multiple Chart
Oliver Wyman
Add to my slides
Remove from favorites
This slide features a complex graph tracking GDP changes across countries with reference to industrial revolutions. The bold title is complemented by a timeline and legend. Design is data-heavy, with an inset quote and photo on the top right. The blue and black color scheme maintains a professional appearance.
Financial Performance
Technology & Software
Highlighting the economic impact of technological advancements, this slide provides a historical perspective by correlating GDP growth with industrial revolutions. It presents a data-driven analysis ideal for discussions on technology’s role in economic development and the potential future implications of the ongoing Fourth Industrial Revolution. This could be used to support investment strategies or policy-making in tech sectors.
Technology, GDP, Economic Impact, Data Analysis, Industrial Revolution, Growth, Historical, Investment
true
Financial Performance
Technology & Software
Mixed Chart
McKinsey
Add to my slides
Remove from favorites
The slide is a content slide with a blend of text and a column chart. It features a background image of buses with an overlay text box. The right side has a column chart with four sectors listed vertically.
Market Analysis and Trends
Government & Public Sector
The slide discusses the role of governments in supporting technological innovation to achieve net-zero targets. It emphasizes the balance between regulation and investment and highlights major carbon emitters in 2050, advocating for the adoption of breakthrough technologies to aid decarbonization efforts.
Technology, Government, Net-zero, Decarbonization, Emissions
false
Market Analysis and Trends
Government & Public Sector
Mixed Chart
EY
Add to my slides
Remove from favorites
The slide compares the compound annual growth rate (CAGR) of technology investments to other sectors using a bar graph and provides explanatory text for observed trends in deal value growth.
Market Analysis and Trends
Technology & Software
This slide contrasts the growth rates in technology venture investing with other sectors, highlighting periods of resilience and expansion. It discusses the macroeconomic conditions influencing these trends and the notable increase in deal values in technology, emphasizing the sector's robust performance compared to others.
technology growth, CAGR, venture investing, market analysis, sector comparison
false
Market Analysis and Trends
Technology & Software
Mixed Chart
Oliver Wyman
Add to my slides
Remove from favorites
Features two vertical column charts comparing the market cap of top non-tech versus tech companies in Brazil between 2010 and 2019, showing significant growth in the tech sector.
Market Analysis and Trends
Technology & Software
Highlights the rapid growth of Brazil's technology sector within the top companies by market cap, contrasting it with the slower growth of non-tech sectors.
technology growth, market cap, Brazil, tech vs non-tech, 2010 vs 2019
false
Market Analysis and Trends
Technology & Software
Multiple Chart
McKinsey
Add to my slides
Remove from favorites
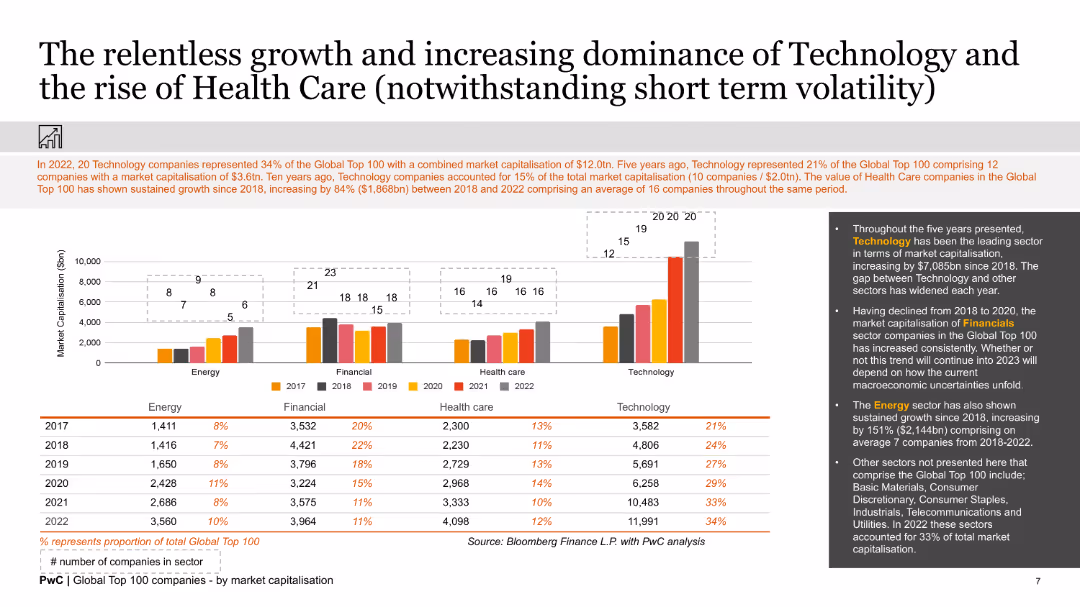
This slide features a column chart illustrating the market capitalization of various sectors from 2017 to 2022. The sectors included are Energy, Financial, Health Care, and Technology. The chart is color-coded by year.
Market Analysis and Trends
Technology & Software
The slide highlights the growth in market capitalization for Technology and Health Care sectors over five years. It shows a sustained increase in the Technology sector's market cap, indicating its growing dominance compared to other sectors.
Technology, Healthcare, Market Capitalization, Growth, Trends, Analysis, Column Chart, Sectors, Financial Performance, Historical Data
false
Market Analysis and Trends
Technology & Software
Mixed Chart
PwC/Strategy&
Add to my slides
Remove from favorites
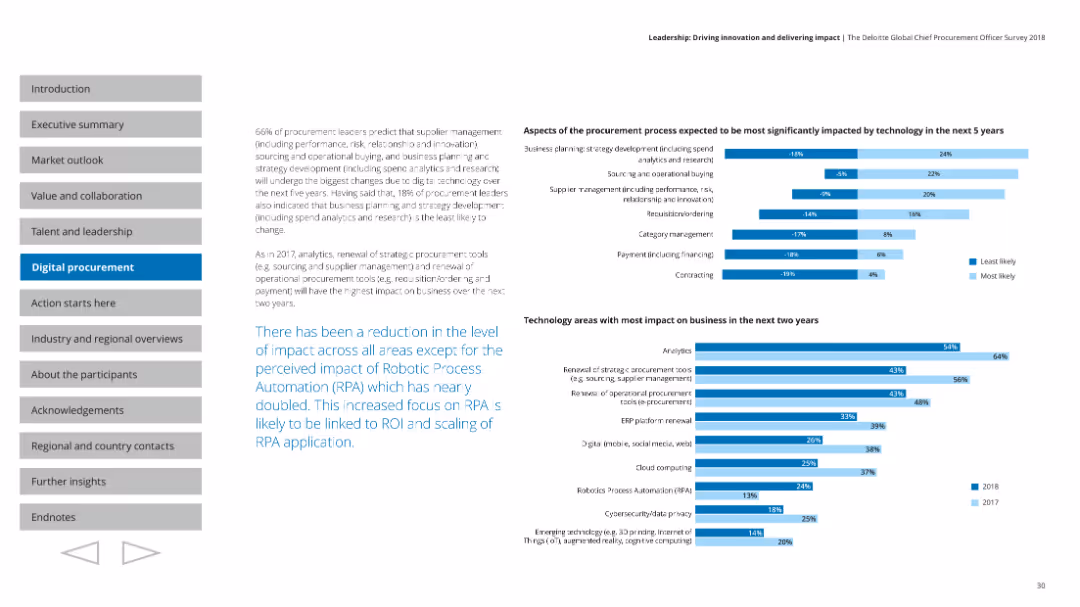
The slide presents multiple column charts detailing aspects of procurement processes and technology areas with the most business impact in the next two years.
Technology and Digital Transformation
Professional Services
Discusses the reduction in impact across areas except for the increased impact of Robotic Process Automation (RPA) on business processes.
Technology impact, business, RPA, analytics, future trends
false
Technology and Digital Transformation
Professional Services
Multiple Chart
Deloitte
Add to my slides
Remove from favorites
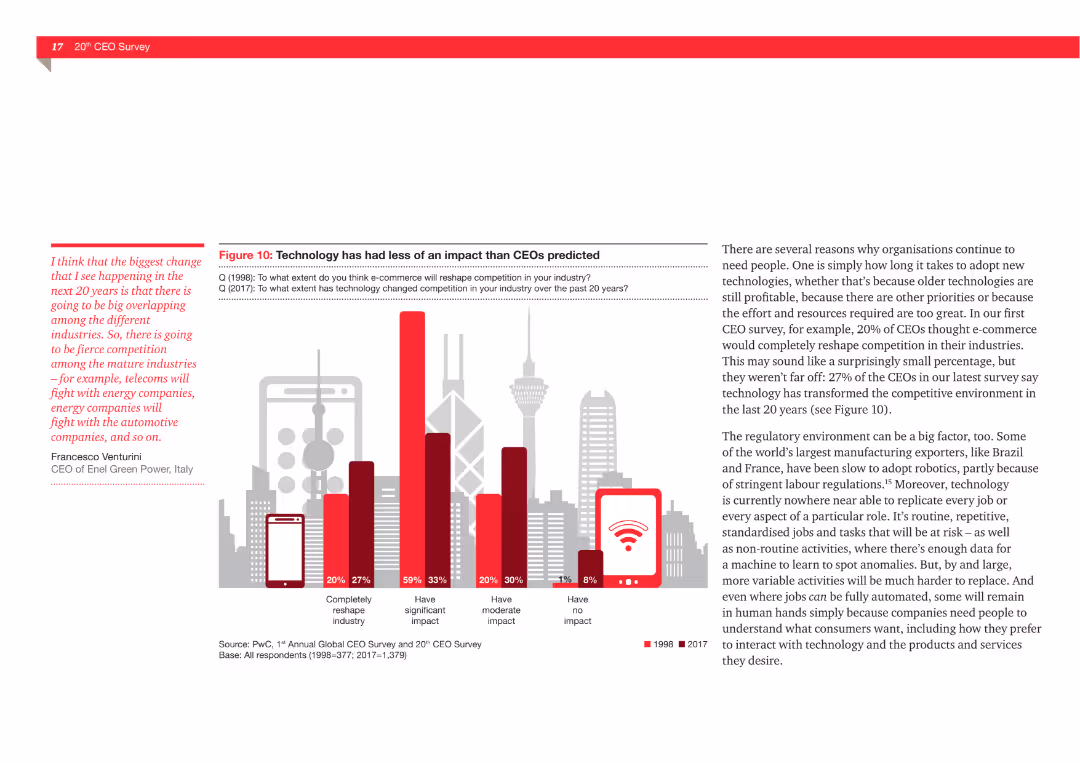
The slide features a column chart comparing CEOs' predictions from 1998 and 2017 about the impact of technology on competition, with categories like "significant impact" and "no impact."
Market Analysis and Trends
Technology & Software
This slide illustrates how CEOs' predictions about the impact of technology on competition have changed from 1998 to 2017. It shows that while many expected significant changes, the actual impact has been more moderate than anticipated.
Technology, impact, competition, predictions, CEOs, market analysis, trends
false
Market Analysis and Trends
Technology & Software
Mixed Chart
PwC/Strategy&
Add to my slides
Remove from favorites
Slide includes a timeline chart tracking technology development from 1950 to 2020, alongside cost comparisons for key technologies like drones and solar energy.
Technology and Digital Transformation
Technology & Software
Explores how combinatory technological advancements have accelerated innovation, with specific examples of technology cost reductions.
technology impact, digital revolution, innovation acceleration, cost reduction, drones, solar energy, technological advancements
false
Technology and Digital Transformation
Technology & Software
Mixed Chart
Accenture
Add to my slides
Remove from favorites
This slide compares benefits and challenges in two lists side by side. The benefits for businesses and economies are on the left, while the challenges are categorized into social, economic, and other issues on the right.
Market Analysis and Trends
Technology & Software
Discusses the benefits and challenges of technological advances, such as faster innovation and issues like job displacement, framing a discussion on managing technological impact.
technology impact, innovation, social challenges, economic benefits, job displacement, comparative analysis
false
Market Analysis and Trends
Technology & Software
Boxed
McKinsey
Add to my slides
Remove from favorites
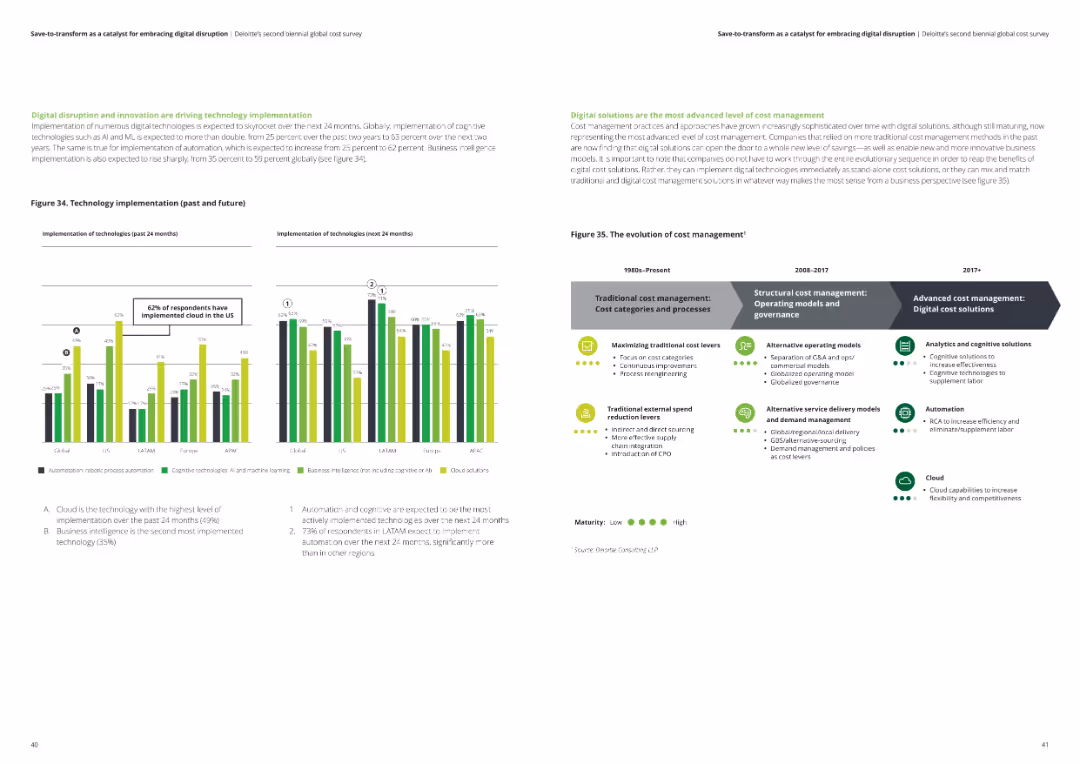
This slide features multiple column charts comparing past and future technology implementations, as well as a timeline chart showing the evolution of cost management.
Operational Efficiency
Professional Services
The slide analyzes the driving factors behind technology implementation and cost management. It presents data on the growth of cloud and business intelligence technology implementations and the evolution of cost management practices.
technology implementation, cost management, cloud technology, business intelligence, survey data
false
Operational Efficiency
Professional Services
Multiple Chart
Deloitte
Add to my slides
Remove from favorites
A grid layout with icons and text describes different technology implementation strategies. The design is instructional, with clear delineation between the models and a blue and black color scheme for readability.
Technology and Digital Transformation
Professional Services
This slide examines four archetypes of technology implementation within organizations. It's pivotal for leadership discussions about technology adoption, indicating the necessity for a strategic fit with existing business models and highlighting how ecosystems can facilitate technology integration.
Technology Implementation, Strategy, Business Model, Ecosystems, Organizational Fit
false
Technology and Digital Transformation
Professional Services
Header Horizontal
McKinsey
Add to my slides
Remove from favorites
Contains multiple bar graphs with percentages showing the status of various underwriting technologies in implementation stages.
Technology and Digital Transformation
Financial Services
Shows current adoption levels and future plans for different technologies in underwriting, like AI, self-service portals, and data integration.
technology, implementation, underwriting, adoption, AI, data, self-service
false
Technology and Digital Transformation
Financial Services
Mixed Chart
Accenture
Add to my slides
Remove from favorites
A pie chart showing the distribution of responses about technology infrastructure. Different segments represent various levels of satisfaction and automation
Operational Efficiency
Financial Services
This slide describes the current state of budgeting and forecasting technology infrastructure, highlighting the use of spreadsheets and automation levels.
technology infrastructure, budgeting, forecasting, automation, spreadsheets
false
Operational Efficiency
Financial Services
Multiple Chart
PwC/Strategy&
Add to my slides
Remove from favorites
Contains images and icons depicting technological innovation, with comparative investment figures and examples of foreign tech collaboration in China.
Technology and Digital Transformation
Technology & Software
Highlights China's role as a burgeoning hub for technological innovation, with emphasis on international collaboration and investment in tech sectors.
technology, innovation, China, investment, AI, digital transformation, global tech
false
Technology and Digital Transformation
Technology & Software
Multiple Chart
BCG
Add to my slides
Remove from favorites
The slide is sectioned into areas of innovation, each with icons and stats, emphasizing JPMorgan's tech and data-driven approach.
Strategic Planning
Financial Services
Discusses how JPMorgan leverages technology and data to drive future growth, detailing the impact of strategic tech applications and cybersecurity efforts, framed within the context of innovation and value creation.
technology, innovation, data, JPMorgan, cybersecurity
false
Strategic Planning
Financial Services
Pillar
JP Morgan
Add to my slides
Remove from favorites
The slide combines text with a central diagram that connects drilling, receiving real-time information, and accurate subsurface data. It features a quotation for a personal touch and provides a concise visual representation of the company's technological focus.
Technology and Digital Transformation
Industrial & Manufacturing
The slide explains how the company's technologies enhance drilling and data analysis, used to highlight innovation in operational technologies and their impact on cost-effective operations.
Technology, Innovation, Drilling, Data Analysis, Cost-Effective
false
Technology and Digital Transformation
Industrial & Manufacturing
Framework
Morgan Stanley
Add to my slides
Remove from favorites
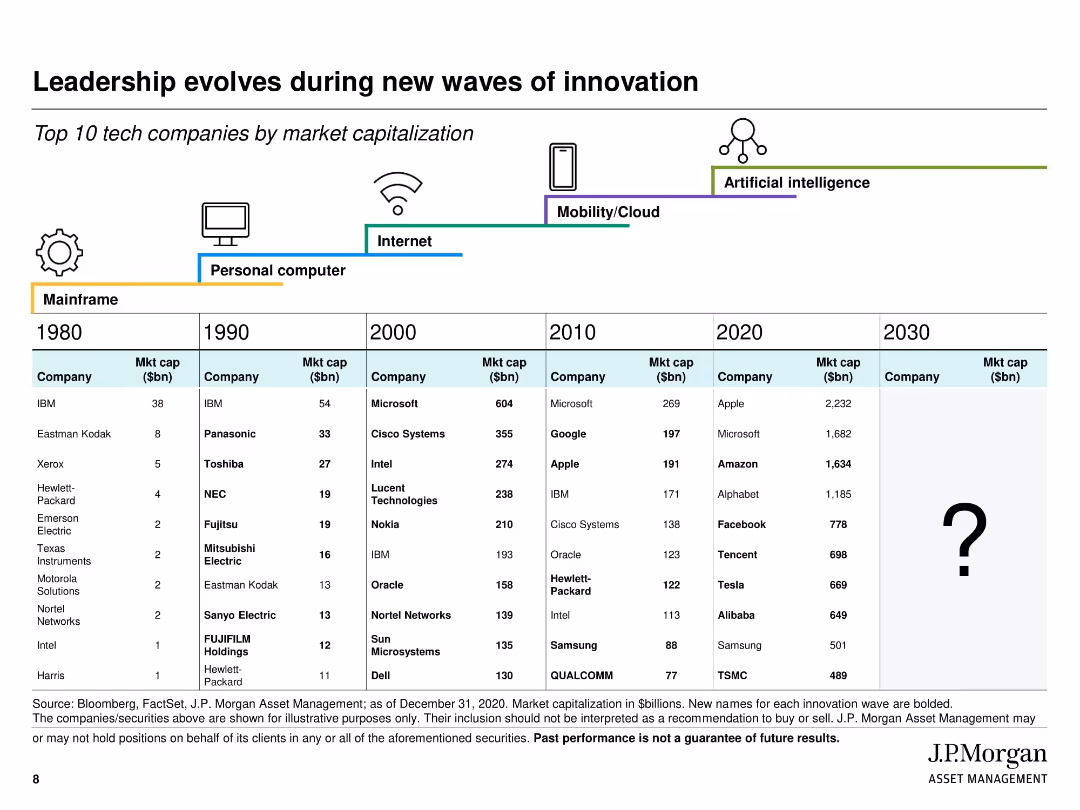
Timeline chart with vertical columns of top 10 tech companies by market cap by decade (1980–2030 projection); icons representing tech eras
Market Analysis and Trends
Technology & Software
Charts the evolution of top technology companies by market capitalization across major innovation waves (Mainframe to AI). Visuals include a tech-era timeline and bolded companies as new leaders. The slide conveys how market leadership shifts over time, emphasizing adaptation to technological disruption.
technology, innovation, market cap, top companies, leadership, disruption, historical trends, J.P. Morgan
false
Market Analysis and Trends
Technology & Software
Table
JP Morgan
Add to my slides
Remove from favorites
Features a variety of data visualization formats including bar charts and line graphs, alongside textual explanations and column chart.
Market Analysis and Trends
Technology & Software
Examines the acceleration of technological innovation and its widespread impacts across various sectors, highlighting both the benefits and potential risks associated with rapid technological adoption.
technology, innovation, transformation, sectors, bar charts, line graphs
false
Market Analysis and Trends
Technology & Software
Multiple Chart
PwC/Strategy&
Add to my slides
Remove from favorites
The slide features a cloud-shaped information hub with people using computer terminals. The layout includes three key points presented in dialogue bubbles on a green background.
Industry Overview
Technology & Software
The slide discusses enabling technology to improve worker performance, using interventions for better human outcomes, and scaling insights for broader impacts.
technology, interventions, scaling, human impact, insights, performance improvement, technology enablement
false
Industry Overview
Technology & Software
Linear Flow
Deloitte
Add to my slides
Remove from favorites
The slide has two main sections; one is a column chart showing 'Technology and Product Investments,' with future outlook annotations, and the other is a text section detailing the impacts of these investments. The visual elements are clearly divided, using contrasting colors and icons to denote different aspects of technology development.
Technology and Digital Transformation
Technology & Software
This slide presents the financial commitments made towards technology and product development, alongside the tangible impacts of such investments on business operations and customer experience. It's utilized for illustrating the company's dedication to innovation and the concrete benefits derived from investments in modernization, likely intended for investor or stakeholder presentations.
Technology, Investment, Innovation, Digital Transformation, Impact, Business Value, Customer Experience
false
Technology and Digital Transformation
Technology & Software
Mixed Chart
JP Morgan
Add to my slides
Remove from favorites
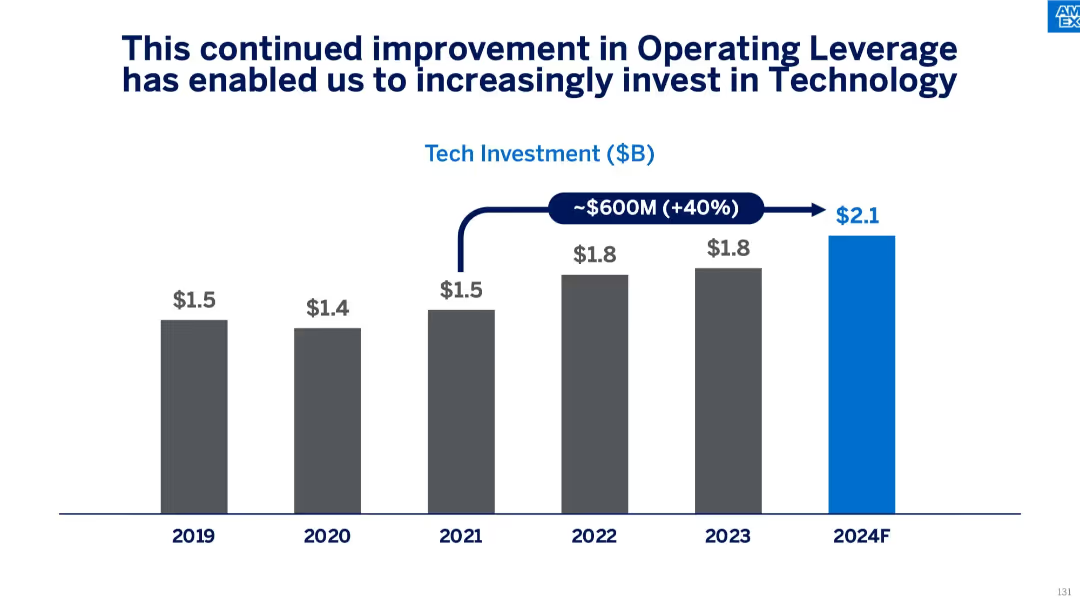
Vertical bar chart showing annual tech investment ($B) from 2019 to 2024F, indicating a $600M increase and 40% growth. Blue bar highlights projected 2024 investment.
Strategic Planning
Financial Services
This slide illustrates how improved operating leverage has led to increased technology investments, with spending rising from $1.5B in 2019 to a forecasted $2.1B in 2024. The message emphasizes the company’s strategic focus on long-term tech enablement and innovation.
technology investment, operating leverage, forecasting, cost efficiency, budget growth, financial planning, digital innovation
false
Strategic Planning
Financial Services
Single Chart
McKinsey
Add to my slides
Remove from favorites
This slide is textual with bullet points under three categories highlighting ongoing technology investments, with additional boxes emphasizing productivity and efficiency through software engineering, platform simplification, and portfolio governance.
Technology and Digital Transformation
Financial Services
Designed for IT strategists and financial executives, it underscores the firm’s commitment to technological advancements, emphasizing specific areas of investment aimed at driving innovation, productivity, and enhanced client experiences in the financial industry.
technology investment, productivity, efficiency, digital transformation, software engineering, IT strategy
false
Technology and Digital Transformation
Financial Services
Header Vertical
JP Morgan
Add to my slides
Remove from favorites
It features column charts and lists related to technology and product investment growth from 2017 to 2022, with specific strategic initiatives outlined.
Strategic Planning
Financial Services
This slide outlines JP Morgan's increasing investment in technology and products from 2017 to 2022, aimed at driving business growth and strategic advancements. It details initiatives like AI/ML investment and platform development, stressing their commitment to maintaining a competitive edge in the market.
technology, investments, AI, strategy
false
Strategic Planning
Financial Services
Mixed Chart
JP Morgan
Add to my slides
Remove from favorites
Bar chart showing planned technology investments by family offices, with accompanying text on significance.
Technology and Digital Transformation
Financial Services
Highlights the technology investment plans of APAC family offices, emphasizing cybersecurity and IT hardware.
technology investments, APAC, family offices, cybersecurity, IT hardware
false
Technology and Digital Transformation
Financial Services
Mixed Chart
EY
Add to my slides
Remove from favorites
Previous
Next
You don't have any favorites yet.
Please wait loading your favorites slides...
Create a FREE account to continue browsing
Receive Instant Access to 1,000+ slides from companies like McKinsey, Google, and Goldman Sachs
First Name
Last Name
Email
Password
I agree to all
Terms & Privacy Policy
Thank you! Your submission has been received!
Oops! Something went wrong while submitting the form.
Have an account?
Sign in
Upgrade to PRO to Save slides
Advanced Search and Filters
Access to 15,000+ slides
Access to Category Pages
Save/Bookmark Slides
PowerPoint Template Library
Pick a Plan
MONTHLY
$12/month
Billed every month, Cancel anytime.
YEARLY
$9/year
Billed $108 annually, Cancel anytime.
Checkout for $12/month
Checkout for $108/yr
Secured by Stripe | AES-256 bit encryption