My Account
My Slides
Search by Category
Pricing
Templates
View All Templates
Download Template Slides
✦ AI Search
Feedback
Login
Logout
Get Started
Browse all Slides
Browse all Slides
Create a FREE Account
Instant access to 1,000+ real slides from top companies like McKinsey, BCG, Goldman Sachs, Google and many more!
First Name
Last Name
Email
Password
I agree to all
Terms & Privacy Policy
Thank you! Your submission has been received!
Oops! Something went wrong while submitting the form.
Have an account?
Sign in
Saved Slides
Total No. of slides saved
0
↻ Refresh
✖ Clear all
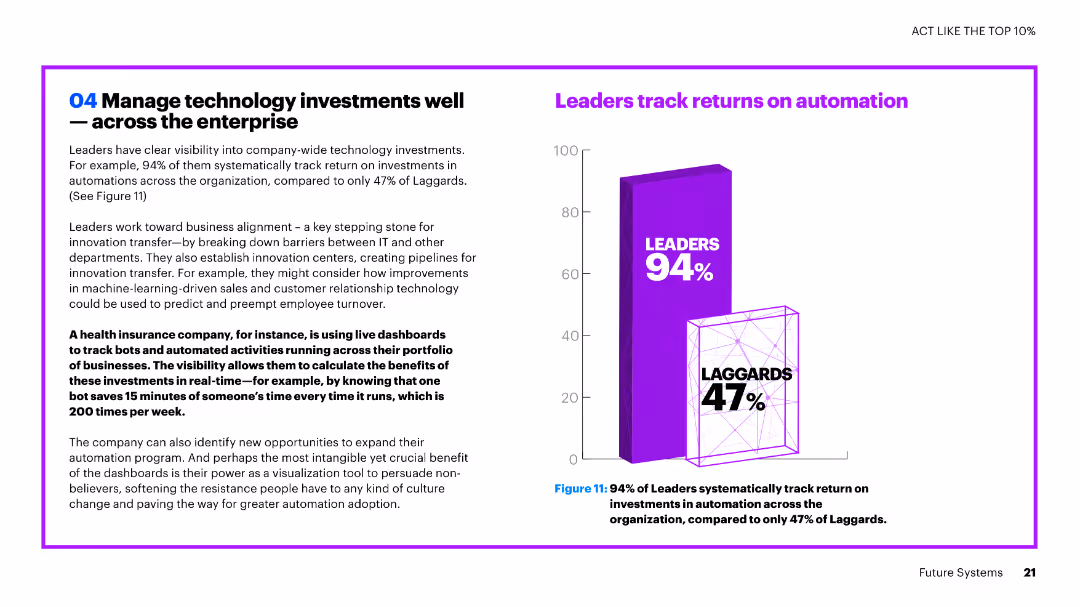
The slide contains text and a vertical column chart. The chart compares the percentage of leaders and laggards in tracking returns on automation investments.
Investment Analysis
Financial Services
The slide emphasizes the importance of tracking technology investments, highlighting that a high percentage of leaders track returns on automation investments compared to laggards.
technology investments, automation, leaders, laggards, tracking, returns, financial services, comparison
false
Investment Analysis
Financial Services
Mixed Chart
Accenture
Add to my slides
Remove from favorites
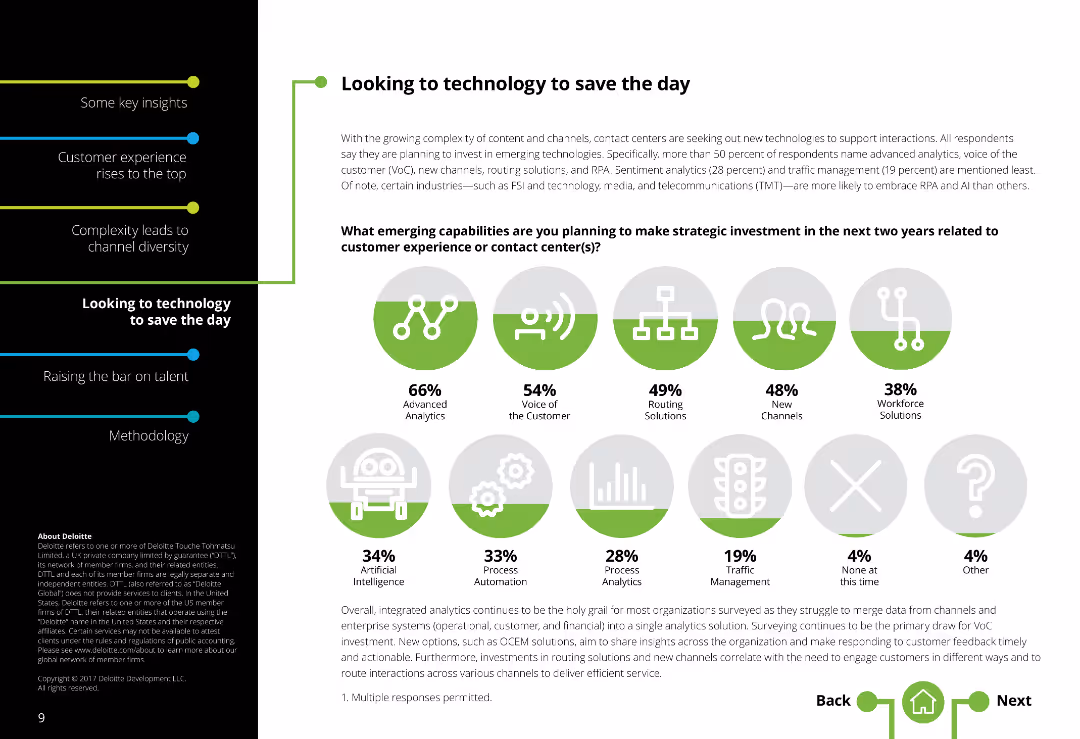
Two-column layout with text on the left and a series of icons representing emerging capabilities on the right. Moderately dense text.
Market Analysis and Trends
Technology & Software
Discusses emerging technologies and strategic investments in contact centers, focusing on analytics, voice of the customer, routing solutions, and workforce solutions.
Technology investments, Contact centers, Emerging technologies, Analytics, Voice of customer, Routing solutions, Workforce solutions
false
Market Analysis and Trends
Technology & Software
Mixed Chart
Deloitte
Add to my slides
Remove from favorites
Line graph showing trends in technology investments over time, accompanied by a column chart comparing technology and business capabilities.
Technology and Digital Transformation
Technology & Software
Analyzes the impact of strong technology and business capabilities on long-term profitable growth, highlighting the importance of strategic investments.
technology investments, profitable growth, business capabilities, long-term, strategic investments, trends, line graph, bar chart
false
Technology and Digital Transformation
Technology & Software
Multiple Chart
Accenture
Add to my slides
Remove from favorites
Combines text explanations with a bar chart showing ROI on various technologies
Technology and Digital Transformation
Financial Services
Analyzes the ROI of various technology investments within financial services, highlighting high returns on digital platforms.
technology investments, ROI, financial services, digital platforms
false
Technology and Digital Transformation
Financial Services
Mixed Chart
Deloitte
Add to my slides
Remove from favorites
Simple text layout with supporting graphics representing scales of impact and technical maturity, and organizational fit. The design emphasizes readability and clarity.
Investment Analysis
Technology & Software
Exploring the criteria for technological investments, this slide prompts strategic reflection on the timing, scale of impact, and organizational fit of tech trends. Ideal for guiding executives in making informed investment decisions, it underscores the importance of aligning technology strategy with the business model and the market stage.
Technology, Investment, Strategy, Impact, Maturity, Organization, Business Alignment
true
Investment Analysis
Technology & Software
Header Horizontal
McKinsey
Add to my slides
Remove from favorites
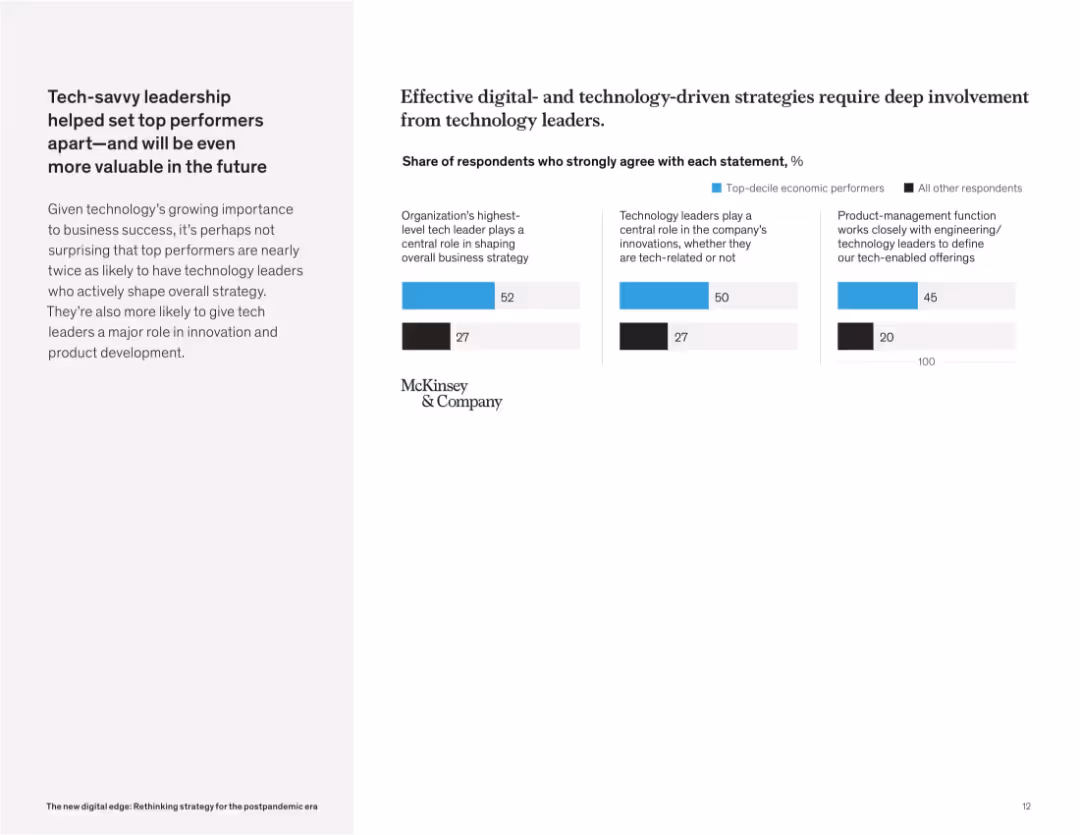
Grid layout with left-side narrative and three comparison bar charts on the right, each showing top vs. all respondents.
Human Resources and Talent Management
Technology & Software
The slide emphasizes the importance of tech leaders in strategic planning and innovation. Top performers are significantly more likely to involve their tech leaders in shaping business strategy and product development.
technology leadership, innovation, digital strategy, organizational strategy, product development, tech-driven success, McKinsey
false
Human Resources and Talent Management
Technology & Software
Mixed Chart
McKinsey
Add to my slides
Remove from favorites
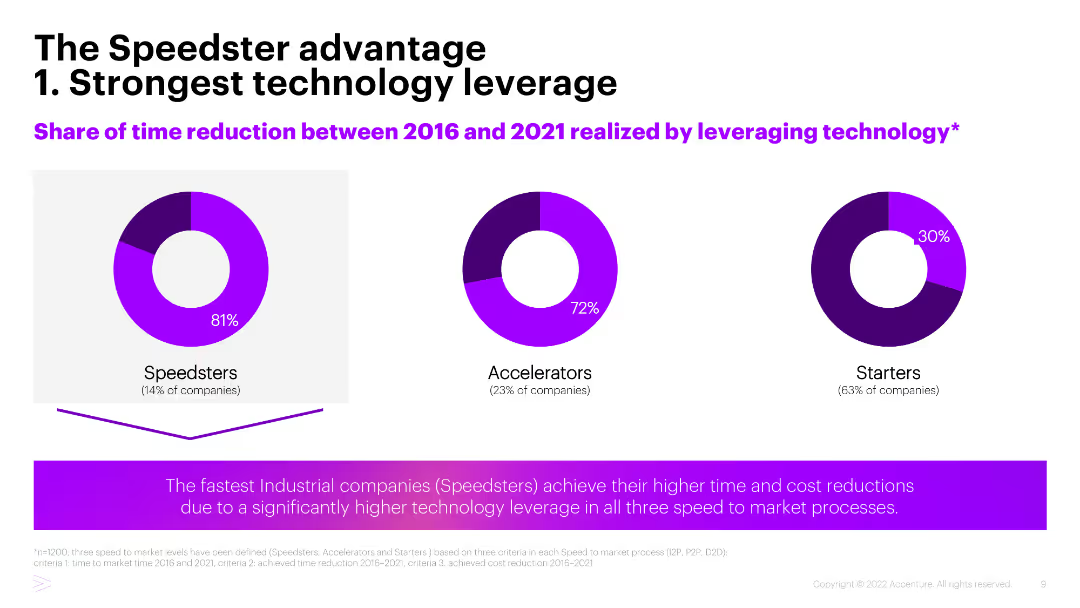
Three pie charts showing the share of time reduction between 2016 and 2021 realized by leveraging technology among Speedsters, Accelerators, and Starters.
Technology and Digital Transformation
Industrial & Manufacturing
This slide illustrates the advantage of industrial companies categorized as Speedsters in leveraging technology for significant time and cost reductions between 2016 and 2021.
Technology leverage, Time reduction, Speedsters, Industrial companies, Digital transformation
false
Technology and Digital Transformation
Industrial & Manufacturing
Multiple Chart
Accenture
Add to my slides
Remove from favorites
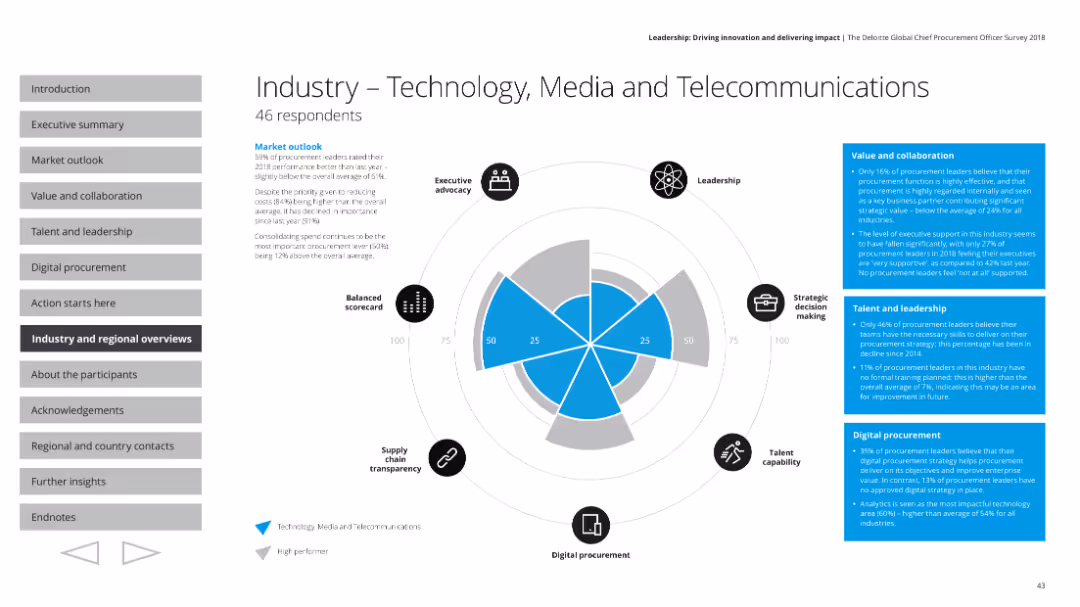
This slide features a radar chart with various performance metrics, accompanied by text boxes containing survey results and small icons for different performance aspects.
Industry Overview
Technology & Software
The slide provides an overview of the technology, media, and telecommunications industry's procurement performance from a survey. It covers executive advocacy, leadership, strategic decision making, talent capability, digital procurement, and supply chain transparency, with a market outlook and specific metrics on value, collaboration, talent, and leadership.
Technology, media, telecommunications, procurement, radar chart
false
Industry Overview
Technology & Software
Mixed Chart
Deloitte
Add to my slides
Remove from favorites
This slide features tables representing productivity improvements and economic impact in mining by 2025. It is a complex visual arrangement with quantitative data displayed across the charts.
Technology and Digital Transformation
Industrial & Manufacturing
The slide discusses the potential economic impacts of technological implementations in the mining industry by 2025, showing the productivity improvement percentages across various technological advancements.
technology, mining, productivity, 2025, economic impact, technological implementation, column chart, line chart
false
Technology and Digital Transformation
Industrial & Manufacturing
Table
McKinsey
Add to my slides
Remove from favorites
A diagram depicting various business areas supported by CTOO, including Wealth Management, Investment Bank, Swiss Bank, and Asset Management, with metrics for each area.
Technology and Digital Transformation
Technology & Software
This slide illustrates the support provided by Technology and Operations (CTOO) across different business areas, showcasing key metrics and the scale of foundational infrastructure.
technology, operations, business, support, metrics
false
Technology and Digital Transformation
Technology & Software
Diagram
Credit Suisse
Add to my slides
Remove from favorites
The slide contains an image of people using laptops, with text summarizing Greece's technology-related performance. A table lists factors like workforce availability and data protection with percentage comparisons.
Technology and Digital Transformation
Technology & Software
The slide examines Greece's technology-related performance, focusing on factors such as workforce availability, rate of innovation, data protection, and venture capital, with a detailed comparison.
technology, performance, Greece, workforce, innovation, data protection, venture
false
Technology and Digital Transformation
Technology & Software
Multiple Chart
EY
Add to my slides
Remove from favorites
The slide features multiple column charts on a dark background, focusing on technology-enhanced healthcare preferences.
Technology and Digital Transformation
Healthcare & Pharmaceuticals
It discusses the consumer openness to personalized medicine, genetic testing, and wearable health technology.
technology, personalized care, genetic testing, survey, England
false
Technology and Digital Transformation
Healthcare & Pharmaceuticals
Mixed Chart
EY
Add to my slides
Remove from favorites
The slide features multiple column charts on a dark background, focusing on technology-enhanced healthcare preferences, with white and yellow text.
Technology and Digital Transformation
Healthcare & Pharmaceuticals
It highlights consumer readiness for personalized medicine, genetic testing, and wearable technology in healthcare.
technology, personalized care, genetic testing, survey, Germany
false
Technology and Digital Transformation
Healthcare & Pharmaceuticals
Mixed Chart
EY
Add to my slides
Remove from favorites
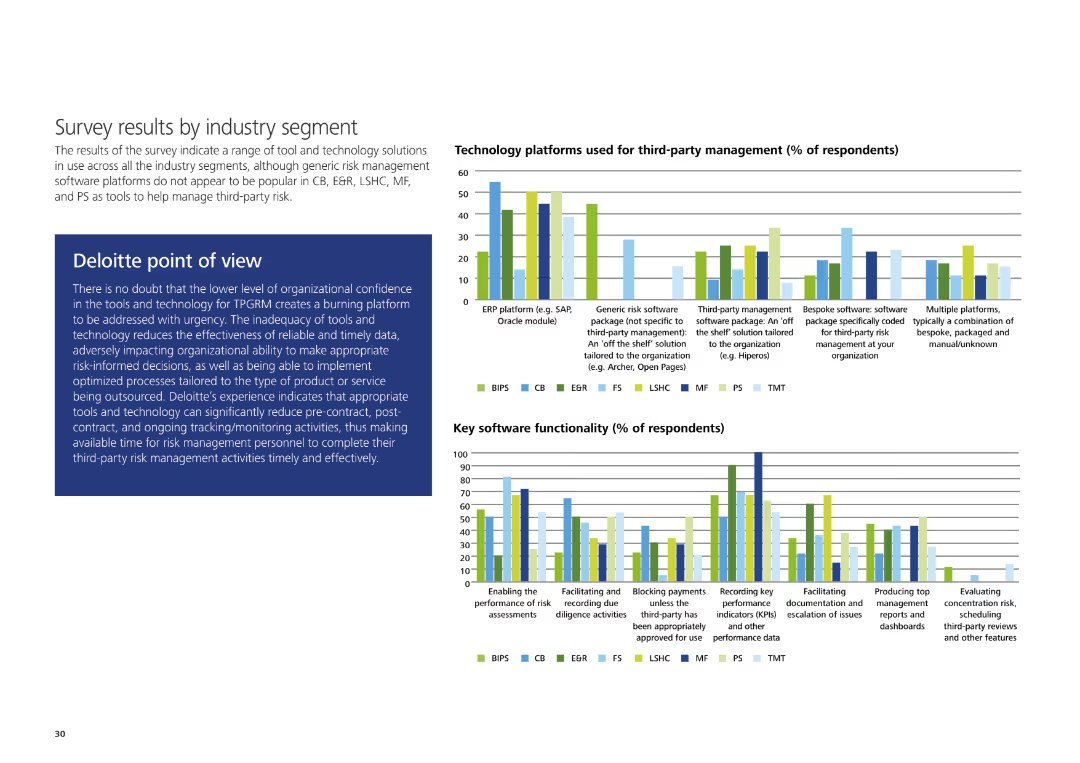
Column charts showing technology platforms used for third-party management and key software functionality by industry segment, with Deloitte's point of view.
Technology and Digital Transformation
Technology & Software
The slide discusses survey results on the usage of technology platforms and key software functionalities for third-party management, segmented by industry.
technology, platforms, third-party, software, industry segment, column chart
false
Technology and Digital Transformation
Technology & Software
Multiple Chart
Deloitte
Add to my slides
Remove from favorites
Diagram and pie charts comparing platform usage between China and the US
Market Analysis and Trends
Technology & Software
Highlights platform consolidation in China, with a significant share held by Tencent
Technology, Platform Usage, China, Tencent, Comparison
false
Market Analysis and Trends
Technology & Software
Multiple Chart
BCG
Add to my slides
Remove from favorites
This slide displays a technology portfolio applicable across the mining value chain. It uses icons and a curved line to represent the exploration to extraction process, flanked by images and text explaining the technology use at each stage.
Product and Service Analysis
Industrial & Manufacturing
The slide provides an overview of technology applications throughout the mining process, suitable for discussing product breadth and the value each technology brings at different stages.
Technology Portfolio, Mining, Value Chain, Applications, Product Breadth
false
Product and Service Analysis
Industrial & Manufacturing
Diagram
Morgan Stanley
Add to my slides
Remove from favorites
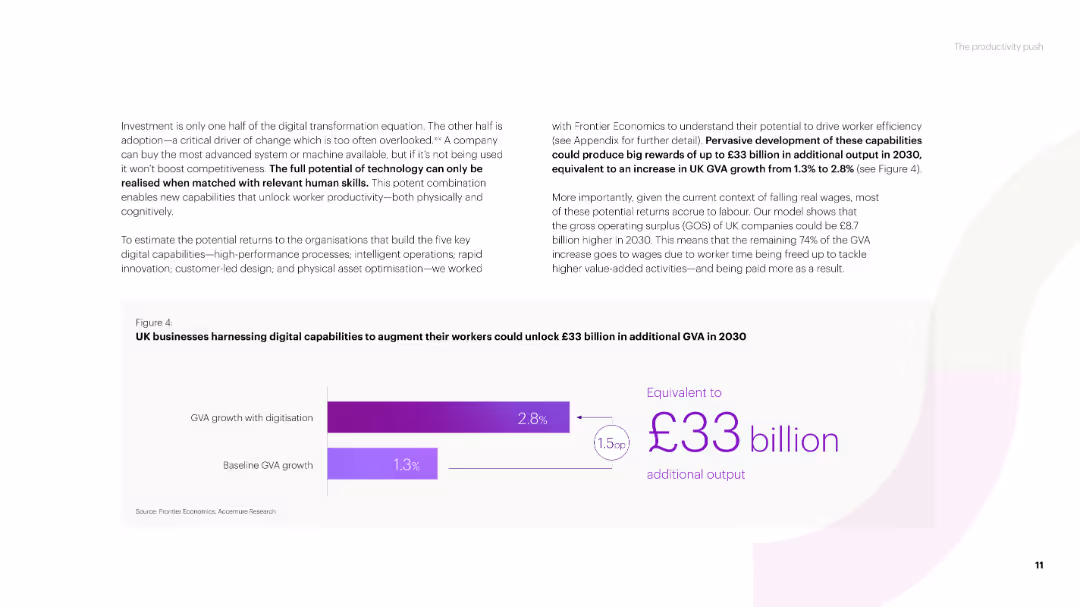
A text-heavy slide with a title and several paragraphs discussing the potential of technology for business growth. Includes a column chart showing GVA growth with digitization versus baseline GVA growth in the UK.
Strategic Planning
Technology & Software
The slide emphasizes the importance of digital capabilities for business productivity, projecting significant additional GVA growth for UK businesses by 2030 through the adoption of technology.
technology potential, digital capabilities, GVA growth, UK businesses, productivity
false
Strategic Planning
Technology & Software
Mixed Chart
Accenture
Add to my slides
Remove from favorites
A comprehensive matrix categorizes various technologies based on their industry applicability and technical maturity. The layout is structured with color-coded labels and momentum indicators. This detailed diagram slide uses shades of blue and black for a professional tech-focused theme.
Strategic Planning
Technology & Software
This slide prioritizes over forty individual technologies by their maturity, industry impact, and momentum, serving as a strategic planning tool for tech investments and innovation focus. It breaks down complex tech ecosystems into accessible visual information, which could be invaluable for executives and industry specialists in decision-making processes.
Technology, Prioritization, Matrix, Innovation, Strategy, Impact, Industry, Maturity, Momentum, Planning
true
Strategic Planning
Technology & Software
Single Chart
McKinsey
Add to my slides
Remove from favorites
Slide features three columns labeled "As-Is," "Blend," and "Best of Breed," detailing procurement technology strategies. Includes bullet points on benefits and trade-offs, and logos from various tech companies at the bottom.
Technology and Digital Transformation
Technology & Software
Discusses the evolution of procurement technology strategies across three models: full replacement, hybrid approach, and integration of best-in-class technology, emphasizing the transition from generic to specialized solutions.
Technology, Procurement, Integration, Evolution, Strategy
false
Technology and Digital Transformation
Technology & Software
Table
Kearney
Add to my slides
Remove from favorites
The slide contrasts two key aspects: 'Superior Technology' and 'Broad Product Offering' with bullet points and icons. There's also a sidebar detailing 'Superior Technology and Automation' with specific service features highlighted.
Technology and Digital Transformation
Financial Services
Spotlights the competitive edge in technology and product offerings, detailing the trading technology, broad market access, and cost-effective rates. The slide aims to convince the audience of the company's technological superiority and extensive market coverage.
Technology, Product Offering, Trading, Market Access, Cost-Effectiveness
false
Technology and Digital Transformation
Financial Services
Diagram
Goldman Sachs
Add to my slides
Remove from favorites
A line graph showing the percentage agreement over time (2013-2021) that technical progress is destroying lives, with trends per country.
Market Analysis and Trends
Technology & Software
This slide examines the growing concern about technology, indicating the percentage of people who agree that technology is harmful, from 2013 to 2021.
Technology, Progress, Concern, Trends, Countries
false
Market Analysis and Trends
Technology & Software
Mixed Chart
IPSOS
Add to my slides
Remove from favorites
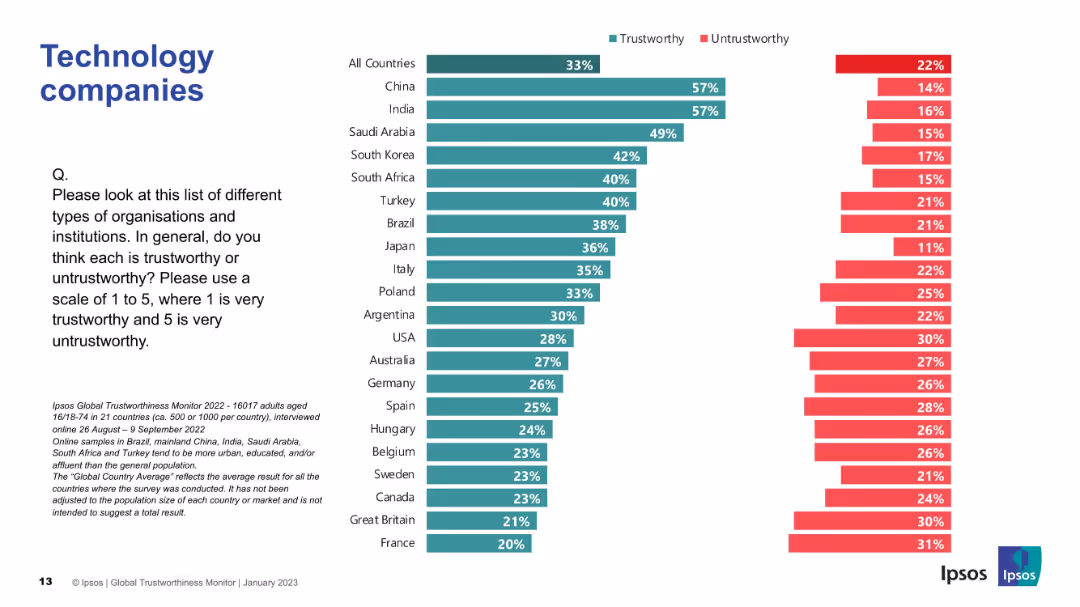
Bar graph with trust/untrust bars by country; consistent color scheme and layout as prior slides.
Market Analysis and Trends
Technology & Software
The chart ranks public trust in tech companies by country. China and India lead with highest trust ratings; France and Great Britain rank low.
technology, public trust, global survey, Ipsos, companies, perception, trustworthy, untrustworthy, country ranking
false
Market Analysis and Trends
Technology & Software
Mixed Chart
IPSOS
Add to my slides
Remove from favorites
Three circular diagrams, percentage figures, green theme
Technology and Digital Transformation
Technology & Software
Discusses readiness and impact of technology in business
Technology, readiness, business impact
false
Technology and Digital Transformation
Technology & Software
Multiple Chart
Deloitte
Add to my slides
Remove from favorites
This slide includes bullet points highlighting company achievements and a column chart depicting consistent revenue growth.
Industry Overview
Technology & Software
It offers a snapshot of a technology company’s market position and financial growth, probably for investor relations or strategic review.
Technology, Revenue Growth, Financial Services, Market Position, Client Retention, Users
false
Industry Overview
Technology & Software
Mixed Chart
Goldman Sachs
Add to my slides
Remove from favorites
The slide contains a timeline indicating the development and testing phases of new drilling technologies. It has arrows pointing to future milestones, suggesting ongoing progress. It is text-heavy with timelines stretching across several quarters.
Technology and Digital Transformation
Financial Services
It illustrates a timeline of the development and commercialization of new technologies. The content is specific to the stages of product testing and market release, useful for updating stakeholders on progress and future plans.
technology, roadmap, development, testing, commercialization, mining, COREVIBE™, MAGHAMMER™, Blast DOG™
false
Technology and Digital Transformation
Financial Services
Linear Flow
Morgan Stanley
Add to my slides
Remove from favorites
Two line graphs, one dashed, illustrate Series B & C funding and secondary market trends over time. There's a significant spike in secondary market data for 2017.
Investment Analysis
Technology & Software
The slide presents data on the sharp increase in secondary-market funding round sizes for technology in 2017, emphasizing the growth in mega rounds and key investments. Suitable for discussions on market shifts and investment strategies.
Technology, Secondary Market, Series B, Series C, Investment
false
Investment Analysis
Technology & Software
Multiple Chart
Oliver Wyman
Add to my slides
Remove from favorites
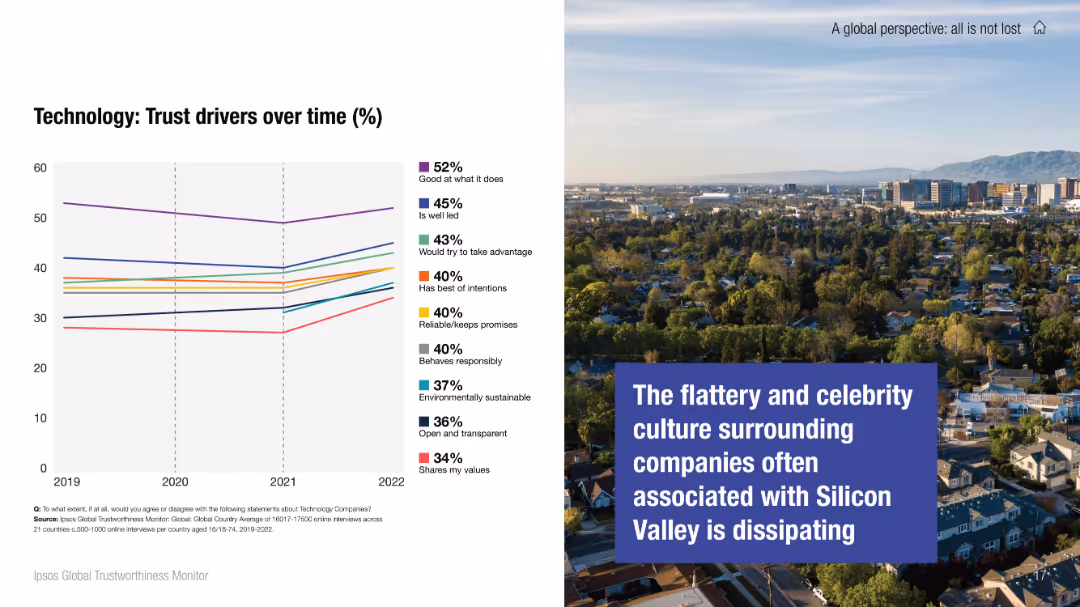
Left half shows a trust driver chart for technology sector; right side features an image with bold text on changing perception of Silicon Valley culture.
Market Analysis and Trends
Technology & Software
This slide tracks how public trust drivers for technology companies have changed over time, focusing on aspects like leadership and responsibility. A narrative image emphasizes the fading glamour around Silicon Valley, suggesting a cultural shift in how tech companies are viewed.
technology sector, trust perception, Silicon Valley, corporate behavior, trend analysis, public trust, values
false
Market Analysis and Trends
Technology & Software
Mixed Chart
IPSOS
Add to my slides
Remove from favorites
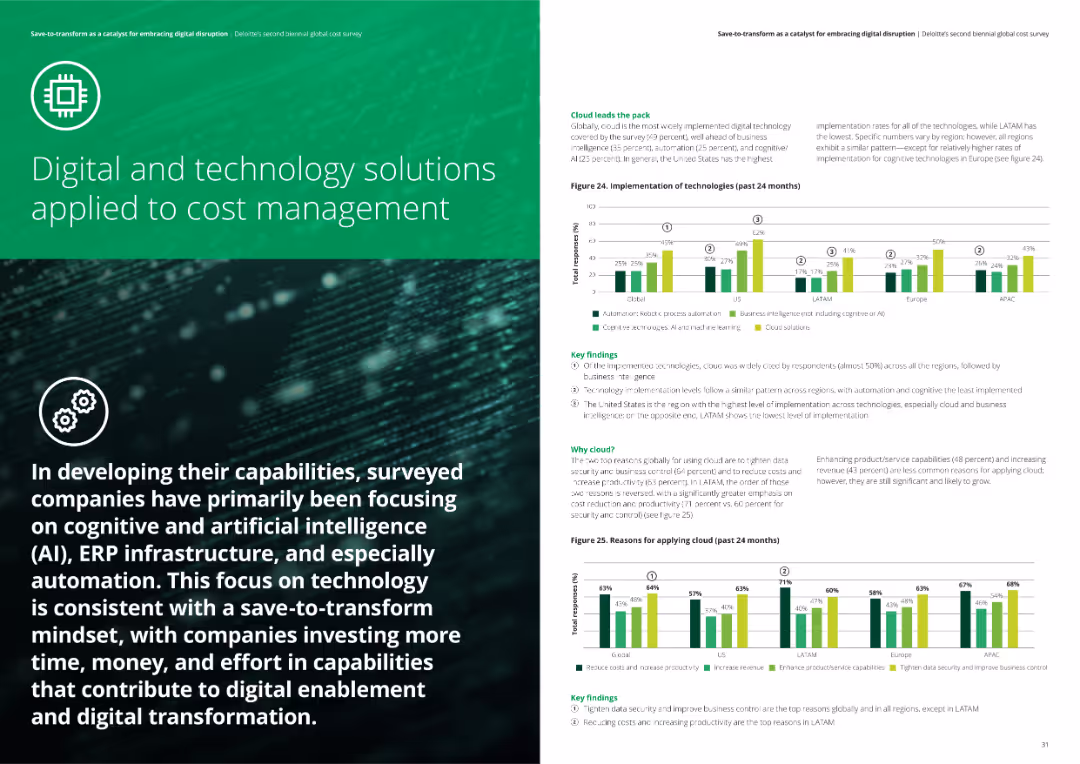
The slide has two column charts showing the implementation of technologies and reasons for applying cloud solutions over the past 24 months across different regions.
Technology and Digital Transformation
Financial Services
The slide focuses on the adoption of digital and technology solutions, particularly cloud solutions, cognitive and AI technologies, and their impact on cost management practices.
Technology solutions, cloud adoption, digital transformation, analysis, financial services
false
Technology and Digital Transformation
Financial Services
Multiple Chart
Deloitte
Add to my slides
Remove from favorites
The slide displays a column chart showing the progression of IT spend over four years, split into categories such as 'Core Infrastructure & Modernization', 'Risk and Information Security', and 'Business-Driven'. Adjacent to the chart is a list of bullet points elaborating on each category.
Financial Performance
Financial Services
Communicates Northern Trust's IT budget allocation, with an emphasis on foundational and business-driven applications. It provides financial insights into how resources are being distributed for client experience, risk management, and core infrastructure, intending to inform stakeholders of investment focuses and priorities.
Technology Spend, Infrastructure, Security, Business-Driven, CAGR
false
Financial Performance
Financial Services
Mixed Chart
Morgan Stanley
Add to my slides
Remove from favorites
A layered diagram slide, detailed with icons and labels. It presents a technology stack with an integrated model including Client Interaction, Orchestration, and Core Processing layers.
Technology and Digital Transformation
Technology & Software
Describes the structure of J.P.Morgan's payment business's technology stack and the components that enable their service offerings.
Technology Stack, Payments, J.P.Morgan, Integration, Engineering, Fintech Partnerships
false
Technology and Digital Transformation
Technology & Software
Table
JP Morgan
Add to my slides
Remove from favorites
Graphical layout with bar charts comparing technology in use and deployment across various domains.
Technology and Digital Transformation
Technology & Software
Slide depicts technology usage and deployment statistics, emphasizing the higher adoption rate of hybrid work technologies.
Technology, Statistics, Hybrid Work, Data Analysis
false
Technology and Digital Transformation
Technology & Software
Single Chart
EY
Add to my slides
Remove from favorites
The slide divides into four key strategy areas, each with corresponding icons and bulleted lists. The color scheme is consistent with the firm's branding.
Technology and Digital Transformation
Technology & Software
Discussing how technology strategy supports business priorities, this slide could be used for internal alignment and strategic communication.
technology strategy, business priorities, alignment, icons, digital transformation, JPMorgan
false
Technology and Digital Transformation
Technology & Software
Pillar
JP Morgan
Add to my slides
Remove from favorites
This slide is organized into four key areas of technological strategy, each represented by an icon and supported by bullet points detailing specific accomplishments and objectives. The use of color coding helps to differentiate between areas, and the clear layout aids in conveying complex information efficiently.
Technology and Digital Transformation
Technology & Software
Slide 1 outlines JPMorgan Chase & Co.'s ongoing execution of its technology strategy, highlighting advancements in product offerings, development capabilities, data insights, and cybersecurity measures.
Technology, Strategy, Product Development, Cybersecurity, Data Insights, AI/ML, Cloud Computing
false
Technology and Digital Transformation
Technology & Software
Header Horizontal
JP Morgan
Add to my slides
Remove from favorites
A bar chart displays the annual growth rate of technology subsectors, with color-coding to distinguish the top and bottom performers. Key technology subsectors are listed for context.
Investment Analysis
Technology & Software
The slide delves into the growth of annual deal values within technology subsectors, presenting a broad base of growth since 2013. It identifies specific areas with notable increases, such as AI and blockchain, and contrasts them with subsectors that have seen a decline, thereby offering a nuanced view of the sector's investment landscape.
technology subsectors, deal value growth, investment trends, AI, blockchain
false
Investment Analysis
Technology & Software
Single Chart
Oliver Wyman
Add to my slides
Remove from favorites
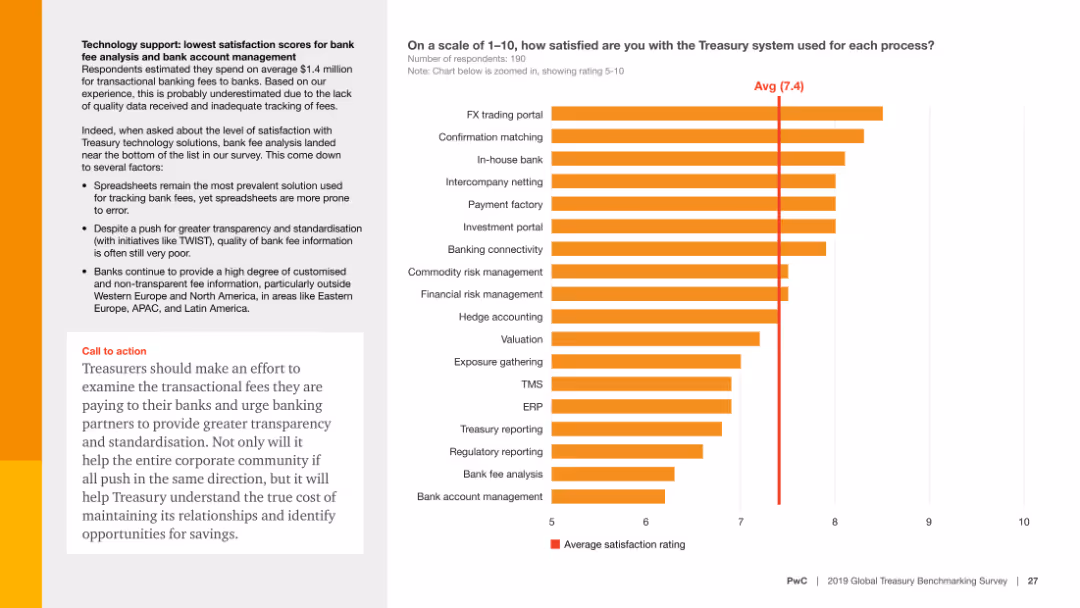
Features a column chart showing satisfaction scores for various Treasury processes. Text elaborates on the challenges with bank fee analysis and management.
Technology and Digital Transformation
Financial Services
Highlights the dissatisfaction with bank fee analysis and bank account management among treasurers, advocating for better transparency and standardized information.
Technology support, satisfaction, bank fees, transparency, standardization
false
Technology and Digital Transformation
Financial Services
Multiple Chart
PwC/Strategy&
Add to my slides
Remove from favorites
The slide includes a column chart showing satisfaction scores for different treasury processes and a text box with analysis and a call to action. The average satisfaction rating is highlighted.
Customer and Market Segmentation
Financial Services
The slide presents data on treasury satisfaction scores, highlighting low satisfaction in bank fee analysis and bank account management, and urges treasurers to push for greater transparency and standardization in their processes.
Technology support, satisfaction scores, treasury, bank fees, account management, financial services, transparency, standardization, customer feedback, survey
false
Customer and Market Segmentation
Financial Services
Mixed Chart
PwC/Strategy&
Add to my slides
Remove from favorites
Column charts with drawn lines illustrating the growth impact of combining technology and talent post-pandemic, with a focus on competitive advantage.
Technology and Digital Transformation
Technology & Software
Discusses how a strong digital core and talent management contribute to rapid capability development and competitive advantage post-pandemic.
technology, talent management, post-pandemic, competitive advantage, digital core, growth impact, capability development
false
Technology and Digital Transformation
Technology & Software
Multiple Chart
Accenture
Add to my slides
Remove from favorites
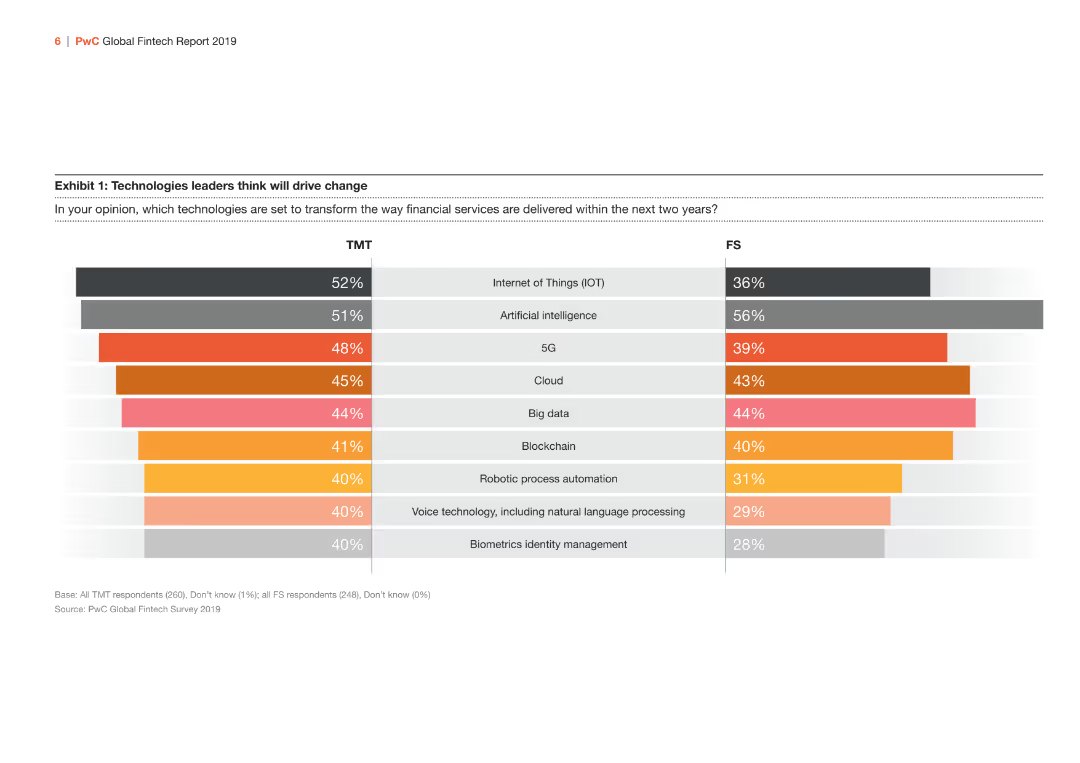
The slide has a bar chart comparing TMT and FS sectors' views on transformative technologies. Colors used are shades of orange and gray.
Market Analysis and Trends
Technology & Software
Comparison of TMT and FS sector leaders' opinions on which technologies will transform financial services in the next two years, including IoT, AI, and 5G.
technology, TMT, FS, transformative, fintech
false
Market Analysis and Trends
Technology & Software
Multiple Chart
PwC/Strategy&
Add to my slides
Remove from favorites
Featuring a straightforward layout with a bar chart, this slide examines the financial impact of delayed technology adoption on business agility and growth. It shows the percentage of revenue change against the backdrop of technology investment in different years, providing a stark comparison of business performance with and without adequate tech support.
Technology and Digital Transformation
Technology & Software
This slide illustrates the detrimental financial effects of postponing technological advancements within organizations. It compares revenue growth and tech debt levels, providing a clear argument for why timely technological updates are essential for maintaining competitiveness and fostering growth in today's digital economy.
technology transformation, delayed investment, financial impact, tech debt, competitiveness, column chart
false
Technology and Digital Transformation
Technology & Software
Mixed Chart
Accenture
Add to my slides
Remove from favorites
This title slide showcases a sophisticated design with geometric cloud and edge computing icons over a dark blue background, emphasizing the topic of cloud and edge computing for the year 2022.
Technology and Digital Transformation
Technology & Software
Introducing McKinsey's 2022 Technology Trends, the slide is designed to set the stage for a detailed discussion on cloud and edge computing, highlighting it as a significant subject in the current technological landscape.
Technology Trends, Cloud Computing, Edge Computing, 2022
false
Technology and Digital Transformation
Technology & Software
Title
McKinsey
Add to my slides
Remove from favorites
The slide juxtaposes seven technology icons against black space, with a text section on the left. The visual is sleek and modern, utilizing monochrome icons that are indicative of the tech industry. The composition is clean, with a focus on both the graphical elements and the informational text.
Technology and Digital Transformation
Technology & Software
This slide breaks down seven cross-industry and three industry-specific technology trends based on prioritized technologies, offering a snapshot of critical areas for future development. It's a concise visual and textual depiction that can serve as a discussion starter in presentations aimed at exploring the intersection of these technologies with various industry needs.
Technology, Trends, Future, Development, Industry, Prioritization, Cross-Industry, Specific, Snapshot
false
Technology and Digital Transformation
Technology & Software
Table
McKinsey
Add to my slides
Remove from favorites
Features a heat map-like graphic illustrating the varied impact of tech trends across sectors. The design is data-centric, color-coded for ease of interpretation.
Technology and Digital Transformation
Technology & Software
This data-rich slide compares the influence of various technology trends across multiple sectors, essential for industry analysis sessions where strategic decisions are based on tech trend impacts. It visually communicates where businesses should focus their technological advancements and R&D efforts.
Technology Trends, Impact, Heat Map, Sectors, Analysis, Data Visualization, R&D, Strategic Focus
false
Technology and Digital Transformation
Technology & Software
Single Chart
McKinsey
Add to my slides
Remove from favorites
The slide is text-heavy, presenting significant statistical insights related to technological impacts up to 2050. It features percentages and predictions, with a clean white and black contrast design. Minimal use of blue adds a subtle touch of color. The layout is straightforward, focusing the viewer's attention on the data provided.
Technology and Digital Transformation
Technology & Software
This slide provides statistical insights into how technology trends could reshape markets and industries over the coming decades, focusing on automation, connectivity, infrastructure, and computing advancements. The concise, fact-rich content is designed to inform strategic decision-making in technology investments and policy planning, suitable for stakeholders looking for a data-centric perspective on the future of tech in global markets.
Technology, Trends, Market Reshaping, Industry, Future, Automation, Connectivity, Data, Statistics
false
Technology and Digital Transformation
Technology & Software
Graphic
McKinsey
Add to my slides
Remove from favorites
Cover slide with title, McKinsey logo, and abstract tech design elements, featuring a tablet displaying graphs.
Industry Overview
Technology & Software
Title slide for a presentation on technology trends, specifically focusing on the industrialization of machine learning.
Technology trends, McKinsey, machine learning, title slide
false
Industry Overview
Technology & Software
Title
McKinsey
Add to my slides
Remove from favorites
A matrix layout correlates technology trends with their predictability and impact on the mineral industry. Includes icons and labels for various technologies like AI and 3D printing.
Strategic Planning
Technology & Software
Analyzes potential future technologies and their impacts on mineral demand, useful for strategic planning in technology investments and market forecasting.
technology trends, mineral industry, impact analysis, predictability, strategic planning, 3D printing, AI
false
Strategic Planning
Technology & Software
Mixed Chart
McKinsey
Add to my slides
Remove from favorites
The slide presents a silhouette of a person's head with a digital overlay, alongside vertical lines converging into a bright focal point. The background is dark with a blue tint, accentuating the digital motif.
Industry Overview
Technology & Software
The title slide for McKinsey's technology trends report, providing a thematic introduction to discussions on evolving tech trends in 2022.
Technology, Trends, Outlook, 2022, Report, Digital, Innovation, Future, McKinsey
true
Industry Overview
Technology & Software
Title
McKinsey
Add to my slides
Remove from favorites
Features a prominent image of a person using VR equipment, with the report's title and release date.
Technology and Digital Transformation
Technology & Software
Serves as the introductory slide for McKinsey's Technology Trends Outlook 2022, with a focus on immersive-reality technologies.
technology trends, outlook, immersive reality, virtual reality, McKinsey & Company
false
Technology and Digital Transformation
Technology & Software
Title
McKinsey
Add to my slides
Remove from favorites
Features a horizontal bar graph in purple shades, analyzing the impact of technology on various underwriting activities.
Technology and Digital Transformation
Financial Services
Assesses how technological changes have impacted underwriting performance across several dimensions.
technology, underwriting, performance, impact, analysis
false
Technology and Digital Transformation
Financial Services
Single Chart
Accenture
Add to my slides
Remove from favorites
Slide features bar graphs comparing three survey years across various tech issues impacting underwriters' workload. Purple theme, vertical bars.
Market Analysis and Trends
Financial Services
Analyzes the impact of technological challenges on underwriters' workload over time, highlighting areas such as process integration and data issues.
technology, underwriting, workload, integration, survey, data, performance, training
false
Market Analysis and Trends
Financial Services
Mixed Chart
Accenture
Add to my slides
Remove from favorites
Detailed horizontal bar chart showcasing the percentage of respondents planning major technology upgrades in areas like ERP and supply chain analytics.
Technology and Digital Transformation
Retail & E-commerce
Focuses on the growing emphasis on technology upgrades in inventory and warehouse management, crucial for improving operational efficiency in businesses.
technology upgrades, inventory management, ERP, warehouse management, operational efficiency, business, analytics, supply chain
false
Technology and Digital Transformation
Retail & E-commerce
Mixed Chart
Deloitte
Add to my slides
Remove from favorites
Contains pie charts and horizontal bar graphs in purple and gray, reflecting technology's impact on underwriters' workload.
Human Resources and Talent Management
Financial Services
Evaluates how technological advancements have affected the workload of underwriters over the years.
technology, workload, underwriters, pie chart, bar graph
false
Human Resources and Talent Management
Financial Services
Multiple Chart
Accenture
Add to my slides
Remove from favorites
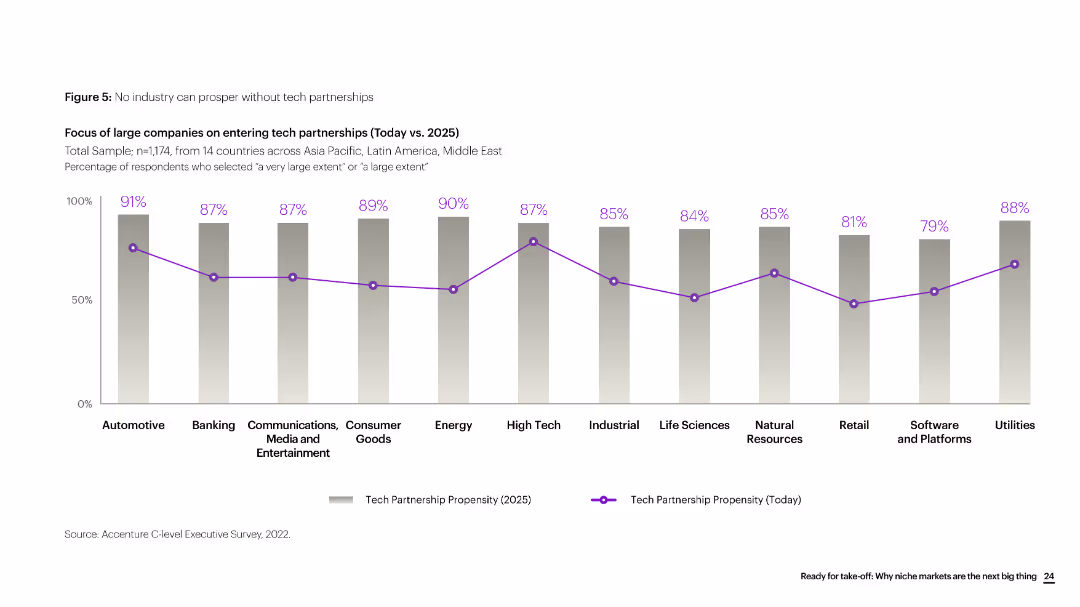
Column chart showing the percentage of companies in various industries with a propensity for tech partnerships today vs. in 2025.
Market Analysis and Trends
Technology & Software
Analysis of companies' focus on tech partnerships across different industries, comparing current data with future predictions for 2025.
Tech partnerships, industries, trends, analysis, 2025, comparison, future predictions, technology, market analysis, survey
false
Market Analysis and Trends
Technology & Software
Single Chart
Accenture
Add to my slides
Remove from favorites
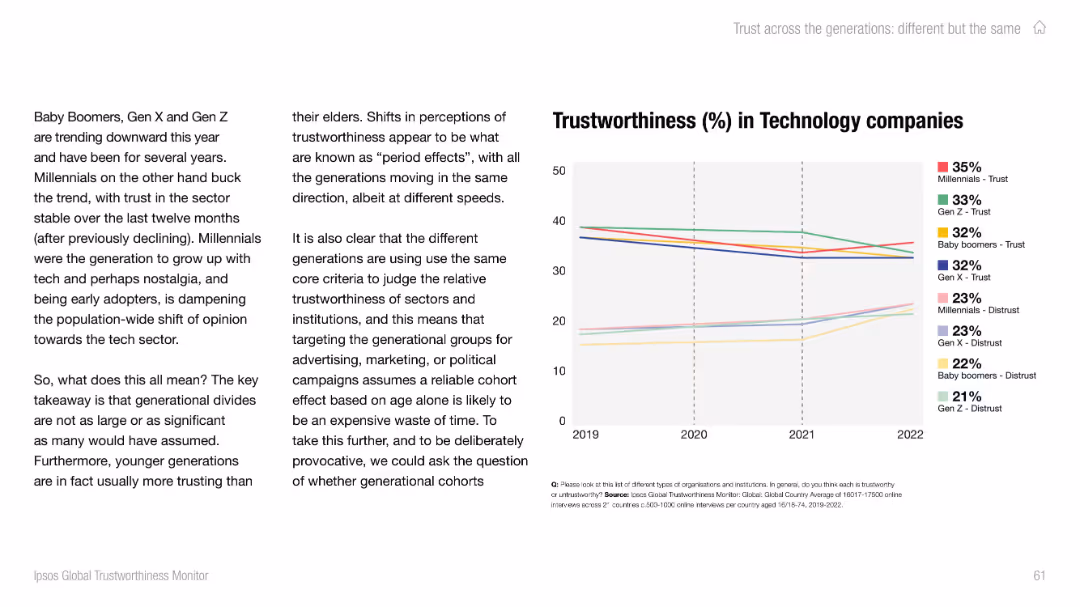
Two columns: text explanation and line chart showing stable or declining trust across generations in tech sector.
Market Analysis and Trends
Technology & Software
This slide notes declining trust in technology companies across most generations except Millennials, whose trust levels remained stable. It questions assumptions about generational divides in perception.
tech sector, trust, generational trends, Millennials, public opinion, Ipsos, period effects, marketing strategy, cohort behavior
false
Market Analysis and Trends
Technology & Software
Mixed Chart
IPSOS
Add to my slides
Remove from favorites
Featuring a line and bar graph, this slide compares the number of venture investing deals between technology and other sectors, noting the decline and its relation to the sector's deal share.
Investment Analysis
Technology & Software
Analyzing the venture market, this slide presents the overall decline in the number of deals, particularly within the technology sector, while also highlighting that the sector's share of deals remains within historical norms. It suggests that this decline does not impact the market's overall health and provides insights into investment trends and preferences.
tech sector, venture deals, market trends, investment analysis, sector comparison
false
Investment Analysis
Technology & Software
Mixed Chart
Oliver Wyman
Add to my slides
Remove from favorites
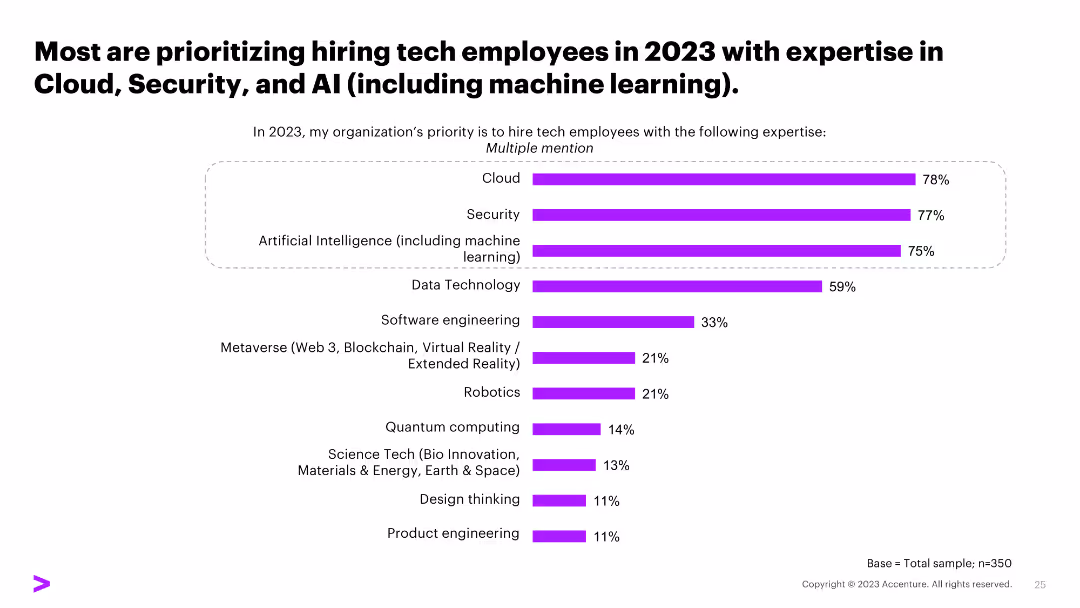
A column chart listing tech skills prioritized for hiring in 2023, including Cloud, Security, AI, and others, with percentage values for each skill.
Human Resources and Talent Management
Professional Services
The slide indicates the tech skills that organizations are prioritizing for hiring in 2023, focusing on Cloud, Security, and AI, essential for workforce planning.
tech skills, Cloud, Security, AI, hiring priorities
false
Human Resources and Talent Management
Professional Services
Single Chart
Accenture
Add to my slides
Remove from favorites
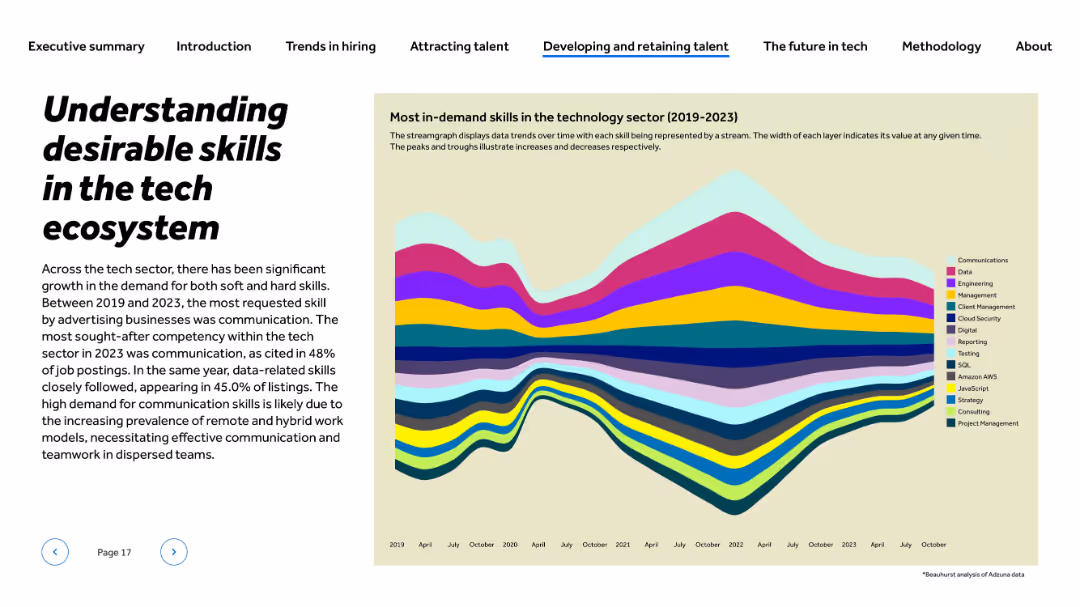
Title on left; streamgraph on right with color-coded skills across timeline (2019–2023)
Human Resources and Talent Management
Technology & Software
The slide explores the demand for various skills in tech from 2019 to 2023. Communication and data skills top the list in 2023, appearing in nearly half of all postings. The streamgraph shows how different competencies like cloud security, JavaScript, and strategy fluctuated over time, reflecting evolving needs in hybrid work and digital operations.
tech skills, communication, data, demand trends, hybrid work, digital roles, streamgraph, workforce, hiring needs
false
Human Resources and Talent Management
Technology & Software
Mixed Chart
Barclays
Add to my slides
Remove from favorites
A column chart showing confidence levels in securing tech skills from NYC's talent pool, with categories "Very confident," "Confident," and "Somewhat confident."
Human Resources and Talent Management
Professional Services
The slide presents confidence levels among organizations about securing tech skills in 2023, illustrating high confidence in the NYC talent pool.
tech skills, talent pool, confidence, survey, NYC
false
Human Resources and Talent Management
Professional Services
Mixed Chart
Accenture
Add to my slides
Remove from favorites
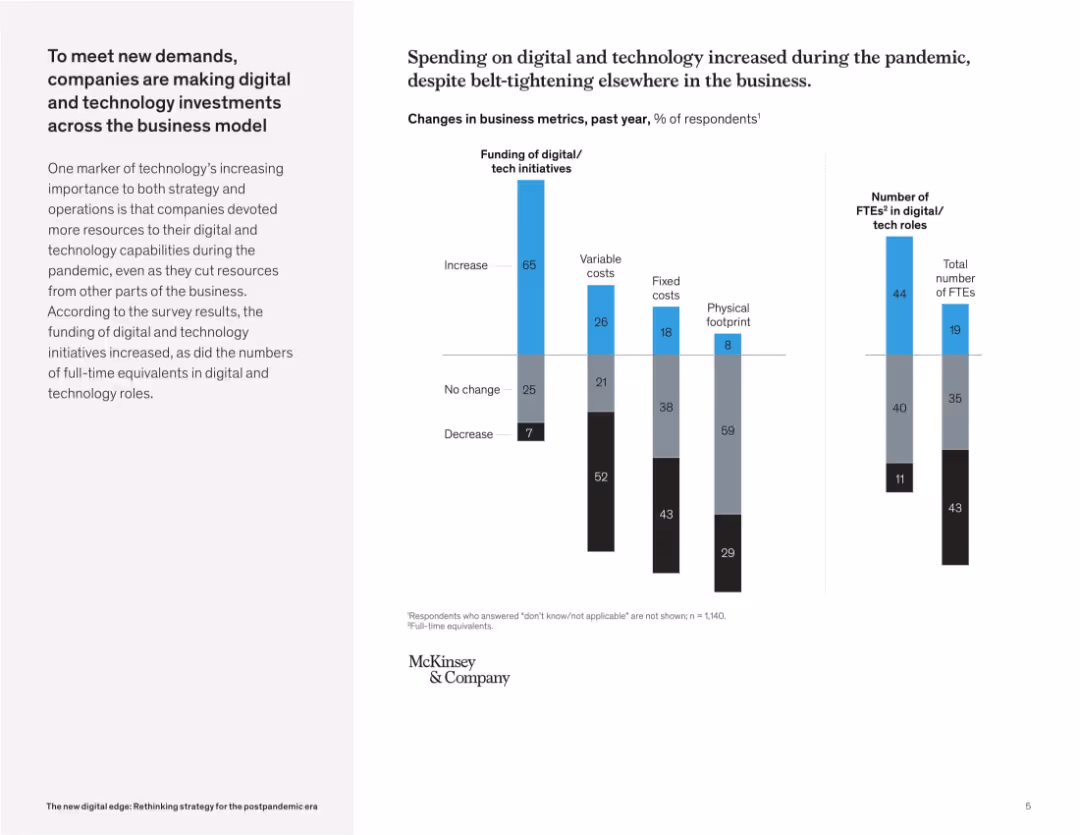
Dual-panel chart: left side shows business metric changes (funding, costs); right side compares FTEs in digital roles. Minimalist design with light grids.
Financial Performance
Technology & Software
The slide details how businesses increased spending on digital initiatives and staff during the pandemic, while cutting costs in other areas. It contrasts changes in funding and fixed/variable costs, and highlights growth in tech-related full-time roles.
tech spending, FTE growth, digital investment, pandemic response, financial allocation, cost restructuring, digital workforce
false
Financial Performance
Technology & Software
Mixed Chart
McKinsey
Add to my slides
Remove from favorites
The slide displays a diagram of the Ipsos tech stack, showing different service layers like access to respondents, surveys, and analysis, integrated with various platforms.
Technology and Digital Transformation
Technology & Software
It explains the new common tech stack for Ipsos services, detailing the integration of various digital tools and platforms to streamline service delivery.
tech stack, integration, Ipsos, services, platforms
false
Technology and Digital Transformation
Technology & Software
Diagram
IPSOS
Add to my slides
Remove from favorites
The slide features a 3D block diagram representing the common tech stack for IPSOS services, with labels indicating different product elements and shared platform elements.
Technology and Digital Transformation
Technology & Software
The slide describes the common technology stack used by IPSOS for various services, highlighting the shared platform elements and unique product elements like SIMSTORE and Knowledge Panel.
Tech stack, IPSOS, services, platform, elements, SIMSTORE, Knowledge Panel, digital, common, products
false
Technology and Digital Transformation
Technology & Software
Diagram
IPSOS
Add to my slides
Remove from favorites
Comprises percentage tables summarizing executive views on technology strategies. The design is structured and uses purple shades for visual emphasis.
Strategic Planning
Technology & Software
Outlines the significance and maturity of various tech strategies like AI, Cloud Integration, and Cybersecurity in organizational transformation.
tech strategy, digital transformation, AI, cybersecurity
false
Strategic Planning
Technology & Software
Table
Accenture
Add to my slides
Remove from favorites
White background with purple column charts showing tech hiring trends
Human Resources and Talent Management
Technology & Software
The slide discusses tech hiring trends for 2023, focusing on demand and changes in degree requirements
Tech Talent, Hiring Trends, Workforce, Degree Requirements, Restructuring
false
Human Resources and Talent Management
Technology & Software
Multiple Chart
Accenture
Add to my slides
Remove from favorites
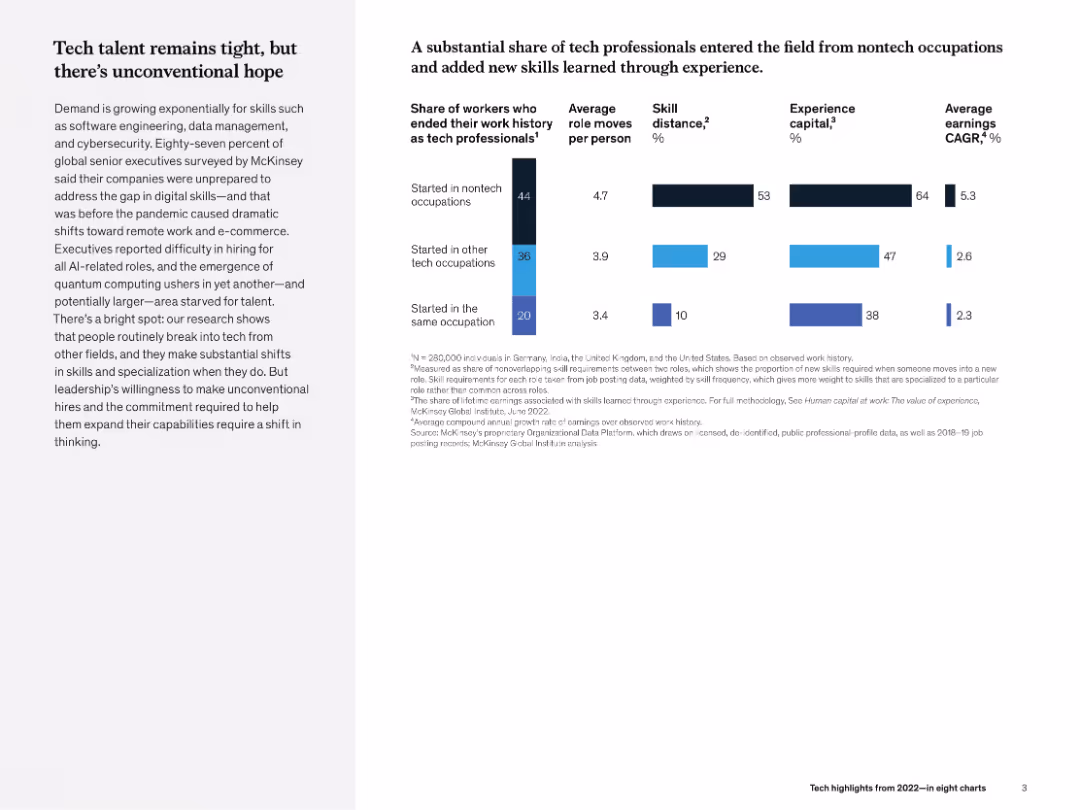
Two-part layout: left column of narrative text; right-side bar charts comparing nontech vs. tech transitions and skill growth metrics.
Human Resources and Talent Management
Technology & Software
This slide discusses how non-tech professionals are entering tech roles and gaining skills on the job. Charts show differences in role changes, skill distance, experience capital, and earnings growth based on occupational origin.
tech talent, nontech to tech, experience capital, skill growth, career mobility, McKinsey, hiring
false
Human Resources and Talent Management
Technology & Software
Multiple Chart
McKinsey
Add to my slides
Remove from favorites
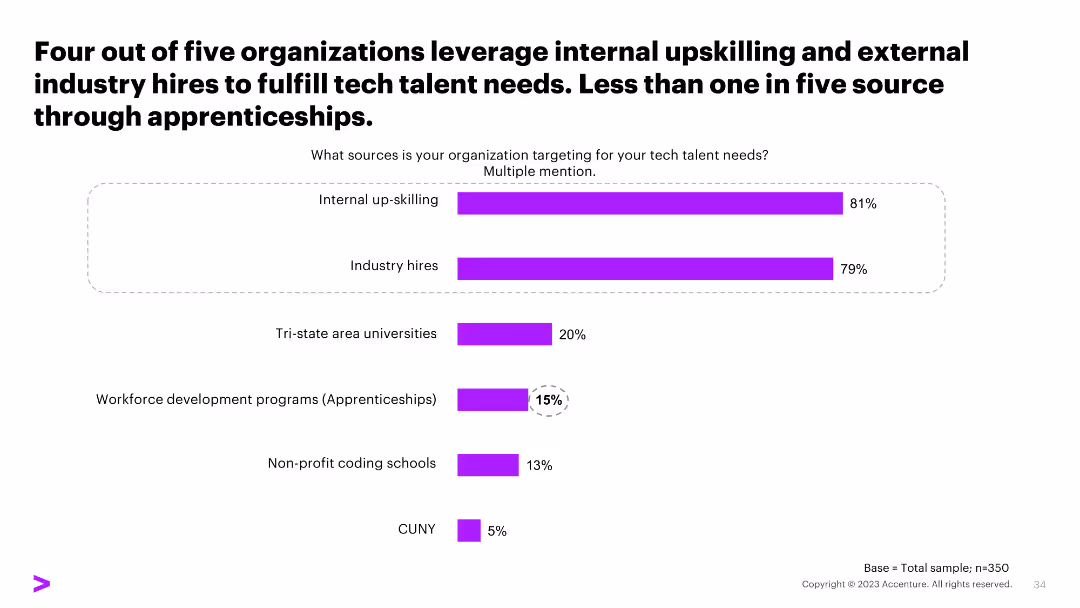
A column chart showing sources organizations target for tech talent, including internal upskilling, industry hires, and apprenticeships, with percentage values.
Human Resources and Talent Management
Professional Services
The slide illustrates the sources organizations use to fulfill tech talent needs, highlighting the importance of internal upskilling and industry hires over apprenticeships.
tech talent sources, internal upskilling, industry hires, apprenticeships
false
Human Resources and Talent Management
Professional Services
Single Chart
Accenture
Add to my slides
Remove from favorites
The slide has a large column chart comparing accumulated demand versus supply from 2020-2030 for tech professionals, and a smaller column chart showing the gap. It features a large photo of a smiling woman on the left.
Human Resources and Talent Management
Technology & Software
Discusses the expected demand and supply for tech professionals, emphasizing the significant gap by 2030. Useful for discussions on workforce planning in technology sectors.
tech talent, workforce, technology, education, gap
false
Human Resources and Talent Management
Technology & Software
Single Chart
McKinsey
Add to my slides
Remove from favorites
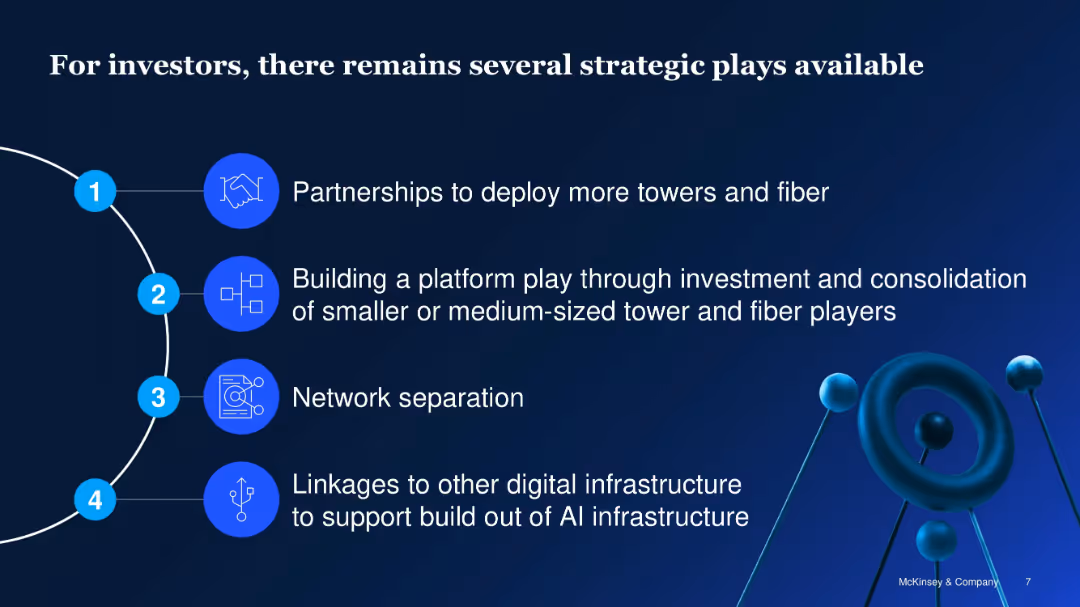
Vertical list with icons and numbered segments; clean blue design
Investment Analysis
Telecommunications
Identifies four strategic opportunities for telecom infrastructure investors: partnerships, platform plays, network separation, and integration with AI infrastructure to enhance scalability and ROI.
telecom investment, infrastructure, strategic plays, fiber, AI, partnerships, platform consolidation
false
Investment Analysis
Telecommunications
Vertical Flow
McKinsey
Add to my slides
Remove from favorites
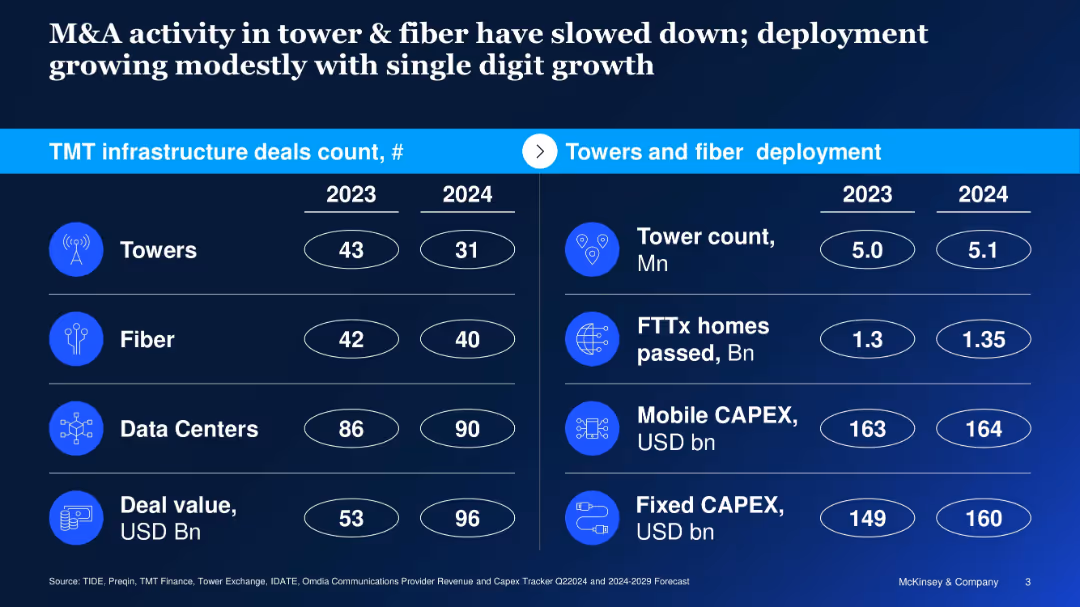
Split-table layout with deal counts on left and deployment metrics on right; icons used
Mergers and Acquisitions
Telecommunications
Reports on declining M&A activity in towers and fiber between 2023–2024, despite modest infrastructure growth; contrasts deal count and value with operational metrics like CAPEX and homes passed.
telecom M&A, towers, fiber, deployment, capex, infrastructure, 2024 outlook, deal value
false
Mergers and Acquisitions
Telecommunications
Table
McKinsey
Add to my slides
Remove from favorites
A slide with two sections identifying industries that could be most affected by space technology trends, with icons for visual emphasis.
Technology and Digital Transformation
Telecommunications
Identifies telecommunications and aerospace and defense as key industries affected by space tech, and explores emerging use cases across various sectors.
telecommunications, aerospace, defense, industry impact, space technology use cases
false
Technology and Digital Transformation
Telecommunications
Boxed
McKinsey
Add to my slides
Remove from favorites
Features a vertical bar chart comparing potential business and societal impacts with a detailed legend and value breakdowns. Visual elements are well-organized for clear data presentation.
Market Analysis and Trends
Telecommunications
Analyzes the potential $2 trillion value from digitalization in telecommunications, detailing impacts on different digital themes and societal benefits.
Telecommunications, Digitalization, Societal Impact, Business Value, Emissions Reduction
false
Market Analysis and Trends
Telecommunications
Mixed Chart
Accenture
Add to my slides
Remove from favorites
This slide presents a bar chart and a stacked area chart. The color palette is purple and gray, showing statistics on the nbn™ network's reach and data downloads in Australia.
Industry Overview
Telecommunications
The slide depicts the growth in the nbn™ network's home broadband plans and data downloads, indicating the network's significant role in Australia's internet connectivity.
Telecommunications, Internet, nbn™, Australia, Data Downloads, Home Broadband, Connectivity, Growth, Market Share, Network
false
Industry Overview
Telecommunications
Multiple Chart
Accenture
Add to my slides
Remove from favorites
Features column charts, icons, and illustrations depicting the telecommunications industry's growth. Includes charts on internet speeds and telecommunications gross output.
Market Analysis and Trends
Telecommunications
Discusses advancements in the Philippine telecommunications industry, including increased internet speeds and mobile usage.
telecommunications, Philippines, internet, growth, output
false
Market Analysis and Trends
Telecommunications
Mixed Chart
Deloitte
Add to my slides
Remove from favorites
This visually appealing slide features an image of three individuals using a tablet, symbolizing the collaborative and innovative approach required in the telecommunications industry. The caption underscores the urgency of adopting advanced technologies to remain competitive.
Technology and Digital Transformation
Telecommunications
The slide conveys the critical nature of technological adoption in the telecommunications sector. It highlights how continuous innovation and collaborative efforts are vital for adapting to market changes and improving business targets such as revenue growth and operational efficiency. This presentation is ideal for discussions on the strategic importance of technology in sustaining industry competitiveness.
telecommunications, technology adoption, innovation, competitive, collaboration, market adaptation
false
Technology and Digital Transformation
Telecommunications
Mixed Chart
Accenture
Add to my slides
Remove from favorites
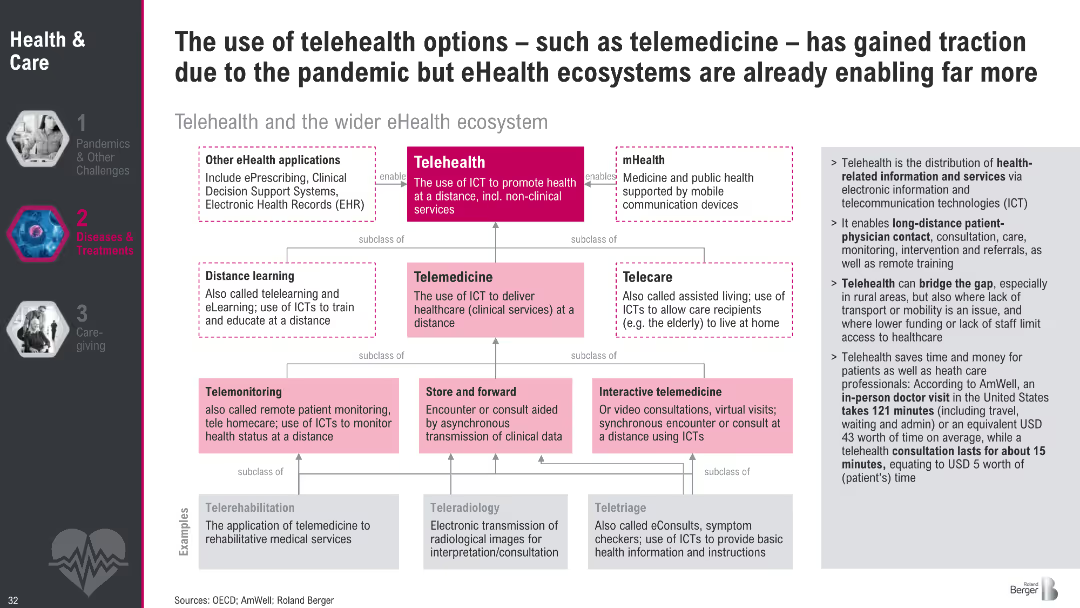
Hierarchical flowchart of telehealth ecosystem with examples and definitions; right-side explanation box
Technology and Digital Transformation
Healthcare & Pharmaceuticals
This slide outlines the expanding scope of telehealth beyond telemedicine, into a broader eHealth ecosystem including mHealth, telecare, and digital health apps. It underscores time and cost savings and increasing adoption.
telehealth, telemedicine, eHealth, digital health, ICT, remote care, pandemic, healthcare innovation, virtual health
false
Technology and Digital Transformation
Healthcare & Pharmaceuticals
Diagram
Roland Berger
Add to my slides
Remove from favorites
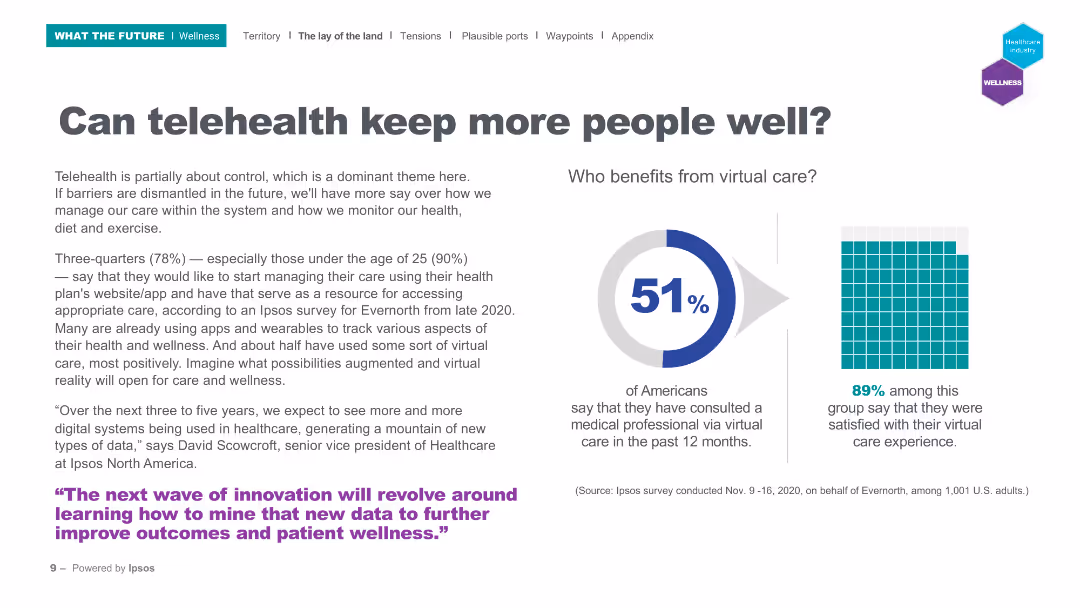
The slide includes a pie chart showing the percentage of Americans who have used virtual care and a grid chart on satisfaction with virtual care.
Technology and Digital Transformation
Healthcare & Pharmaceuticals
This slide discusses the adoption of telehealth, with 51% of Americans having used virtual care and 89% of those users being satisfied. It emphasizes the potential of telehealth to improve patient wellness.
Telehealth, virtual care, patient satisfaction, digital health, wellness
false
Technology and Digital Transformation
Healthcare & Pharmaceuticals
Mixed Chart
IPSOS
Add to my slides
Remove from favorites
Features a central circular diagram with Telemedicine at the core, surrounded by four connected circles representing different sectors. The slide uses a clean and simple design with blue and grey colors.
Market Analysis and Trends
Healthcare & Pharmaceuticals
The slide discusses the rapid expansion and commercial interest in Telemedicine platforms during the COVID-19 pandemic, highlighting partnerships and market consolidation as key trends.
Telemedicine, COVID-19, Expansion, Partnerships, Market Consolidation, Healthcare, Platforms, Commercial Interest, Trends, Land Grab
false
Market Analysis and Trends
Healthcare & Pharmaceuticals
Mixed Chart
Bain
Add to my slides
Remove from favorites
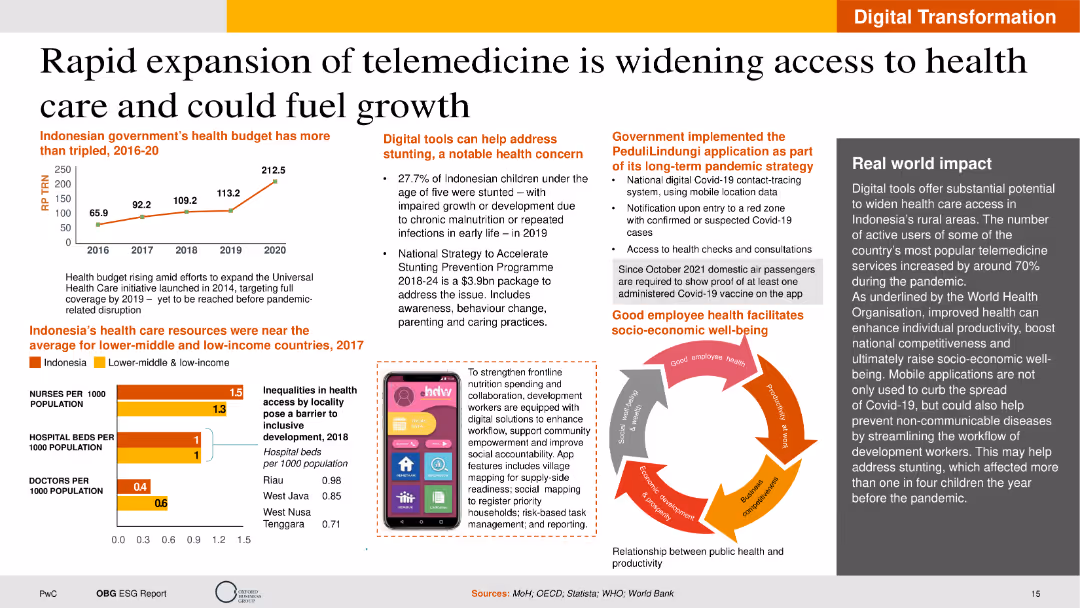
The slide features text sections on telemedicine growth, a line chart of the health budget, and an infographic on healthcare resources. The layout is visually engaging with a balanced mix of text and graphics.
Technology and Digital Transformation
Healthcare & Pharmaceuticals
This slide discusses the growth of telemedicine in Indonesia, focusing on healthcare access improvement, budget increases, and digital tools to address health concerns. It provides insights into the potential benefits of telemedicine for socio-economic development.
Telemedicine, Healthcare, Digital Tools, Indonesia, Growth
false
Technology and Digital Transformation
Healthcare & Pharmaceuticals
Multiple Chart
PwC/Strategy&
Add to my slides
Remove from favorites
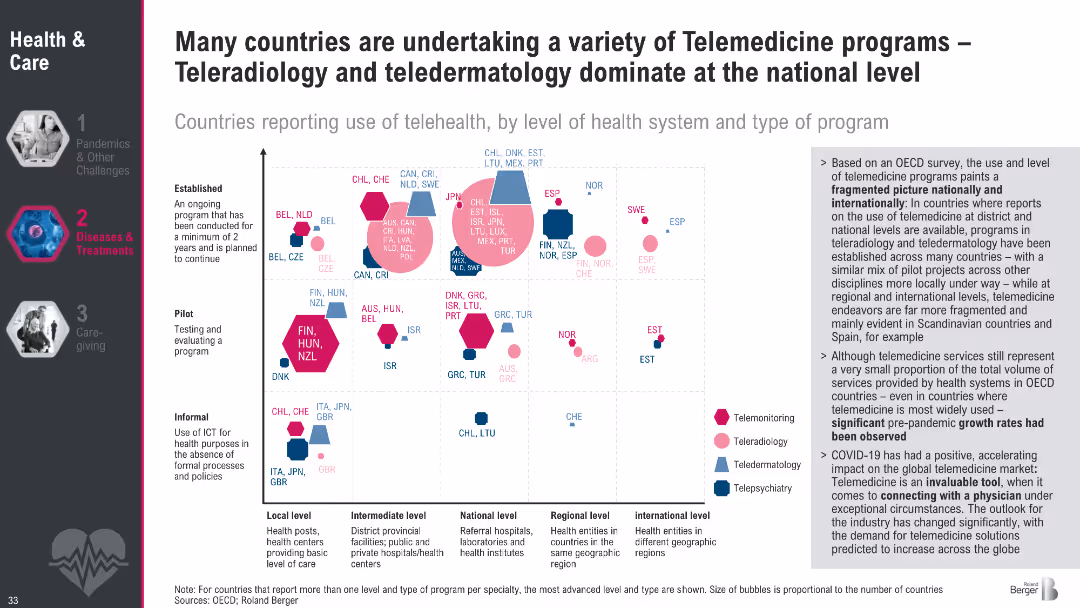
Bubble chart categorizing countries by level and type of telemedicine program; colored by specialization
Competitive Landscape
Healthcare & Pharmaceuticals
This slide analyzes global adoption of telemedicine programs, showing dominance of teleradiology and teledermatology in national systems. It reveals a fragmented landscape with variable maturity across countries and regions.
telemedicine, teleradiology, healthcare programs, OECD, global health policy, digital health, teledermatology, remote care
false
Competitive Landscape
Healthcare & Pharmaceuticals
Mixed Chart
Roland Berger
Add to my slides
Remove from favorites
The slide features charts and graphs on performance metrics, quality & security, and automation, illustrating improvements in coding hours, reduction in incidents, and increased automation.
Performance Metrics and KPIs
Technology & Software
This slide highlights the impact of tool chain telemetry on improving coding output, quality, and market delivery time, with specific metrics and visualizations.
telemetry, coding output, quality, security, automation, performance metrics, KPIs, coding hours, incidents reduction, market delivery
false
Performance Metrics and KPIs
Technology & Software
Multiple Chart
Credit Suisse
Add to my slides
Remove from favorites
Column and bar charts on the slide: the first shows teleworking adoption rates among DC Metro area workforce; the second details the percentage of various types of commuters who telework, each category presented with a different shade of green.
Technology and Digital Transformation
Transportation & Logistics
Analyzes teleworking trends in the DC Metro area and its adoption across different commuting modes. Highlights the integration of digital work options with public transit. Useful for studies on work habits and transport planning.
telework, workforce trends, DC Metro, public transit, digital transformation
false
Technology and Digital Transformation
Transportation & Logistics
Multiple Chart
BCG
Add to my slides
Remove from favorites
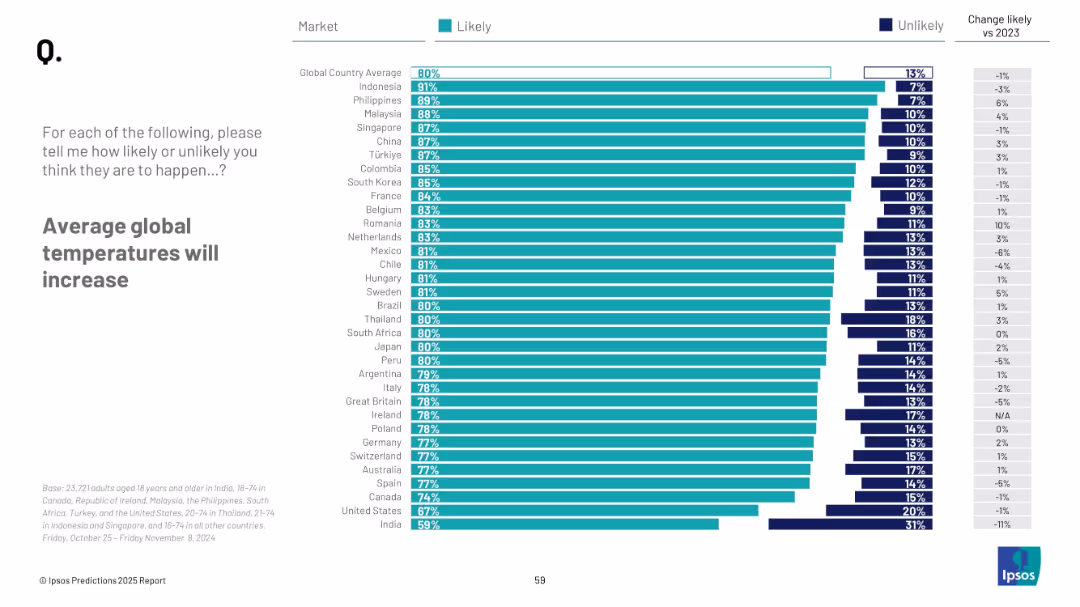
Horizontal bar chart with teal bars per country; ordered from highest to lowest; change from 2023 shown on right
Market Analysis and Trends
Environmental Services & Sustainability
This slide shows country-wise belief in the likelihood of rising average global temperatures. It emphasizes high consensus in most countries and displays comparative differences between regions alongside past year data.
temperature rise, climate change, environment, global warming, survey, public opinion, Ipsos
false
Market Analysis and Trends
Environmental Services & Sustainability
Mixed Chart
IPSOS
Add to my slides
Remove from favorites
Features icons and descriptive boxes outlining wider contributions, with a straightforward, moderate design complexity.
Strategic Planning
Industrial & Manufacturing
The slide illustrates various wider contributions of the Tempest programme, such as skill spillovers, R&D spillovers, and regional development, aligning with government objectives.
Tempest, development, government, UK
false
Strategic Planning
Industrial & Manufacturing
Header Vertical
PwC/Strategy&
Add to my slides
Remove from favorites
A data-rich slide with multiple bar graphs representing regional economic impacts. The slide is text-heavy with key statistics highlighted.
Technology and Digital Transformation
Government & Public Sector
Focuses on the economic contribution of the Tempest programme to various UK regions, presenting data and graphs on regional impact and productivity.
Tempest, economic contribution, UK, regions, impact, productivity, data
false
Technology and Digital Transformation
Government & Public Sector
Multiple Chart
PwC/Strategy&
Add to my slides
Remove from favorites
The layout features a title at the top, a main text body on the left, and a smaller text section on the right. The lower half visualizes a timeline using an arrow, indicating progress from 2021 to 2050. The design is neat and conveys progression.
Market Analysis and Trends
Government & Public Sector
Discussing the economic impact of the Tempest program from 2021 to 2050, the slide details stages from concept to service entry, with predictions on GVA and employment contributions. Ideal for discussing long-term economic strategies or defense-related economic forecasting.
Tempest, Economic Impact, GVA, Employment, 2050, UK Defense
false
Market Analysis and Trends
Government & Public Sector
Linear Flow
PwC/Strategy&
Add to my slides
Remove from favorites
The slide is cleanly laid out with three distinct sections. On the left, a red box contains key terminology with bullet points. The central area outlines the structure of the report with headers and text. The right side lists other sections of the report in a similar format.
Strategic Planning
Industrial & Manufacturing
The slide breaks down the structure of a report on the economic contribution of the Tempest programme using Input-Output modelling. It introduces key terminology and outlines the wider impact of the programme including R&D spillover effects and skills development.
Tempest programme, economic contribution, GVA, R&D spillover, skills development, report structure, input-output modelling
false
Strategic Planning
Industrial & Manufacturing
Boxed
PwC/Strategy&
Add to my slides
Remove from favorites
The slide has a color-coded, segmented arrow graphic that illustrates various contributions of the Tempest program. The design is professional, using a mix of red, black, and white color scheme with clear, bold fonts and highlighted numerical data. The layout is moderately dense with text and graphical elements.
Industry Overview
Government & Public Sector
This slide provides an overview of the Tempest programme’s economic impact, job creation, and regional contribution from 2021 to 2050. It is used to demonstrate the significance of a government defense project in terms of economic and employment benefits.
Tempest programme, GDP contribution, employment, economic impact, long-term value, productivity, regional benefits
false
Industry Overview
Government & Public Sector
Diagram
PwC/Strategy&
Add to my slides
Remove from favorites
Predominantly text-based with red highlighted sections, and bullet points to break up the information. Infographics and strategic icons accentuate key points.
Technology and Digital Transformation
Government & Public Sector
This slide outlines the contributions of the Tempest programme to the UK’s R&D and defence, highlighting economic benefits, collaboration, and innovation across sectors.
Tempest, R&D, defence, innovation, UK, economy, collaboration, sectors, development
false
Technology and Digital Transformation
Government & Public Sector
Text Only
PwC/Strategy&
Add to my slides
Remove from favorites
A text-heavy slide that incorporates a bar graph, showing the increasing percentage share of the Tempest programme in UK Combat Air activities. The use of red to denote the data is effective, and the overall design is clean and straightforward.
Market Analysis and Trends
Industrial & Manufacturing
Analyzes the growth in employment and GVA contributions of the Tempest programme over time, forecasting its increasing significance in the Combat Air sector.
Tempest, UK Combat Air, employment, GVA, growth, forecast, economic contribution, market share
false
Market Analysis and Trends
Industrial & Manufacturing
Mixed Chart
PwC/Strategy&
Add to my slides
Remove from favorites
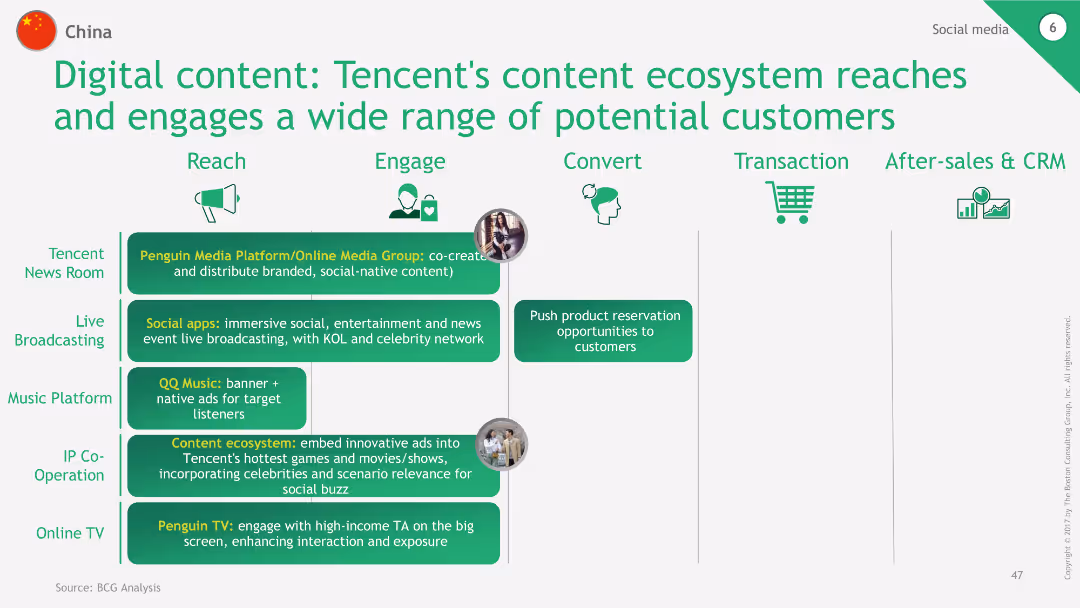
The slide uses a process flow diagram to show Tencent's content ecosystem, highlighting platforms like Penguin Media, Live Broadcasting, QQ Music, and Penguin TV. It demonstrates how these platforms reach, engage, and convert customers, ending with transaction and after-sales & CRM stages.
Technology and Digital Transformation
Consumer Goods
This slide demonstrates the wide reach and engagement of Tencent's content ecosystem, showing how various platforms and services interact with customers through different stages of the shopping journey, from reach to after-sales.
Tencent, content ecosystem, engagement, conversion, CRM
false
Technology and Digital Transformation
Consumer Goods
Table
BCG
Add to my slides
Remove from favorites
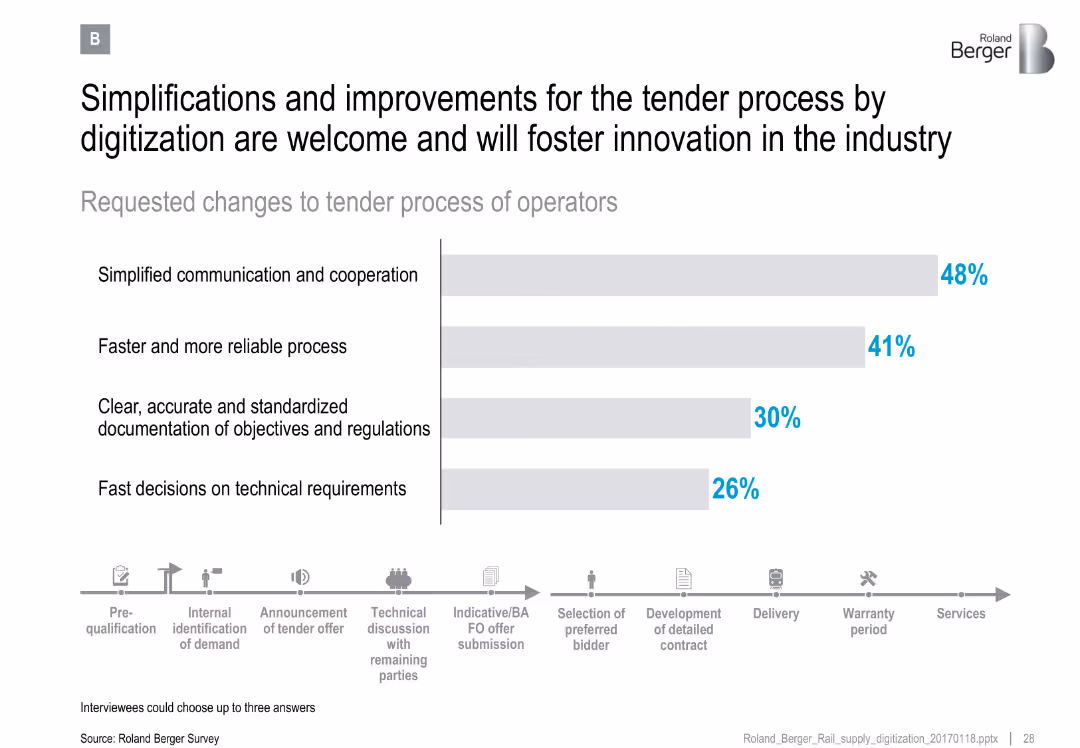
Horizontal bar chart with percentage labels; bottom row shows tender lifecycle as icons
Operational Efficiency
Transportation & Logistics
Discusses operator-desired improvements in the tender process due to digitization, such as better communication, faster procedures, and clear regulations.
tender process, digitization, procurement, process optimization, rail industry
false
Operational Efficiency
Transportation & Logistics
Mixed Chart
Roland Berger
Add to my slides
Remove from favorites
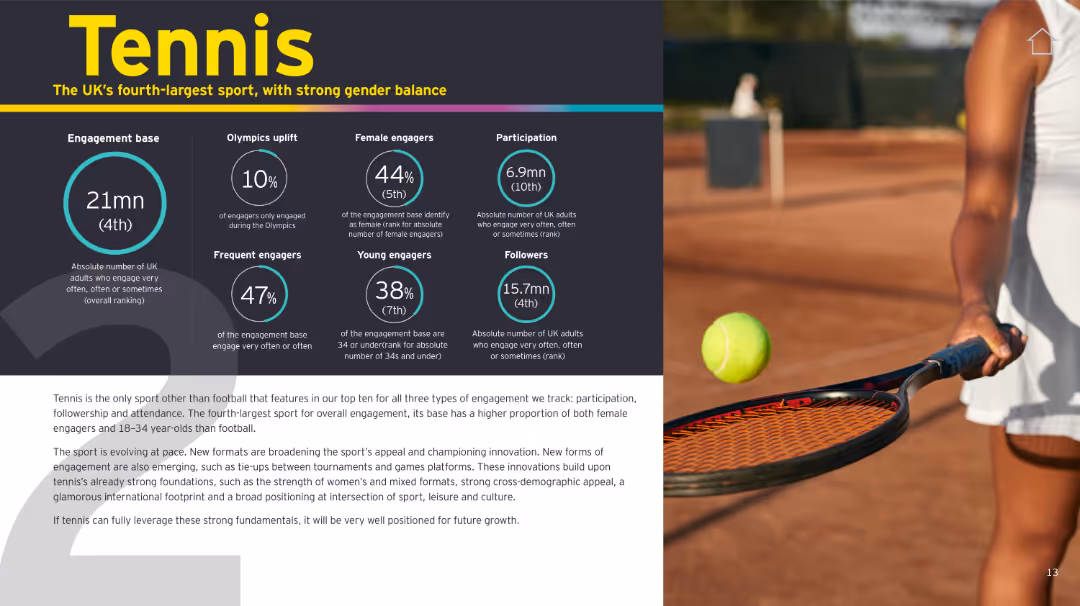
Similar format to slide 16166. Infographic panel on left, tennis photo on right. Yellow, black, and teal color scheme.
Customer and Market Segmentation
Media & Entertainment
Tennis ranks fourth in overall UK engagement and stands out for gender balance and younger audience appeal. Innovations in format and global positioning support its continued growth.
tennis, engagement, UK sport, gender balance, innovation, youth, participation
false
Customer and Market Segmentation
Media & Entertainment
Mixed Chart
EY
Add to my slides
Remove from favorites
This slide contrasts 2008 and 2018 data through blue column charts, showing growth over a decade. It incorporates icons and bullet points that highlight key strategic actions contributing to growth.
Financial Performance
Financial Services
Analyzes the growth of the commercial banking sector over ten years, reflecting on client coverage, team enablement, core capabilities, process investment, and discipline. It's suitable for demonstrating to stakeholders the results of sustained investment and growth strategies.
ten-year retrospective, growth, investment, client coverage, banking sector, team enablement, capabilities
false
Financial Performance
Financial Services
Multiple Chart
JP Morgan
Add to my slides
Remove from favorites
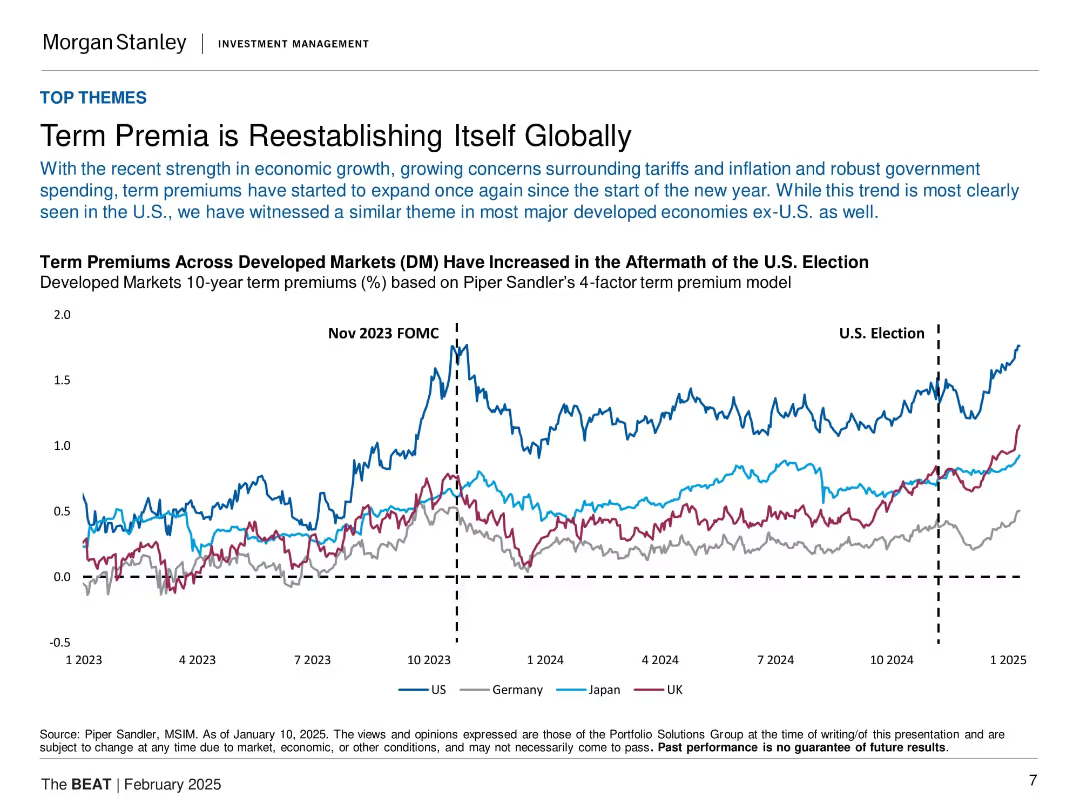
Line chart with four country lines (US, Germany, Japan, UK), vertical dashed markers for Nov 2023 FOMC and U.S. Election, on a clean white background.
Market Analysis and Trends
Financial Services
The slide highlights the reemergence of term premia across developed markets, especially in the U.S., following macroeconomic triggers like the U.S. election and the Nov 2023 FOMC. It uses a comparative line chart to show how term premiums have expanded post-election across the U.S., Germany, Japan, and the UK, suggesting global shifts in bond market expectations.
term premium, FOMC, bond market, U.S. election, inflation, tariffs, macroeconomics, yield curve, developed markets
false
Market Analysis and Trends
Financial Services
Single Chart
Morgan Stanley
Add to my slides
Remove from favorites
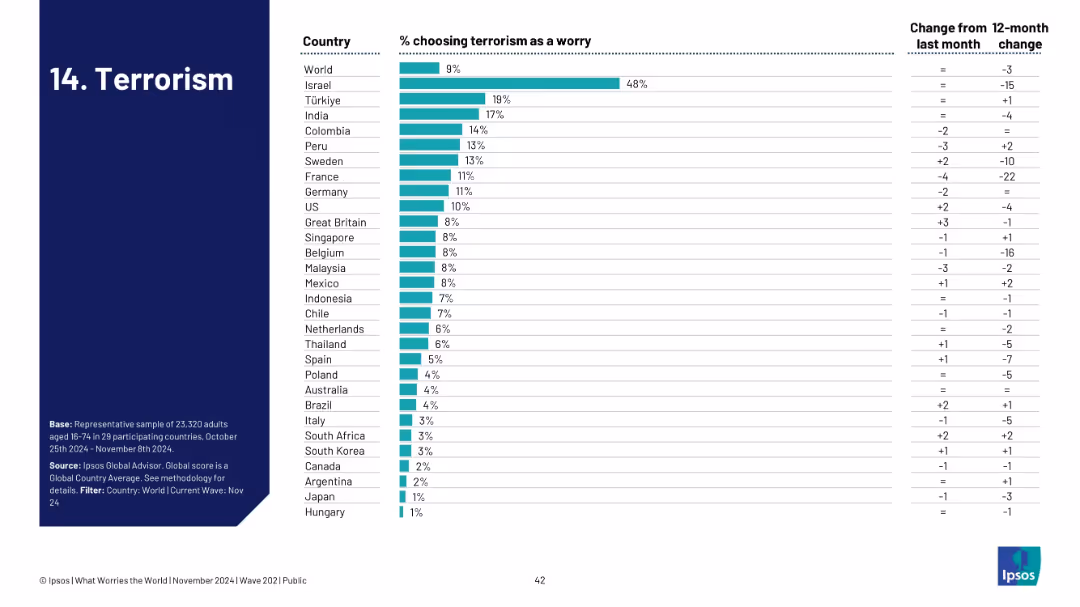
Ranked bar chart displaying country-level concern over terrorism, with changes in monthly and yearly perception.
Risk Assessment and Management
Government & Public Sector
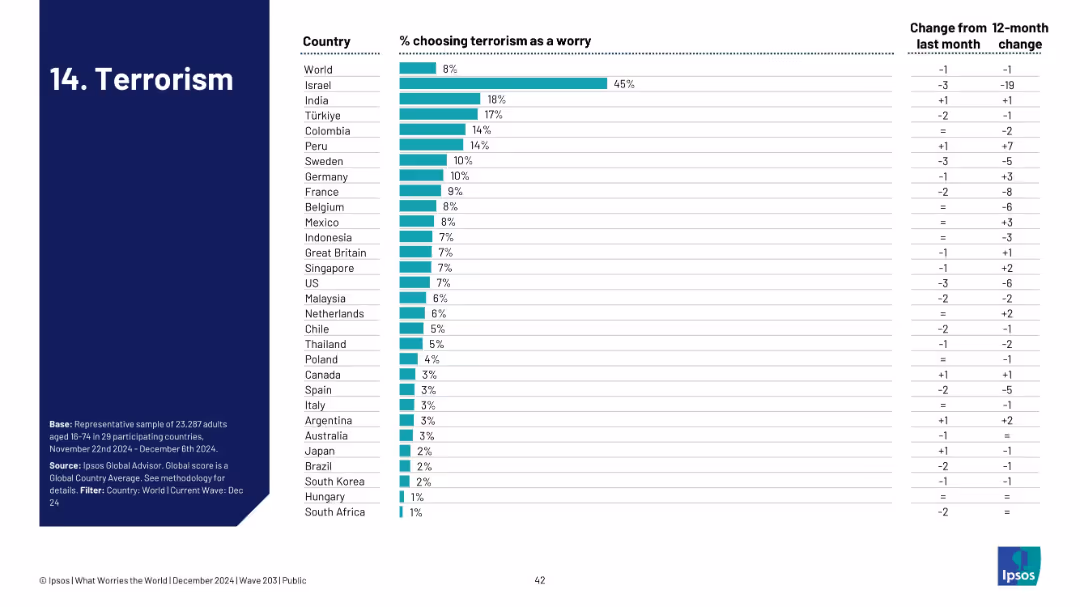
Globally, terrorism ranks low with 8% citing it as a top concern. Israel is a major outlier at 45%. The chart helps illustrate evolving fear levels and geopolitical perceptions tied to terrorism.
terrorism, fear, geopolitical, public perception, Ipsos, country risk
false
Risk Assessment and Management
Government & Public Sector
Single Chart
IPSOS
Add to my slides
Remove from favorites
Historical line graph (1999–2025) with spikes annotated by global conflict and terror events; notable dips and peaks clearly labeled.
Risk Assessment and Management
Government & Public Sector
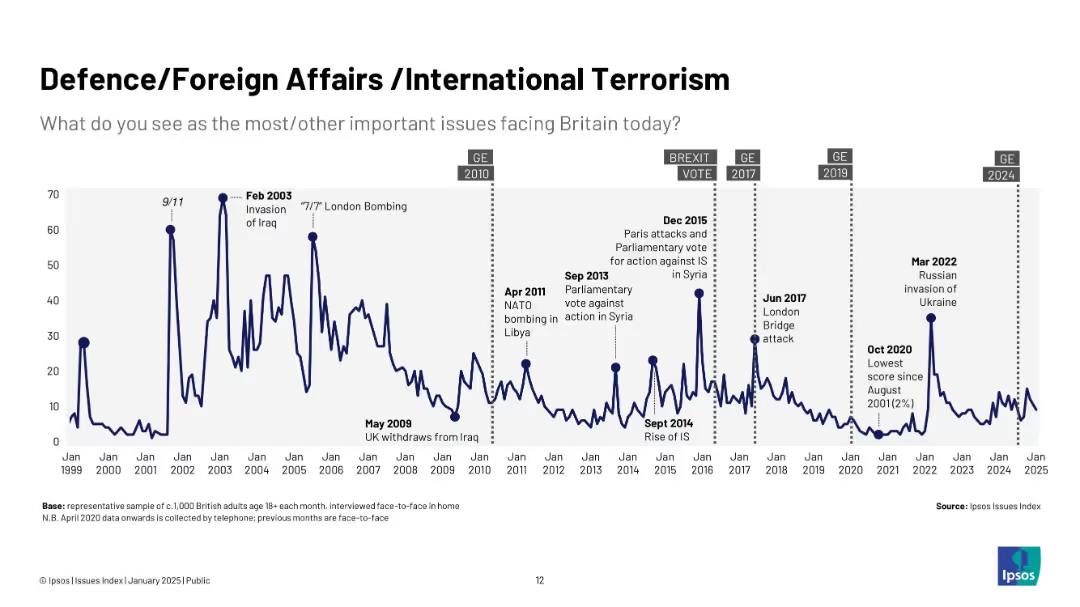
Visualizes public concern about international terrorism and defense, highlighting peaks at 9/11, Iraq War, IS threats, and Ukraine invasion in 2022.
terrorism, foreign affairs, UK, Iraq, Syria, Ukraine, defense, risk perception
false
Risk Assessment and Management
Government & Public Sector
Single Chart
IPSOS
Add to my slides
Remove from favorites
Bar graph presenting public trust in government handling of terrorism; Canada and US marked; global average baseline included.
Regulatory and Compliance
Government & Public Sector
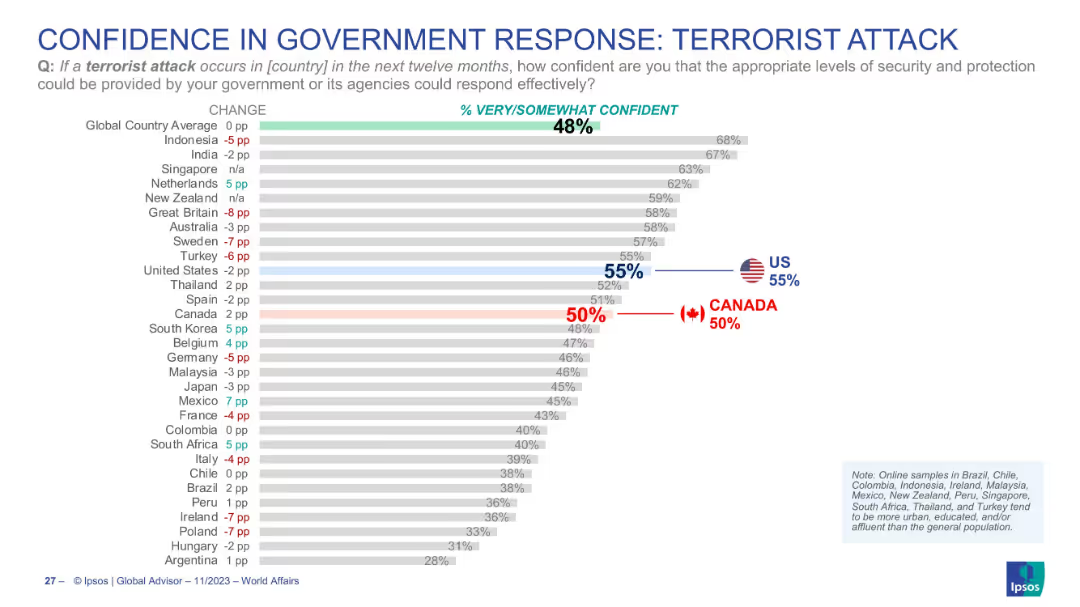
This slide measures public trust in their government’s ability to respond to a potential terrorist attack. The global average is 48%, with the US at 55% and Canada at 50%. It gauges perceived institutional effectiveness and public security assurance.
terrorism, government response, national security, perception, Ipsos, Canada, USA, threat preparedness
false
Regulatory and Compliance
Government & Public Sector
Single Chart
IPSOS
Add to my slides
Remove from favorites
Horizontal bar graph; Canada and U.S. color-coded; terrorism response confidence analyzed.
Risk Assessment and Management
Government & Public Sector
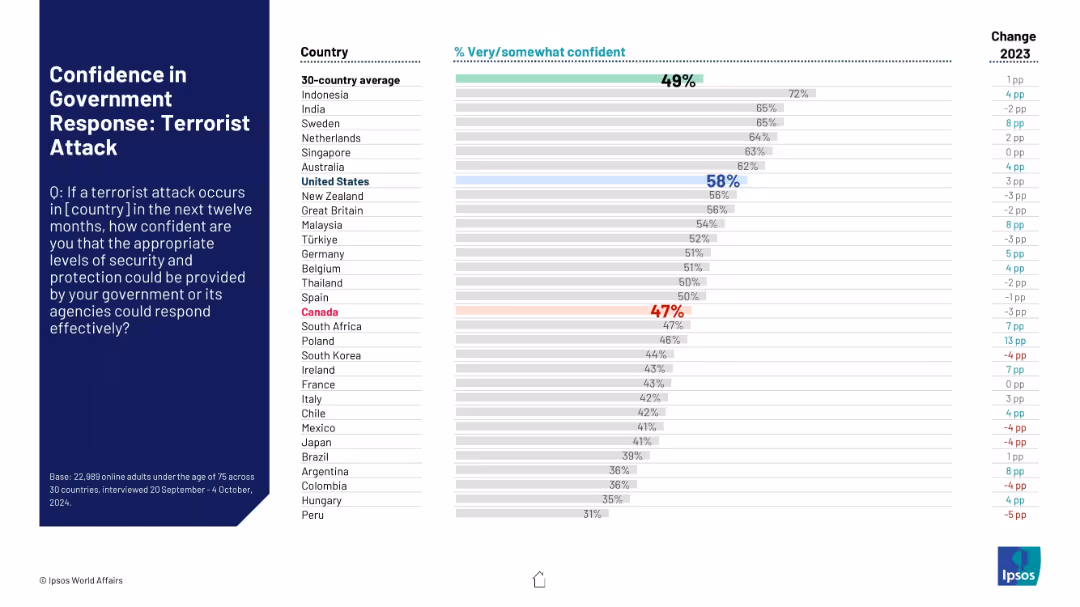
Survey results showing public trust in government response to potential terrorist attacks. U.S. respondents show higher confidence (58%) than Canada (47%), with the global average at 49%.
terrorism, government response, security, Ipsos, 2024, Canada, U.S., emergency management, perception
false
Risk Assessment and Management
Government & Public Sector
Mixed Chart
IPSOS
Add to my slides
Remove from favorites
Ranked bar chart by country for terrorism concern; change columns provided.
Risk Assessment and Management
Government & Public Sector
Visualizes how terrorism ranks among public concerns across nations. Israel is highest at 48%, with most countries under 10%. The trend data indicates a general decline in worry, potentially reflecting a shift in geopolitical focus or threat levels.
terrorism, national security, global concern, Ipsos, survey, public safety, threat perception, geopolitical risk
false
Risk Assessment and Management
Government & Public Sector
Single Chart
IPSOS
Add to my slides
Remove from favorites
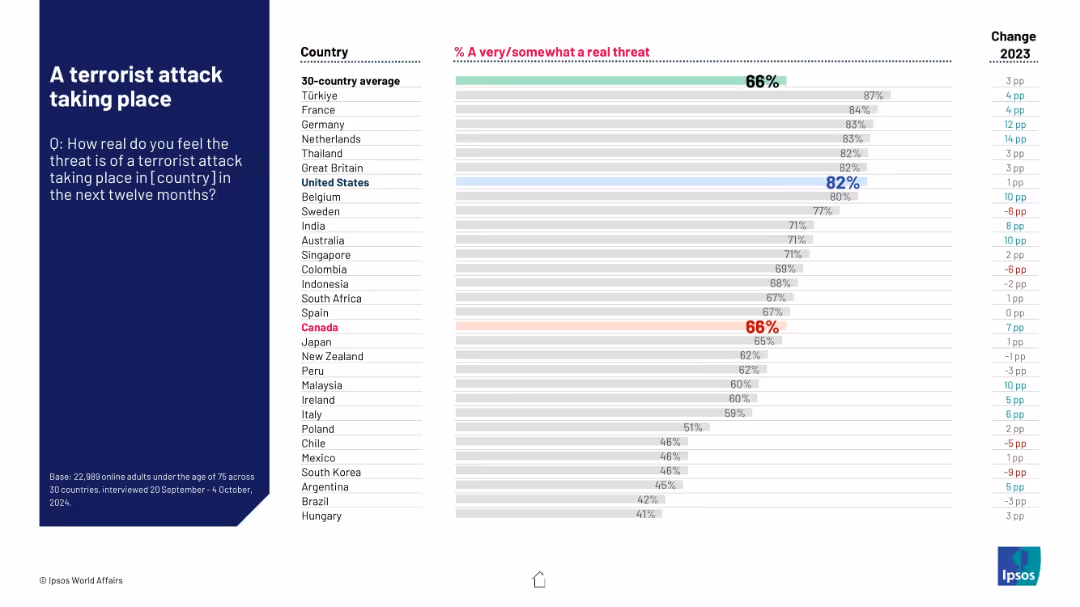
Horizontal bar chart of countries ranked by belief in the likelihood of a terrorist attack; red highlight on Canada, blue on U.S.
Risk Assessment and Management
Government & Public Sector
This slide shows global opinions on the risk of a terrorist attack in each respondent's country. Türkiye (87%) and France (84%) top the list, with Canada and the U.S. both showing significant concern. The global average is 66%, up 3 points from 2023.
terrorism, national security, public threat, global risk, Ipsos, survey data, safety, 2024 perception, likelihood rating, geopolitical fear
false
Risk Assessment and Management
Government & Public Sector
Mixed Chart
IPSOS
Add to my slides
Remove from favorites
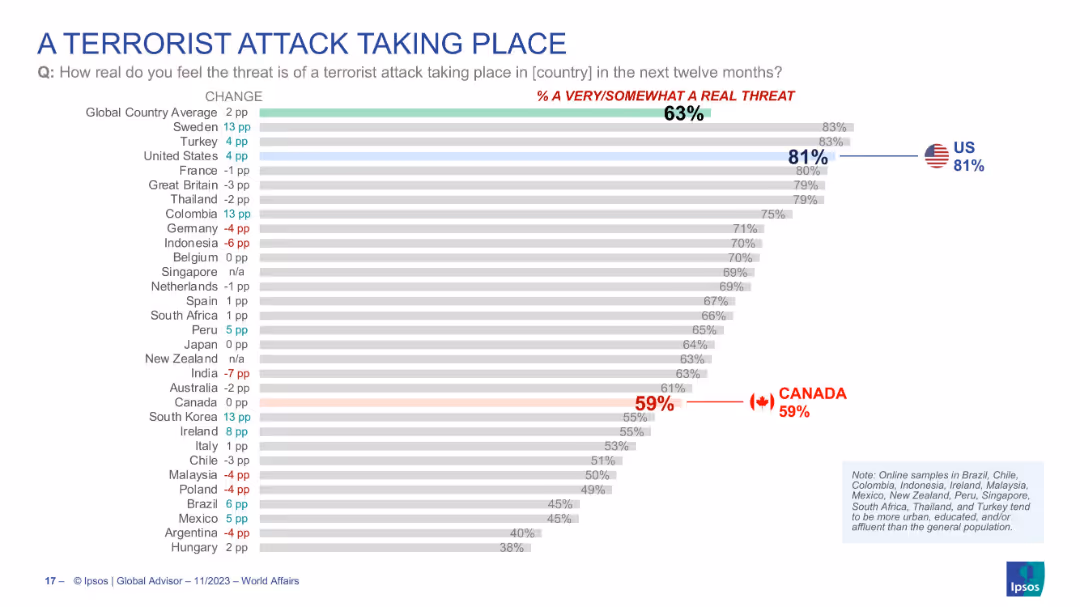
Horizontal bar chart ranking perceived risk of terrorist attacks in various countries. U.S. and Canada results are highlighted.
Risk Assessment and Management
Government & Public Sector
Global comparison of terrorism threat perception. U.S. ranks high (81%) while Canada shows moderate concern (59%). Slide includes changes from previous year and ranks countries accordingly. Designed to show comparative anxiety about terrorism among populations.
terrorism, threat perception, national security, global opinion, public risk, Ipsos, survey results
false
Risk Assessment and Management
Government & Public Sector
Single Chart
IPSOS
Add to my slides
Remove from favorites
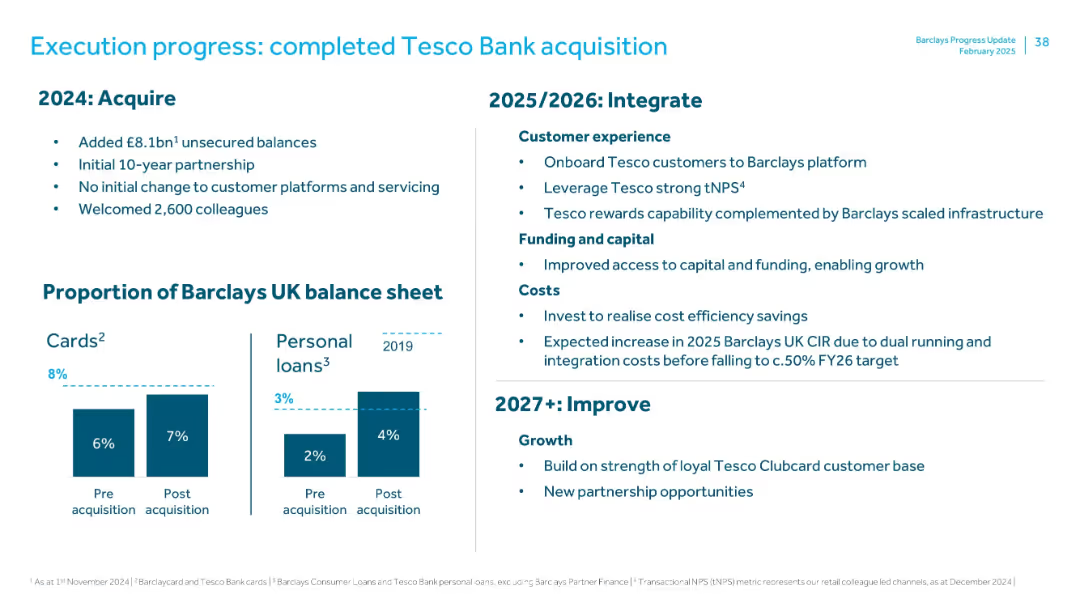
Split layout with bullet points on left, timeline structure on right, and bar charts at bottom. Clean, corporate design.
Mergers and Acquisitions
Financial Services
Details the acquisition of Tesco Bank by Barclays, including key metrics from 2024 (e.g., £8.1bn unsecured balances, 2,600 employees onboarded), integration plans for 2025–2026 (customer experience, capital, and cost considerations), and future improvements (growth, new partnerships). Also includes balance sheet impact visuals.
Tesco Bank, acquisition, integration, balance sheet, Barclays, M&A, unsecured debt, tNPS, CIR
false
Mergers and Acquisitions
Financial Services
Mixed Chart
Barclays
Add to my slides
Remove from favorites
Previous
Next
You don't have any favorites yet.
Please wait loading your favorites slides...
Create a FREE account to continue browsing
Receive Instant Access to 1,000+ slides from companies like McKinsey, Google, and Goldman Sachs
First Name
Last Name
Email
Password
I agree to all
Terms & Privacy Policy
Thank you! Your submission has been received!
Oops! Something went wrong while submitting the form.
Have an account?
Sign in
Upgrade to PRO to Save slides
Advanced Search and Filters
Access to 15,000+ slides
Access to Category Pages
Save/Bookmark Slides
PowerPoint Template Library
Pick a Plan
MONTHLY
$12/month
Billed every month, Cancel anytime.
YEARLY
$9/year
Billed $108 annually, Cancel anytime.
Checkout for $12/month
Checkout for $108/yr
Secured by Stripe | AES-256 bit encryption