My Account
My Slides
Search by Category
Pricing
Templates
View All Templates
Download Template Slides
✦ AI Search
Feedback
Login
Logout
Get Started
Browse all Slides
Browse all Slides
Create a FREE Account
Instant access to 1,000+ real slides from top companies like McKinsey, BCG, Goldman Sachs, Google and many more!
First Name
Last Name
Email
Password
I agree to all
Terms & Privacy Policy
Thank you! Your submission has been received!
Oops! Something went wrong while submitting the form.
Have an account?
Sign in
Saved Slides
Total No. of slides saved
0
↻ Refresh
✖ Clear all
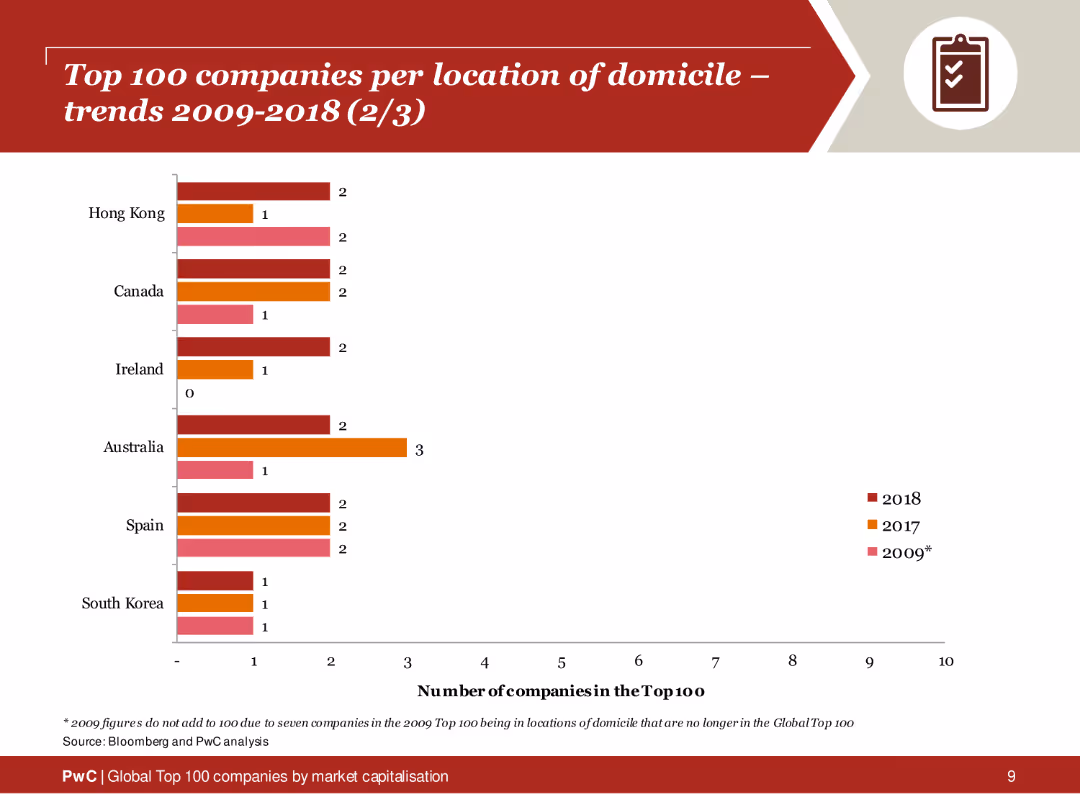
This slide features a column chart displaying the number of top 100 companies from Hong Kong, Canada, Ireland, Australia, Spain, and South Korea over three years.
Competitive Landscape
Financial Services
Trends in the top 100 companies' domicile locations, showing fluctuations and stability in different countries over a decade.
top 100 companies, domicile, trends, Hong Kong, Canada
false
Competitive Landscape
Financial Services
Single Chart
PwC/Strategy&
Add to my slides
Remove from favorites
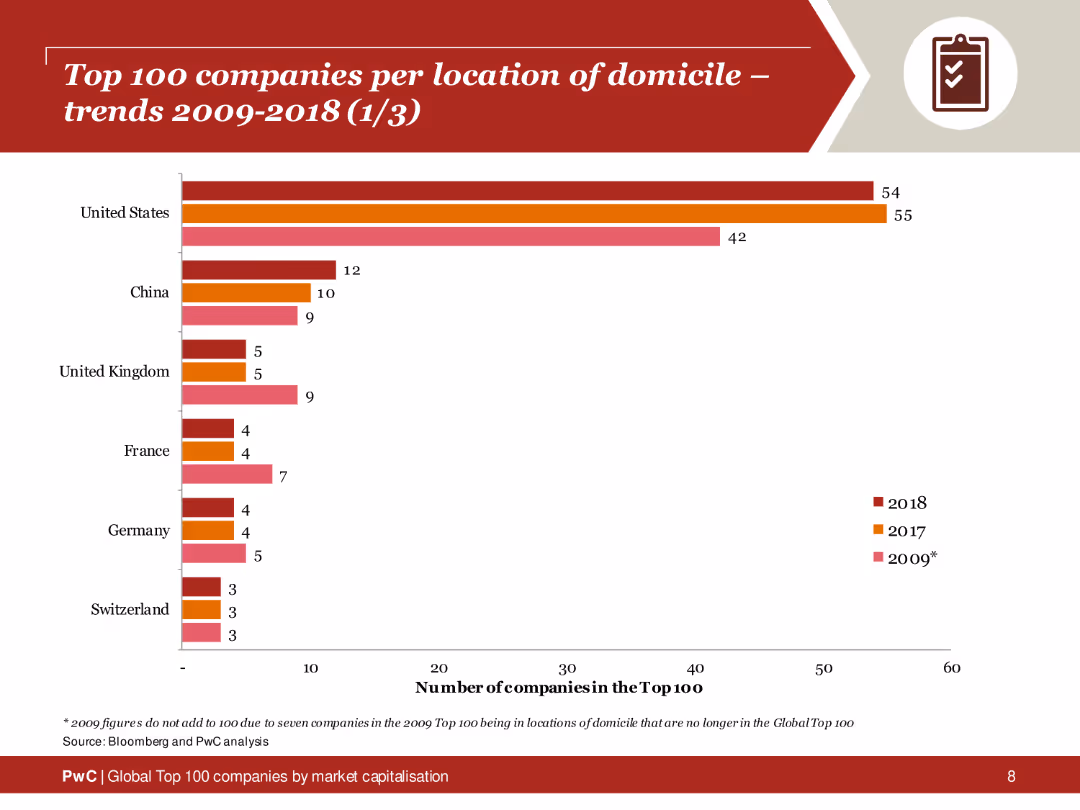
The slide shows a column chart comparing the number of top 100 companies from various countries (US, China, UK, France, Germany, Switzerland) across 2009, 2017, and 2018.
Competitive Landscape
Financial Services
Trends in the number of top 100 companies by location from 2009 to 2018, highlighting changes in the US, China, UK, and other countries.
top 100 companies, domicile, trends, US, China, UK
false
Competitive Landscape
Financial Services
Single Chart
PwC/Strategy&
Add to my slides
Remove from favorites
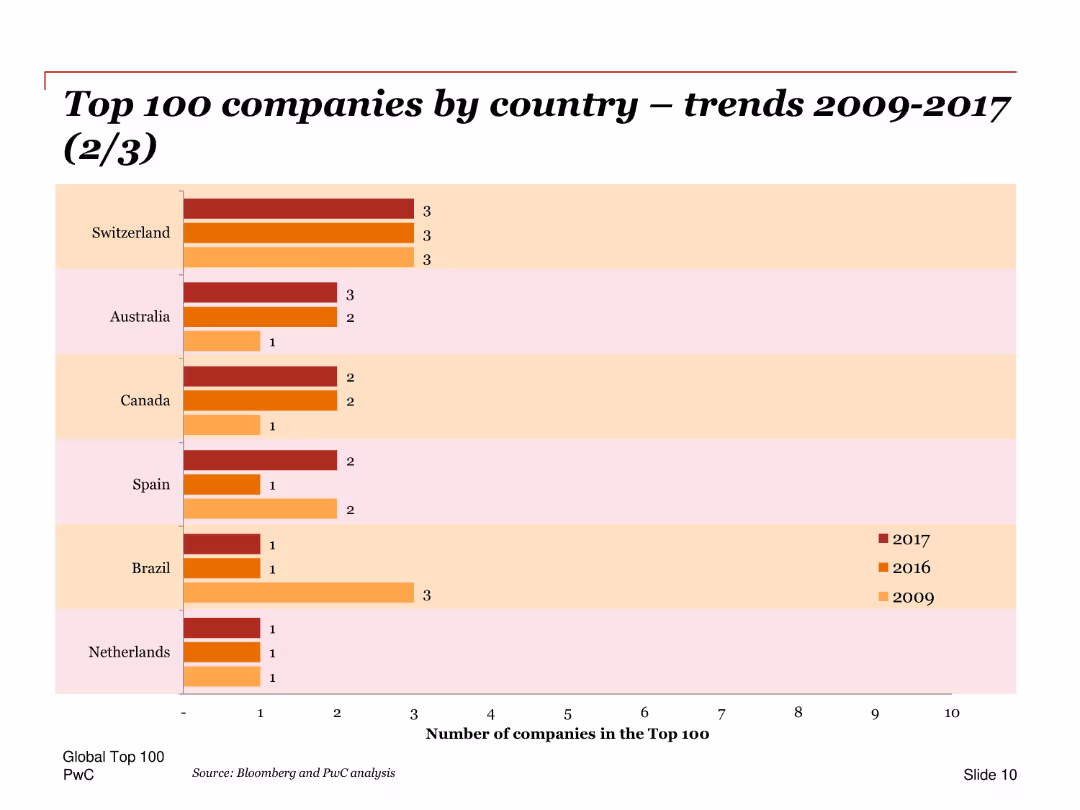
A bar chart showing the number of top 100 companies from Switzerland, Australia, Canada, Spain, Brazil, and Netherlands for the years 2009, 2016, and 2017. The bars are horizontal, indicating the companies’ counts per year per country.
Market Analysis and Trends
Financial Services
This slide displays the distribution of the top 100 companies by country over the years 2009, 2016, and 2017. It provides insights into the trends in different countries’ representation in the top 100 companies list, showing changes over time.
Top 100, companies, trends, countries, years, distribution, bar chart, financial analysis
false
Market Analysis and Trends
Financial Services
Single Chart
PwC/Strategy&
Add to my slides
Remove from favorites
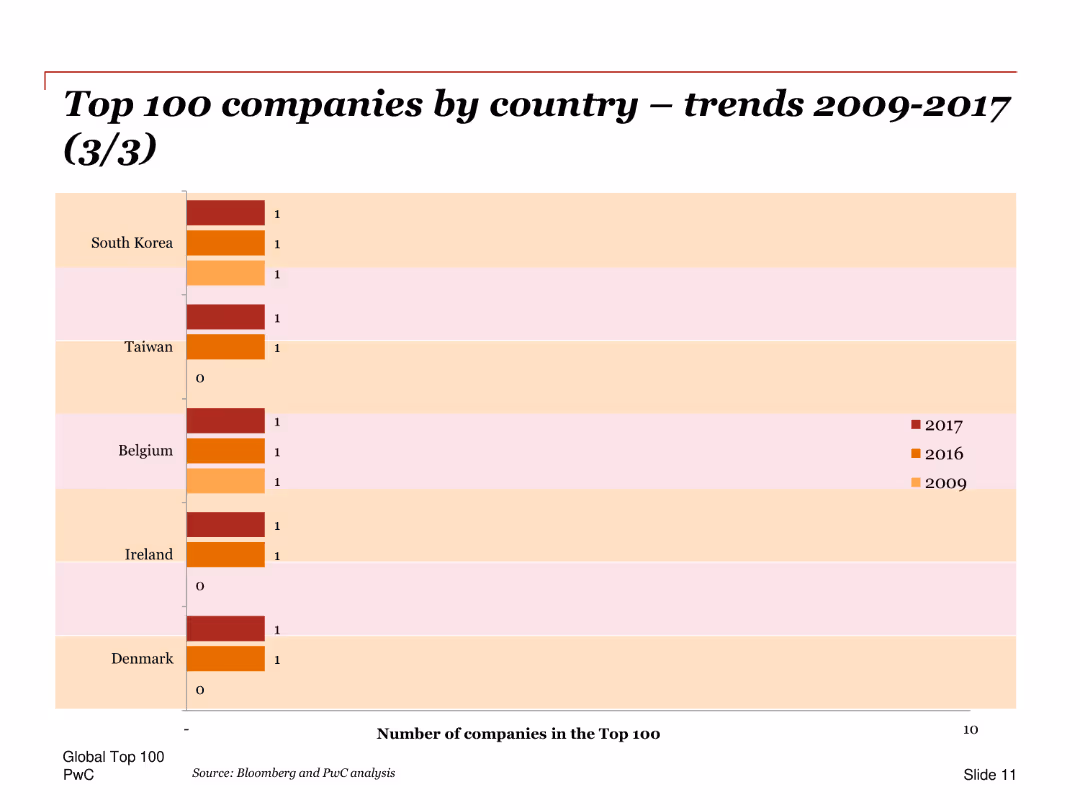
A bar chart showing the number of top 100 companies from South Korea, Taiwan, Belgium, Ireland, and Denmark for the years 2009, 2016, and 2017. The bars are horizontal, indicating the companies’ counts per year per country.
Market Analysis and Trends
Financial Services
This slide highlights the changes in the number of top 100 companies from South Korea, Taiwan, Belgium, Ireland, and Denmark over the years 2009, 2016, and 2017. It provides a comparative analysis of these countries’ standings in the top 100 companies list.
Top 100, companies, trends, countries, years, distribution, bar chart, financial analysis
false
Market Analysis and Trends
Financial Services
Single Chart
PwC/Strategy&
Add to my slides
Remove from favorites
A single-column slide with text listing the key actions leaders take to close innovation gaps.
Strategic Planning
Technology & Software
The slide outlines five key actions that top-performing companies undertake to foster innovation, including adopting flexible technologies, investing in cloud computing, and nurturing talent creatively.
top 10%, innovation, key actions, flexible technologies, cloud computing, talent, strategies, performance, closing gaps, foster
false
Strategic Planning
Technology & Software
Vertical Flow
Accenture
Add to my slides
Remove from favorites
A column chart representing the count of shows in the Nielsen Top 10 by platform over several weeks. The chart uses different colors to represent platforms like Apple TV+, Hulu, Amazon, and Disney+, with a legend on the right for reference.
Competitive Landscape
Media & Entertainment
This slide shows the weekly count of shows in the Nielsen Top 10 by platform from October to February. It highlights the presence and performance of various streaming services in producing top-rated shows.
top 10 shows, platform performance, weekly count, Nielsen ratings, streaming services
false
Competitive Landscape
Media & Entertainment
Single Chart
Nielsen
Add to my slides
Remove from favorites
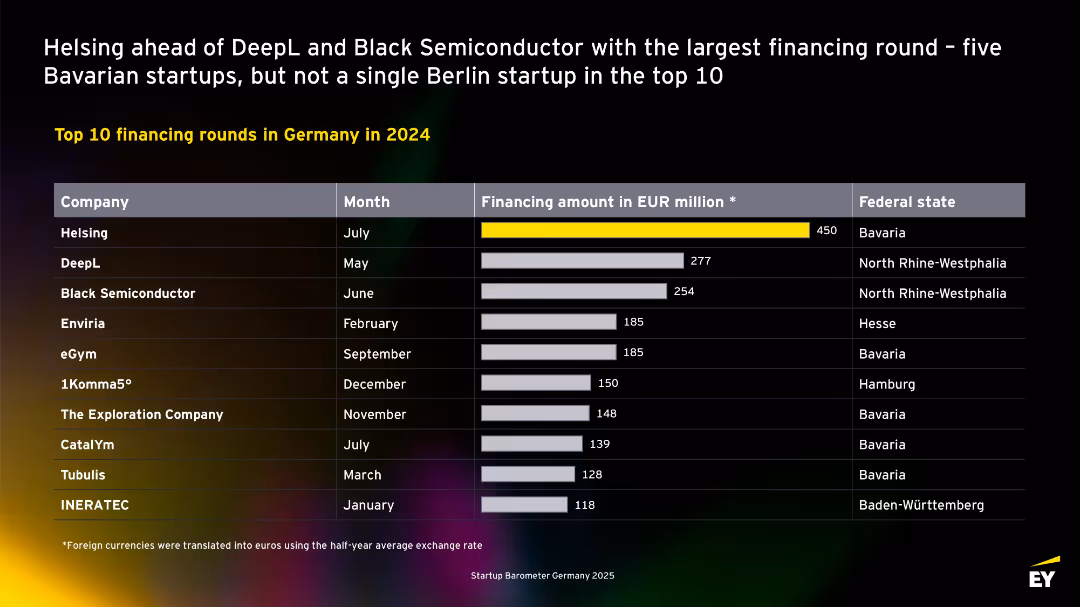
Table format with company names, months, financing amounts, and states. Highlights top deals of the year. No Berlin companies in the top 10, majority from Bavaria.
Investment Analysis
Technology & Software
Lists the top 10 startup financing rounds in Germany for 2024. Helsing leads with €450M, followed by DeepL and Black Semiconductor. Most top-funded companies are based in Bavaria and North Rhine-Westphalia. Berlin is notably absent from the list.
top deals, Bavaria, DeepL, Helsing, financing rounds, 2024, Germany, startups, investment
false
Investment Analysis
Technology & Software
Single Chart
EY
Add to my slides
Remove from favorites
The slide features two sections, one showing a column chart for the top two investment categories in Indonesia (Fintech and Healthcare) with their respective percentages, and the other providing qualitative insights into these categories.
Market Analysis and Trends
Financial Services
This slide identifies Fintech and Healthcare as the top investment categories in Indonesia, with 67% and 25% of responses respectively, highlighting the growing demand for tech-enabled consumer services in these sectors.
top investment categories, Indonesia, fintech, healthcare, investment, 2017, tech-enabled services
false
Market Analysis and Trends
Financial Services
Pillar
Kearney
Add to my slides
Remove from favorites
The slide shows a column chart listing the top issues facing Canada, with a focus on housing.
Market Analysis and Trends
Real Estate & Construction
It highlights the top concerns in Ontario at the end of 2020, with housing affordability and availability as significant issues.
Top issues, Canada, housing, affordability, availability, Ontario, concerns, 2020, coronavirus, economy
false
Market Analysis and Trends
Real Estate & Construction
Single Chart
IPSOS
Add to my slides
Remove from favorites
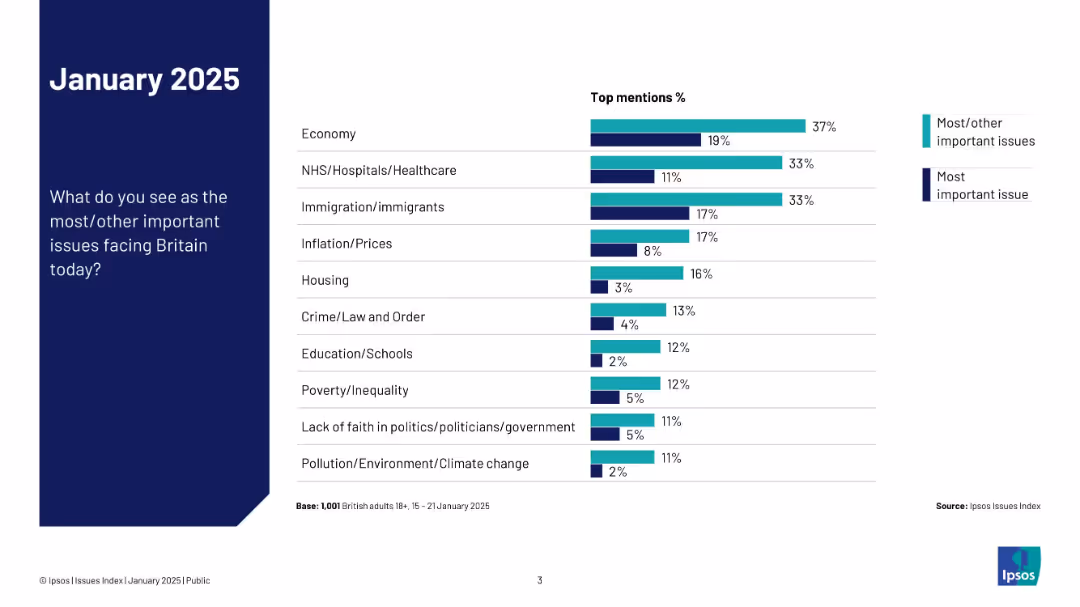
Nearly identical layout to 19473 but adds a dual-color bar split for “most important” vs. “most/other important”
Market Analysis and Trends
Government & Public Sector
This slide expands on the previous one by splitting the responses into two categories: most important and most/other important issues. It visually contrasts how concerns differ in perceived urgency.
top issues, comparison, priorities, Ipsos, public opinion, chart, UK, 2025, concern levels
false
Market Analysis and Trends
Government & Public Sector
Mixed Chart
IPSOS
Add to my slides
Remove from favorites
Column chart showing potential topline benefits from advancing maturity levels.
Technology and Digital Transformation
Financial Services
Discusses the potential incremental topline benefits for companies at different maturity levels in the SHoP framework.
topline, growth, customer conversion, NPS, engagement
false
Technology and Digital Transformation
Financial Services
Mixed Chart
BCG
Add to my slides
Remove from favorites
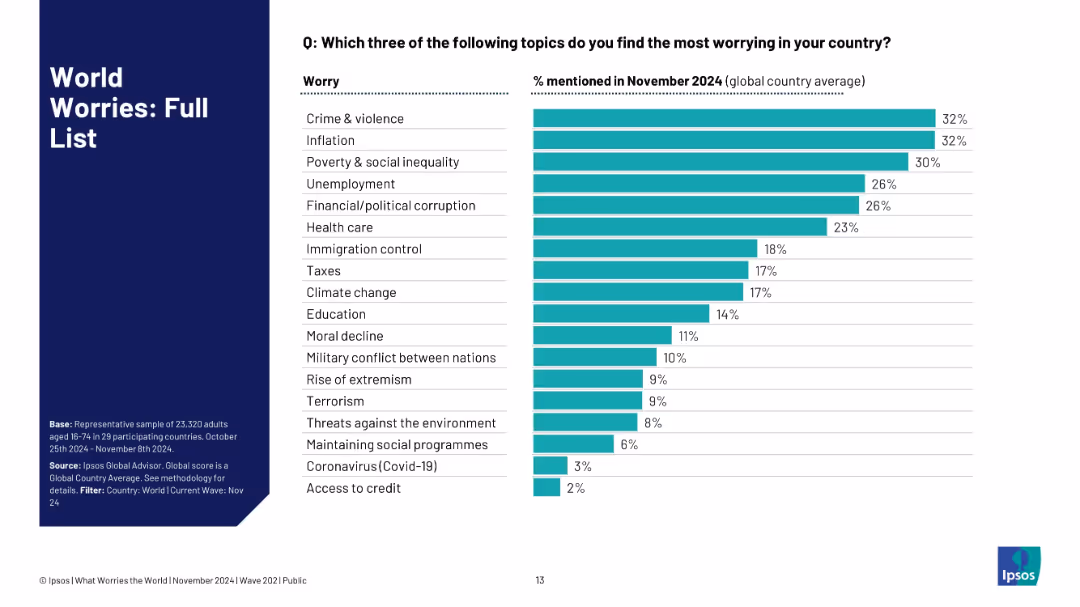
Horizontal bar chart with ranked list of global worries and their respective mention percentages.
Market Analysis and Trends
Professional Services
This slide ranks 20 different global concerns based on the percentage of respondents mentioning each as a top worry in November 2024. Crime, inflation, and inequality top the list, while access to credit and Covid-19 are of least concern.
top worries, global issues, ranking, Ipsos, crime, inflation, social inequality, public priorities
false
Market Analysis and Trends
Professional Services
Single Chart
IPSOS
Add to my slides
Remove from favorites
The slide contrasts the success rates and expected financial outcomes of different reinvention approaches, with deep purple tones for higher success and lighter for less. It includes bar charts and descriptive text, providing a clear visual differentiation between groups.
Strategic Planning
Professional Services
Analyzes the relationship between the adoption of Total Enterprise Reinvention and the accelerated financial success, using comparative data to showcase the potential outcomes for reinventors versus transformers and optimizers.
Total Enterprise Reinvention, Financial Success, Comparative Analysis, Business Case, Incremental Revenue, Balance Sheet, Cost Reduction, Outcome Expectations
false
Strategic Planning
Professional Services
Multiple Chart
Accenture
Add to my slides
Remove from favorites
The slide shows a bar chart and tables detailing total revenue breakdown by different business units and revenue types. It presents clear numerical and graphical data.
Financial Performance
Financial Services
It reports the total revenues for the third quarter of 2022, breaking down the contributions from various business segments and revenue sources.
total revenues, financial performance, revenue breakdown, business units, 3Q22
false
Financial Performance
Financial Services
Single Chart
UBS
Add to my slides
Remove from favorites
The slide shows a vertical column chart comparing total revenues for 3Q23 against previous quarters.
Financial Performance
Financial Services
This slide illustrates the increase in total revenues for 3Q23, with a comparison to previous quarters' performance.
total revenues, QoQ growth, financial performance, 3Q23, revenue comparison
false
Financial Performance
Financial Services
Mixed Chart
UBS
Add to my slides
Remove from favorites
Slide with a column chart showing underlying total revenues for 4Q23, with annotations explaining changes and key figures.
Financial Performance
Financial Services
The slide presents UBS's underlying total revenues for 4Q23, noting a 3% decrease quarter-on-quarter, with detailed revenue components.
total revenues, quarterly performance, revenue components, UBS financial results
false
Financial Performance
Financial Services
Mixed Chart
UBS
Add to my slides
Remove from favorites
Column charts showcasing sector contributions
Investment Analysis
Hospitality & Tourism
Highlights the sectorial contributions of high-end tourism to employment and economic activity, illustrating a multiplier effect on jobs and spending.
tourism, economic impact, employment, Europe
false
Investment Analysis
Hospitality & Tourism
Multiple Chart
Bain
Add to my slides
Remove from favorites
Three icon-based visuals with texts.
Market Analysis and Trends
Hospitality & Tourism
Discusses the economic importance of high-end tourism in Europe, including its GDP contribution and emerging opportunities.
tourism, economy, GDP, Europe, high-end
false
Market Analysis and Trends
Hospitality & Tourism
Pillar
Bain
Add to my slides
Remove from favorites
Depicts a stacked column chart showing international arrivals by destination with Europe highlighted against the rest of the world.
Market Analysis and Trends
Hospitality & Tourism
Highlights Europe's dominant position in global tourism, showing the distribution of international arrivals with specific emphasis on top European destinations.
Tourism, Europe, Global arrivals, Market analysis, Travel industry
false
Market Analysis and Trends
Hospitality & Tourism
Multiple Chart
Bain
Add to my slides
Remove from favorites
The slide includes column charts for the UK, Spain, France, Italy, and Germany, depicting the growth in tax-free shopping by tourists during 2016-2017. The bars are in shades of gray, and each country's performance is noted along with changes in transaction volumes and average ticket sizes.
Market Analysis and Trends
Consumer Goods
Provides data on the increase in tax-free shopping in Europe due to returning long-haul tourists. Highlights significant growth in countries like the UK and Spain, while noting a decline in Germany, aiding in understanding market recovery and tourist spending trends post-crisis.
tourism, Europe, luxury goods, tax-free shopping, market growth
false
Market Analysis and Trends
Consumer Goods
Single Chart
Bain
Add to my slides
Remove from favorites
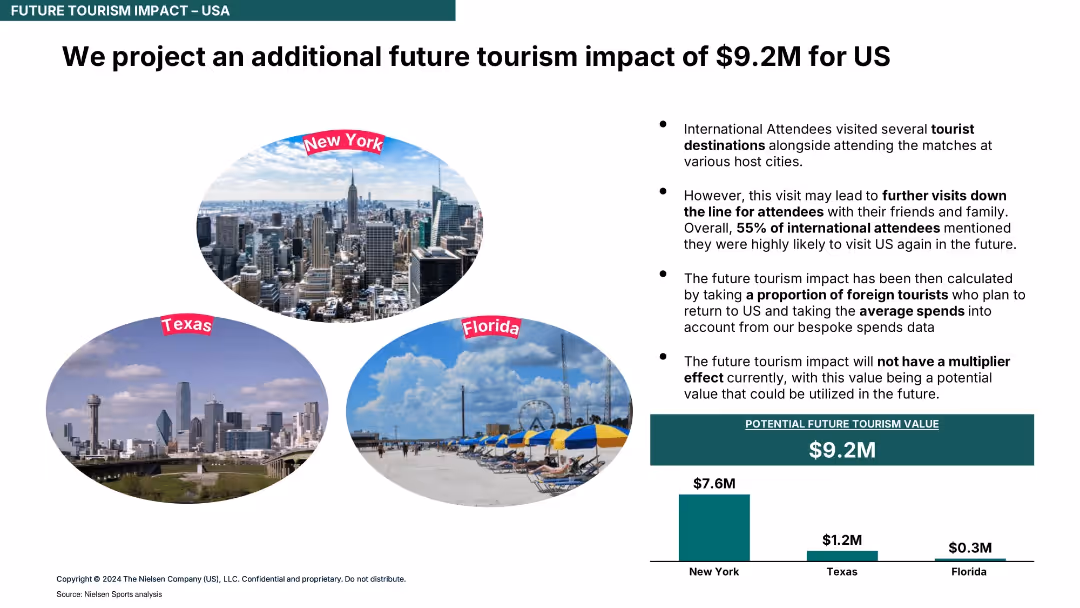
Mixed layout with photos of cities, bullet points, and a green bar chart showing projected economic impact by city.
Investment Analysis
Hospitality & Tourism
This slide projects future tourism value driven by current event attendance, estimating $9.2M in impact primarily for New York, followed by Texas and Florida. Highlights return visits and potential economic benefit.
tourism forecast, economic impact, future visits, spending, event ROI, US cities, projections
false
Investment Analysis
Hospitality & Tourism
Mixed Chart
Nielsen
Add to my slides
Remove from favorites
Contains segmented column charts showing direct and indirect contributions of tourism to the GDP and employment in Europe.
Strategic Planning
Hospitality & Tourism
Examines the direct and indirect economic impacts of tourism in Europe, including contributions to GDP and employment figures.
Tourism, GDP, Employment, Economic impact, Europe
false
Strategic Planning
Hospitality & Tourism
Mixed Chart
Bain
Add to my slides
Remove from favorites
Combined text and icons layout with key data points
Industry Overview
Hospitality & Tourism
Emphasizes the global significance of tourism in Europe, detailing its economic impact and the unique value of its high-end segment.
tourism, global impact, economic value, Europe
false
Industry Overview
Hospitality & Tourism
Header Vertical
Bain
Add to my slides
Remove from favorites
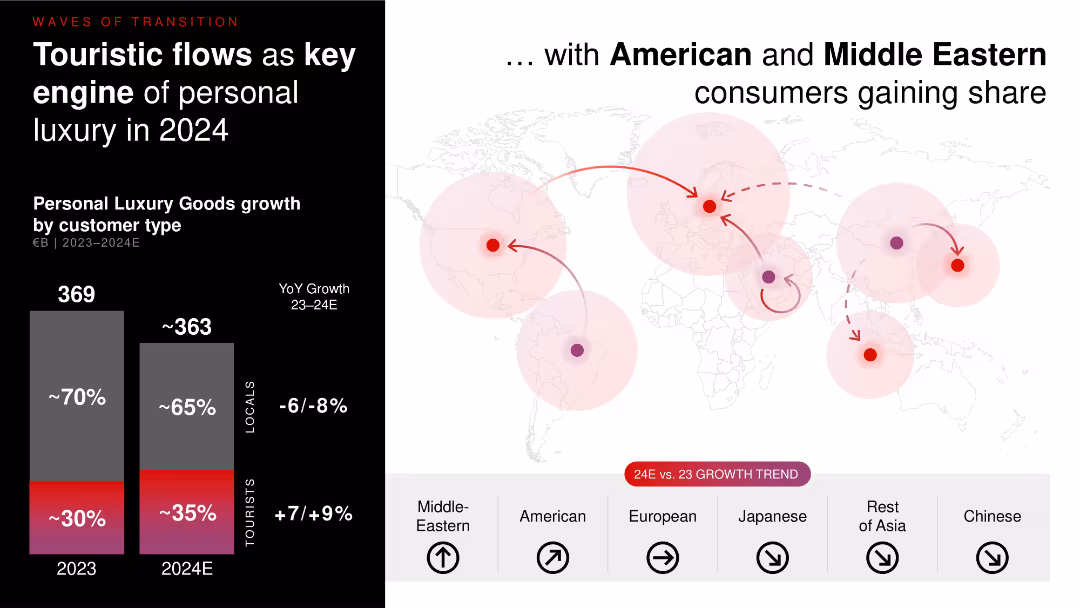
Split layout with bar chart (2023–2024E) showing growth by customer type; global map with flow arrows and red-pink circles to indicate regional dynamics and consumer shifts.
Customer and Market Segmentation
Consumer Goods
Tourists are becoming a key growth engine for personal luxury in 2024, with strong spending by American and Middle Eastern consumers. While local demand softens, tourist contributions are rising, particularly across Europe and the Middle East.
tourism growth, personal luxury, customer segmentation, American tourists, Middle East, global flows
false
Customer and Market Segmentation
Consumer Goods
Mixed Chart
Bain
Add to my slides
Remove from favorites
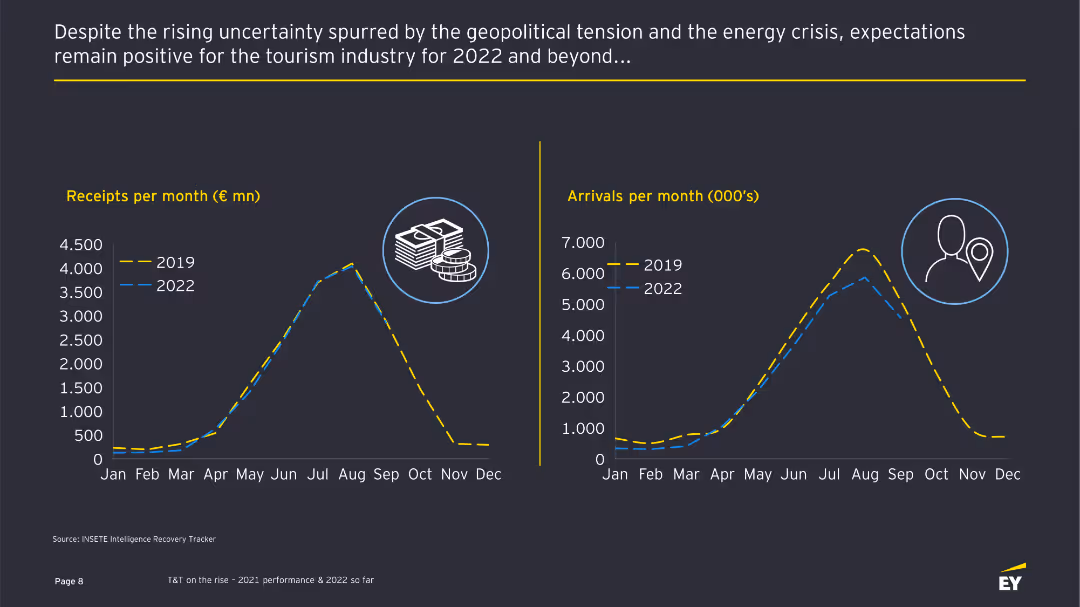
The slide features two line charts comparing monthly receipts and arrivals in 2019 and 2022, accompanied by text describing the positive expectations despite geopolitical tensions.
Market Analysis and Trends
Hospitality & Tourism
This slide shows a positive outlook for the tourism industry in 2022, comparing monthly receipts and arrivals with those of 2019 and discussing the industry's resilience.
Tourism industry, expectations, line charts, market trends, financial data
false
Market Analysis and Trends
Hospitality & Tourism
Multiple Chart
EY
Add to my slides
Remove from favorites
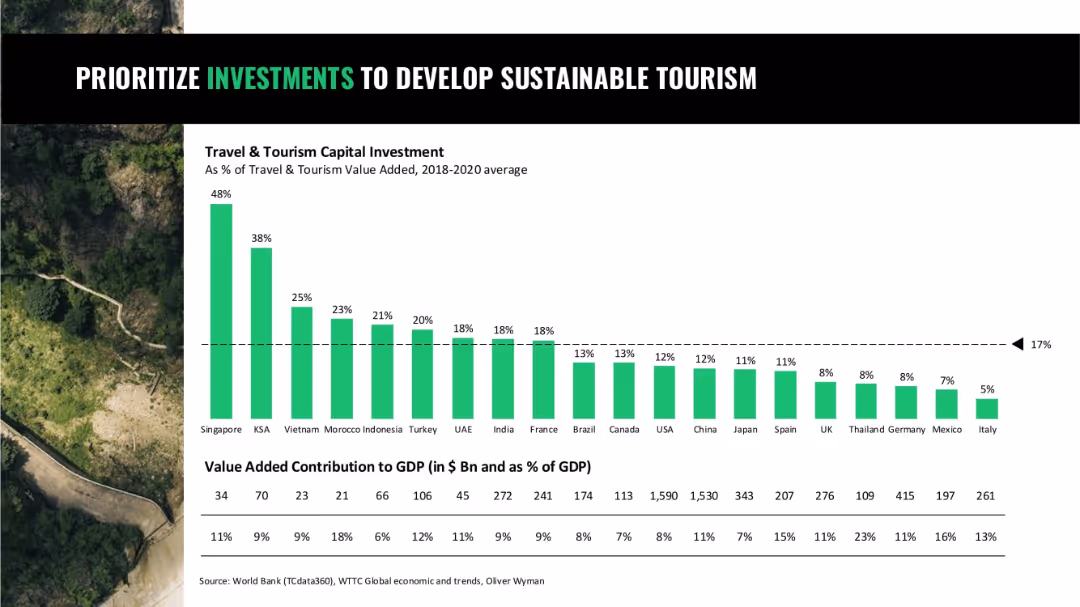
Bar chart comparing travel and tourism capital investment as % of GDP by country; background nature imagery
Strategic Planning
Hospitality & Tourism
A comparison of how countries invest in sustainable tourism relative to GDP, highlighting Singapore, Saudi Arabia, and Vietnam as leaders, and showing a global average benchmark.
tourism investment, sustainable development, travel, capital allocation, GDP share
false
Strategic Planning
Hospitality & Tourism
Single Chart
Oliver Wyman
Add to my slides
Remove from favorites
A timeline diagram showing various activities and websites where visitors can find information about Melbourne's attractions. Each step includes a small image and text describing the activity.
Customer and Market Segmentation
Hospitality & Tourism
Highlights the fragmented nature of information sources for tourists in Melbourne and suggests six different sources visitors might need to plan a day.
tourism, Melbourne, attractions, visitor information, websites
false
Customer and Market Segmentation
Hospitality & Tourism
Vertical Flow
BCG
Add to my slides
Remove from favorites
Displays growth percentages in luxury goods shopping among tourists in Europe with column charts. Bars are colored differently to represent various countries like France and Italy.
Market Analysis and Trends
Retail & E-commerce
Provides an overview of the impact of the strong Euro on tourist shopping in Europe, showing changes in tax-free shopping growth rates for luxury goods between 2017 and 2018 in major European markets.
Tourism, Shopping Trends, Europe, Luxury Goods, Currency
false
Market Analysis and Trends
Retail & E-commerce
Single Chart
Bain
Add to my slides
Remove from favorites
Icons and labels representing tourism enablers
Strategic Planning
Hospitality & Tourism
Identifies key factors necessary for enhancing high-end tourism, including luxury accommodations, high-end brands, and safety.
tourism, strategy, enablers, luxury, safety
false
Strategic Planning
Hospitality & Tourism
Table
Bain
Add to my slides
Remove from favorites
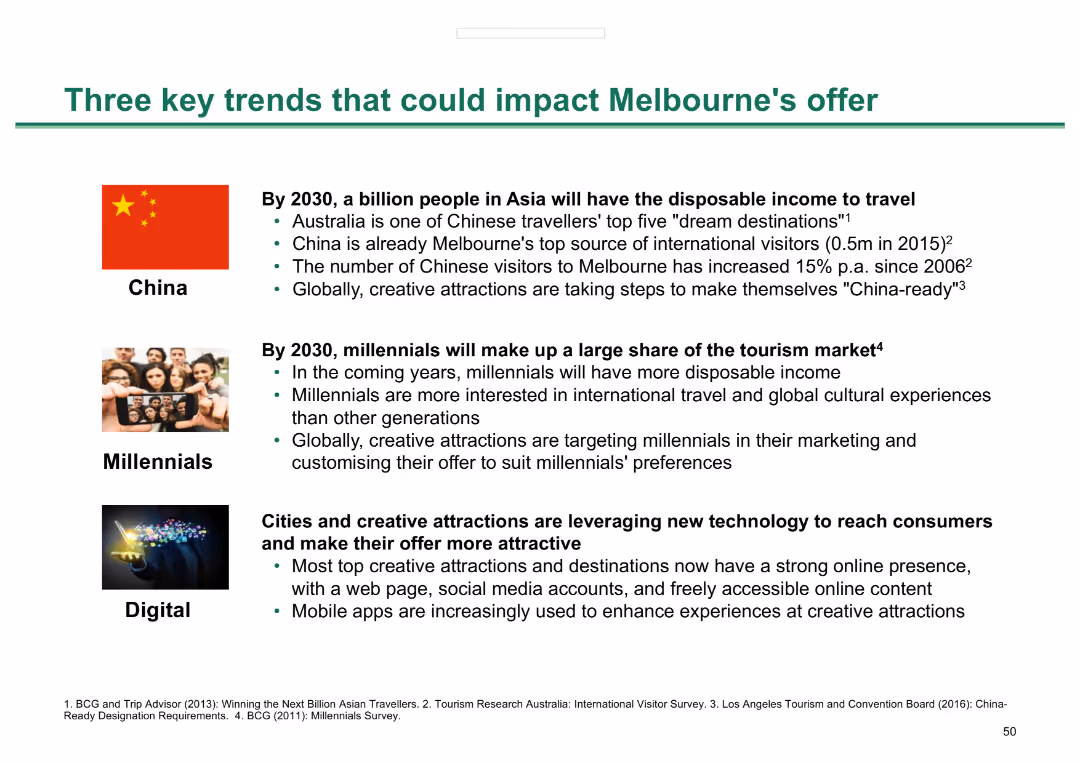
A content slide listing three key trends: increase in disposable income in Asia, millennials as a large share of the tourism market, and the use of digital technology in creative attractions.
Strategic Planning
Hospitality & Tourism
Outlines three major trends affecting Melbourne's tourism: growing disposable income in Asia, the rise of millennial travelers, and the adoption of digital technology by creative attractions.
tourism trends, Melbourne, disposable income, millennials, digital technology
false
Strategic Planning
Hospitality & Tourism
Header Vertical
BCG
Add to my slides
Remove from favorites
The slide includes bar charts showing tourist arrivals and receipts by origin in 2022 compared to 2019, with a contextual image of a traveler.
Market Analysis and Trends
Hospitality & Tourism
This slide compares tourist arrivals and receipts by origin in 2022 with those of 2019, focusing on the top contributing countries and providing visual context.
Tourist arrivals, receipts, 2022 comparison, market analysis, tourism trends
false
Market Analysis and Trends
Hospitality & Tourism
Multiple Chart
EY
Add to my slides
Remove from favorites
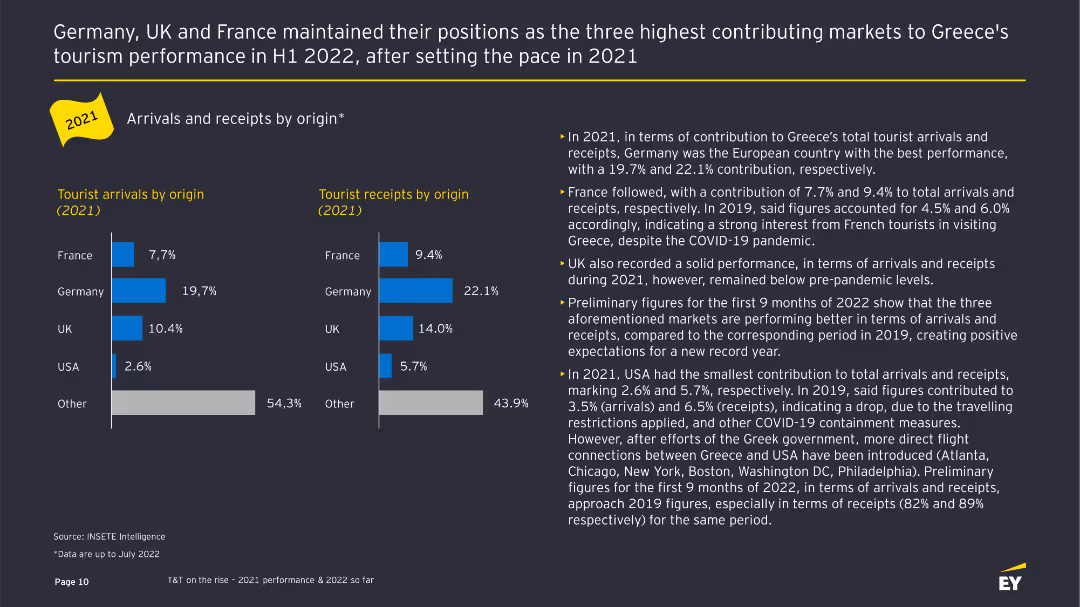
The slide displays bar charts comparing tourist arrivals and receipts by origin in 2021, with supporting text detailing performance by country.
Customer and Market Segmentation
Hospitality & Tourism
This slide analyzes the contributions of different countries to Greece's tourist arrivals and receipts in 2021, highlighting key markets like Germany, France, and the UK.
Tourist arrivals, receipts, market segmentation, country comparison, bar charts
false
Customer and Market Segmentation
Hospitality & Tourism
Multiple Chart
EY
Add to my slides
Remove from favorites
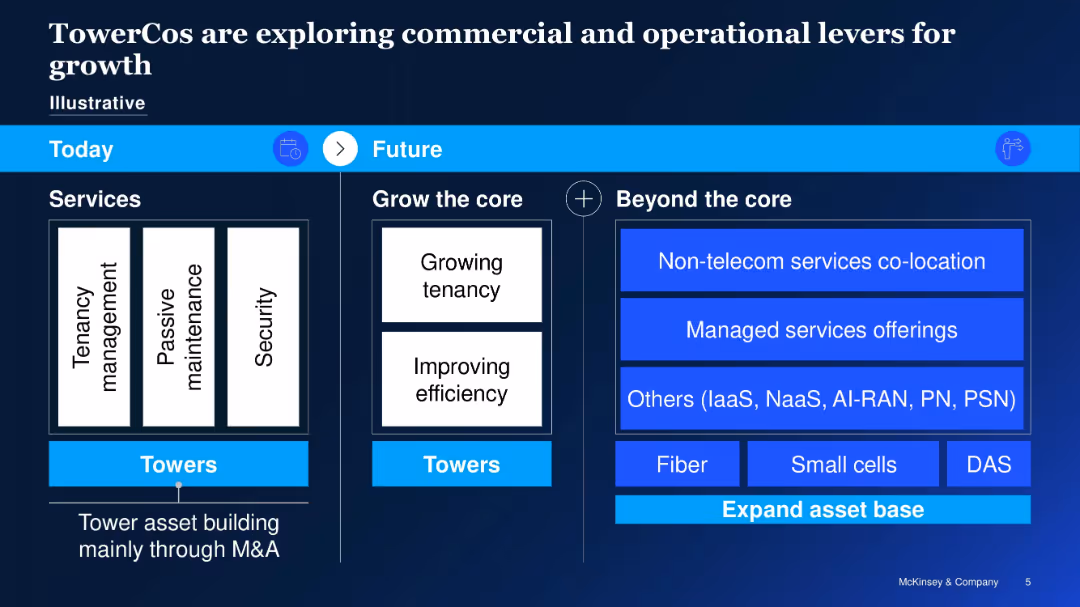
Side-by-side "Today vs Future" layout; organized boxes to show services and strategy evolution
Operational Efficiency
Telecommunications
Shows strategic roadmap for tower companies, from M&A-focused asset building to broader growth through tenancy, efficiency, and expansion into new services like managed services and small cells.
TowerCos, strategy, operations, future growth, tenancy, fiber, DAS, small cells, managed services
false
Operational Efficiency
Telecommunications
Table
McKinsey
Add to my slides
Remove from favorites
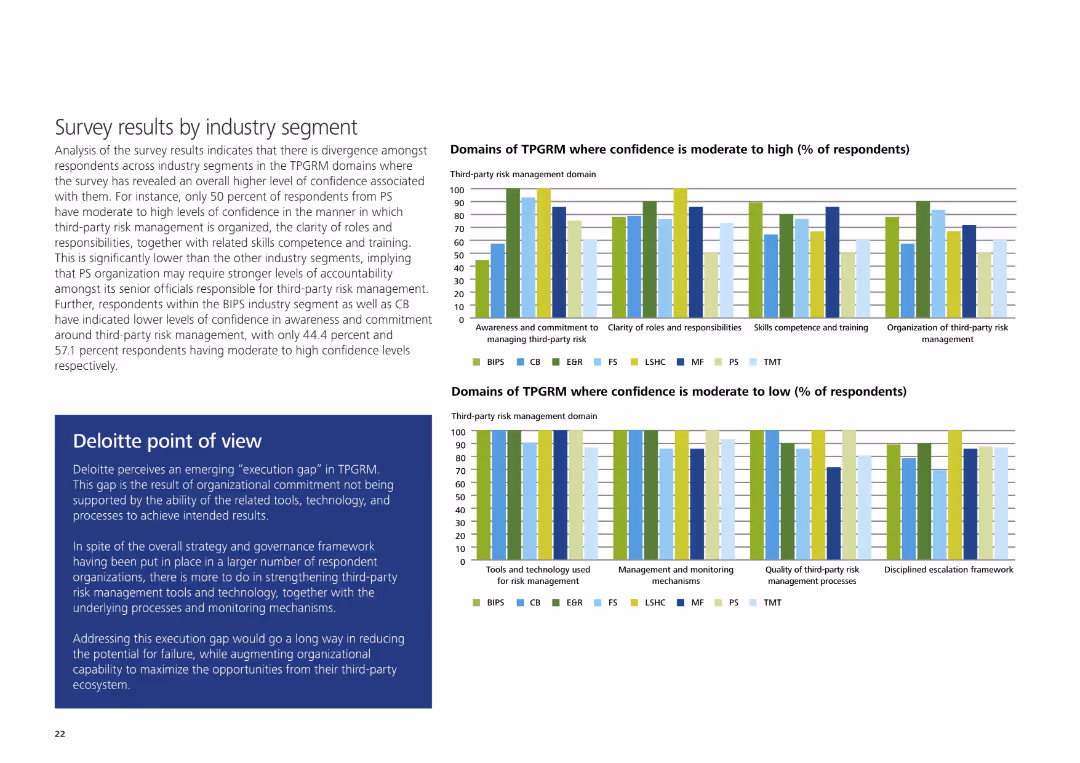
The slide contains two sets of column charts comparing domains of TPGRM with moderate to high and moderate to low confidence levels, alongside Deloitte's POV.
Risk Assessment and Management
Professional Services
It shows survey results indicating confidence levels in various TPGRM domains across industries and includes Deloitte's perspective on closing the execution gap in third-party risk management.
TPGRM, confidence levels, third-party risk management, execution gap, Deloitte, survey
false
Risk Assessment and Management
Professional Services
Multiple Chart
Deloitte
Add to my slides
Remove from favorites
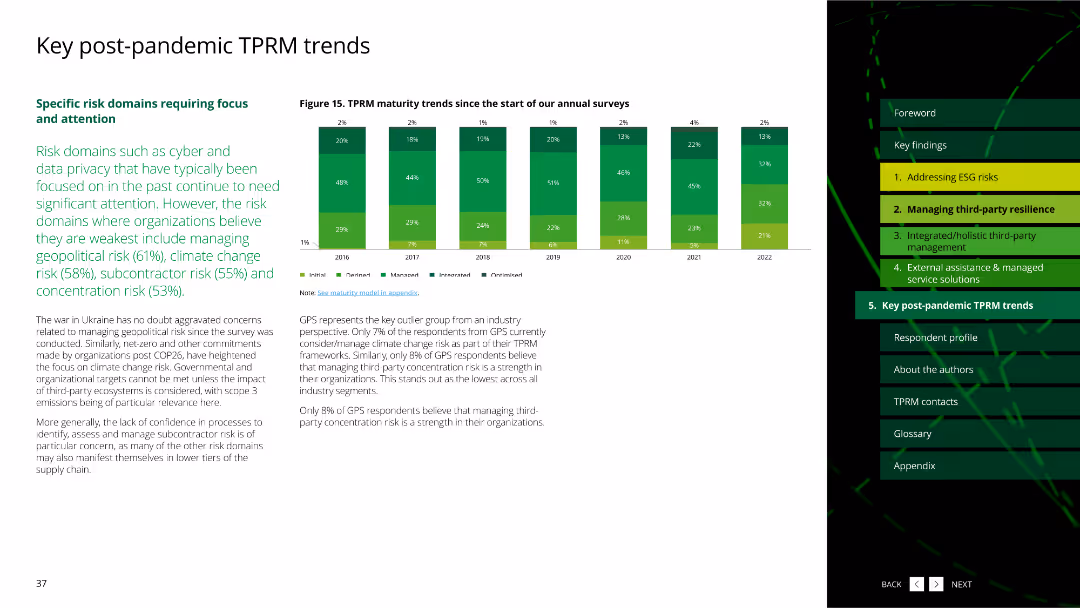
The slide features a column chart, tracking TPRM maturity trends since the start of annual surveys, with bars representing different maturity levels over the years.
Market Analysis and Trends
Professional Services
It presents trends in TPRM maturity, analyzing how organizations have progressed or regressed in their maturity levels from 2016 to 2022.
TPRM maturity trends, annual surveys, column chart, maturity levels, progression, professional services
false
Market Analysis and Trends
Professional Services
Mixed Chart
Deloitte
Add to my slides
Remove from favorites
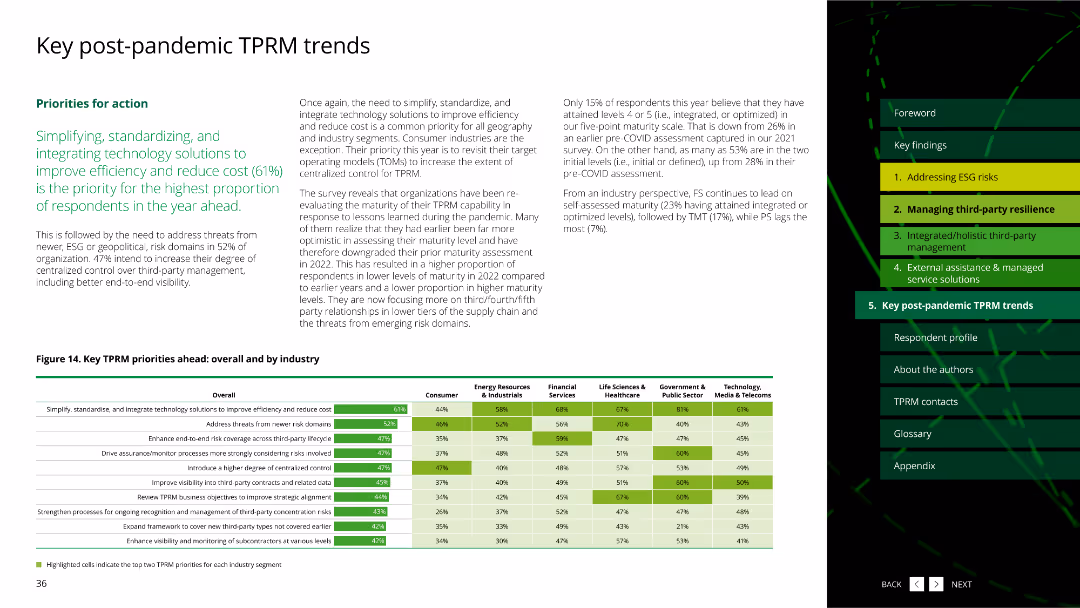
The slide includes a column chart and a detailed table, showing key TPRM priorities ahead by overall and by industry.
Market Analysis and Trends
Professional Services
It outlines the priorities for TPRM post-pandemic, focusing on simplifying, standardizing, and integrating technology solutions to improve efficiency and reduce costs.
TPRM priorities, post-pandemic, column chart, table, technology solutions, professional services
false
Market Analysis and Trends
Professional Services
Mixed Chart
Deloitte
Add to my slides
Remove from favorites
The slide features column charts about organizational priorities in widening the scope of TPRM into related areas.
Strategic Planning
Professional Services
This slide discusses the priorities of organizations in expanding third-party risk management to related functional areas.
TPRM, priorities, scope, functional areas, survey
false
Strategic Planning
Professional Services
Multiple Chart
Deloitte
Add to my slides
Remove from favorites
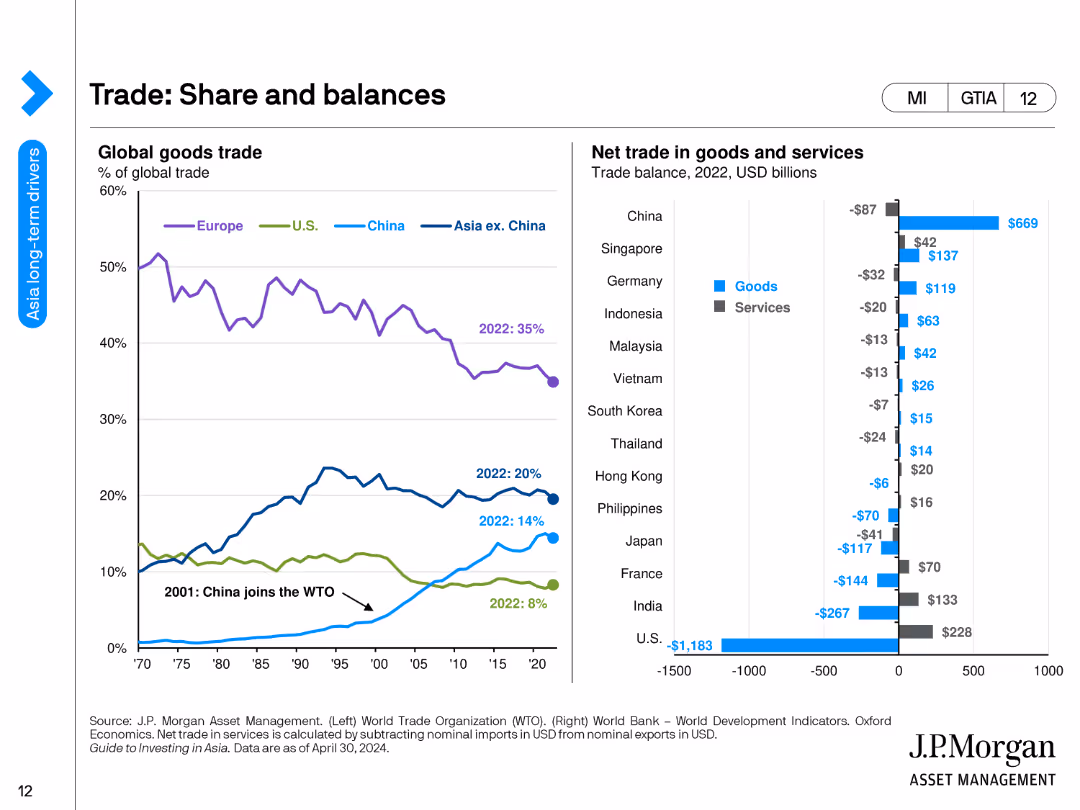
A line chart showing global goods trade share by region and a bar chart showing the net trade in goods and services for various countries.
Market Analysis and Trends
Financial Services
The slide illustrates the share of global goods trade by different regions over time and the net trade balances in goods and services for selected countries in 2022.
trade balance, global trade, goods, services, economic analysis, regions, countries, financial trends, net trade, development
false
Market Analysis and Trends
Financial Services
Multiple Chart
JP Morgan
Add to my slides
Remove from favorites
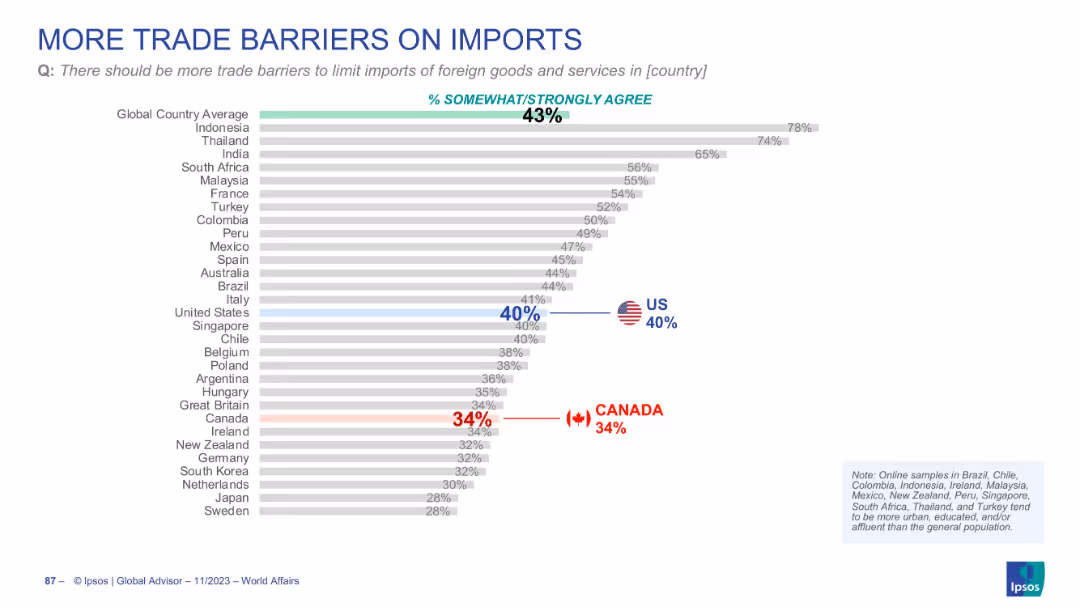
Horizontal bar chart showing agreement with imposing trade barriers
Strategic Planning
Government & Public Sector
This slide presents opinions on the need for more trade barriers. The global average is 43%, with the US slightly below (40%) and Canada even lower at 34%.
trade barriers, imports, protectionism, globalization, national economy
false
Strategic Planning
Government & Public Sector
Single Chart
IPSOS
Add to my slides
Remove from favorites
Contains a line graph depicting the increase in trade-restrictive measures over time, complemented by bullet points discussing the challenges facing free trade agreements, including political and social influences.
Risk Assessment and Management
Financial Services
Focuses on the increasing challenges to global free trade, including political impacts and restrictive measures. Valuable for risk assessment in international markets and strategic planning sessions.
trade, challenges, agreements, restrictions
false
Risk Assessment and Management
Financial Services
Multiple Chart
Roland Berger
Add to my slides
Remove from favorites
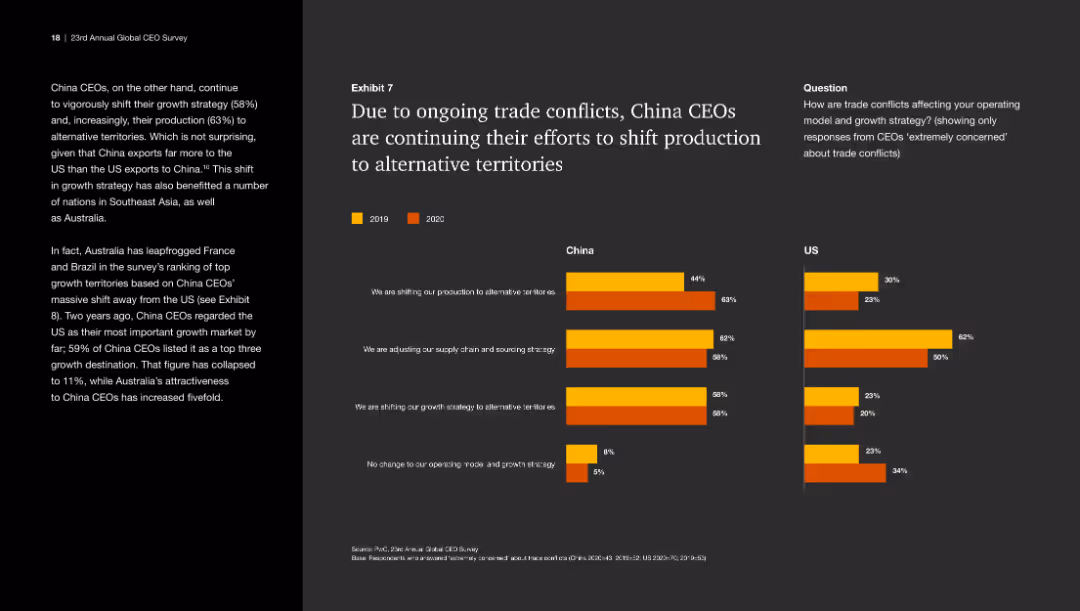
Features bar charts comparing the responses of China and US CEOs regarding adjustments due to trade conflicts. The data is neatly organized, with each response category color-coded for quick reference and comparison.
Risk Assessment and Management
Financial Services
This slide compares the strategic responses of CEOs in China and the US to trade conflicts, highlighting shifts in production and supply chain strategies. It is useful for assessing the impact of geopolitical risks on business strategies.
Trade conflicts, CEO strategies, Production shift, Supply chain adjustments, Geopolitical impact, Market strategy
false
Risk Assessment and Management
Financial Services
Multiple Chart
PwC/Strategy&
Add to my slides
Remove from favorites
The slide utilizes column charts to depict strategies adopted by CEOs in response to trade conflicts, complemented by a powerful quote on the right side for emphasis.
Investment Analysis
Financial Services
It explores how trade conflicts influence corporate strategies, pertinent to investment risk analysis and global strategy planning sessions.
trade conflicts, CEO strategy, supply chain, CAPEX, FDI, corporate strategy, investment risk analysis.
false
Investment Analysis
Financial Services
Mixed Chart
PwC/Strategy&
Add to my slides
Remove from favorites
This slide includes a bar chart comparing responses from China and US CEOs in 2019 and 2020. The bar chart uses different colors to represent the years and is moderately complex.
Risk Assessment and Management
Industrial & Manufacturing
The slide discusses how trade conflicts are influencing China CEOs to shift production to alternative territories and adjust supply chain strategies.
Trade conflicts, production shift, China CEOs, US CEOs, supply chain
false
Risk Assessment and Management
Industrial & Manufacturing
Multiple Chart
PwC/Strategy&
Add to my slides
Remove from favorites
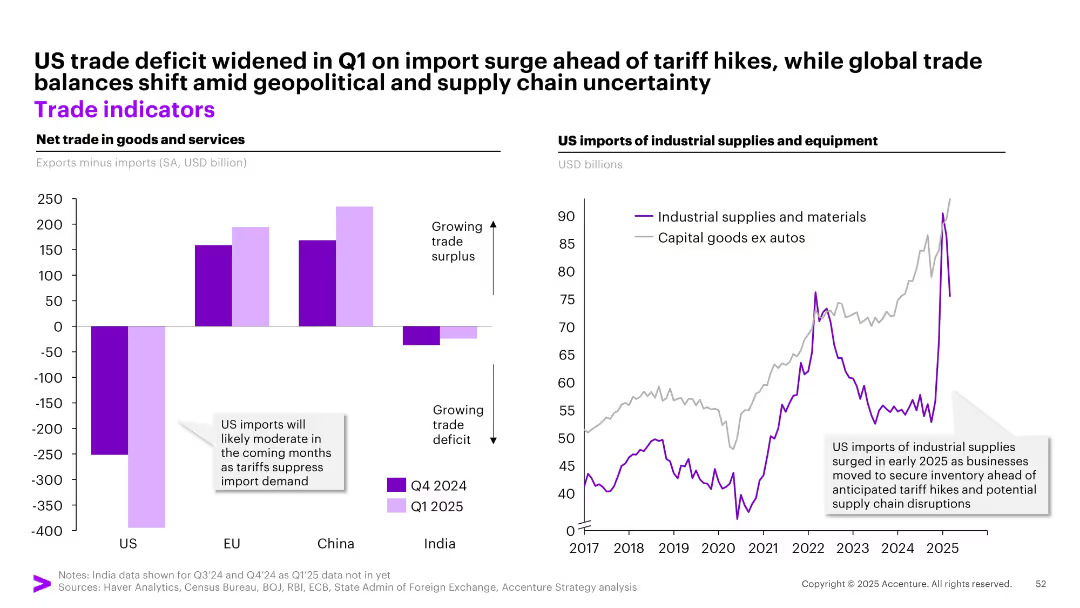
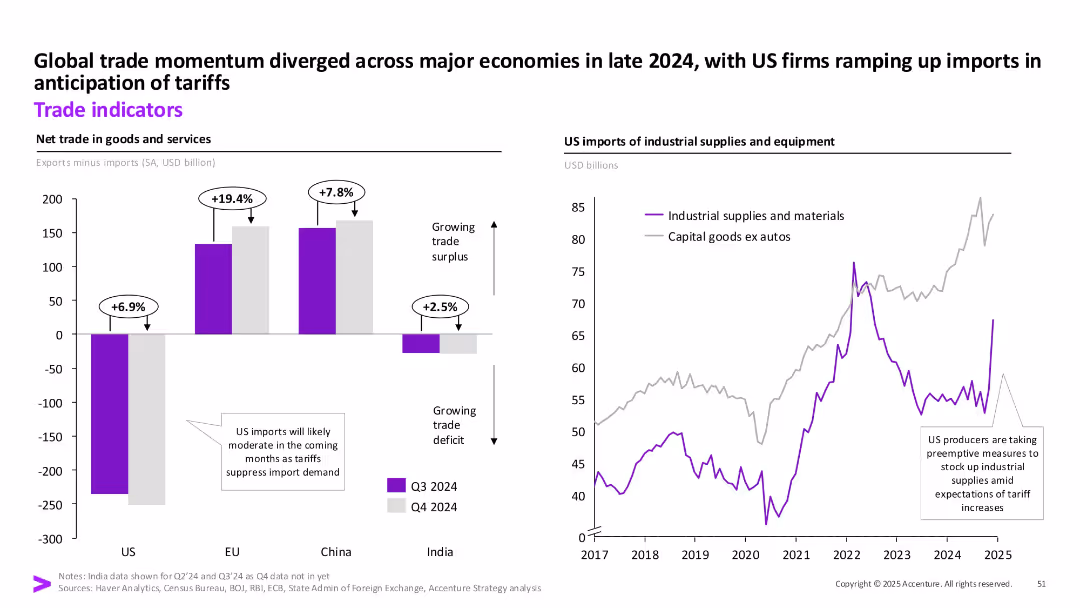
Dual-panel chart: left = net trade by region (bar chart), right = US imports of industrial supplies (line chart)
Market Analysis and Trends
Transportation & Logistics
This slide shows the widening US trade deficit in early 2025 due to an import surge ahead of tariff hikes, while other regions like China and EU maintain trade surpluses. It also depicts a rise in US industrial supply imports, driven by businesses stockpiling before anticipated tariff impacts.
trade deficit, US imports, industrial supplies, tariffs, supply chain, global trade
false
Market Analysis and Trends
Transportation & Logistics
Multiple Chart
Accenture
Add to my slides
Remove from favorites
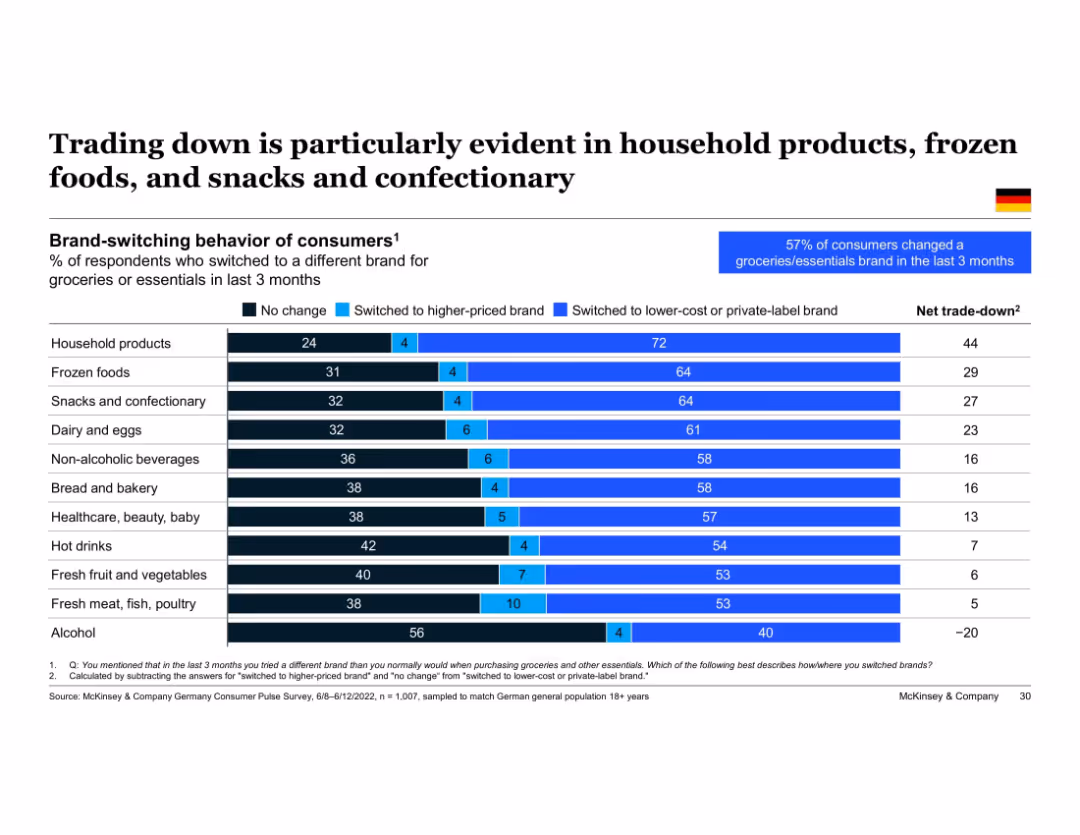
Horizontal bar chart showing brand-switching trends across product categories; dark blue (no change), light blue (switch down), and medium blue (switch up) bars; Germany focus
Product and Service Analysis
Retail & E-commerce
Consumers are switching to lower-cost or private-label brands, especially in household products and food categories. The slide quantifies net "trade-down" behaviors, with the strongest trend seen in household products and frozen food. Alcohol shows the opposite pattern with a net trade-up.
trade-down, brand switching, private label, frozen food, snacks, household products, consumer behavior, Germany
false
Product and Service Analysis
Retail & E-commerce
Single Chart
McKinsey
Add to my slides
Remove from favorites
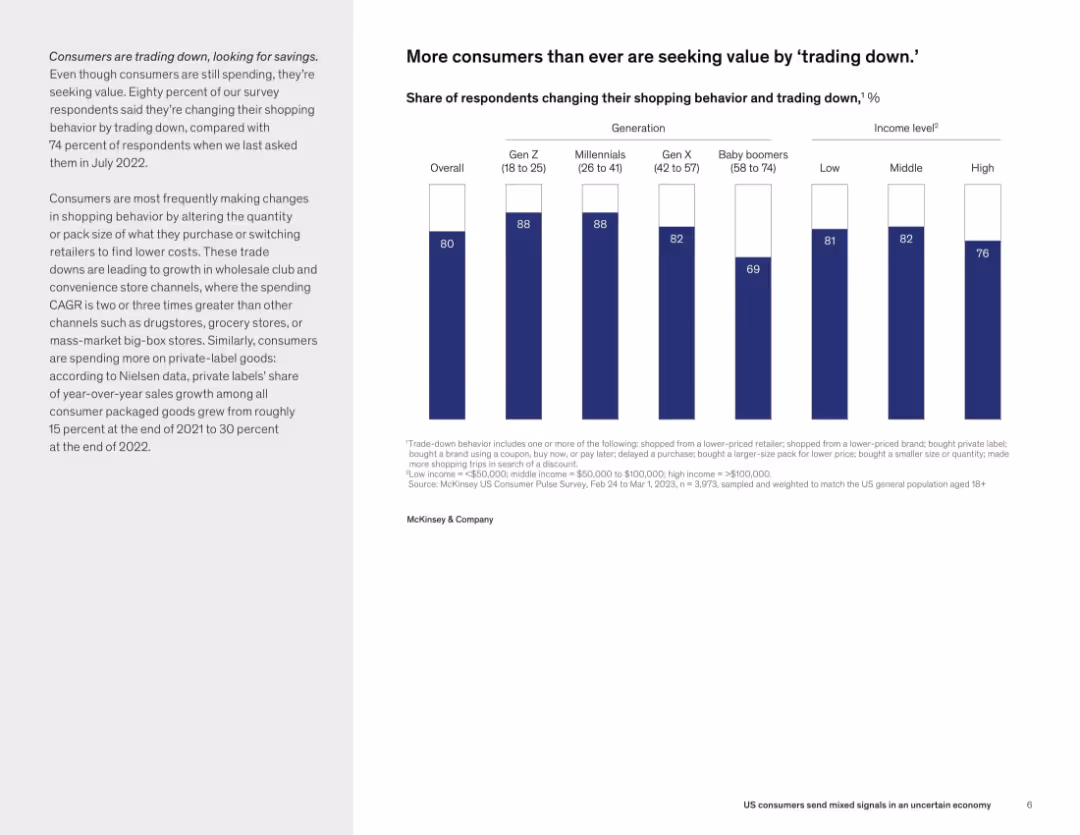
Text on left and bar chart on right showing percentage of respondents changing behavior by generation and income level.
Customer and Market Segmentation
Consumer Goods
80% of respondents report altering their shopping habits to save money—primarily by switching brands or buying smaller packs. Gen Z and millennials lead this trend, indicating a wide adoption of cost-saving behaviors across demographics.
trade down, consumer behavior, savings, Gen Z, income level, shopping trends, private label
false
Customer and Market Segmentation
Consumer Goods
Mixed Chart
McKinsey
Add to my slides
Remove from favorites
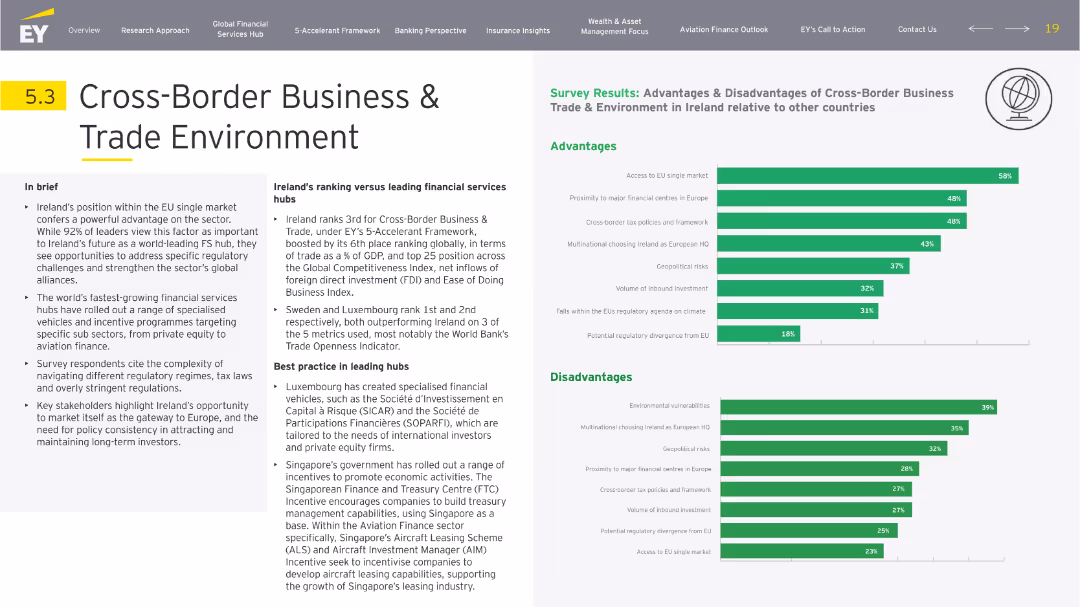
Left-aligned textual brief and narrative with right-side bar chart visualization for advantages and disadvantages. Neutral tones and thematic icons frame the content.
Market Analysis and Trends
Financial Services
Highlights Ireland’s strategic EU positioning and global trade ranking. The slide provides a comparative view of Ireland’s cross-border appeal, citing regulatory and tax frameworks. Singapore and Luxembourg are given as benchmarks. Survey bars emphasize market access and regulatory concerns.
trade, EU market, regulation, FDI, tax policy, global business
false
Market Analysis and Trends
Financial Services
Multiple Chart
EY
Add to my slides
Remove from favorites
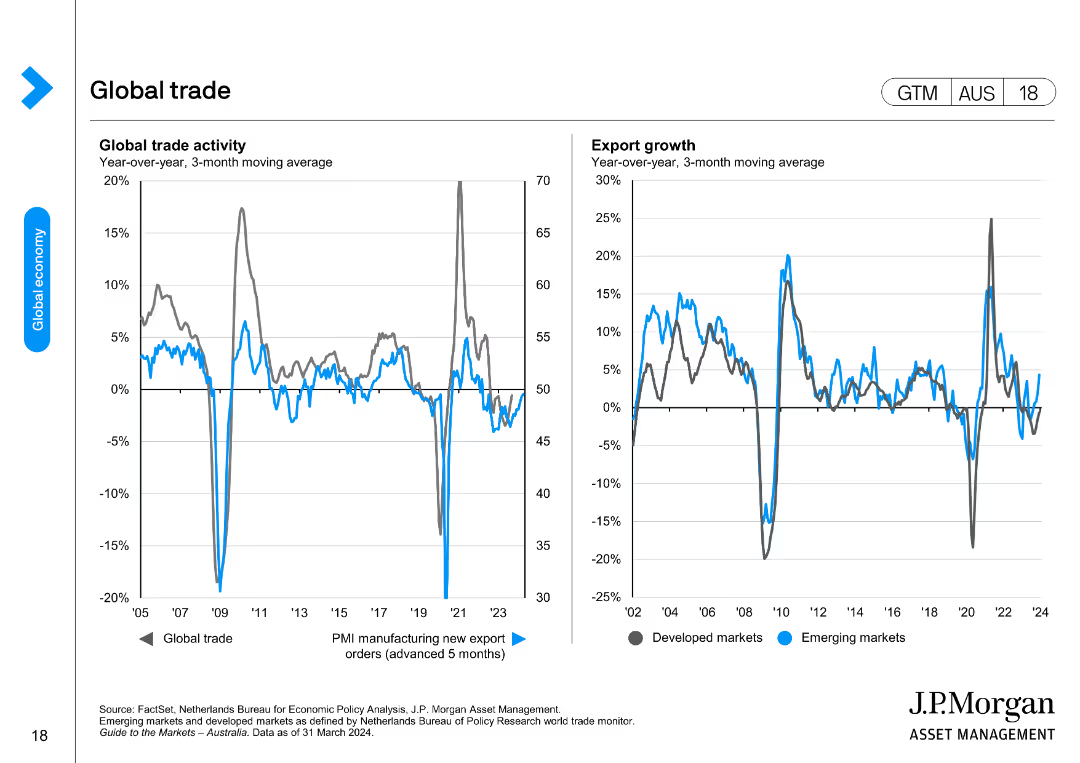
The slide features two line charts. The left chart shows global trade activity year-over-year percentage change and the PMI manufacturing new export orders. The right chart displays export growth rates for developed and emerging markets from 2002 to 2024.
Market Analysis and Trends
Transportation & Logistics
This slide analyzes global trade activity and export growth trends, useful for understanding international trade dynamics and economic conditions in both developed and emerging markets.
Trade, Export, Growth, Global, Markets
false
Market Analysis and Trends
Transportation & Logistics
Multiple Chart
JP Morgan
Add to my slides
Remove from favorites
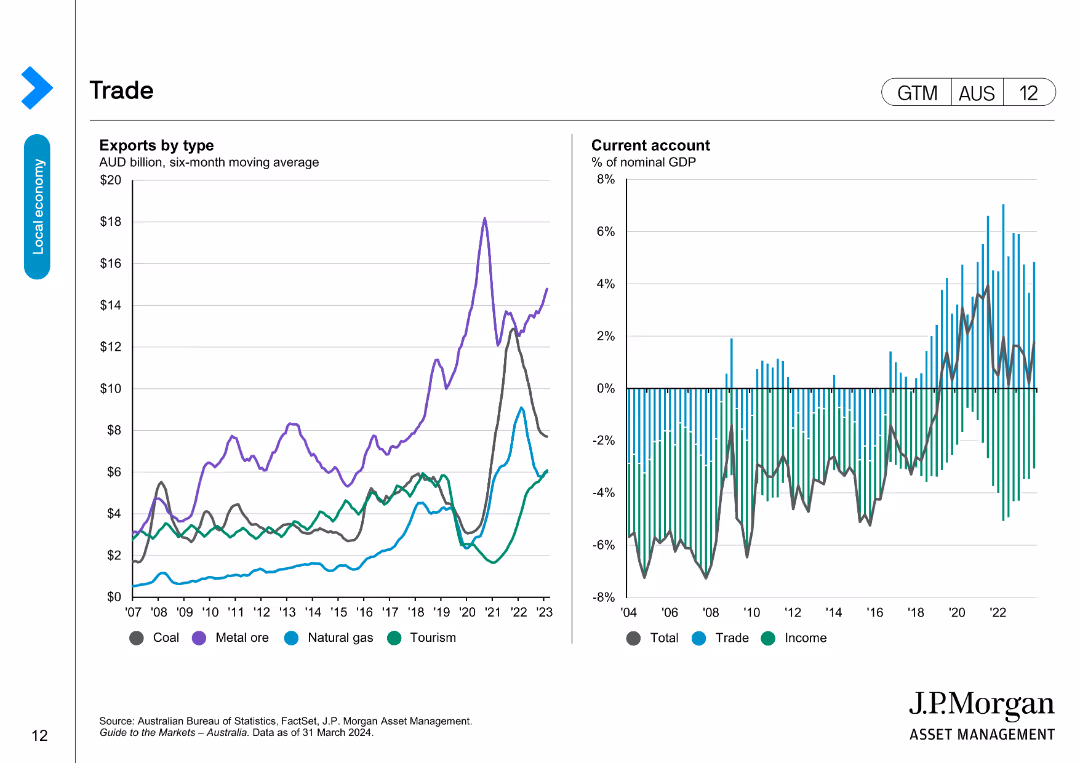
This slide features two line charts: one on exports by type (coal, metal ore, natural gas, tourism) and the other on the current account as a percentage of GDP.
Market Analysis and Trends
Financial Services
Provides an analysis of trade trends, including export types and current account performance relative to GDP, useful for understanding trade dynamics.
trade, exports, current account, GDP, economic analysis
false
Market Analysis and Trends
Financial Services
Multiple Chart
JP Morgan
Add to my slides
Remove from favorites
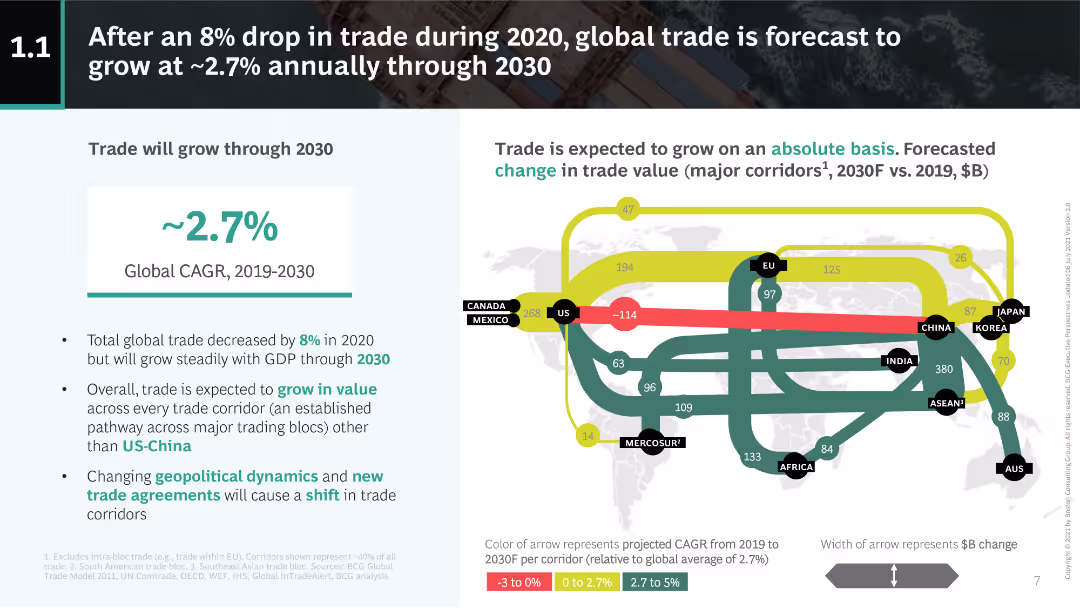
The slide contains a combination of text and a complex chart. The chart uses colored arrows to show trade value changes between regions. Simple and informative design with moderate complexity.
Market Analysis and Trends
Transportation & Logistics
The slide discusses the growth forecast for global trade post-2020, highlighting an expected CAGR of 2.7%. It includes details about trade value changes across major corridors and geopolitical impacts.
trade, forecast, CAGR, global trade, geopolitical
false
Market Analysis and Trends
Transportation & Logistics
Boxed
BCG
Add to my slides
Remove from favorites
Includes a world map showing global trade flows with a focus on intraregional and interregional exports. Regions are differentiated by color with accompanying pie charts indicating the percentage share of trade.
Market Analysis and Trends
Financial Services
Offers a visual summary of global and regional trade flows, highlighting the importance of intraregional trade. Useful in discussions on global market dynamics and international trade policies.
trade, global, regional, exports, integration
false
Market Analysis and Trends
Financial Services
Multiple Chart
Roland Berger
Add to my slides
Remove from favorites
Features column charts showing inter- and intraregional merchandise export growth from 2000 to 2016 for various regions. The charts are color-coded to distinguish between years and include percentage changes.
Market Analysis and Trends
Financial Services
Provides an analysis of growth in merchandise exports over 16 years, segmented by region. Key for evaluating market trends and developing regional trade strategies.
trade, growth, exports, regional, interregional
false
Market Analysis and Trends
Financial Services
Graphic
Roland Berger
Add to my slides
Remove from favorites
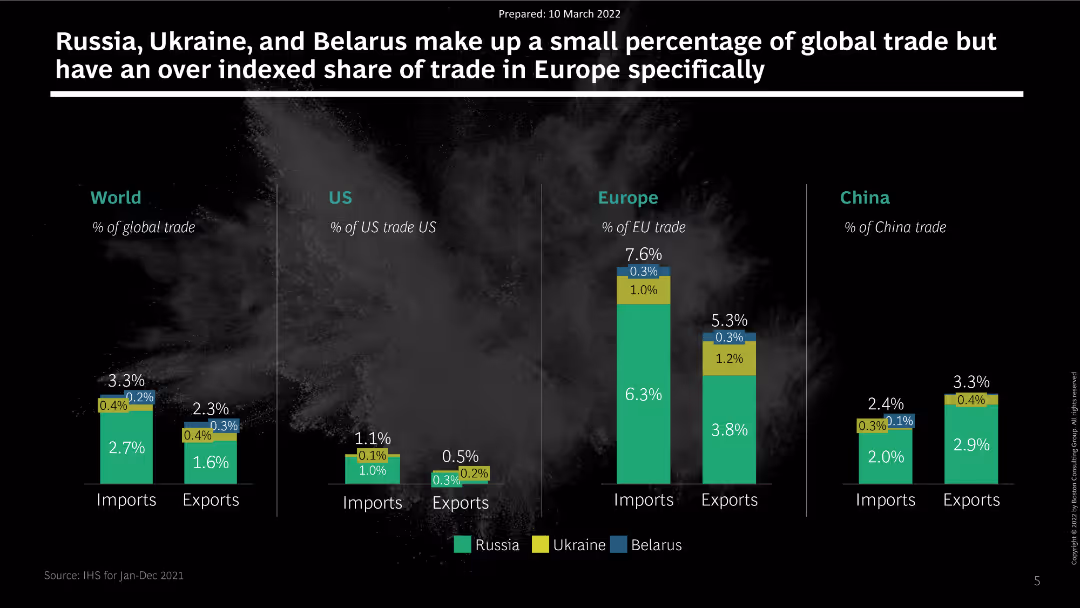
The slide features a series of column charts comparing the trade impact of Russia, Ukraine, and Belarus across different regions: World, US, Europe, and China. Each chart displays percentage shares of imports and exports.
Market Analysis and Trends
Transportation & Logistics
The slide analyzes the trade impact of Russia, Ukraine, and Belarus on global trade, particularly focusing on their over-indexed share of trade in Europe. It presents data on import and export percentages for various regions, highlighting significant dependencies.
trade, impact, Russia, Ukraine, Belarus, Europe, imports, exports
false
Market Analysis and Trends
Transportation & Logistics
Multiple Chart
BCG
Add to my slides
Remove from favorites
Two-panel visual: Left bar chart shows net trade in goods/services by region; Right line chart shows US imports of industrial supplies and equipment.
Market Analysis and Trends
Transportation & Logistics
The slide highlights shifts in trade balances and a sharp rise in US imports of industrial goods in late 2024, driven by preemptive action against anticipated tariff hikes. The chart compares Q3 and Q4 trade flows globally.
trade, imports, tariffs, industrial supplies, net trade, US, Q4 2024
false
Market Analysis and Trends
Transportation & Logistics
Multiple Chart
Accenture
Add to my slides
Remove from favorites
This slide is text-heavy with a blue and white color palette. It contains flowcharts depicting the life cycle of a vanilla interest rate swap trade. The slide is labeled number 6.
Operational Efficiency
Financial Services
It outlines the process of a vanilla interest rate swap trade and its risk management, emphasizing the complexities in regulatory environments and the need for efficient technology in finance.
trade lifecycle, interest rate swap, risk management, regulation, technology
false
Operational Efficiency
Financial Services
Table
Goldman Sachs
Add to my slides
Remove from favorites
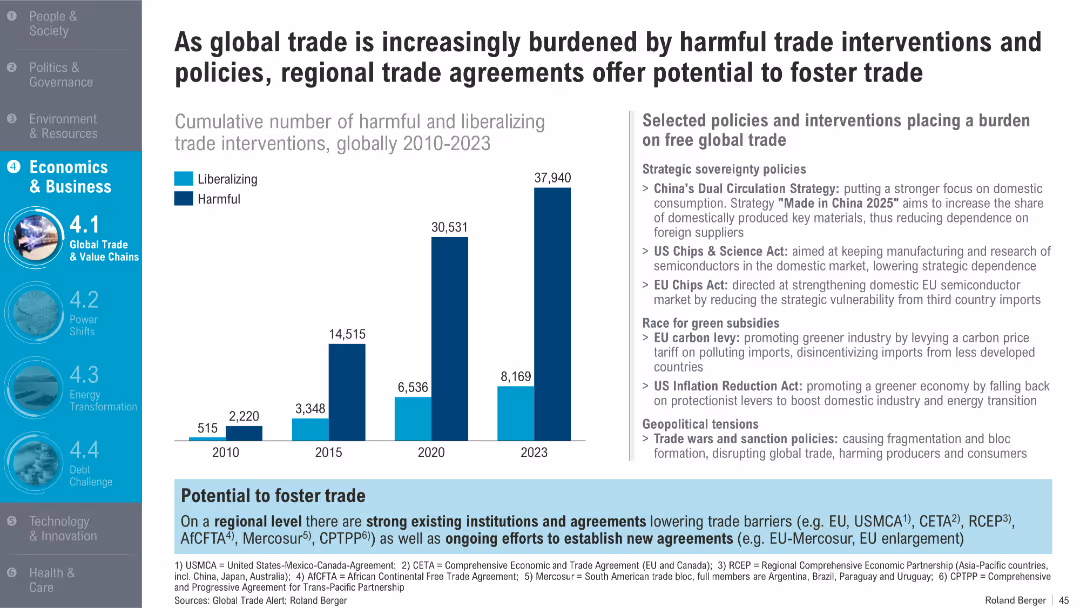
Bar chart tracking harmful vs liberalizing trade policies from 2010–2023; right sidebar with policy examples and regional efforts
Regulatory and Compliance
Financial Services
The slide examines the rise in harmful trade policies over time, far outpacing liberalizing measures. It attributes this to strategic sovereignty policies, green subsidies, and geopolitical tensions while suggesting that regional trade agreements could counteract these burdens.
trade policy, interventions, tariffs, liberalization, trade barriers, sovereignty, WTO
false
Regulatory and Compliance
Financial Services
Mixed Chart
Roland Berger
Add to my slides
Remove from favorites
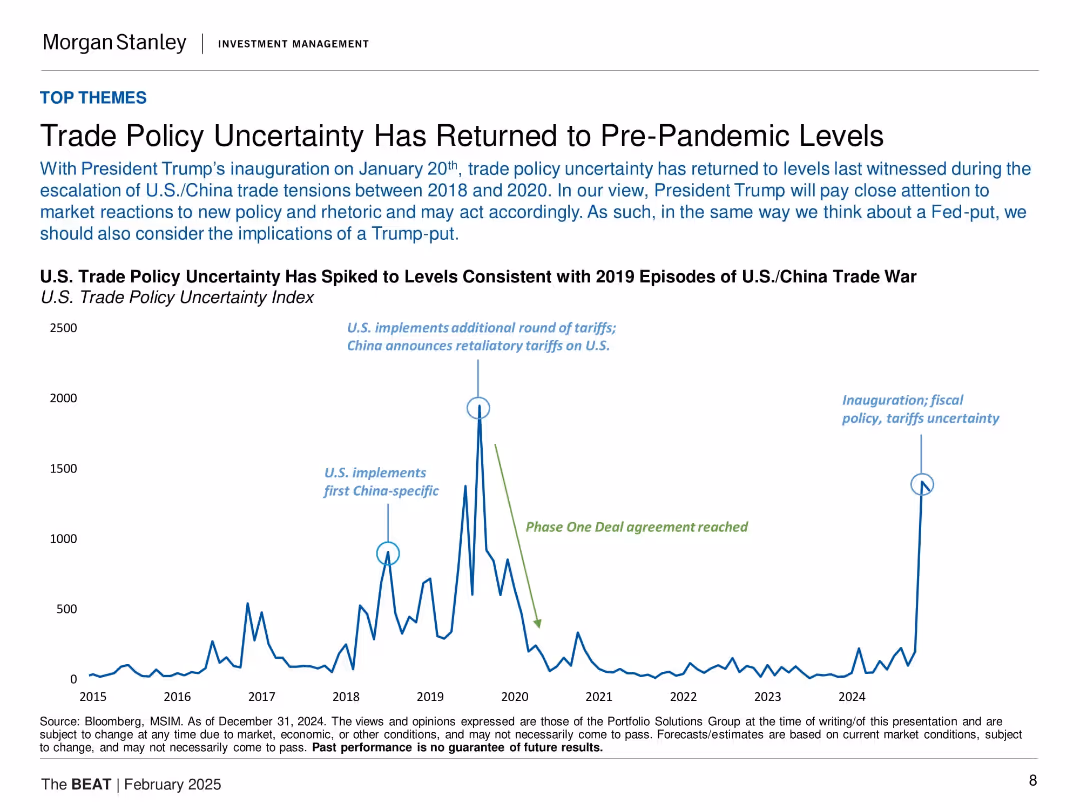
Time-series line chart (2015–2024) showing spikes in U.S. trade policy uncertainty with annotated historical events.
Risk Assessment and Management
Government & Public Sector
This slide discusses the sharp rise in U.S. trade policy uncertainty back to levels seen during the 2018–2020 U.S./China trade war. It attributes this to the inauguration of President Trump and renewed tariff-related concerns. The slide includes key events like tariff announcements and agreements, indicating a re-escalation in policy risks for investors and global markets.
trade policy, tariffs, Trump, uncertainty, U.S.-China, inauguration, risk, market volatility, economic policy
false
Risk Assessment and Management
Government & Public Sector
Single Chart
Morgan Stanley
Add to my slides
Remove from favorites
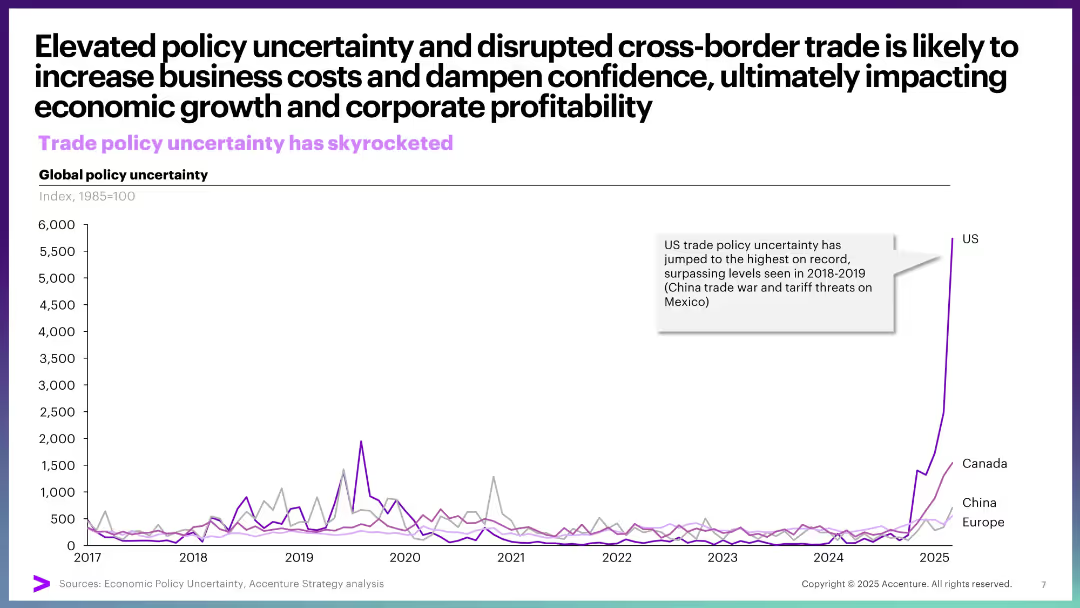
Single line graph showing global policy uncertainty from 2017–2025, with steep rise in US uncertainty in 2025. Clean, focused design with large title and sidebar annotation.
Risk Assessment and Management
Financial Services
This slide demonstrates the surge in US trade policy uncertainty, particularly in 2025, surpassing previous peaks from past trade conflicts. It connects uncertainty to potential risks for economic growth and corporate profits.
trade policy, uncertainty, US, cross-border trade, economic risk, tariffs, business cost, confidence, disruption
false
Risk Assessment and Management
Financial Services
Single Chart
Accenture
Add to my slides
Remove from favorites
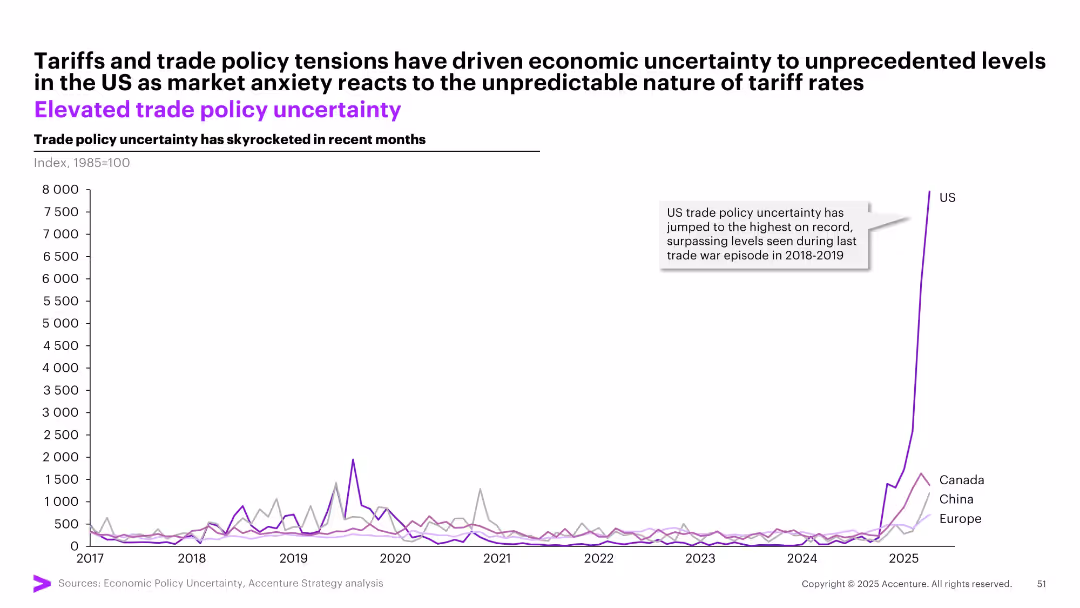
Single line chart showing trade policy uncertainty index from 2017 to 2025 for US, Canada, China, and Europe; sharp spike in US
Risk Assessment and Management
Government & Public Sector
This slide tracks trade policy uncertainty, with the US showing a historic spike in 2025—exceeding even 2018–19 trade war levels. The rise highlights market anxiety and unpredictability around tariff actions, signaling significant risk to investment and trade decisions.
trade policy, uncertainty, US, tariffs, risk, global markets, economic anxiety
false
Risk Assessment and Management
Government & Public Sector
Single Chart
Accenture
Add to my slides
Remove from favorites
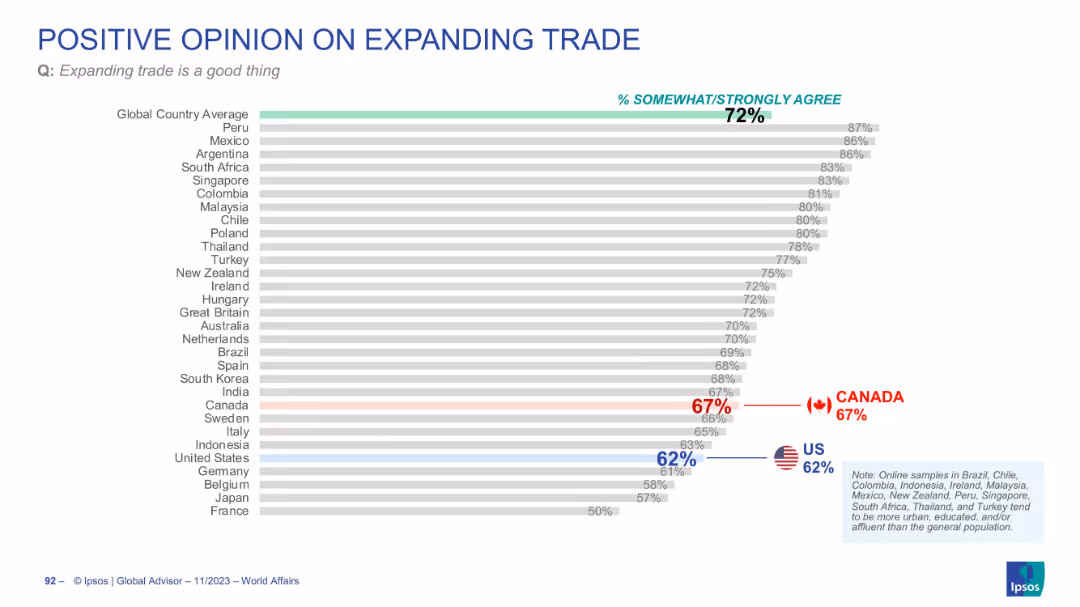
Horizontal bar chart showing country rankings based on agreement with the statement that expanding trade is a good thing; global average and specific countries (Canada, US) highlighted with color; clean layout and muted tones.
Market Analysis and Trends
Financial Services
This slide evaluates how people from different countries perceive expanding trade, with a global average of 72% in agreement. Peru, Mexico, and Argentina show the strongest support, while Canada is at 67% and the US at 62%. This indicates moderate support in North America compared to higher enthusiasm in LATAM and Asia.
trade, public opinion, Canada, US, global average, Ipsos, economic policy, bar chart, agreement levels, country ranking
false
Market Analysis and Trends
Financial Services
Single Chart
IPSOS
Add to my slides
Remove from favorites
Multiple line charts detailing the trade volume with Russia and the impact of geopolitical events.
Strategic Planning
Transportation & Logistics
Analyzes the shift in trade and corporate strategy in response to geopolitical tensions involving Russia.
Trade, Russia, Geopolitical, Strategy, Logistics, Transportation, Volume, Impact
false
Strategic Planning
Transportation & Logistics
Multiple Chart
PwC/Strategy&
Add to my slides
Remove from favorites
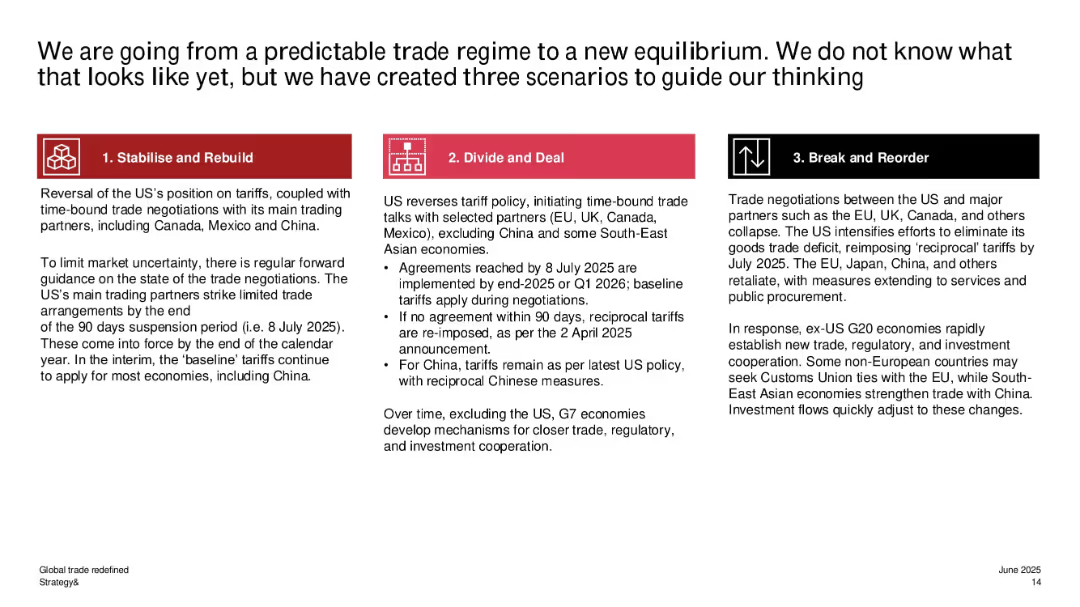
Three-column layout describing future scenarios with icons and color-coded headers; concise text boxes outline "Stabilise and Rebuild", "Divide and Deal", and "Break and Reorder".
Strategic Planning
Government & Public Sector
This slide presents three possible future scenarios for global trade following tariff changes: a cooperative rebuilding path, selective bilateral deals, or a breakdown in negotiations. Each scenario forecasts differing levels of economic cooperation and disruption.
trade scenarios, tariff policy, strategic outlook, Stabilise and Rebuild, Divide and Deal, Break and Reorder, economic cooperation, geopolitical risk
false
Strategic Planning
Government & Public Sector
Linear Flow
PwC/Strategy&
Add to my slides
Remove from favorites
Line chart showing Trade Services Vacancy Rate from FY18 to FY21 for blended, full-time, and part-time positions. A table comparing these rates across the years. Findings in text boxes.
Market Analysis and Trends
Government & Public Sector
Addresses the rise in trade services vacancy rates post-COVID, detailing the impact on service costs and operational capacity. Highlights the need for improved management and transformation.
trade services, vacancy rates, COVID-19 impact, operational capacity, service costs, management, transformation
false
Market Analysis and Trends
Government & Public Sector
Mixed Chart
Alvarez & Marsal
Add to my slides
Remove from favorites
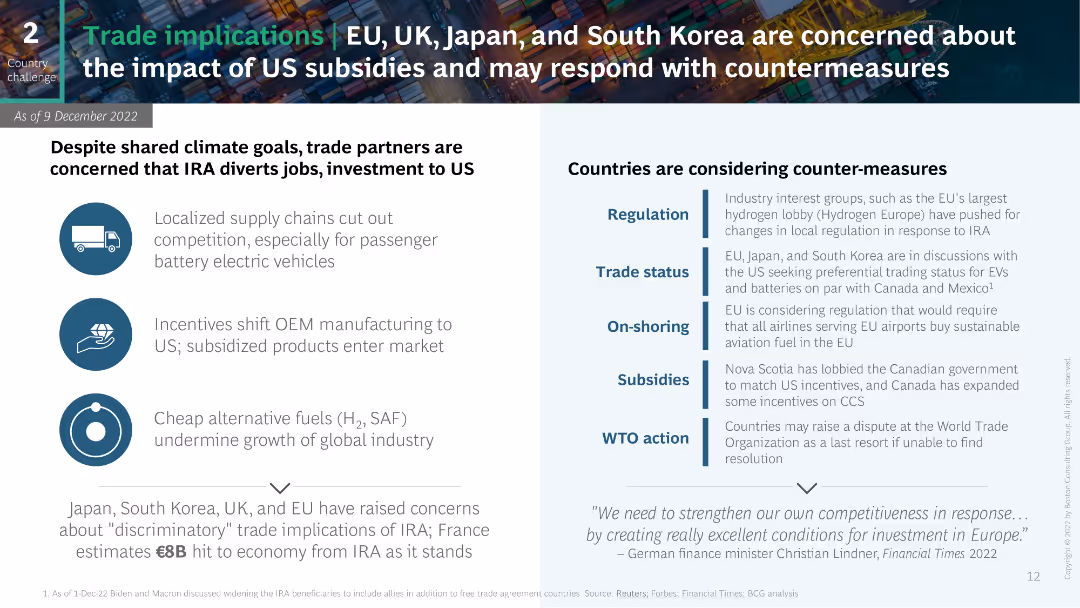
The slide features two columns with bullet points summarizing trade concerns and countermeasures. The left side lists the implications for various regions, while the right side provides potential responses, including regulation changes and WTO action. The layout is straightforward and text-focused.
Regulatory and Compliance
Energy & Utilities
This slide discusses the trade implications of US subsidies under the IRA for regions like the EU, UK, Japan, and South Korea, detailing potential countermeasures these countries might take in response to perceived trade disadvantages.
trade, subsidies, IRA, countermeasures, regulation
false
Regulatory and Compliance
Energy & Utilities
Boxed
BCG
Add to my slides
Remove from favorites
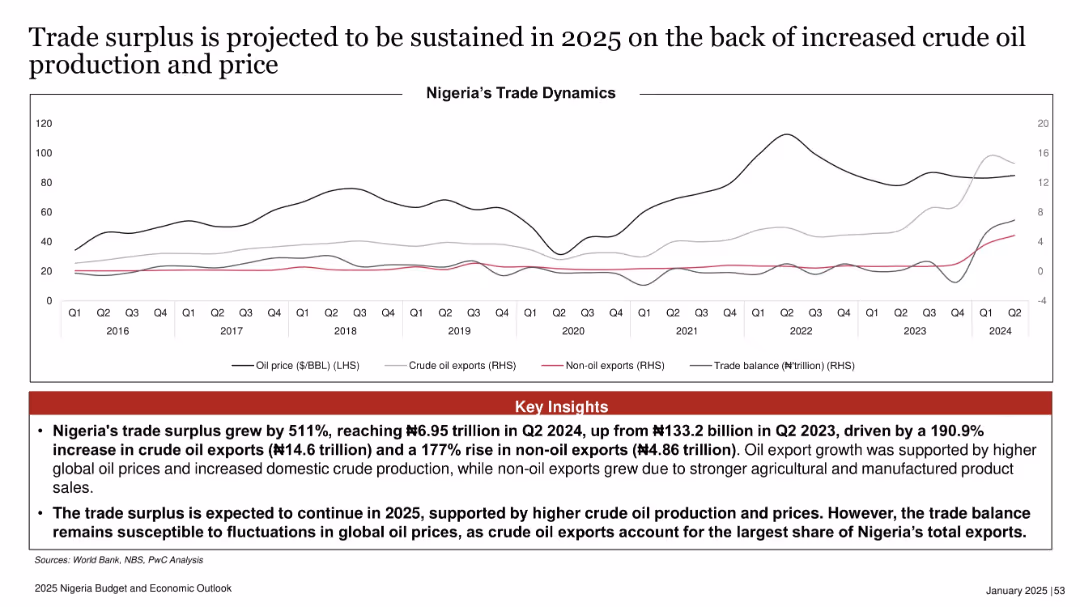
The slide includes a line chart showing Nigeria's trade dynamics, including crude oil exports, non-oil exports, and trade balance from Q1 2015 to Q3 2023. Key insights and outlooks discuss the potential sustainability and vulnerabilities of the trade surplus.
Market Analysis and Trends
Financial Services
This slide analyzes Nigeria's trade surplus, focusing on the increase in crude oil exports and the potential vulnerabilities due to international oil market volatility. It provides insights into the sustainability of the trade balance in the context of global oil trends.
trade surplus, crude oil exports, trade balance, market volatility, sustainability
false
Market Analysis and Trends
Financial Services
Mixed Chart
PwC/Strategy&
Add to my slides
Remove from favorites
Line graph tracking oil prices, crude/non-oil exports, and trade balance from 2016–2024. Summary insights in red box below.
Investment Analysis
Energy & Utilities
The slide illustrates Nigeria's rising trade surplus driven by increased oil production and prices, reaching ₦6.95 trillion in Q2 2024. It suggests continued surplus into 2025 while acknowledging vulnerability to oil price fluctuations.
trade surplus, oil exports, non-oil exports, crude production, 2025 outlook, Nigeria economy, oil prices
false
Investment Analysis
Energy & Utilities
Mixed Chart
PwC/Strategy&
Add to my slides
Remove from favorites
Two charts: one shows the share of US imports by country/region, and the other presents real interest rates by developed and emerging markets.
Market Analysis and Trends
Financial Services
This slide examines trade dynamics focusing on US import shares from various regions and compares real interest rates across developed and emerging markets. Used for trade analysis and economic policy review.
Trade, US imports, real interest rates, EM, DM
false
Market Analysis and Trends
Financial Services
Multiple Chart
JP Morgan
Add to my slides
Remove from favorites
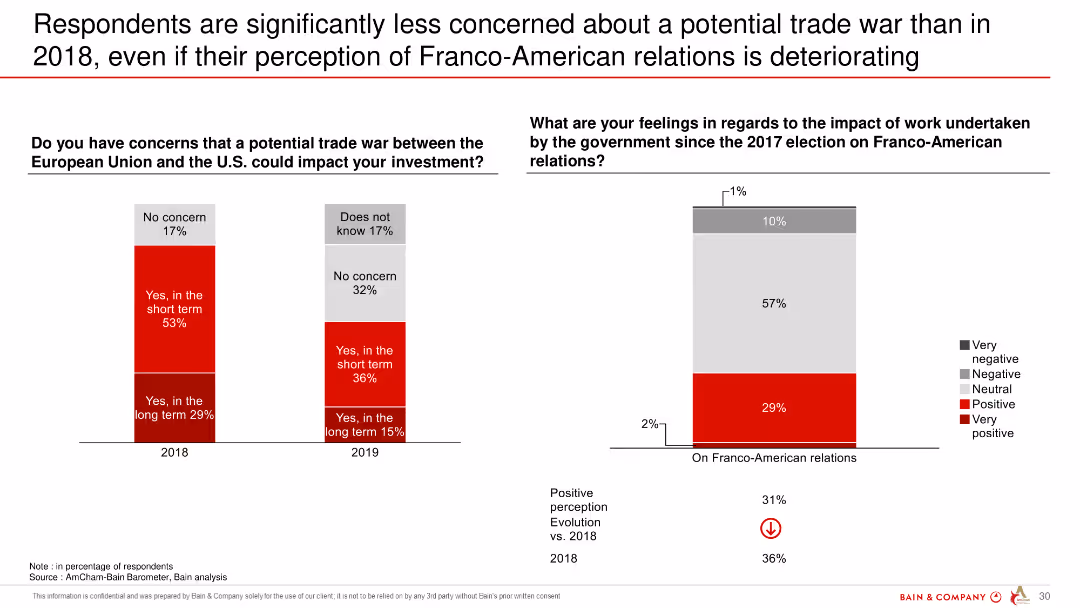
The slide displays two column charts. The left chart compares concerns about a trade war in 2018 and 2019, while the right chart shows respondents' feelings about Franco-American relations over the same period.
Market Analysis and Trends
Government & Public Sector
The slide shows a decrease in concerns about a trade war between the EU and the US from 2018 to 2019, despite worsening perceptions of Franco-American relations.
trade war, Franco-American relations, perceptions, EU, US, survey, comparison
false
Market Analysis and Trends
Government & Public Sector
Multiple Chart
Bain
Add to my slides
Remove from favorites
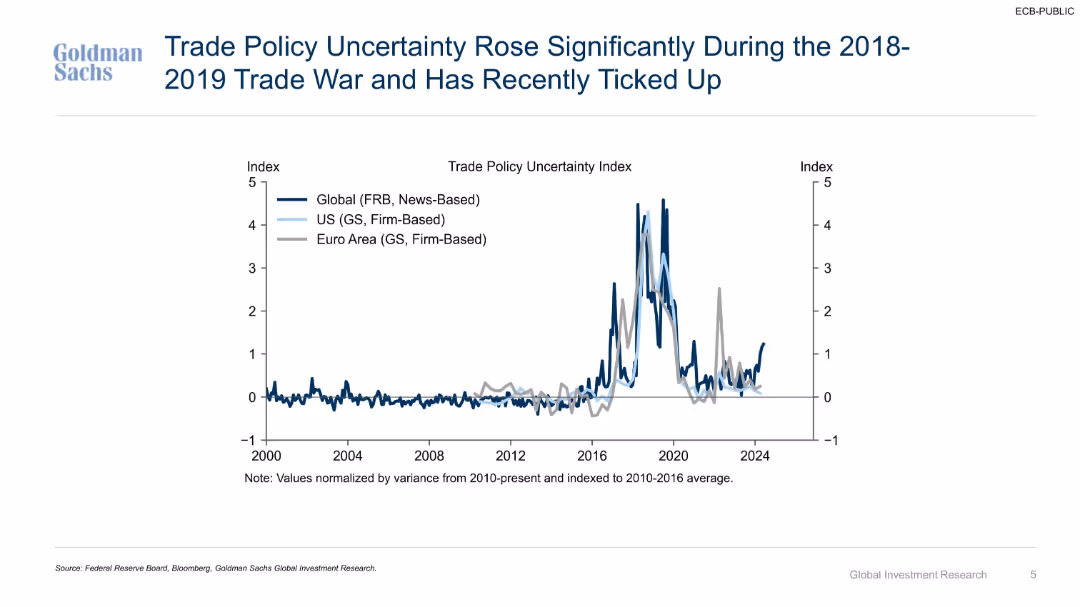
Time series line chart showing trade policy uncertainty indexes for global, U.S., and Euro Area from 2000–2024.
Risk Assessment and Management
Government & Public Sector
Tracks trade policy uncertainty using multiple indices, noting a major spike during the 2018–2019 trade war and a recent uptick. Demonstrates variance in global, U.S., and Euro Area trends over time.
trade war, uncertainty index, policy risk, historical trend, U.S., global, Euro Area, volatility, index analysis
false
Risk Assessment and Management
Government & Public Sector
Single Chart
Goldman Sachs
Add to my slides
Remove from favorites
Three bar charts comparing trading down, maintaining, and trading up behavior across product types.
Customer and Market Segmentation
Retail & E-commerce
Explores the trend of consumers trading down, especially in non-essential categories.
trading down, consumer trends, non-essentials, retail
false
Customer and Market Segmentation
Retail & E-commerce
Multiple Chart
Bain
Add to my slides
Remove from favorites
The slide includes a column chart showing the frequency of crypto asset trading among participants. Each column represents different trading frequencies.
Market Analysis and Trends
Financial Services
This slide displays the frequency at which participants traded crypto assets over the past year, ranging from daily to never.
Trading frequency, crypto, assets, participants, analysis
false
Market Analysis and Trends
Financial Services
Mixed Chart
IPSOS
Add to my slides
Remove from favorites
The slide features a central diagram with layered elements labeled "ALGORITHMS," "SMART ORDER ROUTERS," and "DIRECT MARKET ACCESS," representing a trading platform. Surrounding this are various inputs and outputs labeled with terms such as "Systematic Clients," "Fundamental Hedge Funds," and "Broker Dealers" on one side, and "External Liquidity" sources like "Exchanges" and "Dark Pools" on the other. The design is moderately complex with a focus on connectivity and flow between elements.
Market Analysis and Trends
Financial Services
The slide presents an overview of a trading platform's strength in execution within global markets. It details the systematic process from clients and funds through smart order routing and algorithms, to access various liquidity sources, both internal and external. This slide is likely used to explain how a trading platform integrates different market participants and liquidity sources to optimize trading execution.
Trading, Liquidity, Algorithms, Execution, Markets, Platform, Clients, Funds, Broker-Dealers, Exchanges
false
Market Analysis and Trends
Financial Services
Diagram
Goldman Sachs
Add to my slides
Remove from favorites
Line charts illustrate risk values over time. Complex visual with high detail, intended for a technically savvy audience.
Risk Assessment and Management
Financial Services
Explains trading risk metrics over time, essential for understanding market risk and investment decisions.
trading risk, market analysis, VaR, sVaR, investment decisions
false
Risk Assessment and Management
Financial Services
Single Chart
Deutsche Bank
Add to my slides
Remove from favorites
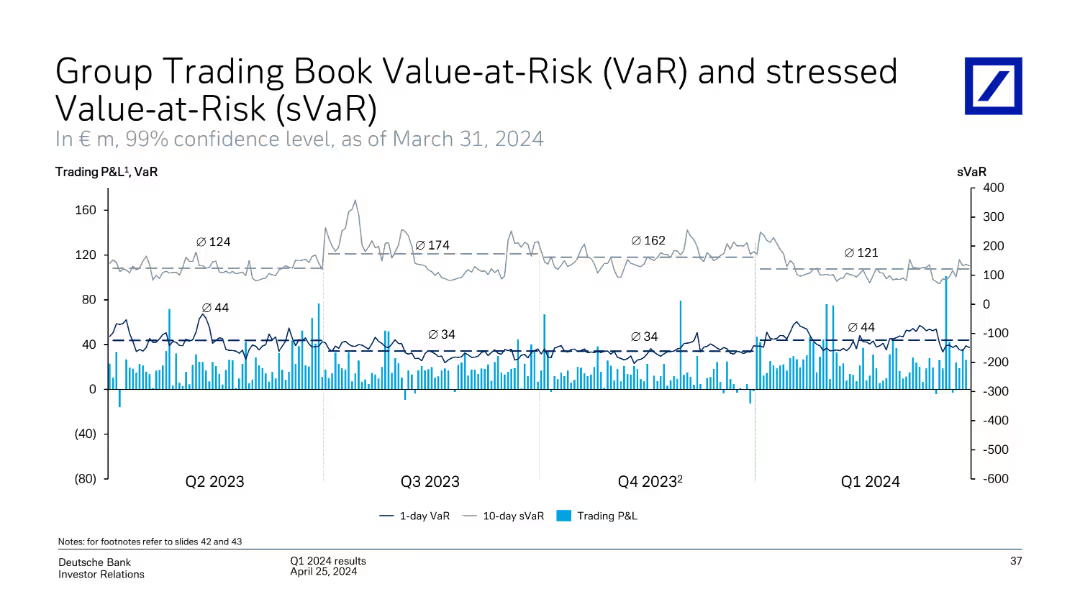
This slide features a line chart showing the Group Trading Book Value-at-Risk (VaR) and stressed VaR over four quarters, with additional details on trading P&L.
Risk Assessment and Management
Financial Services
Analyzes the trading book value-at-risk and stressed value-at-risk over time, including 1-day VaR, 10-day sVaR, and trading P&L figures for risk management.
trading, value-at-risk, VaR, sVaR, trading P&L, risk management, line chart
false
Risk Assessment and Management
Financial Services
Single Chart
Deutsche Bank
Add to my slides
Remove from favorites
This slide includes a line graph tracking the percentage change in marketing budgets over several periods, and an insights section with bullet points.
Market Analysis and Trends
Professional Services
Analyzes shifts in traditional advertising spend over recent months and projections, with sector-specific insights on how industries adapt their marketing strategies post-Covid.
traditional advertising, marketing spend, Covid-19, industry analysis, budget forecast
false
Market Analysis and Trends
Professional Services
Mixed Chart
Deloitte
Add to my slides
Remove from favorites
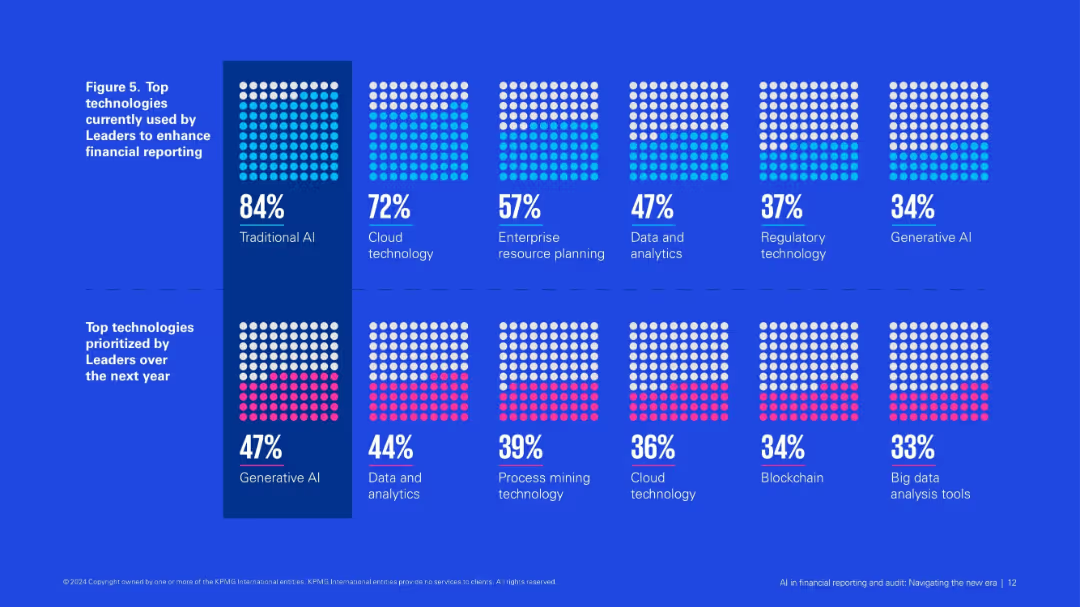
Grid of dotted square visuals showing adoption percentages of various technologies, split by current use and future priorities.
Product and Service Analysis
Financial Services
Visualizes technologies currently used and prioritized by AI Leaders in financial reporting. Traditional AI and cloud dominate current use, while generative AI and data analytics top future priorities.
traditional AI, generative AI, cloud tech, financial reporting, future priorities, ERP, blockchain
false
Product and Service Analysis
Financial Services
Single Chart
KPMG
Add to my slides
Remove from favorites
Split into two sections: Traditional AI/ML on the left with text and an icon, Generative AI on the right with text and an icon.
Operational Efficiency
Technology & Software
The slide contrasts traditional AI/ML roles with generative AI, highlighting changes in roles from decision-making to content creation.
traditional AI, generative AI, decision making, content creation, role changes
false
Operational Efficiency
Technology & Software
Boxed
BCG
Add to my slides
Remove from favorites
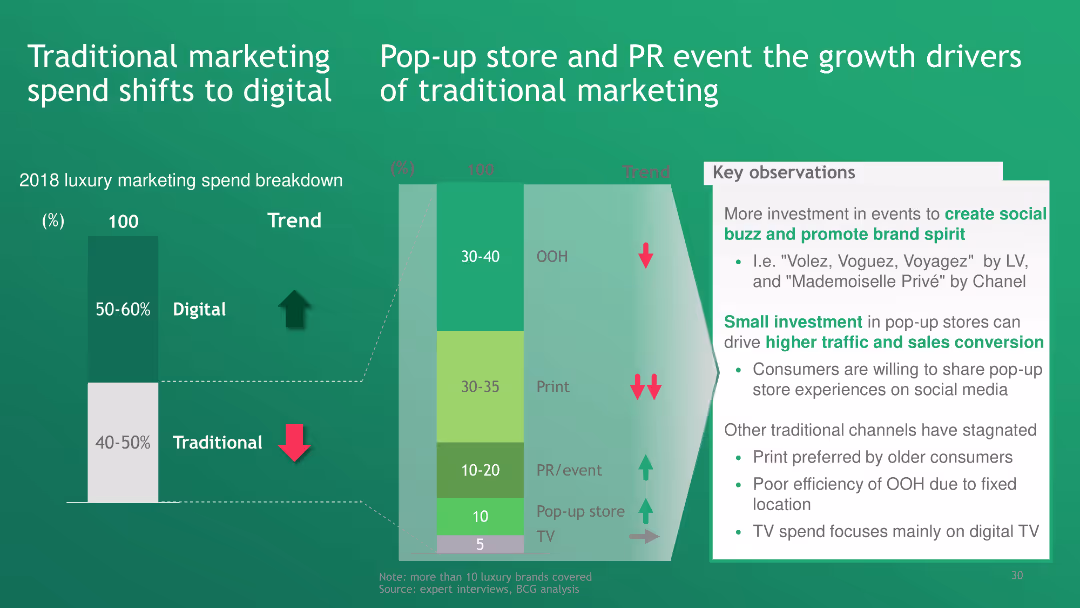
The slide features a bar chart comparing traditional and digital marketing spend in the luxury sector. It also discusses the growing impact of pop-up stores and PR events in traditional marketing strategies.
Technology and Digital Transformation
Media & Entertainment
The slide indicates a significant shift from traditional to digital marketing spend in the luxury industry, with pop-up stores and PR events being the main growth drivers for traditional marketing channels.
traditional marketing, digital marketing, pop-up stores, PR events, luxury marketing
false
Technology and Digital Transformation
Media & Entertainment
Multiple Chart
BCG
Add to my slides
Remove from favorites
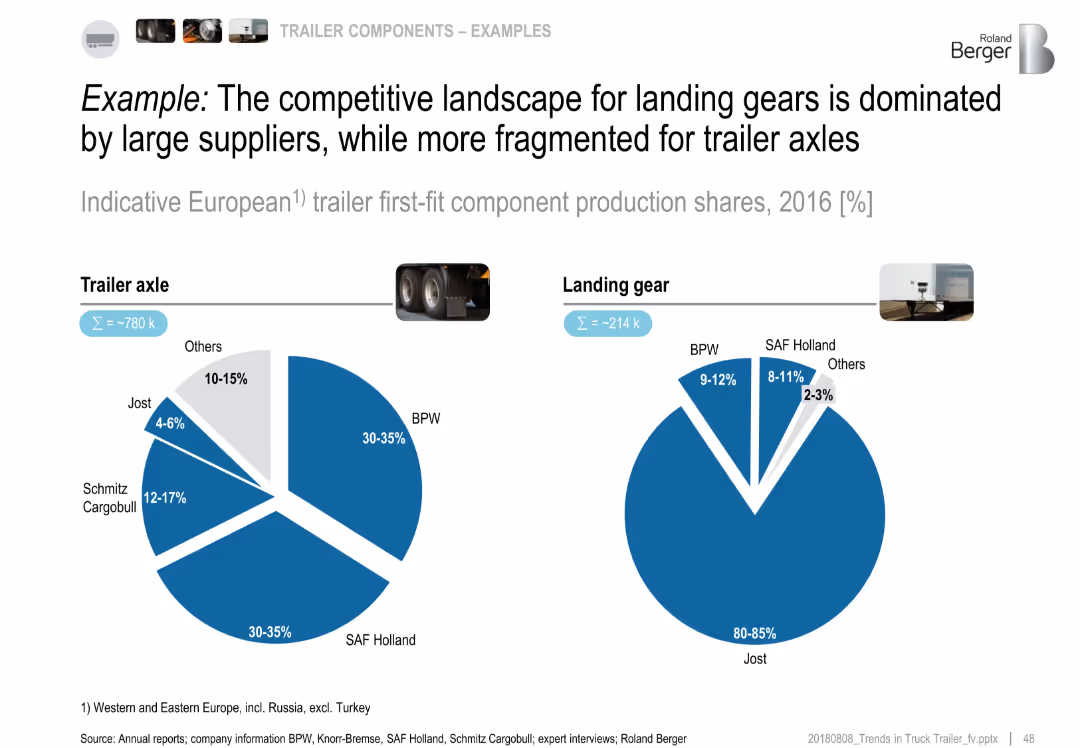
Side-by-side pie charts showing trailer axle and landing gear component shares (2016) with annotated company names and share percentages. Clean, infographic style with minimalistic icons and visuals.
Competitive Landscape
Transportation & Logistics
The slide compares production shares of trailer axles and landing gear components in Europe. It highlights a fragmented trailer axle market while showing a highly concentrated landing gear market dominated by Jost.
trailer axle, landing gear, market share, component suppliers, Europe, BPW, SAF Holland, Jost, trailer components, pie chart
false
Competitive Landscape
Transportation & Logistics
Multiple Chart
Roland Berger
Add to my slides
Remove from favorites
Stacked bar chart of trailer axles OE market share (2016) by region; company-specific segmentation with total EUR values
Competitive Landscape
Transportation & Logistics
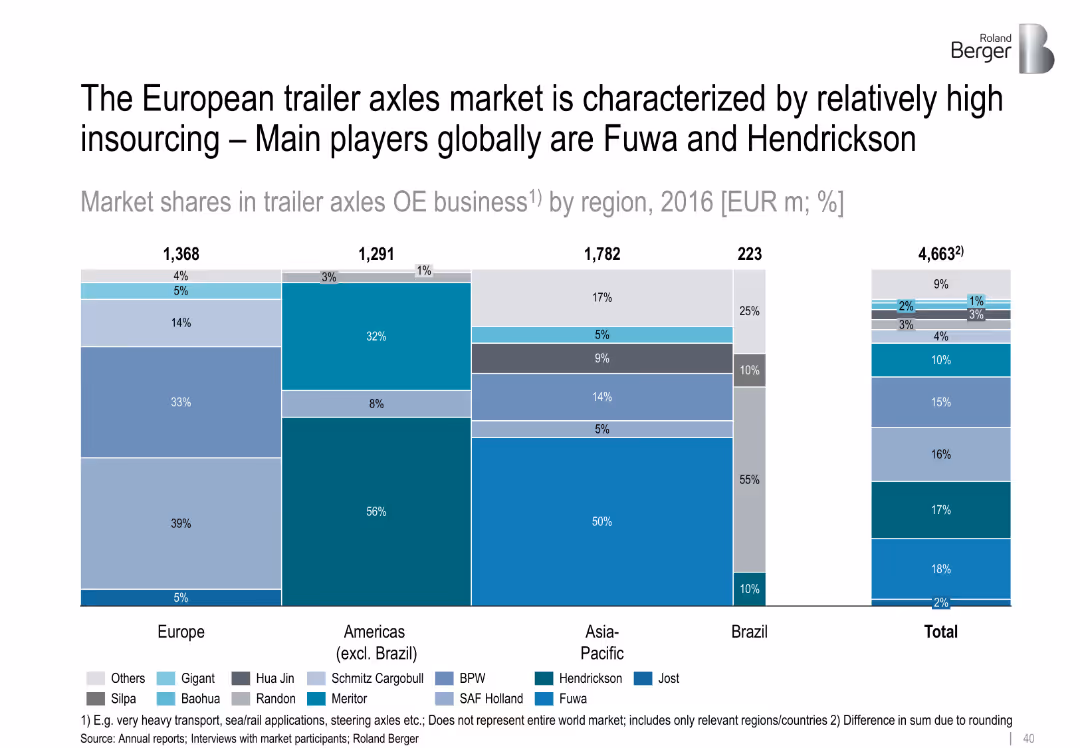
The trailer axle market is highly insourced in Europe. Fuwa and Hendrickson are global leaders. Regional market structures differ significantly in supplier distribution and insourcing tendencies, especially in Americas and Asia-Pacific.
trailer axles, insourcing, Fuwa, Hendrickson, OE market, regional share, Europe, supplier dynamics
false
Competitive Landscape
Transportation & Logistics
Single Chart
Roland Berger
Add to my slides
Remove from favorites
Bar chart layout with horizontal bars and region-wise comparison; trend arrows and side-aligned insights
Performance Metrics and KPIs
Transportation & Logistics
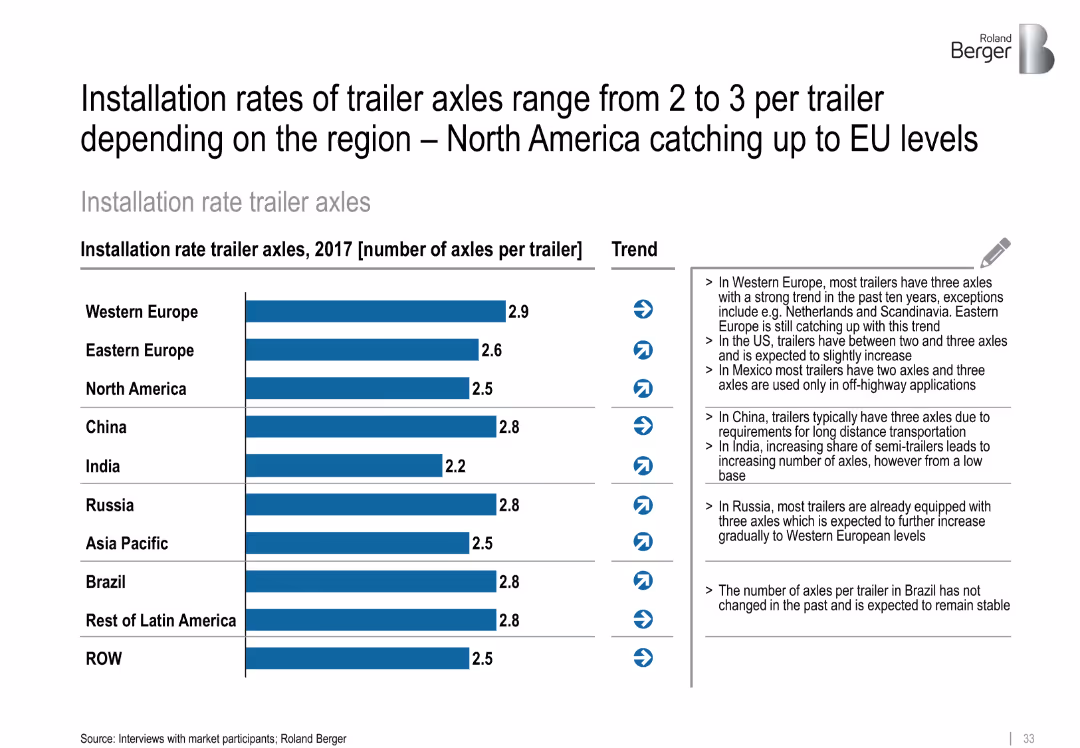
This slide compares the average number of trailer axles installed per trailer across global regions as of 2017. Western Europe leads with 2.9 axles per trailer, while India is lowest at 2.2. Trends show gradual increases across most regions, especially North America.
trailer axles, installation rates, regional trends, North America, Western Europe, China, performance metrics, transportation equipment
false
Performance Metrics and KPIs
Transportation & Logistics
Mixed Chart
Roland Berger
Add to my slides
Remove from favorites
Circular pie chart with breakdown of trailer value share by component group; includes callouts for chassis, structural, and connectivity systems
Product and Service Analysis
Transportation & Logistics
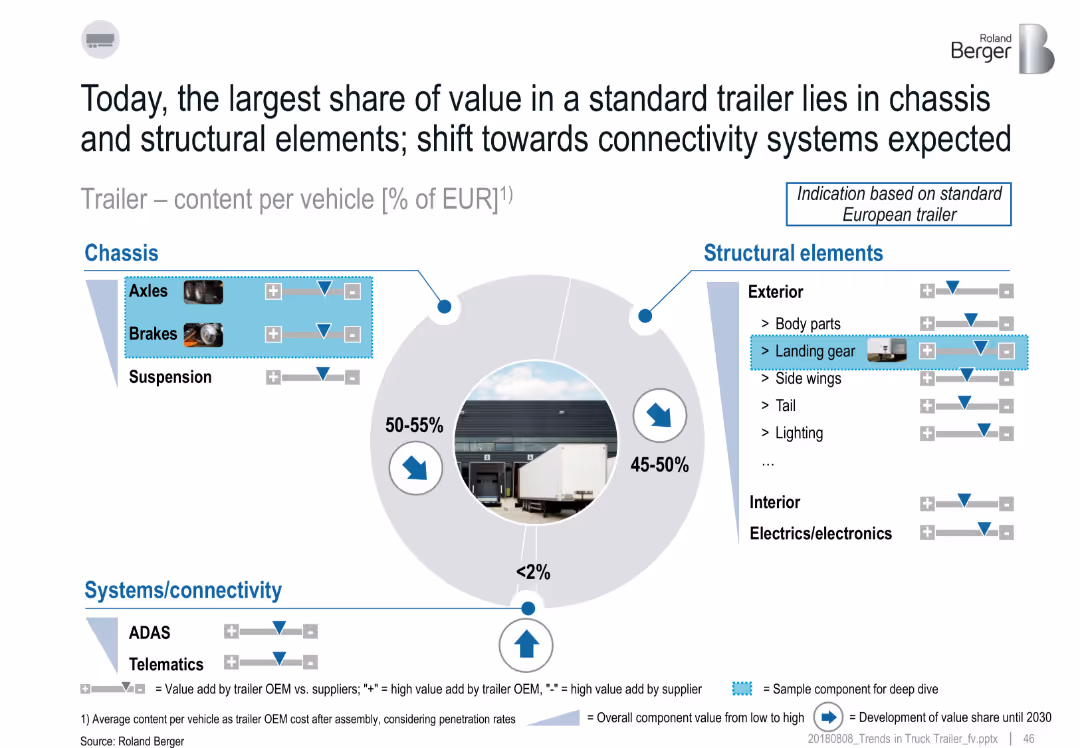
The slide shows that trailer value is mostly concentrated in the chassis (50–55%) and structural elements (45–50%), while connectivity systems like ADAS and telematics are minimal (<2%). Value trends are shown for specific components such as landing gear and brakes, with future development indicators.
trailer components, chassis, structural elements, ADAS, value share, landing gear, telematics
false
Product and Service Analysis
Transportation & Logistics
Single Chart
Roland Berger
Add to my slides
Remove from favorites
Stacked bar chart showing trailer production by manufacturer (2012–2021) with CAGR per company
Competitive Landscape
Industrial & Manufacturing
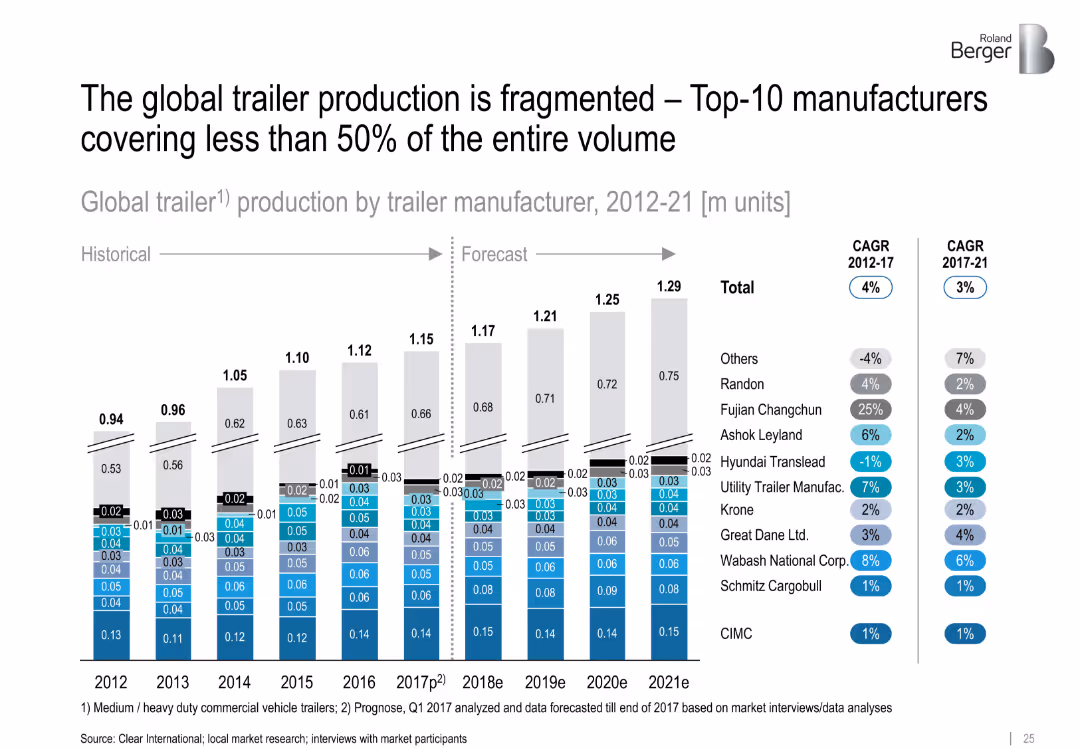
This slide emphasizes the fragmentation of the global trailer manufacturing market, where even the top 10 players account for less than 50% of volume. Detailed stacked bars show annual production by brand and CAGR metrics.
trailer manufacturers, fragmentation, global market, production trends, top 10, CAGR
false
Competitive Landscape
Industrial & Manufacturing
Linear Flow
Roland Berger
Add to my slides
Remove from favorites
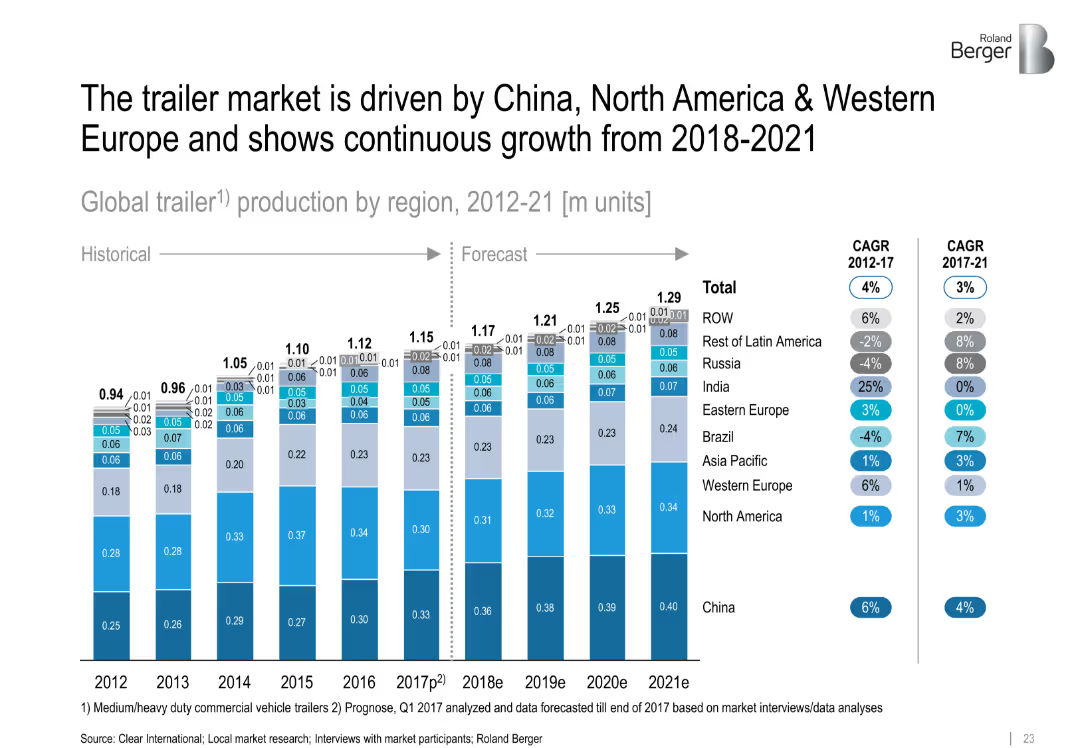
Stacked bar chart with regional segments for trailer production 2012–2021 (with forecasts); CAGR side chart
Market Analysis and Trends
Transportation & Logistics
This slide presents historical and forecasted trailer production by region, showing strong growth led by China, Western Europe, and North America. It also highlights CAGR trends, with India showing the highest projected growth from 2012 to 2017.
trailer market, CAGR, China, production forecast, regional growth, commercial vehicles
false
Market Analysis and Trends
Transportation & Logistics
Single Chart
Roland Berger
Add to my slides
Remove from favorites
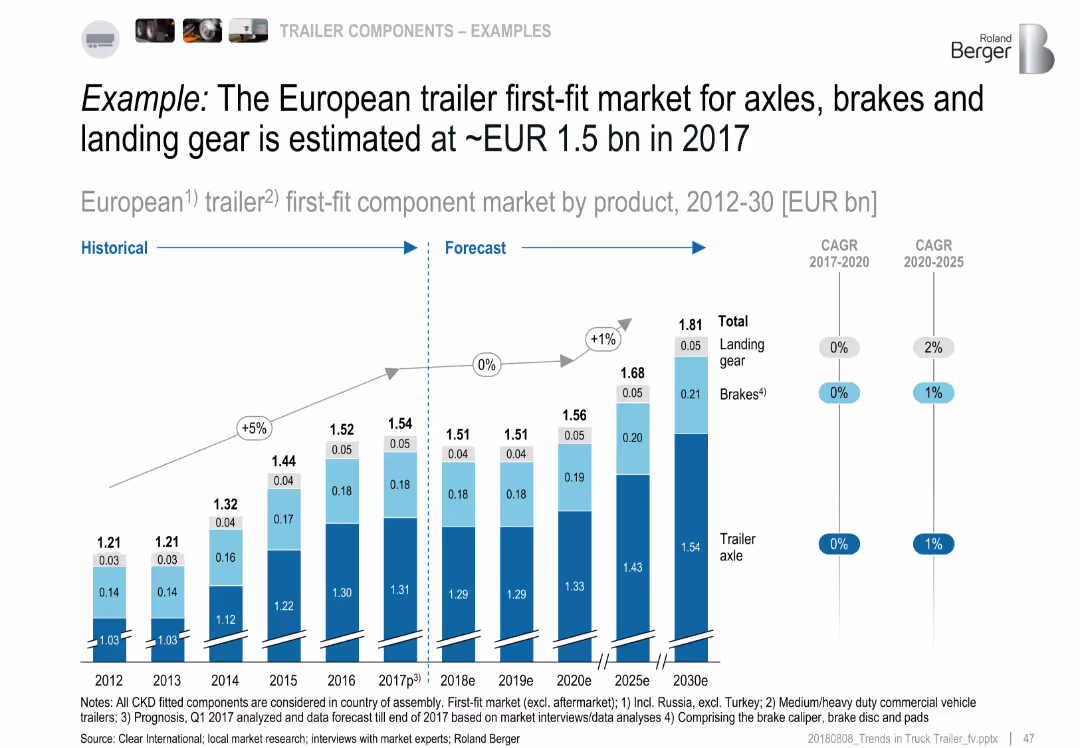
Column chart showing historical and forecasted market value for trailer components (2012–2030), with CAGR annotations
Investment Analysis
Transportation & Logistics
This slide presents the European trailer first-fit market by product type over time. Axles form the largest segment, followed by brakes and landing gear. While growth from 2017 to 2020 is flat, a small uptick is forecasted post-2025. Long-term CAGR remains modest, signaling a mature market with stable demand.
trailer market, Europe, axles, brakes, landing gear, CAGR, forecast, 2030
false
Investment Analysis
Transportation & Logistics
Single Chart
Roland Berger
Add to my slides
Remove from favorites
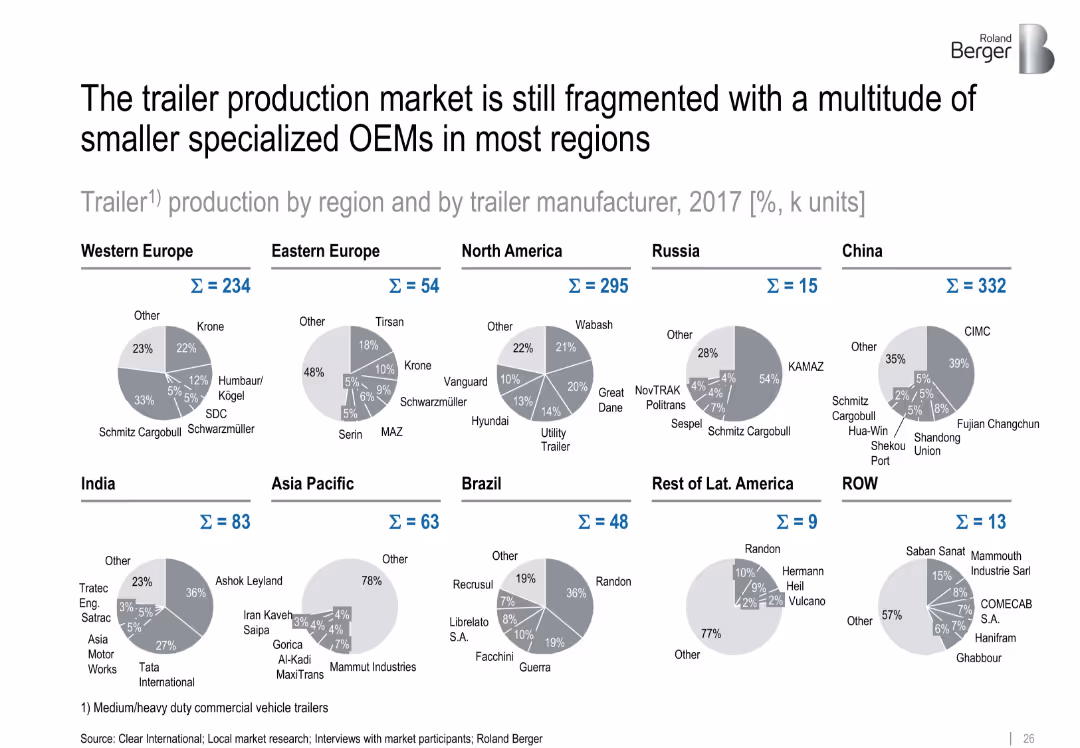
Pie charts showing regional trailer production market share by OEM in 2017
Competitive Landscape
Industrial & Manufacturing
Regional pie charts display the distribution of trailer production among manufacturers, reinforcing the fragmented nature of the market with many localized and specialized OEMs, such as Tata in India and CIMC in China.
trailer OEMs, regional share, fragmentation, Tata, CIMC, market structure
false
Competitive Landscape
Industrial & Manufacturing
Single Chart
Roland Berger
Add to my slides
Remove from favorites
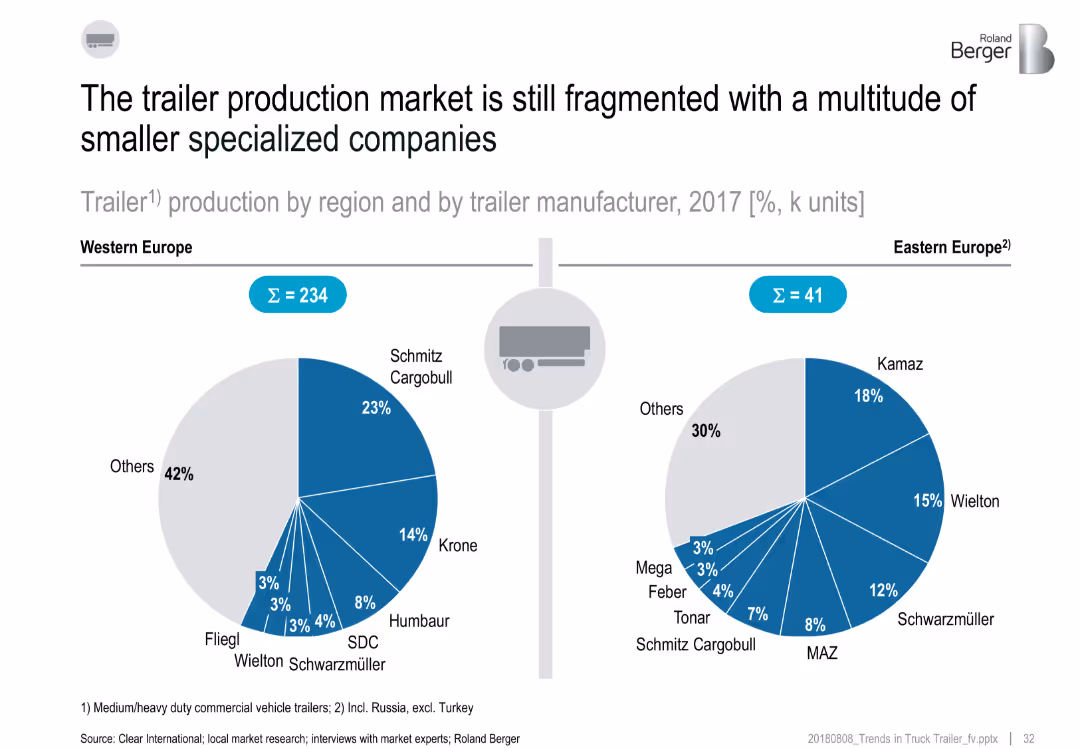
Split layout with two pie charts comparing trailer production market shares (2017) in Western and Eastern Europe; includes manufacturer names and percentages
Market Analysis and Trends
Transportation & Logistics
This slide compares the trailer manufacturing landscape in Western and Eastern Europe. Western Europe shows more dominance by major players like Schmitz Cargobull and Krone, while Eastern Europe is slightly less fragmented. Both regions show a high share of production by "Others," highlighting a fragmented market with many smaller manufacturers.
trailer production, market fragmentation, Western Europe, Eastern Europe, manufacturers, 2017, Schmitz, Krone, Kamaz
false
Market Analysis and Trends
Transportation & Logistics
Multiple Chart
Roland Berger
Add to my slides
Remove from favorites
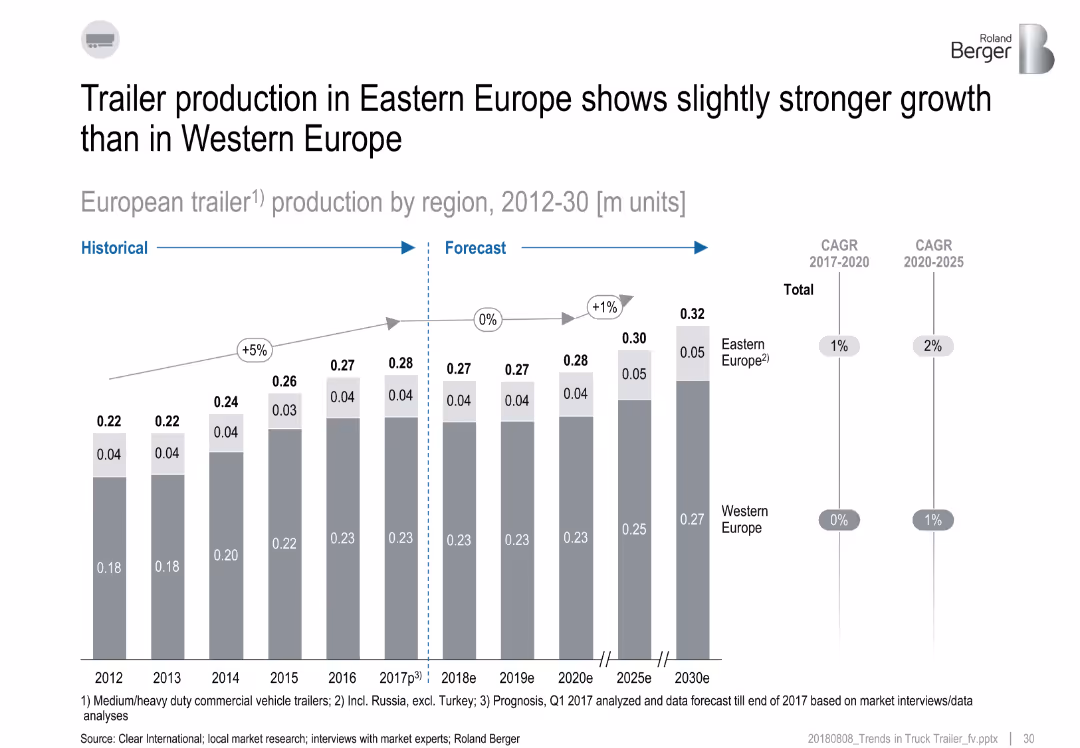
Bar chart from 2012 to 2030 showing trailer production by region with CAGR comparisons for Western vs. Eastern Europe.
Market Analysis and Trends
Industrial & Manufacturing
Trailer production in Eastern Europe is growing slightly faster than in Western Europe. From 2017–2025, Eastern Europe shows stronger CAGR, with production expected to reach 0.32 million units by 2030. Forecasts are based on interviews and data analysis.
trailers, production forecast, Eastern Europe, Western Europe, CAGR, growth
false
Market Analysis and Trends
Industrial & Manufacturing
Single Chart
Roland Berger
Add to my slides
Remove from favorites
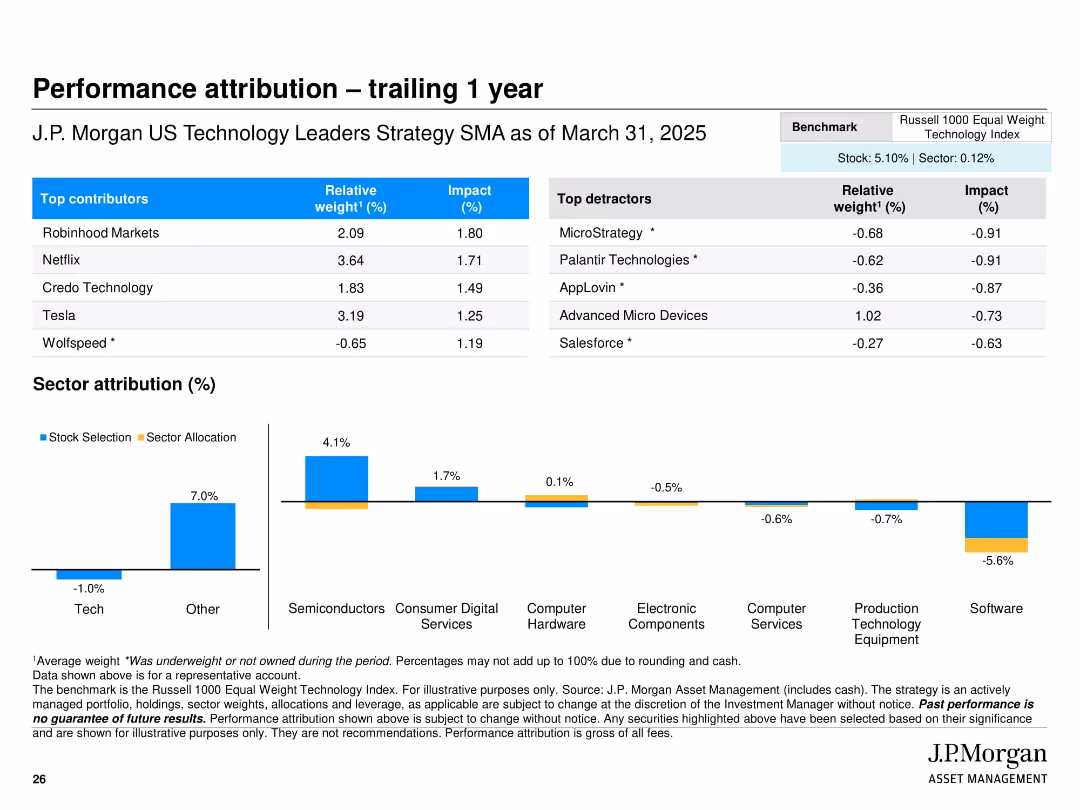
Similar structure to Slide 15465 with updated timeframe. Top section features contributors/detractors over a one-year period. Bar chart below visualizes sector attribution using blue/yellow split bars. Benchmark comparison noted at the top.
Performance Metrics and KPIs
Financial Services
This slide evaluates one-year performance attribution for the J.P. Morgan US Technology Leaders Strategy. It identifies top and bottom performing positions, and distinguishes between attribution from stock selection versus sector allocation. Robinhood and Netflix led gains, while MicroStrategy and Palantir were notable detractors. A 7% attribution in non-tech sectors indicates strong off-sector alpha.
trailing performance, attribution, Robinhood, Netflix, sector analysis, tech portfolio, J.P. Morgan, stock selection, benchmark comparison
false
Performance Metrics and KPIs
Financial Services
Mixed Chart
JP Morgan
Add to my slides
Remove from favorites
Pie chart showing the distribution of hours allocated annually for training interventions per employee.
Human Resources and Talent Management
Professional Services
Details the annual time companies invest in training interventions for employees, excluding induction.
training, annual, time, investment, employees
false
Human Resources and Talent Management
Professional Services
Single Chart
PwC/Strategy&
Add to my slides
Remove from favorites
The slide features a large header in bold type, two bar graphs comparing ASEAN and OECD firms in terms of formal training offerings, and the number of training hours per employee. The layout is split into two sections with dark and light blue bars representing different regions. There are two callout boxes with recommendations at the bottom.
Market Analysis and Trends
Education & Training
The slide contrasts the percentage of firms offering formal training and the number of training hours per employee between ASEAN and OECD countries. It advocates for government intervention to increase corporate training programs. The aim is to facilitate a competitive edge for companies by ensuring training compliance, particularly in digital skill areas, over a 5-year growth target.
Training, ASEAN, OECD, Government Policy, Corporate Training, Digital Skills, Formal Training, Employee Development, Competitiveness, Growth Target
false
Market Analysis and Trends
Education & Training
Multiple Chart
Kearney
Add to my slides
Remove from favorites
Bar chart indicating the adoption rates of blended or online training by sector.
Human Resources and Talent Management
Education & Training
Reflects on the growing trend towards blended or online training modalities in various sectors.
training, online, blended, trends, sectors
false
Human Resources and Talent Management
Education & Training
Multiple Chart
PwC/Strategy&
Add to my slides
Remove from favorites
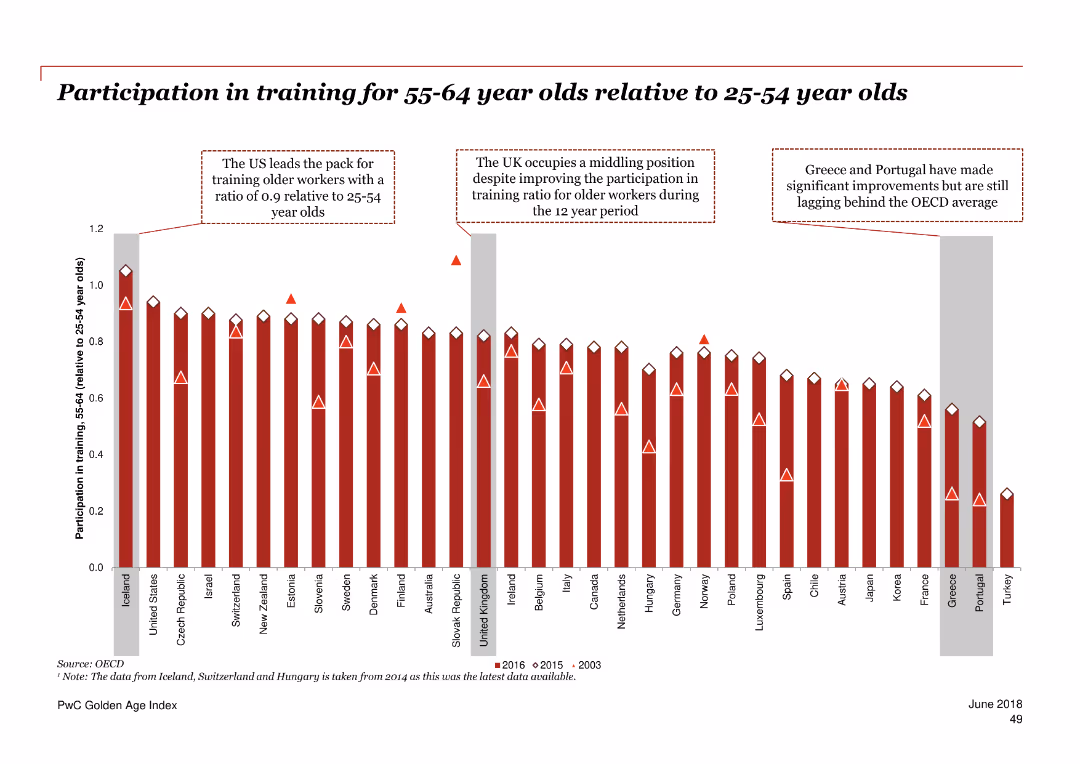
Column chart showing the ratio of participation in training for 55-64 year olds relative to 25-54 year olds across various countries.
Human Resources and Talent Management
Professional Services
The slide compares the training participation rates of older and younger adults in different countries over 2003, 2015, and 2016.
training participation, age comparison, education, OECD, trend
false
Human Resources and Talent Management
Professional Services
Single Chart
PwC/Strategy&
Add to my slides
Remove from favorites
The slide presents five vertical blocks, each describing a different model for training providers, with corresponding icons and brief descriptions.
Strategic Planning
Education & Training
This slide showcases various training provider models that have proven to be scalable and financially viable, including outcome-oriented and corporate-sponsored providers.
training providers, financial viability, scalable models, education practice, strategic planning, training models, corporate training
false
Strategic Planning
Education & Training
Pillar
LEK
Add to my slides
Remove from favorites
The slide features three blocks describing different types of outcome-oriented training providers, supported by logos of representative companies and brief descriptions.
Product and Service Analysis
Education & Training
This slide details outcome-oriented training providers, focusing on guaranteed outcomes for students or specific industries, along with examples of such providers.
training providers, outcome-oriented, guaranteed outcomes, industry focus, education analysis, training models, student placement
false
Product and Service Analysis
Education & Training
Pillar
LEK
Add to my slides
Remove from favorites
Simple gauge chart showing a split between traditional and online training with a marker for blended.
Human Resources and Talent Management
Education & Training
Compares the balance of traditional versus online training methodologies, emphasizing a blended approach.
training, traditional, online, blended, comparison
false
Human Resources and Talent Management
Education & Training
Single Chart
PwC/Strategy&
Add to my slides
Remove from favorites
Complex graph showing COVID-19 case trajectories by country, color-coded lines, with detailed callouts for select countries.
Strategic Planning
Healthcare & Pharmaceuticals
This slide provides insight into how different responses affect the COVID-19 outbreak trajectory, targeting strategists and health policy planners.
trajectories, measures, COVID-19, country comparison, containment strategies, outbreak, health policy
false
Strategic Planning
Healthcare & Pharmaceuticals
Mixed Chart
McKinsey
Add to my slides
Remove from favorites
The slide is split into two sections, with a list of platform features on the left and customer testimonials on the right. It has a blue header and footer, with a page number at the bottom right.
Technology and Digital Transformation
Financial Services
This slide presents transaction banking as a modern digital platform, highlighting its features and client satisfaction quotes. It emphasizes digital onboarding, payment automation, and accolades, suitable for presentations focused on digital transformation in banking, client experience, and service innovation, showcasing the technological advances and customer-centric focus of the presenter's transaction banking services.
Transaction Banking, Digital Onboarding, Automation, Client Experience, Innovation, Awards
false
Technology and Digital Transformation
Financial Services
Header Horizontal
Goldman Sachs
Add to my slides
Remove from favorites
Includes column chart and a graph showcasing market size and growth, with a clean and structured layout that uses shades of blue and green to highlight key figures.
Market Analysis and Trends
Financial Services
The slide presents the market opportunity for Goldman Sachs' transaction banking, outlining current performance and future growth targets. It is useful for investor briefings or strategic presentations focusing on long-term market opportunities.
transaction banking, growth opportunity, Goldman Sachs, market size, clients, deposits
false
Market Analysis and Trends
Financial Services
Mixed Chart
Goldman Sachs
Add to my slides
Remove from favorites
Visual elements include a Venn diagram linking market opportunities to franchise benefits, accompanied by a list of attributes on the right that underline the strong client value proposition.
Product and Service Analysis
Financial Services
Addressing new market opportunities, this slide illustrates how small market shares in the transaction banking sector can lead to significant economic gains. It links potential benefits to the company's broader strategy, highlighting attributes such as analytics, modern tools, and scalable customization, which align with the firm’s transaction banking offerings.
Transaction Banking, Market Opportunity, Strategy, Client Value, Innovation
false
Product and Service Analysis
Financial Services
Table
Goldman Sachs
Add to my slides
Remove from favorites
Previous
Next
You don't have any favorites yet.
Please wait loading your favorites slides...
Create a FREE account to continue browsing
Receive Instant Access to 1,000+ slides from companies like McKinsey, Google, and Goldman Sachs
First Name
Last Name
Email
Password
I agree to all
Terms & Privacy Policy
Thank you! Your submission has been received!
Oops! Something went wrong while submitting the form.
Have an account?
Sign in
Upgrade to PRO to Save slides
Advanced Search and Filters
Access to 15,000+ slides
Access to Category Pages
Save/Bookmark Slides
PowerPoint Template Library
Pick a Plan
MONTHLY
$12/month
Billed every month, Cancel anytime.
YEARLY
$9/year
Billed $108 annually, Cancel anytime.
Checkout for $12/month
Checkout for $108/yr
Secured by Stripe | AES-256 bit encryption