My Account
My Slides
Search by Category
Pricing
Templates
View All Templates
Download Template Slides
✦ AI Search
Feedback
Login
Logout
Get Started
Browse all Slides
Browse all Slides
Create a FREE Account
Instant access to 1,000+ real slides from top companies like McKinsey, BCG, Goldman Sachs, Google and many more!
First Name
Last Name
Email
Password
I agree to all
Terms & Privacy Policy
Thank you! Your submission has been received!
Oops! Something went wrong while submitting the form.
Have an account?
Sign in
Saved Slides
Total No. of slides saved
0
↻ Refresh
✖ Clear all
The slide features a screenshot of a transaction banking software interface, displaying an account snapshot, notifications, and a cash flow forecast graph.
Technology and Digital Transformation
Financial Services
Providing a glimpse into the user interface of a transaction banking platform, this slide depicts the dashboard with a balance snapshot, notifications, and analytics. It serves to illustrate the ease of digital banking, showcasing how the platform offers insights and facilitates financial management for users, thus highlighting the company's technological innovation in client solutions.
Transaction Banking, User Interface, Digital, Analytics, Cash Flow, Technological Innovation
false
Technology and Digital Transformation
Financial Services
Mixed Chart
Goldman Sachs
Add to my slides
Remove from favorites
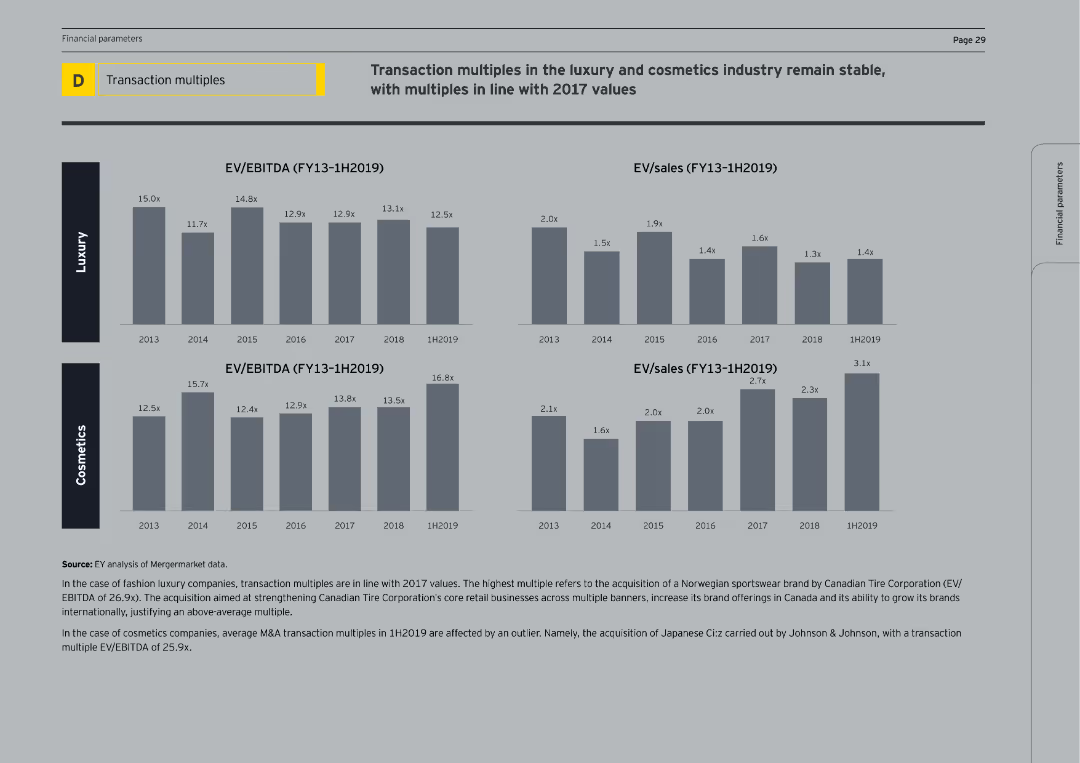
The slide features two sections for luxury and cosmetics, each with two column charts depicting EV/EBITDA and EV/sales from FY13 to 1H2019.
Financial Performance
Financial Services
Illustrates transaction multiples in luxury and cosmetics industries, showing the stability and trends in EV/EBITDA and EV/sales over the years.
transaction multiples, luxury, cosmetics, EV/EBITDA, EV/sales, financial performance, stability, trends, FY13-1H2019, column charts
false
Financial Performance
Financial Services
Multiple Chart
EY
Add to my slides
Remove from favorites
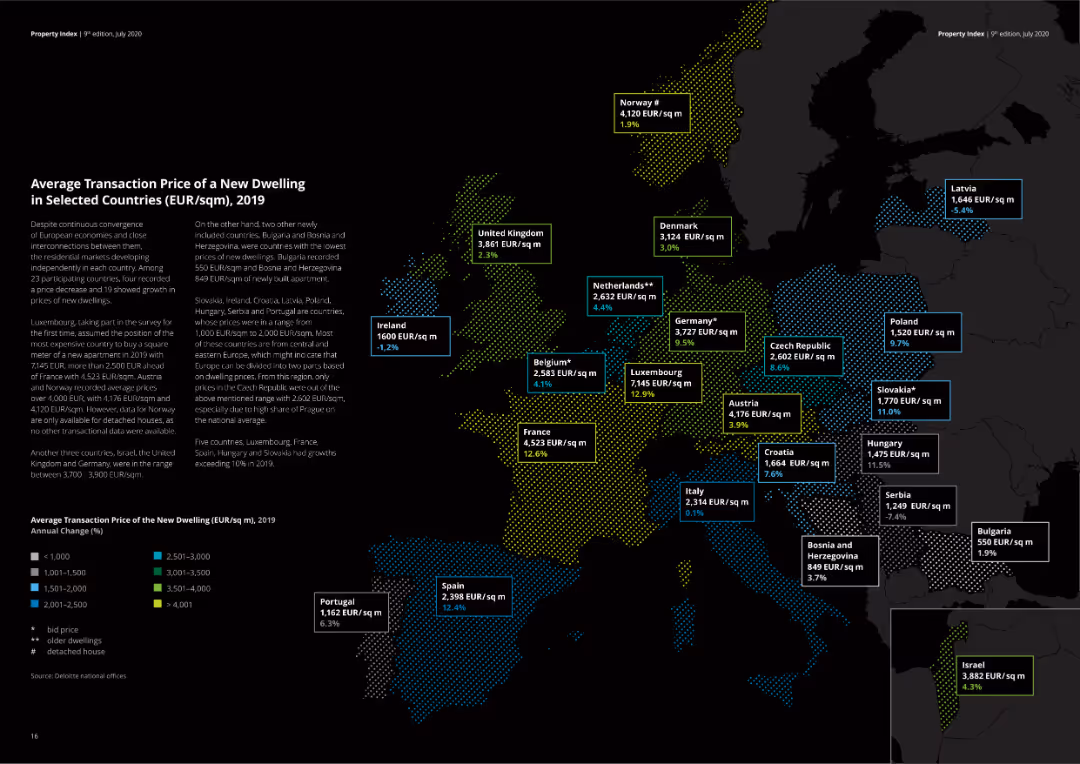
The slide includes a map of Europe with highlighted transaction prices for new dwellings in different countries. It also features a color-coded legend to indicate price ranges. Visual elements are detailed and informative. Visual complexity is advanced.
Market Analysis and Trends
Real Estate & Construction
Shows the average transaction prices for new dwellings across Europe, with a detailed map and legends. This slide is useful for real estate professionals and investors analyzing price trends and market conditions in the European housing market.
Transaction price, new dwelling, Europe, real estate, market
false
Market Analysis and Trends
Real Estate & Construction
Graphic
Deloitte
Add to my slides
Remove from favorites
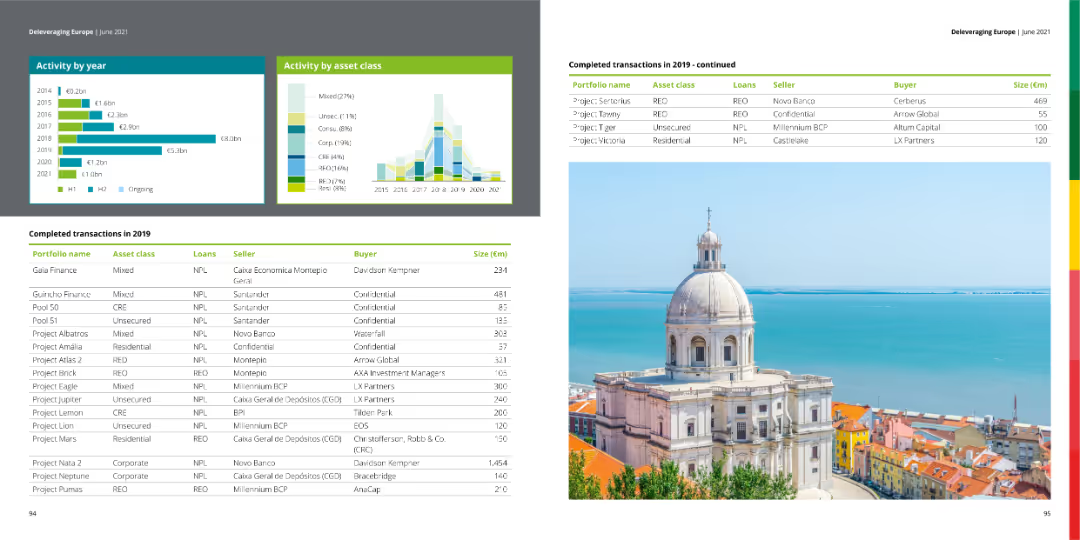
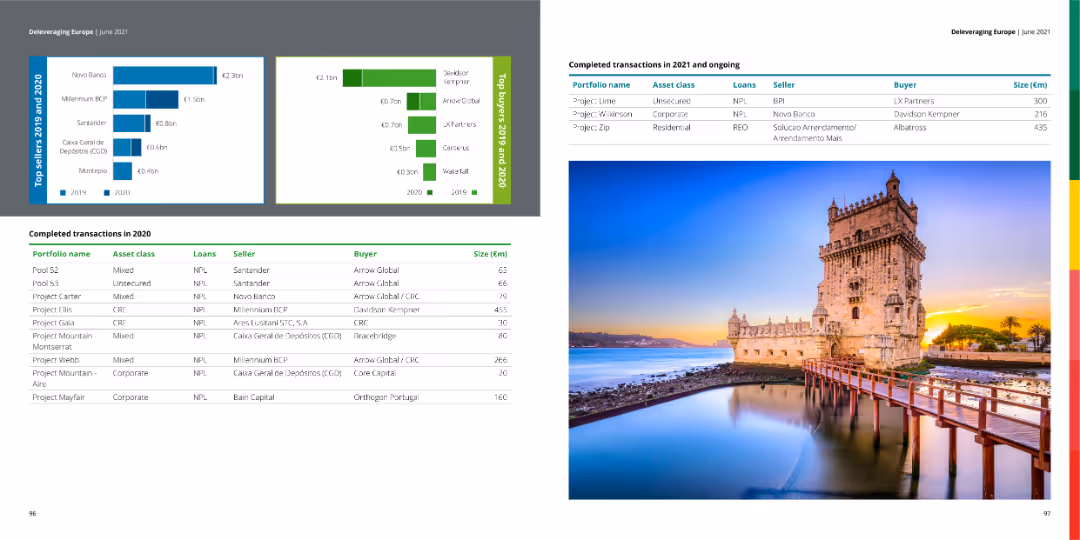
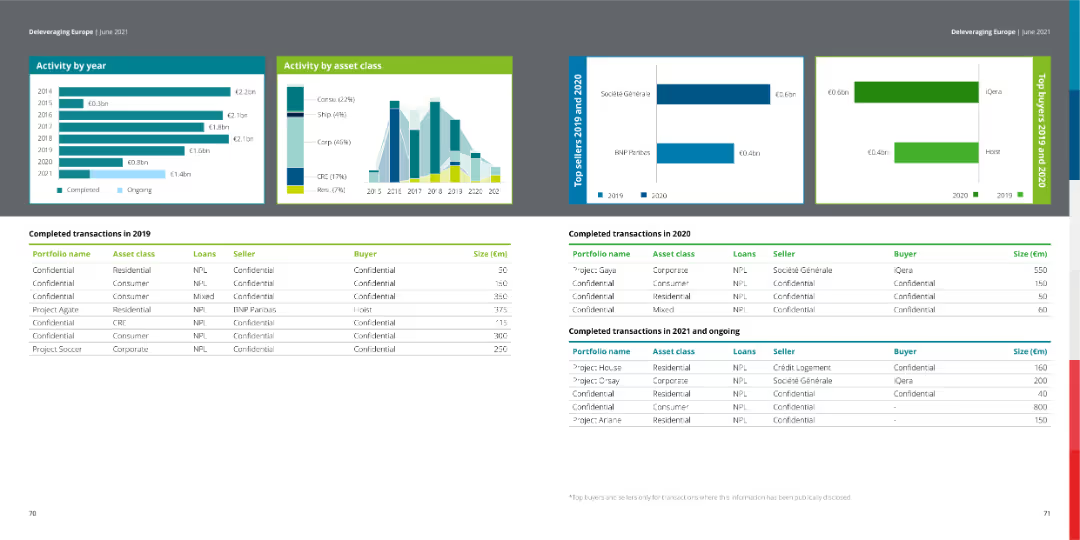
The slide features a table with completed transactions in 2020 and ongoing transactions in 2021, along with bar charts showing top sellers and buyers for 2019 and 2020. The right side contains an image of a historical building.
Market Analysis and Trends
Financial Services
The slide provides a summary of completed and ongoing financial transactions, detailing portfolio names, asset classes, loan types, sellers, buyers, and transaction sizes.
transactions, financial, market, buyers, sellers
false
Market Analysis and Trends
Financial Services
Multiple Chart
Deloitte
Add to my slides
Remove from favorites
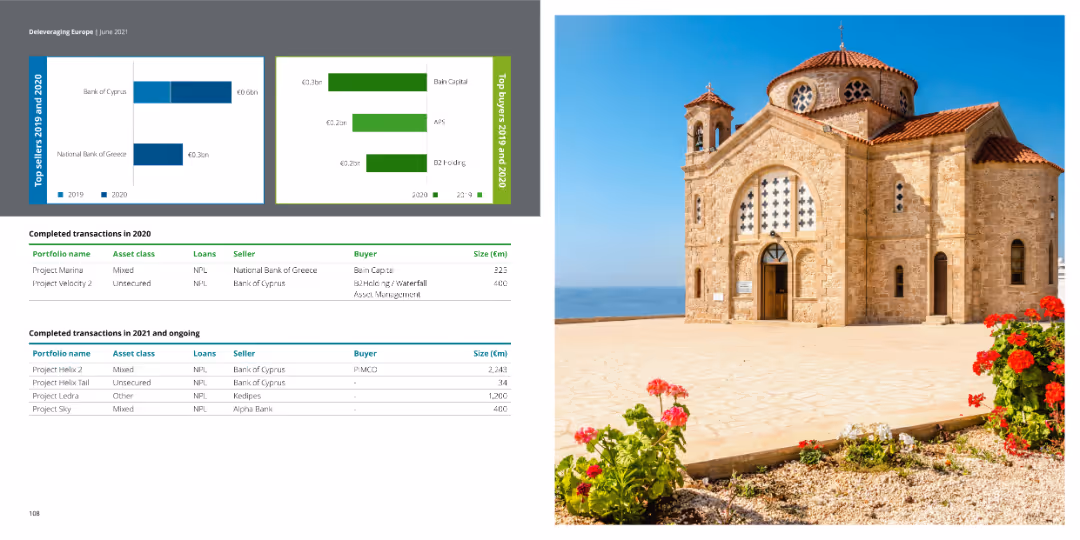
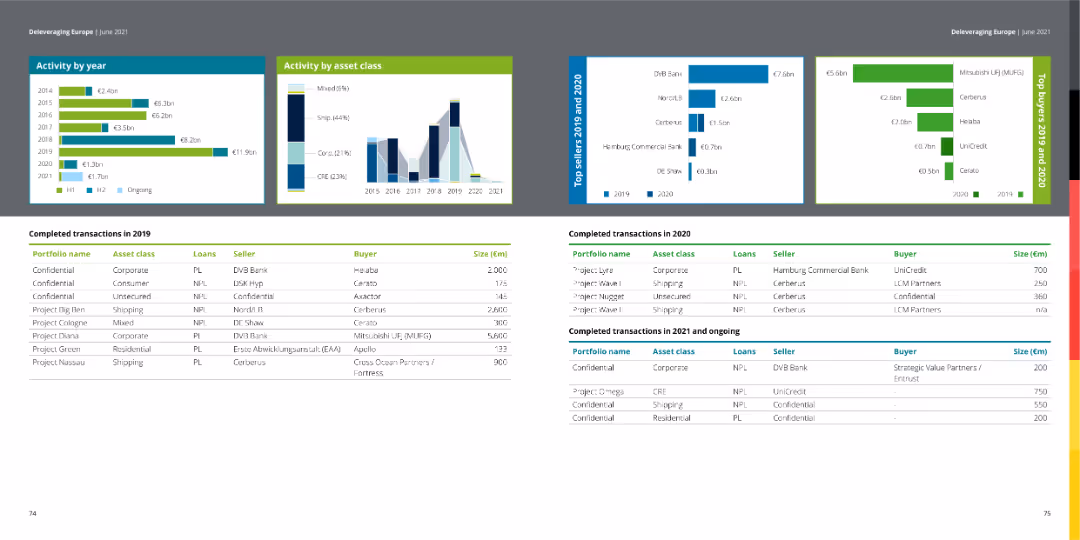
The slide includes tables of completed transactions for 2020 and ongoing ones in 2021, with bar charts showing top sellers and buyers for 2019 and 2020. The right side contains an image of an ancient structure.
Market Analysis and Trends
Financial Services
The slide provides detailed information on completed and ongoing financial transactions, including portfolio names, asset classes, loan types, sellers, buyers, and transaction sizes.
transactions, financial, market, buyers, sellers
false
Market Analysis and Trends
Financial Services
Multiple Chart
Deloitte
Add to my slides
Remove from favorites
The slide features tables of completed transactions for 2020 and ongoing ones in 2021, with bar charts showing top sellers and buyers for 2019 and 2020. The right side contains an image of a historical site.
Market Analysis and Trends
Financial Services
The slide provides comprehensive data on completed and ongoing financial transactions, listing portfolio names, asset classes, loan types, sellers, buyers, and transaction sizes.
transactions, financial, market, buyers, sellers
false
Market Analysis and Trends
Financial Services
Multiple Chart
Deloitte
Add to my slides
Remove from favorites
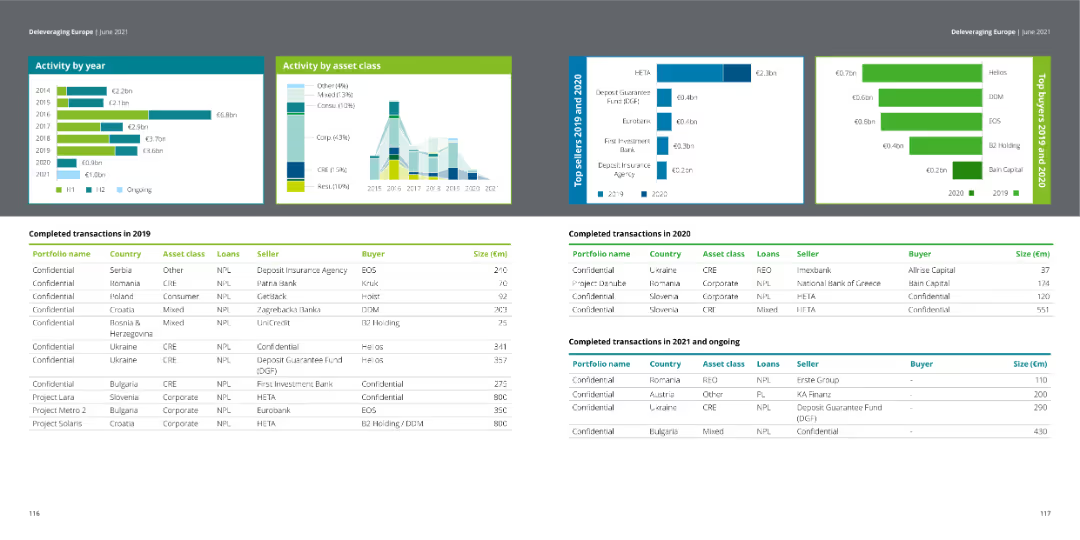
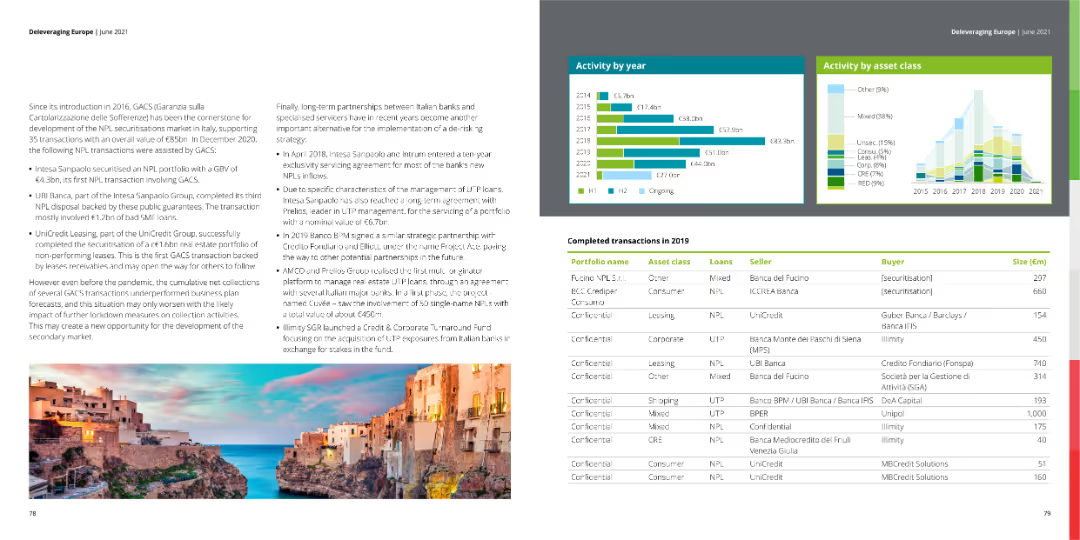
The slide presents tables of completed transactions for 2019, 2020, and ongoing ones in 2021, with bar charts showing top sellers and buyers for 2019 and 2020. The right side contains a list of confidential transactions.
Market Analysis and Trends
Financial Services
The slide summarizes completed financial transactions for 2019, 2020, and ongoing ones in 2021, providing detailed information on portfolio names, asset classes, loan types, sellers, buyers, and sizes.
transactions, financial, market, buyers, sellers
false
Market Analysis and Trends
Financial Services
Multiple Chart
Deloitte
Add to my slides
Remove from favorites
The slide features column charts for activity by year and asset class, with tables listing completed transactions for 2019 and 2020.
Financial Performance
Financial Services
This slide provides an overview of completed transactions in 2019, showcasing activity by year and asset class in financial terms.
transactions, financial services, column chart, asset class, activity
false
Financial Performance
Financial Services
Multiple Chart
Deloitte
Add to my slides
Remove from favorites
The slide shows column charts of activity by year and asset class, with tables listing completed transactions in 2019 and 2020.
Financial Performance
Financial Services
This slide details completed transactions in 2019, displaying activity by year and asset class in a financial context.
transactions, financial services, column chart, asset class, activity
false
Financial Performance
Financial Services
Multiple Chart
Deloitte
Add to my slides
Remove from favorites
The slide contains column charts showing top sellers and buyers in 2019 and 2020. It also includes two tables of transaction data.
Financial Performance
Financial Services
This slide details completed transactions in 2020 and ongoing ones in 2021, showing top sellers and buyers with financial details.
transactions, financial services, column chart, sellers, buyers
false
Financial Performance
Financial Services
Multiple Chart
Deloitte
Add to my slides
Remove from favorites
The slide includes column charts of top sellers and buyers for 2019 and 2020, with tables listing completed transactions in 2020.
Financial Performance
Financial Services
This slide provides details on completed transactions in 2020, highlighting top sellers and buyers in the financial sector.
transactions, financial services, column chart, sellers, buyers
false
Financial Performance
Financial Services
Multiple Chart
Deloitte
Add to my slides
Remove from favorites
The slide features column charts for top sellers and buyers in 2019 and 2020, with tables listing completed transactions in 2020.
Financial Performance
Financial Services
This slide details completed transactions in 2020, showing top sellers and buyers in the financial sector with transaction data.
transactions, financial services, column chart, sellers, buyers
false
Financial Performance
Financial Services
Multiple Chart
Deloitte
Add to my slides
Remove from favorites
The slide contains column charts showing top sellers and buyers in 2019 and 2020. It also includes two tables of transaction data.
Financial Performance
Financial Services
This slide details completed transactions in 2020 and ongoing ones in 2021, showing top sellers and buyers with financial details.
transactions, financial services, column chart, sellers, buyers
false
Financial Performance
Financial Services
Multiple Chart
Deloitte
Add to my slides
Remove from favorites
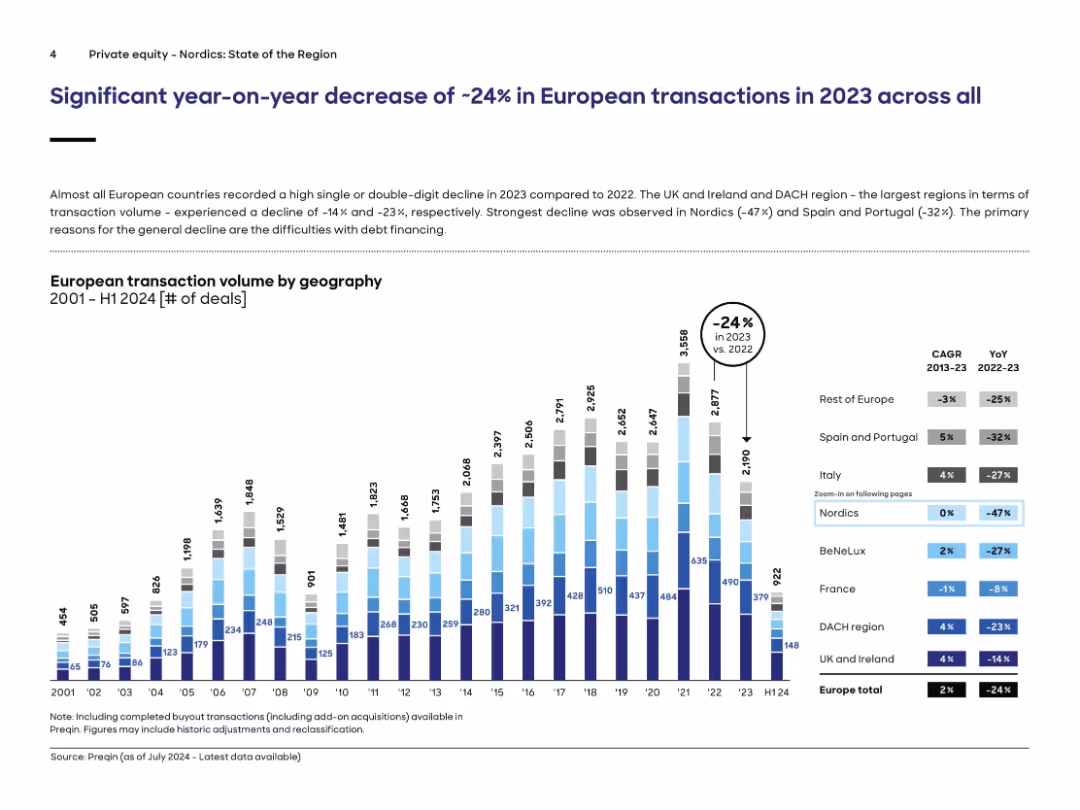
Bar chart displaying European transaction volumes by region over 20+ years; decline visualized for each region; title and CAGR/YoY table included.
Market Analysis and Trends
Financial Services
European transaction volume dropped 24% in 2023 vs. 2022 across nearly all regions. The chart breaks down deal count by geography (e.g., Nordics, DACH, UK). Nordics saw the steepest drop (-47%). Key causes cited include tightening debt financing. Supporting tables show YoY change and CAGR, with notable declines in major markets. Data sourced from Preqin.
transactions, private equity, Europe, volume, decline, Nordics, Preqin, DACH, market trend
false
Market Analysis and Trends
Financial Services
Single Chart
Roland Berger
Add to my slides
Remove from favorites
The slide presents bar charts showing top sellers in 2019 and 2020, and a table listing completed transactions in 2020 and ongoing deals in 2021. A large image of a cityscape is included.
Market Analysis and Trends
Financial Services
This slide provides an overview of completed and ongoing transactions in the financial services sector for 2020 and 2021, highlighting key sellers and transaction amounts.
transactions, top sellers, financial services
false
Market Analysis and Trends
Financial Services
Multiple Chart
Deloitte
Add to my slides
Remove from favorites
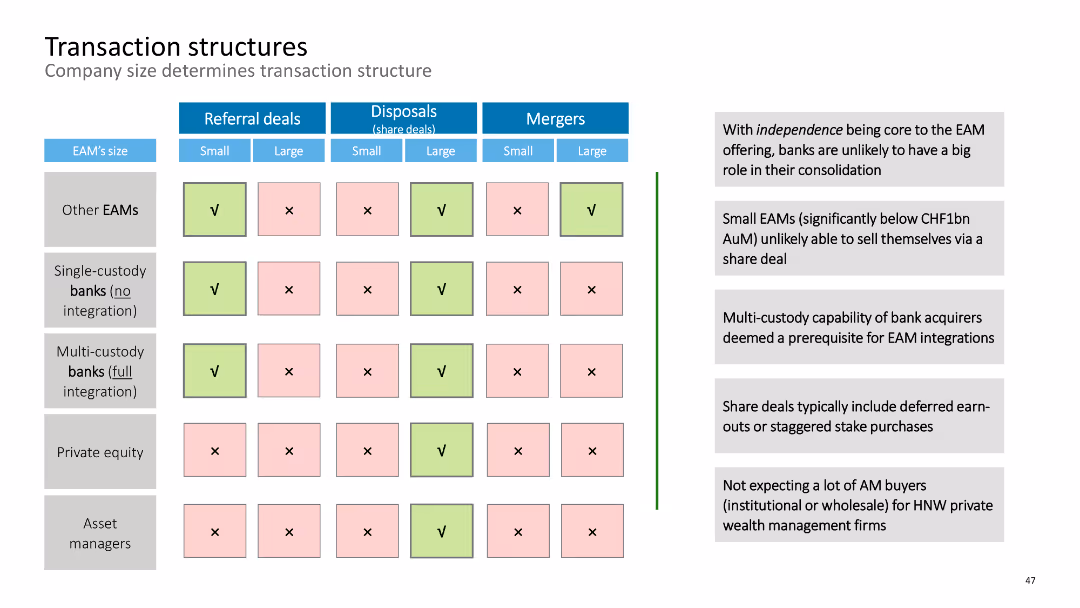
Matrix diagram detailing transaction structures by company size for referral deals, disposals, and mergers.
Operational Efficiency
Financial Services
This slide outlines various transaction structures in the financial sector, considering company size and deal type.
transaction structures, referral deals, disposals, mergers, financial services, company size
false
Operational Efficiency
Financial Services
Table
Deloitte
Add to my slides
Remove from favorites
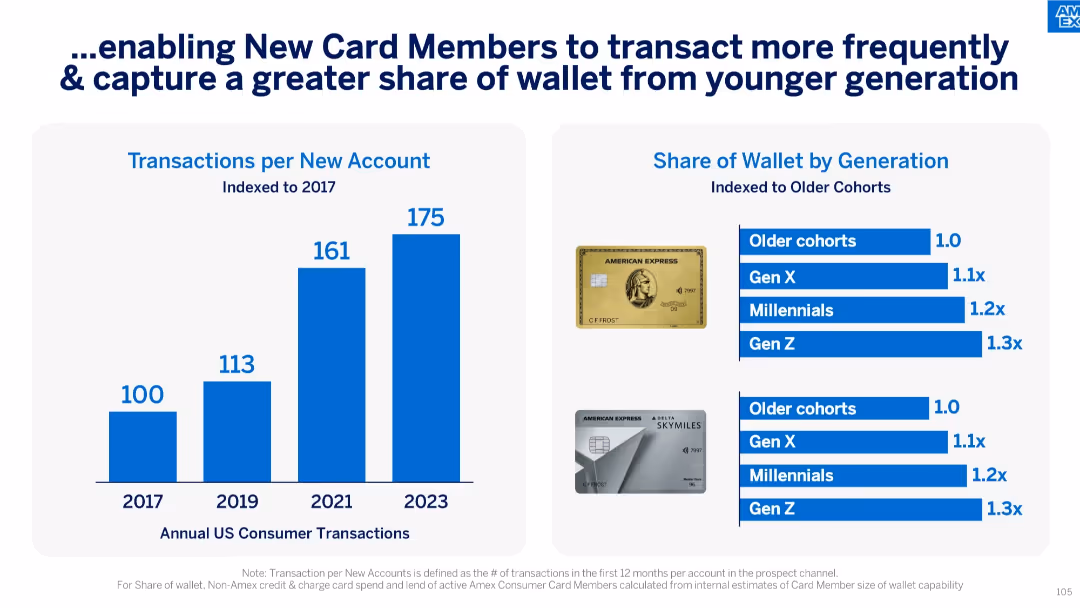
Left: bar chart on transactions per account; Right: horizontal bars comparing wallet share across generations.
Customer and Market Segmentation
Financial Services
This slide shows how new card members are increasing transaction frequency, with Gen Z and Millennials showing higher wallet share compared to older cohorts. Trends are indexed and suggest increasing card usage among younger generations.
Transactions, Wallet Share, Gen Z, Millennials, Younger Cohorts, Card Usage, Frequency, Index
false
Customer and Market Segmentation
Financial Services
Multiple Chart
McKinsey
Add to my slides
Remove from favorites
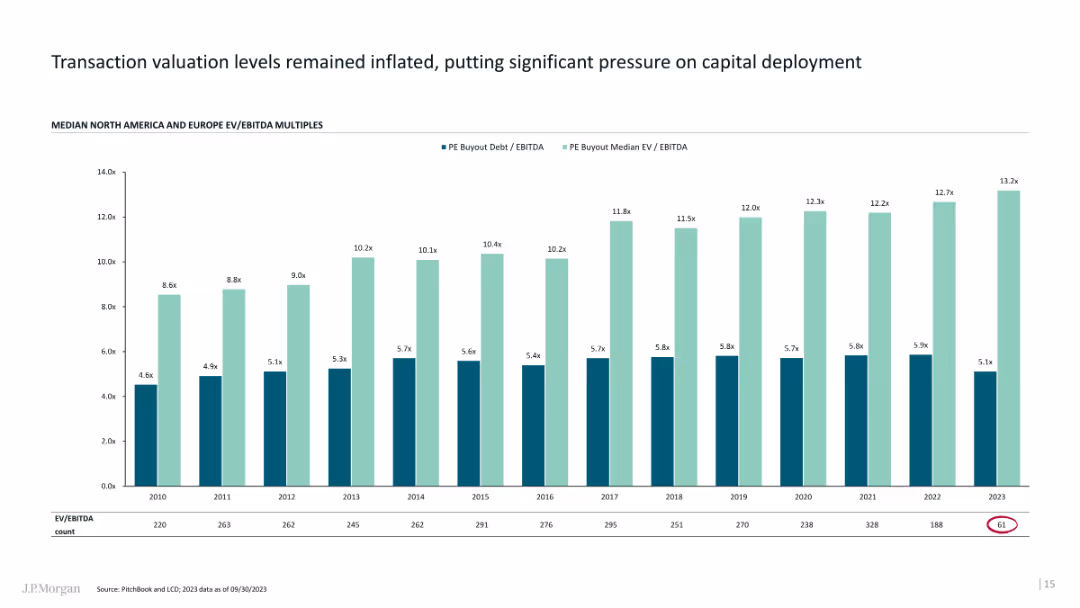
The slide includes column charts showing valuation multiples over time for different regions and types of buyouts.
Financial Performance
Financial Services
The slide examines the inflated transaction valuation levels and their impact on capital deployment strategies.
Transaction valuation, capital deployment, column charts, valuation multiples
false
Financial Performance
Financial Services
Single Chart
JP Morgan
Add to my slides
Remove from favorites
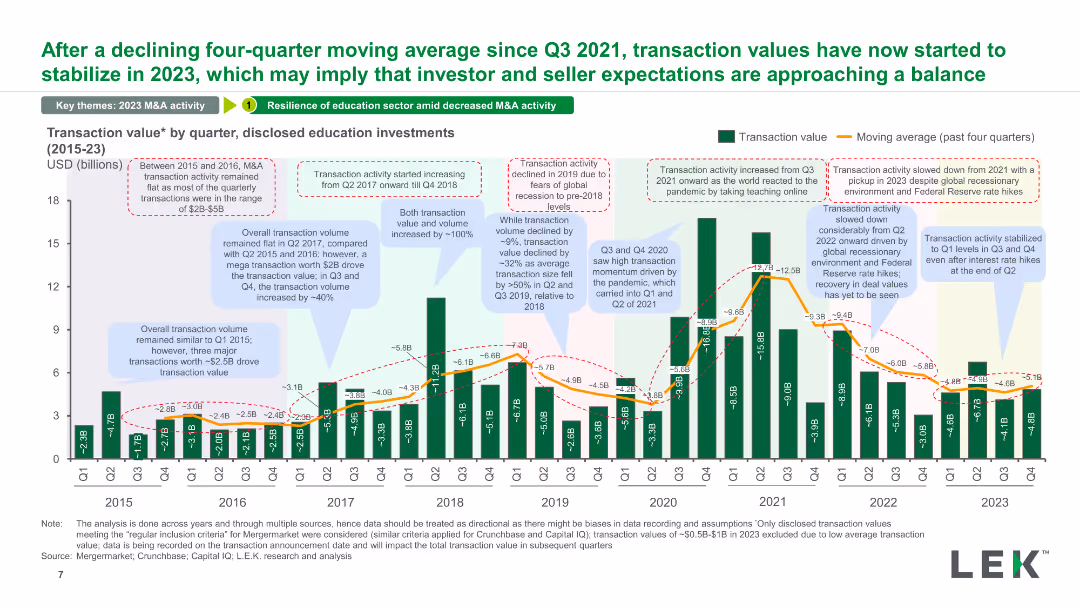
A column chart showing the transaction value by quarter for disclosed education investments from 2015 to 2023. It includes a moving average line and various annotations providing context for the data points.
Market Analysis and Trends
Education & Training
This slide shows the quarterly transaction values for education investments, emphasizing the trends over time. Annotations highlight significant periods of activity and reasons for fluctuations.
transaction value, quarterly, education investments, trends, moving average
false
Market Analysis and Trends
Education & Training
Single Chart
LEK
Add to my slides
Remove from favorites
The slide features a column chart detailing U.S. real estate transaction volumes from 1Q13 to 1Q24. The volumes are segmented by property types: Office, Industrial, Retail, and Apartment.
Market Analysis and Trends
Real Estate & Construction
This slide shows the trends in U.S. real estate transaction volumes over time, segmented by different types of properties. It's useful for understanding market activity and investment trends in the real estate sector.
transaction volumes, property types, market trends, investment, real estate, analysis
false
Market Analysis and Trends
Real Estate & Construction
Single Chart
JP Morgan
Add to my slides
Remove from favorites
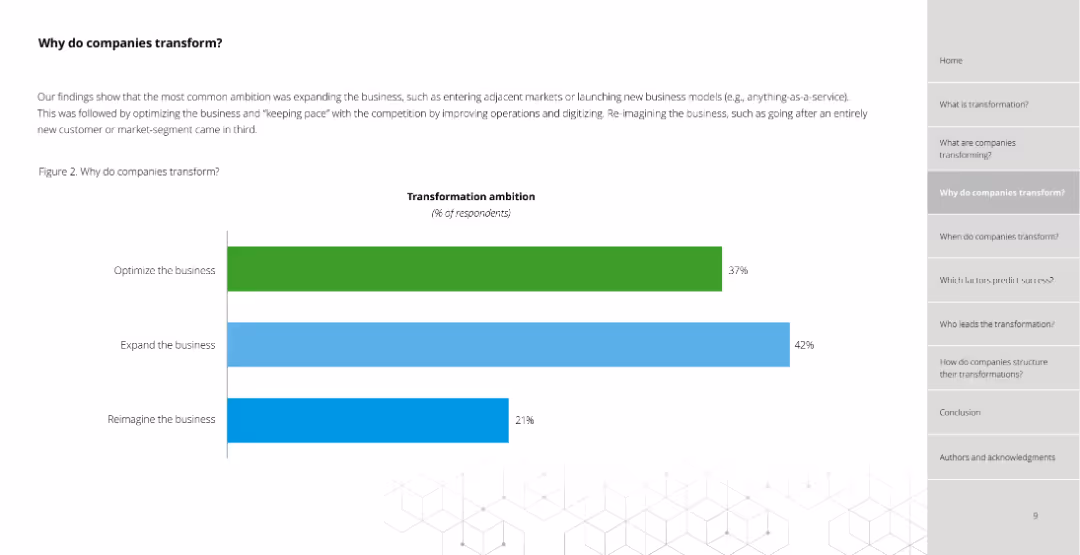
Bar chart (column chart) showing transformation ambitions with percentages for optimizing, expanding, and reimagining the business.
Strategic Planning
Professional Services
Illustrates the percentage of respondents focused on different transformation ambitions: optimizing (37%), expanding (42%), and reimagining (21%).
transformation, ambitions, optimizing, expanding, reimagining, percentages, business
false
Strategic Planning
Professional Services
Single Chart
Deloitte
Add to my slides
Remove from favorites
Slide with three blue-toned blocks containing key points, accompanied by icons and large numbered headings, and a shattered glass graphic, representing barriers and breakdowns.
Operational Efficiency
Professional Services
This slide lists three primary beliefs about why transformations fail, emphasizing issues with execution, scalability, and adherence to traditional processes. Useful for workshops discussing organizational change.
transformation, beliefs, execution, scalability, change management, organizational change, strategy, professional services
false
Operational Efficiency
Professional Services
Graphic
McKinsey
Add to my slides
Remove from favorites
The slide combines text with a large title on the left and a column chart on the right. The chart lists major enterprise-wide changes involving risk as a key group.
Strategic Planning
Financial Services
It outlines how risk management aligns with business transformation agendas, focusing on key enterprise-wide initiatives involving risk management.
Transformation, business alignment, enterprise-wide changes, risk management
false
Strategic Planning
Financial Services
Mixed Chart
EY
Add to my slides
Remove from favorites
Features a large pie chart and a vertical bar graph detailing percentages of failure reasons, in a monochromatic blue scheme. This layout efficiently presents comparative data.
Operational Efficiency
Professional Services
Analyzes specific reasons for transformation failures, focusing on employee resistance and management behavior, useful for training sessions on change management.
transformation, failure, employee resistance, management, behavior, professional services, bar graph, pie chart
false
Operational Efficiency
Professional Services
Multiple Chart
McKinsey
Add to my slides
Remove from favorites
The slide features a prominent image of a man writing, large text, and a two-tone circle graph. It uses high contrast and minimalistic design elements.
Operational Efficiency
Professional Services
The slide presents statistical data on the failure rate of organizational transformations, highlighting that 70% fail and only 30% reach their full potential. This slide could be used in strategic planning and change management meetings.
transformation, failure, statistics, organizations, change management, strategy, professional services, data presentation
false
Operational Efficiency
Professional Services
Single Chart
McKinsey
Add to my slides
Remove from favorites
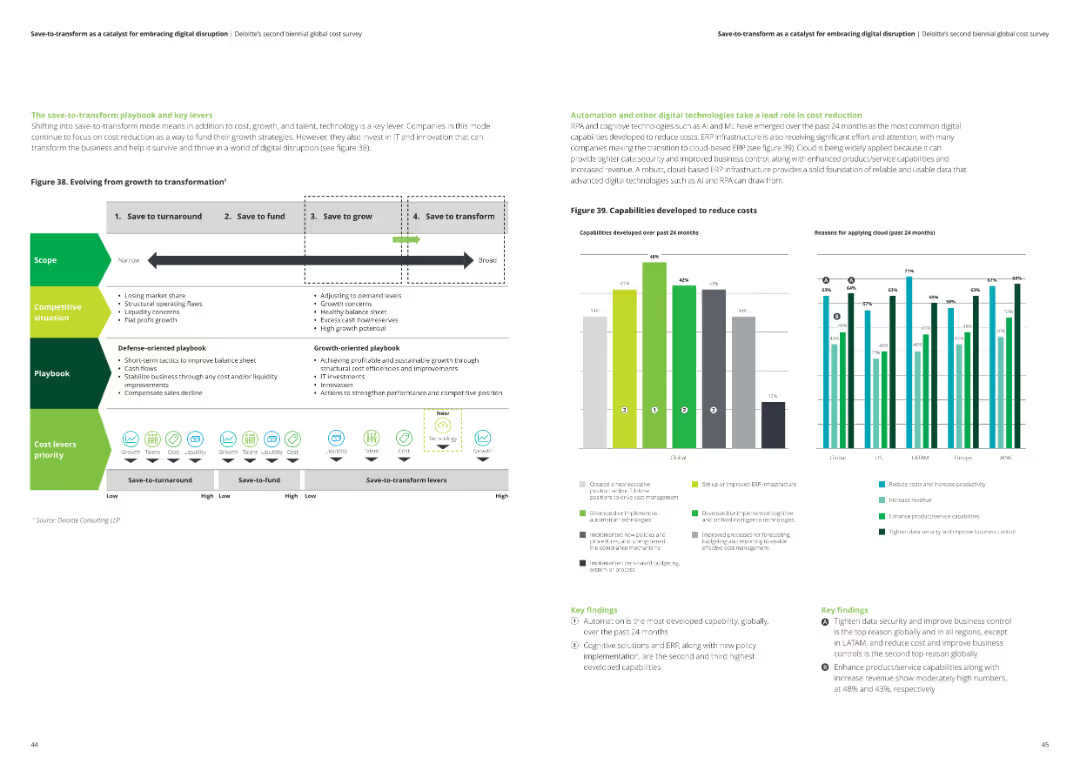
The slide includes a roadmap with phases such as "save-to-turnaround," "save-to-fund," "save-to-grow," and "save-to-transform." There are bar charts showing capabilities developed to reduce costs over the past 24 months.
Strategic Planning
Professional Services
This slide describes the progression from cost-saving strategies to transformative growth initiatives. It also highlights capabilities like automation and cloud adoption, developed to reduce costs and enhance productivity.
transformation, growth, cost reduction, automation, cloud adoption, roadmap
false
Strategic Planning
Professional Services
Multiple Chart
Deloitte
Add to my slides
Remove from favorites
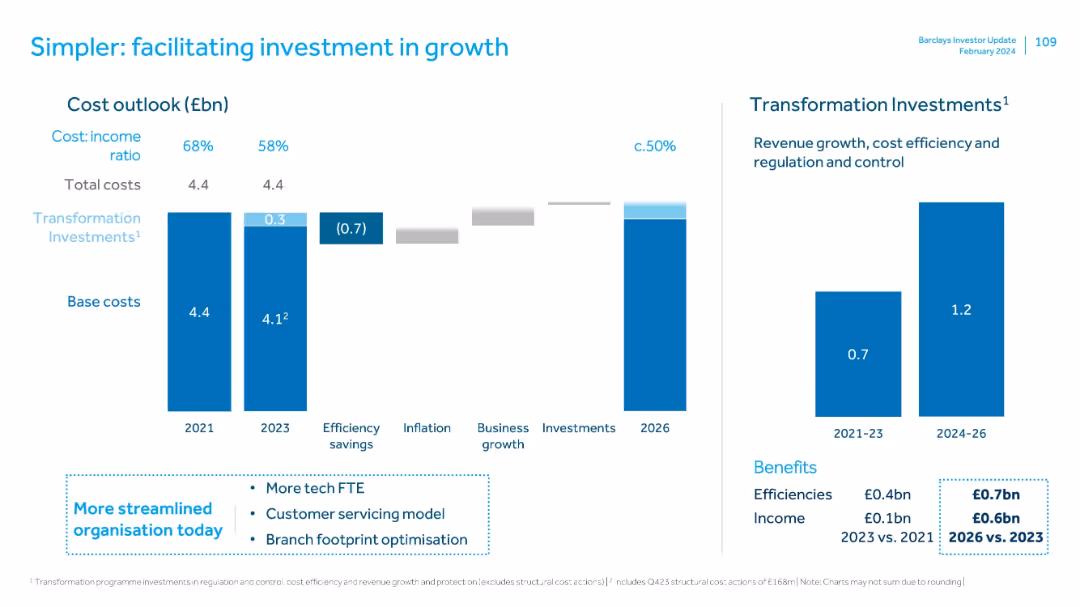
Bar chart and waterfall chart showing cost breakdown and transformation investments; benefits listed below.
Investment Analysis
Financial Services
Highlights Barclays UK’s transformation investment plan from 2021–2026, focusing on cost reduction and efficiency improvements. Forecasts cost-income ratio drop and benefits of £0.7bn in efficiencies by 2026.
transformation, investments, cost savings, efficiency, forecasts
false
Investment Analysis
Financial Services
Multiple Chart
Barclays
Add to my slides
Remove from favorites
The slide features a clear, professional layout with three columns of icons and text, describing key organizational requirements for transformation. Icons such as a human figure, group, and running person are used to symbolize the concepts.
Organizational Structure and Change
Professional Services
This slide outlines prerequisites for organizational transformation including leadership commitment, board support, and a strong desire for change, using both text and symbolic icons.
transformation, leadership, organizational change, board support, commitment
false
Organizational Structure and Change
Professional Services
Table
McKinsey
Add to my slides
Remove from favorites
The slide features three overlapping circles (Venn diagram) with text blocks aligned vertically on the right. The text is clear and organized, with three main categories highlighted in bold: Enable People, Set New Targets, and Build Capabilities.
Organizational Structure and Change
Professional Services
Focuses on the necessity of putting people at the center of organizational transformations, specifically building new capabilities, setting new targets, and accountability. It discusses leadership commitment and engaging stakeholders.
Transformation, Leadership, Stakeholders, Accountability, Capabilities
false
Organizational Structure and Change
Professional Services
Framework
Accenture
Add to my slides
Remove from favorites
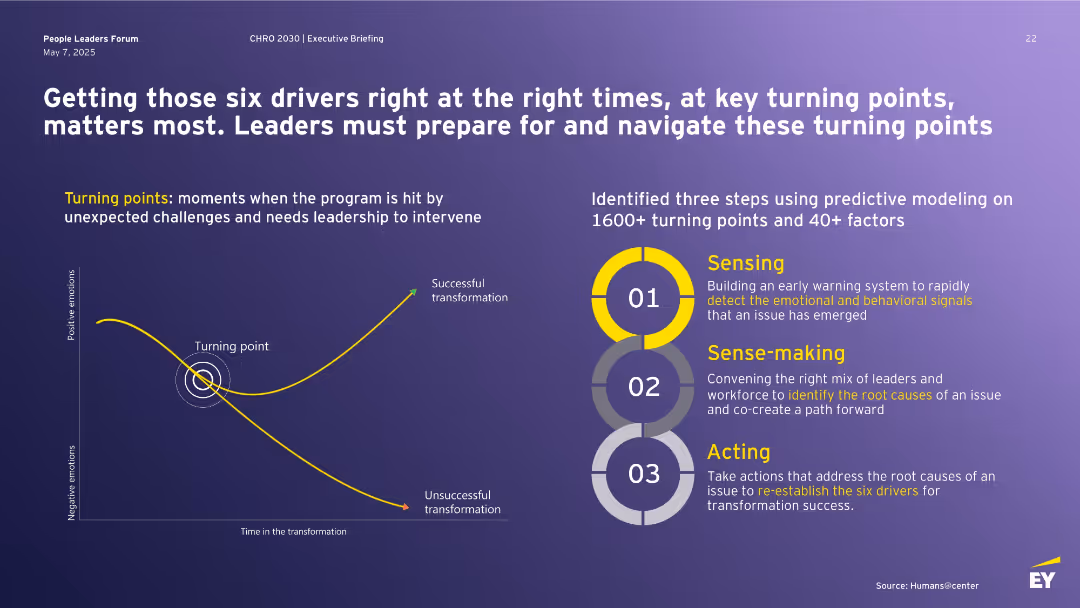
Dark background with bold white heading at top, yellow-highlighted keywords, chart on left showing turning point curve, and three-step circular graphic on right.
Strategic Planning
Professional Services
The slide emphasizes the importance of timing in leadership interventions during transformation initiatives. It introduces the concept of “turning points” and outlines a three-step model—Sensing, Sense-making, Acting—based on data analysis of over 1,600 cases. The aim is to guide leaders through critical transformation junctures.
transformation, leadership, turning point, predictive modeling, intervention, success, emotional signals, root cause, business change
false
Strategic Planning
Professional Services
Mixed Chart
EY
Add to my slides
Remove from favorites
The slide features a large, bold title in purple asking a transformative question about learning in an organization. It includes a stylized figure interacting with a blank blackboard, suggesting teaching or presenting. The background is a minimalist white room, focusing attention on the title and graphic.
Industry Overview
Education & Training
This slide introduces the concept of transformation in organizational learning, prompting viewers to consider the readiness for change. It likely serves as a section header or opening to a discussion about innovative learning strategies in corporate settings.
transformation, learning, organization, education, change, innovation, readiness, corporate training, engagement
false
Industry Overview
Education & Training
Title
Accenture
Add to my slides
Remove from favorites
Slide displays 4 critical management practices as icons with descriptions below each. Blue and black color scheme.
Organizational Structure and Change
Professional Services
Explains critical management practices for evaluating organizational health during transformation. Helps in management training.
transformation, management, health, practices, organizational
false
Organizational Structure and Change
Professional Services
Linear Flow
McKinsey
Add to my slides
Remove from favorites
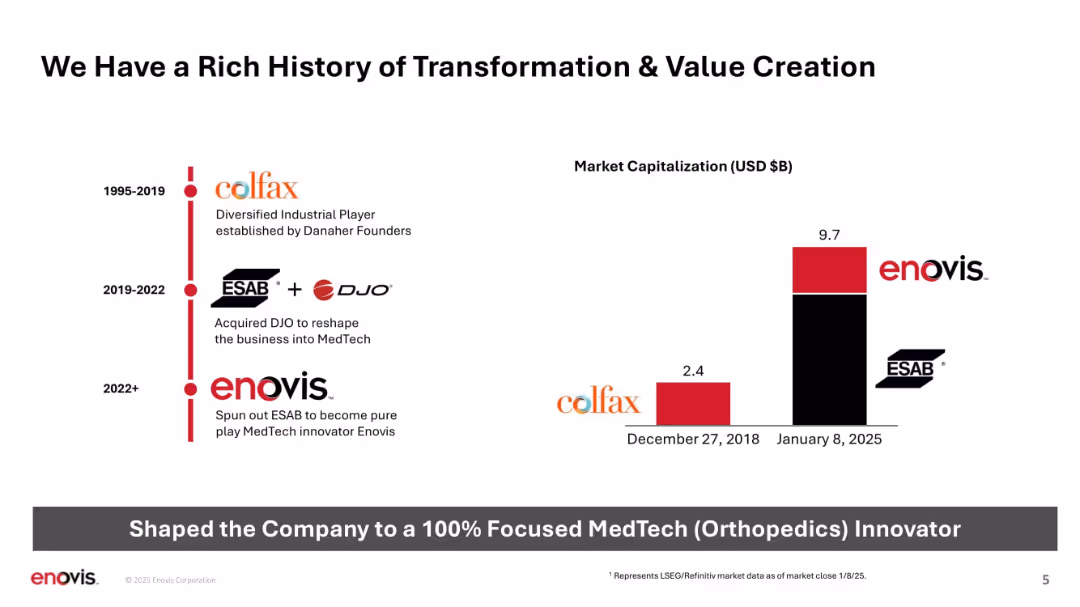
Timeline on left, bar chart on right; clean and minimalistic layout with red and black bars.
Strategic Planning
Healthcare & Pharmaceuticals
Chronicles Enovis's transformation from Colfax to a focused MedTech company through acquisitions and restructuring. Illustrates significant increase in market capitalization from 2018 to 2025 and outlines historical evolution stages.
transformation, MedTech, history, timeline, value creation, Colfax, DJO, ESAB, Enovis
false
Strategic Planning
Healthcare & Pharmaceuticals
Mixed Chart
JP Morgan
Add to my slides
Remove from favorites
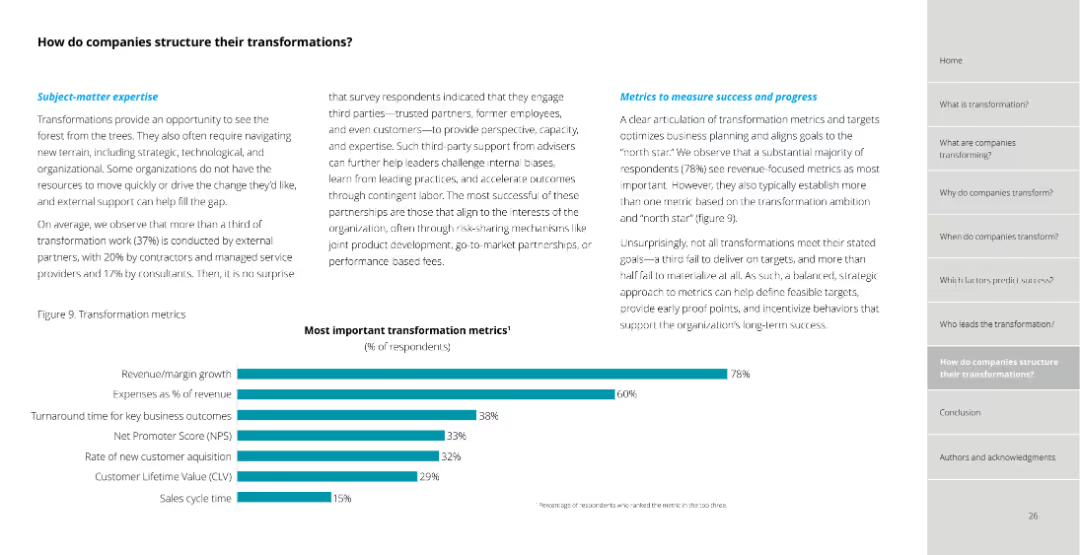
The slide has a column chart depicting important transformation metrics ranked by respondents, along with text discussing the involvement of third-party support in transformation efforts.
Organizational Structure and Change
Professional Services
Describes key metrics for measuring the success of transformation efforts and the role of third-party support, based on survey responses and their ranked importance of various metrics.
transformation metrics, third-party support, survey data, transformation success, metrics importance
false
Organizational Structure and Change
Professional Services
Mixed Chart
Deloitte
Add to my slides
Remove from favorites
This is a detailed timeline slide showing the phases of the UK Platform Transformation Programme, with icons denoting the stages from design to phased migration. It features a balance between text and graphics to describe the progress and future steps of the program.
Operational Efficiency
Technology & Software
This slide provides a detailed look at the UK Platform Transformation Programme's stages and planned milestones, used to discuss the program's progress and future planning for successful migration.
Transformation, Milestones, Planning, Programme, Migration
false
Operational Efficiency
Technology & Software
Linear Flow
Morgan Stanley
Add to my slides
Remove from favorites
Slide includes lists and icons under headings "PROGRESS" and "WORKSTREAMS", detailing steps in a 3-year transformation plan.
Operational Efficiency
Consumer Goods
Explains the operational transformation roadmap with anticipated benefits like margin enhancement and support of financial targets.
transformation, operational efficiency, margin enhancement, financial targets, roadmap, icons
false
Operational Efficiency
Consumer Goods
Boxed
Barclays
Add to my slides
Remove from favorites
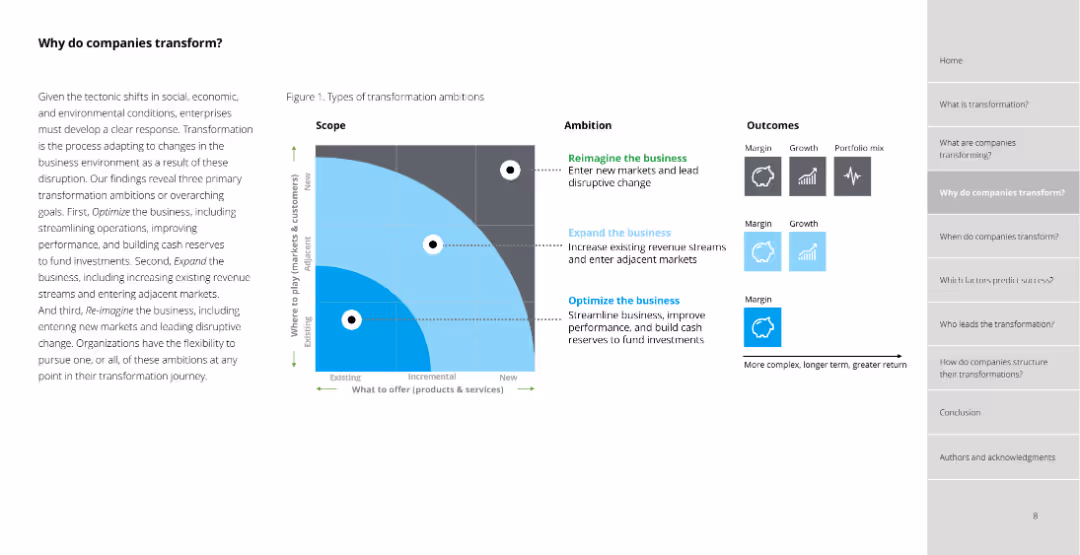
The slide features a quadrant chart with transformation ambitions: Optimize, Expand, and Reimagine. It includes text on the left and icons on the right.
Strategic Planning
Professional Services
Discusses three primary transformation ambitions for businesses: optimizing, expanding, and reimagining. Includes a quadrant chart illustrating these ambitions.
transformation, optimize, expand, reimagine, business, ambitions, goals, quadrant, chart
false
Strategic Planning
Professional Services
Diagram
Deloitte
Add to my slides
Remove from favorites
Slide with a dark background and a bold blue abstract shape, organized into sections describing benefits across financial and organizational metrics.
Operational Efficiency
Professional Services
Describes the expected benefits of successful transformations, including financial performance and organizational health. Useful for presentations to stakeholders or during strategic planning.
transformation, outcomes, financial performance, organizational health, strategy, professional services, benefits
false
Operational Efficiency
Professional Services
Pillar
McKinsey
Add to my slides
Remove from favorites
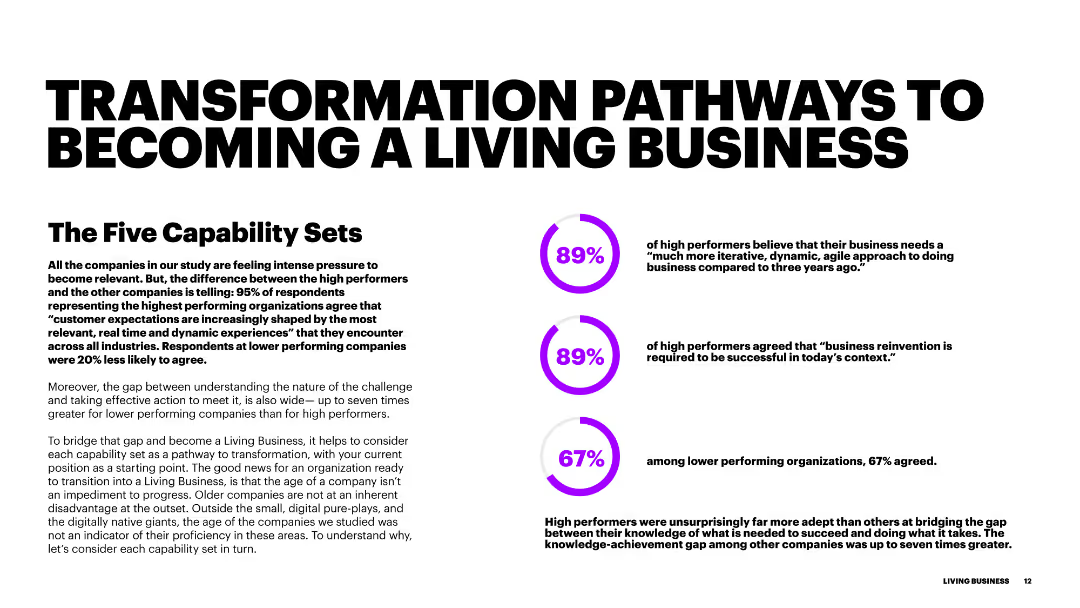
The slide has a large title at the top with three circular progress indicators on the right. Each circle has a percentage and a brief statement related to transformation and performance.
Strategic Planning
Professional Services
This slide outlines the key pathways for businesses to become 'living businesses,' focusing on agility, relevance, and innovation as crucial transformation areas.
transformation, pathways, business, performance, agility, innovation
false
Strategic Planning
Professional Services
Multiple Chart
Accenture
Add to my slides
Remove from favorites
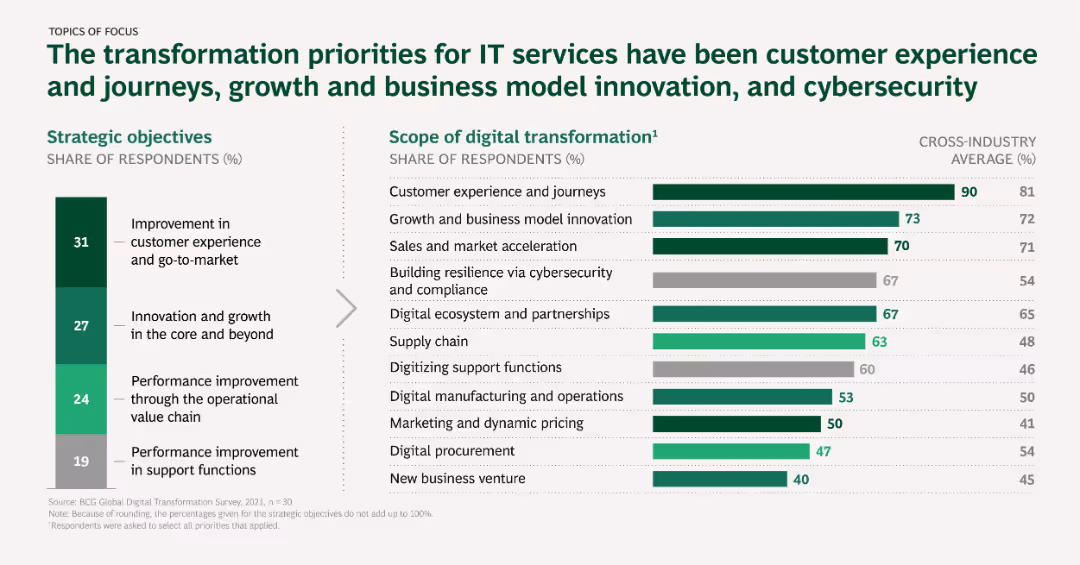
Horizontal bar chart showing strategic objectives and scope of digital transformation for IT services, with comparisons to cross-industry averages.
Strategic Planning
Telecommunications
This slide outlines the transformation priorities for IT services, focusing on customer experience, growth, cybersecurity, and other strategic objectives in digital transformation.
Transformation priorities, IT services, Customer experience, Growth, Cybersecurity
false
Strategic Planning
Telecommunications
Multiple Chart
BCG
Add to my slides
Remove from favorites
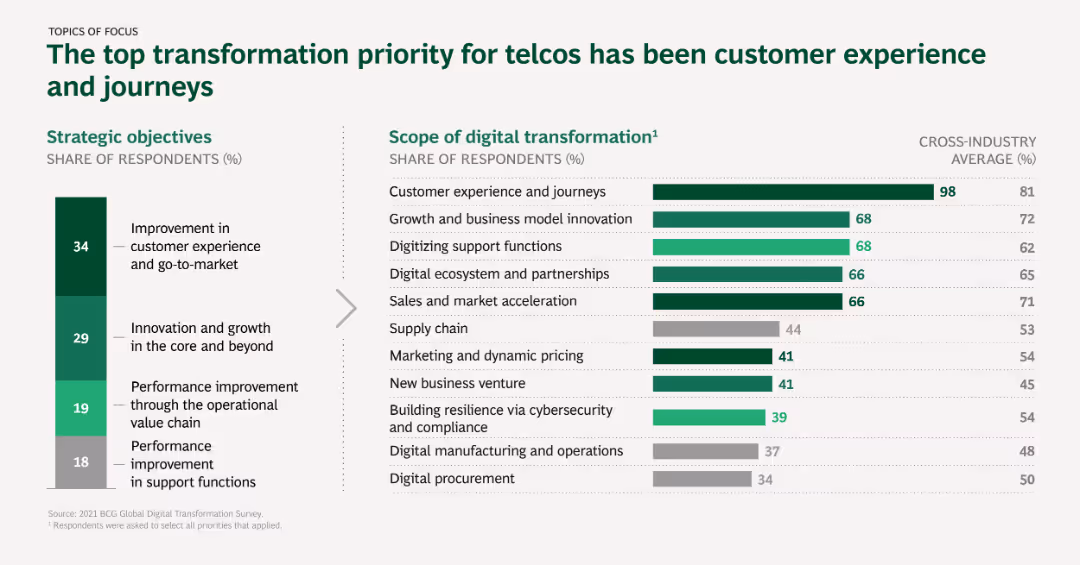
The slide contains a vertical bar chart showing the top strategic objectives and scope of digital transformation initiatives among telcos, with color coding for cross-industry comparison.
Strategic Planning
Telecommunications
This slide identifies the top priorities for digital transformation in the telco sector, emphasizing customer experience and journeys as the primary focus.
Transformation priorities, Telcos, Customer experience, Strategic objectives, Digital initiatives
false
Strategic Planning
Telecommunications
Multiple Chart
BCG
Add to my slides
Remove from favorites
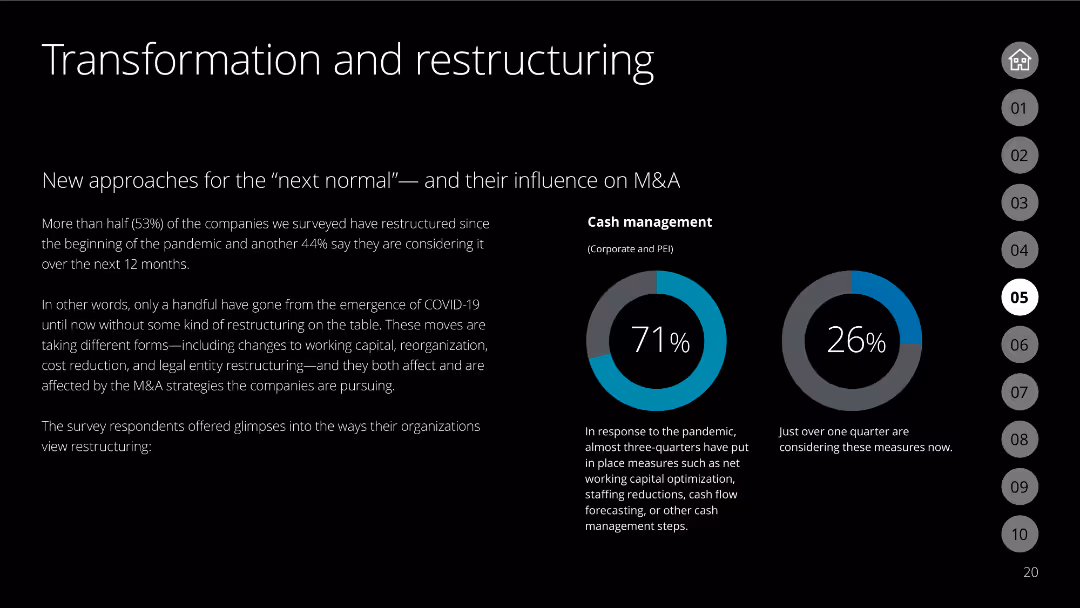
The slide features two donut charts showing responses to cash management measures taken during the pandemic.
Organizational Structure and Change
Financial Services
Analyzes how companies have restructured and the influence of these changes on M&A strategies.
transformation, restructuring, M&A, pandemic, cash management
false
Organizational Structure and Change
Financial Services
Mixed Chart
Deloitte
Add to my slides
Remove from favorites
Consists of detailed icons and labels arranged around central themes in a visually engaging manner, using a dark theme with blue accents.
Operational Efficiency
Professional Services
Discusses the components necessary for a successful transformation, emphasizing leadership and organizational health. Ideal for executive briefings or strategy sessions.
transformation, strategy, leadership, organizational health, execution, capacity building, professional services
false
Operational Efficiency
Professional Services
Pillar
McKinsey
Add to my slides
Remove from favorites
Slide contains two sections with a large title at the top. Left side features a brief text paragraph, right side features a column chart (Figure 7) with four levels of maturity.
Strategic Planning
Media & Entertainment
Discusses strategies for transforming ad sales and operations to optimize investment in growth. Highlights a maturity framework to guide media companies through various stages of transformation.
transformation, strategy, media, ad sales, maturity, operations, optimization, investment, framework, growth
false
Strategic Planning
Media & Entertainment
Framework
Accenture
Add to my slides
Remove from favorites
Features a central diagram categorizing strategic areas of focus, including strategy, performance, and capital, using a balanced and clear layout with segment-specific icons.
Operational Efficiency
Professional Services
This slide outlines the broad areas to consider in a transformation strategy, useful for comprehensive strategic planning or training sessions on corporate restructuring.
transformation, strategy, performance, capital, organizational health, professional services, diagram
false
Operational Efficiency
Professional Services
Framework
McKinsey
Add to my slides
Remove from favorites
This slide shows three circle diagrams with percentages, depicting success rates of company transformations.
Financial Performance
Professional Services
The slide presents statistics on how companies fare in transformation efforts, indicating a majority see mediocre results, with only a minority exceeding expectations.
transformation, success, companies, statistics, change
false
Financial Performance
Professional Services
Multiple Chart
Bain
Add to my slides
Remove from favorites
Contains three pie charts and descriptive texts with a minimalistic blue and black design. Visual elements are used to emphasize the data points, highlighting various aspects of transformation shortcomings.
Operational Efficiency
Professional Services
Explores reasons transformations don’t fully succeed by discussing goals, delivery pace, and sustainability. Could be used in management meetings to discuss improvement areas.
transformation, success, goals, pace, sustainability, management, strategy, pie charts, professional services
false
Operational Efficiency
Professional Services
Pillar
McKinsey
Add to my slides
Remove from favorites
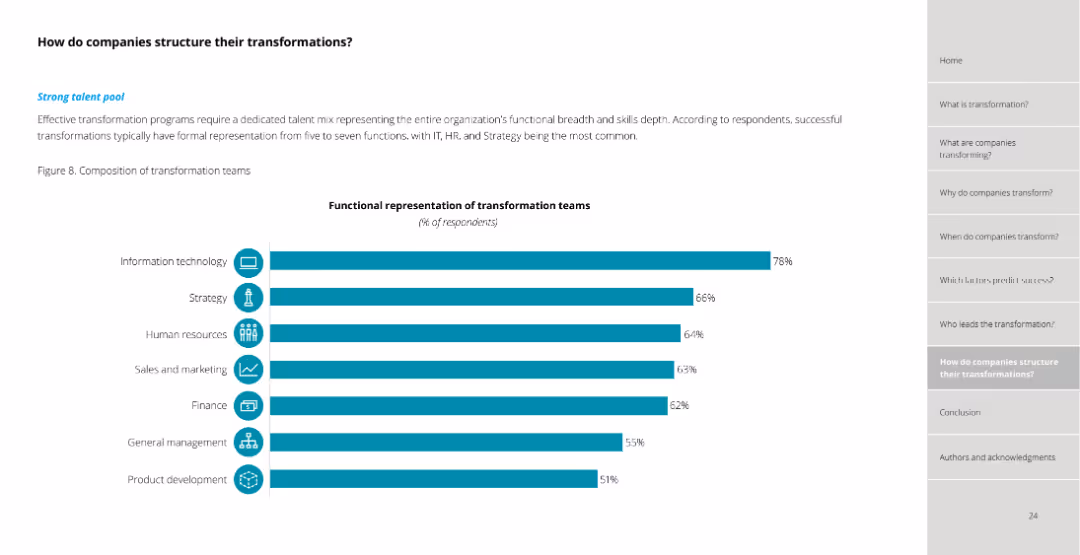
The slide includes a column chart showing the functional representation of transformation teams by percentage of respondents, listing roles like IT, Strategy, HR, Sales and Marketing, etc.
Organizational Structure and Change
Professional Services
Outlines how companies structure their transformation teams, highlighting the most common functional roles represented in successful transformation efforts based on survey data.
transformation teams, organizational structure, functional roles, survey data, transformation success
false
Organizational Structure and Change
Professional Services
Single Chart
Deloitte
Add to my slides
Remove from favorites
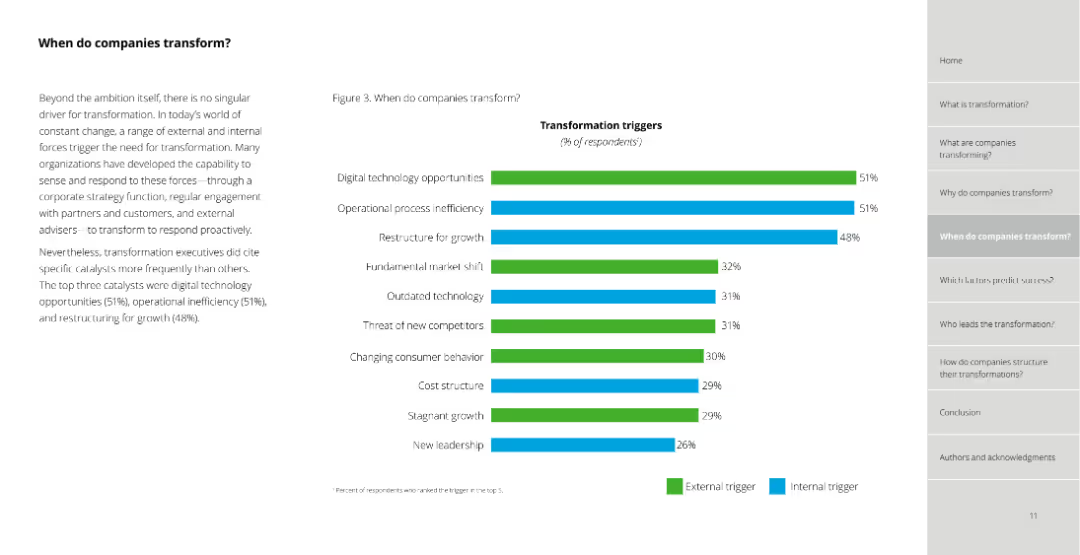
Bar chart (column chart) displaying percentages for various transformation triggers like digital opportunities, operational inefficiency, etc.
Strategic Planning
Professional Services
Highlights various triggers for transformation, including digital technology opportunities, operational inefficiencies, and restructuring for growth.
transformation, triggers, digital, operational, inefficiency, growth, restructuring
false
Strategic Planning
Professional Services
Mixed Chart
Deloitte
Add to my slides
Remove from favorites
Contains a timeline showing transformation milestones from 1Q23 to 2025 and beyond, along with column charts depicting risk-weighted assets and leverage exposure.
Strategic Planning
Financial Services
Outlines the transformation plan for CS First Boston, including reducing capital needs, strategic initiatives, and expected financial impact by 2025.
transformation, value creation, CS First Boston, risk-weighted assets, leverage exposure
false
Strategic Planning
Financial Services
Multiple Chart
Credit Suisse
Add to my slides
Remove from favorites
Bar charts comparing initial management aspirations to what was implemented and the resulting value multiples.
Investment Analysis
Professional Services
Compares initial aspirations and actual outcomes in transformation projects to demonstrate value created.
transformation, value, management, outcomes, comparison
false
Investment Analysis
Professional Services
Multiple Chart
McKinsey
Add to my slides
Remove from favorites
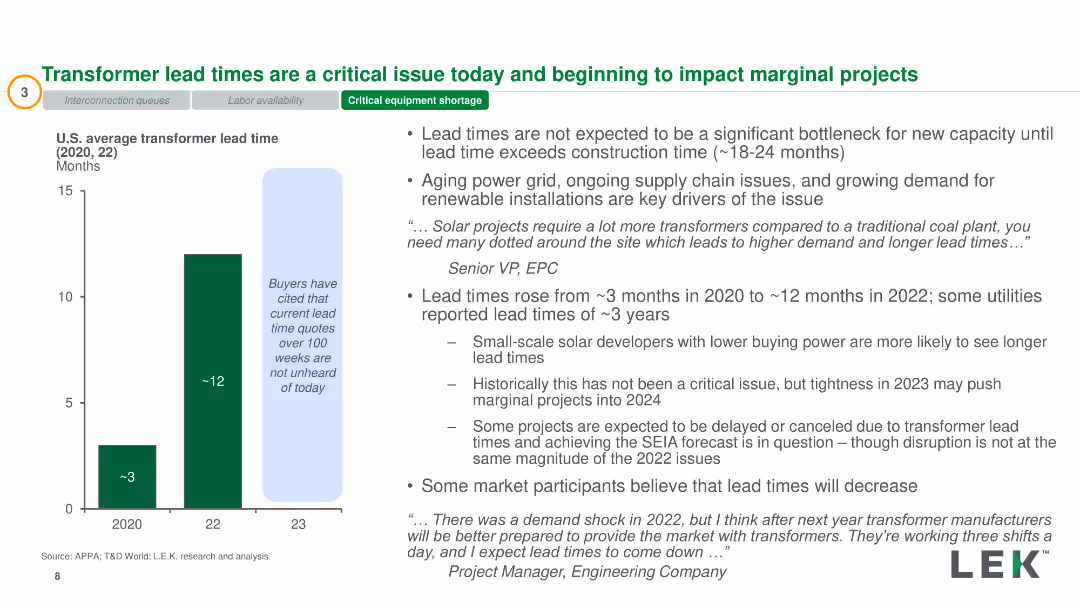
Bar chart showing transformer lead times from 2020 to 2023. Text boxes highlight issues related to supply chain and lead times. Dense with data.
Operational Efficiency
Energy & Utilities
Examination of transformer lead times and their impact on solar project timelines, highlighting supply chain issues and increased lead times.
Transformer, Lead Times, Supply Chain, Solar Projects, Impact
false
Operational Efficiency
Energy & Utilities
Mixed Chart
LEK
Add to my slides
Remove from favorites
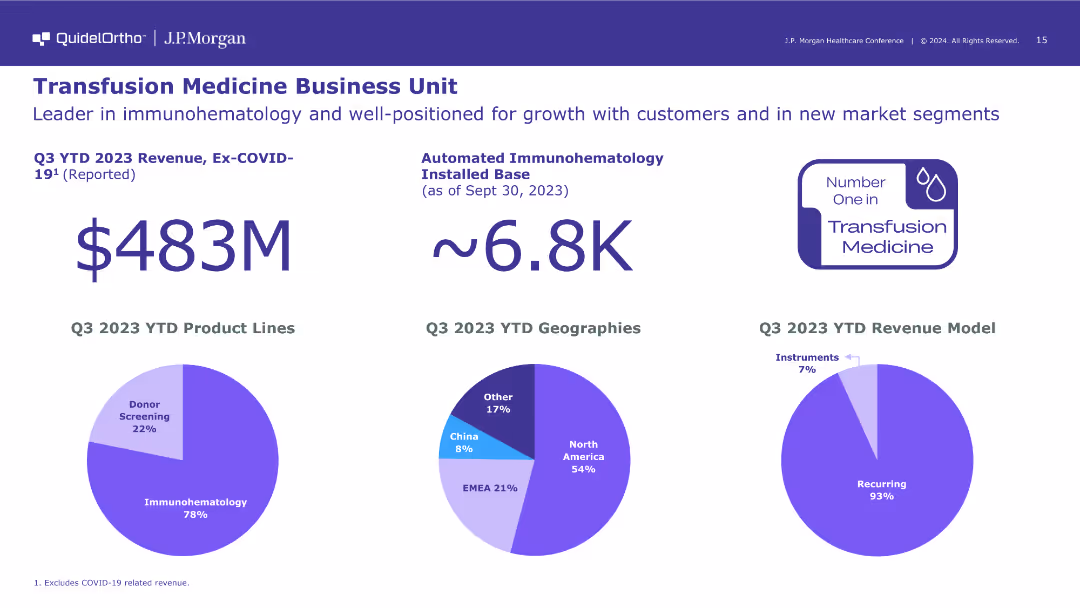
The slide displays revenue figures, a pie chart for Q3 2023 YTD product lines, geographies, and a notable badge indicating leadership in transfusion medicine. The layout is balanced and visually appealing.
Product and Service Analysis
Healthcare & Pharmaceuticals
The slide highlights the performance and market position of QuidelOrtho's Transfusion Medicine Business Unit, showcasing its revenue, installed base, and the breakdown of its product lines.
transfusion medicine, revenue, product lines
false
Product and Service Analysis
Healthcare & Pharmaceuticals
Multiple Chart
JP Morgan
Add to my slides
Remove from favorites
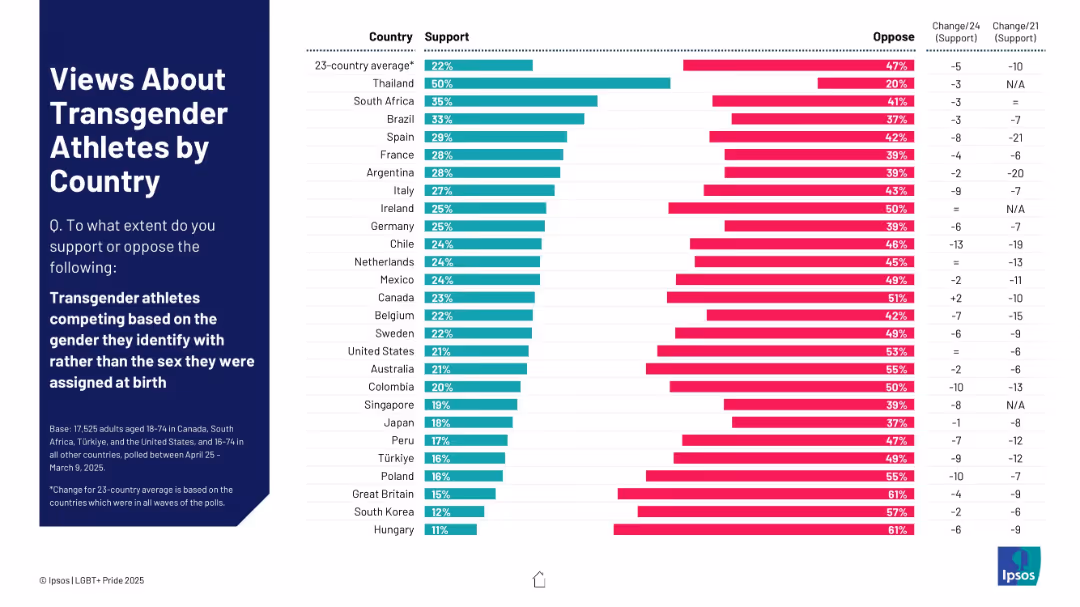
Bar chart ranking support and opposition to transgender athletes competing by gender identity; includes change over time.
Regulatory and Compliance
Government & Public Sector
This slide explores how people in 23 countries view transgender athletes competing according to their gender identity rather than assigned sex. It lists support and opposition rates and tracks changes in support from past years.
transgender athletes, gender identity, sports policy, public sentiment, international survey, athletic competition, LGBTQ+ rights
false
Regulatory and Compliance
Government & Public Sector
Mixed Chart
IPSOS
Add to my slides
Remove from favorites
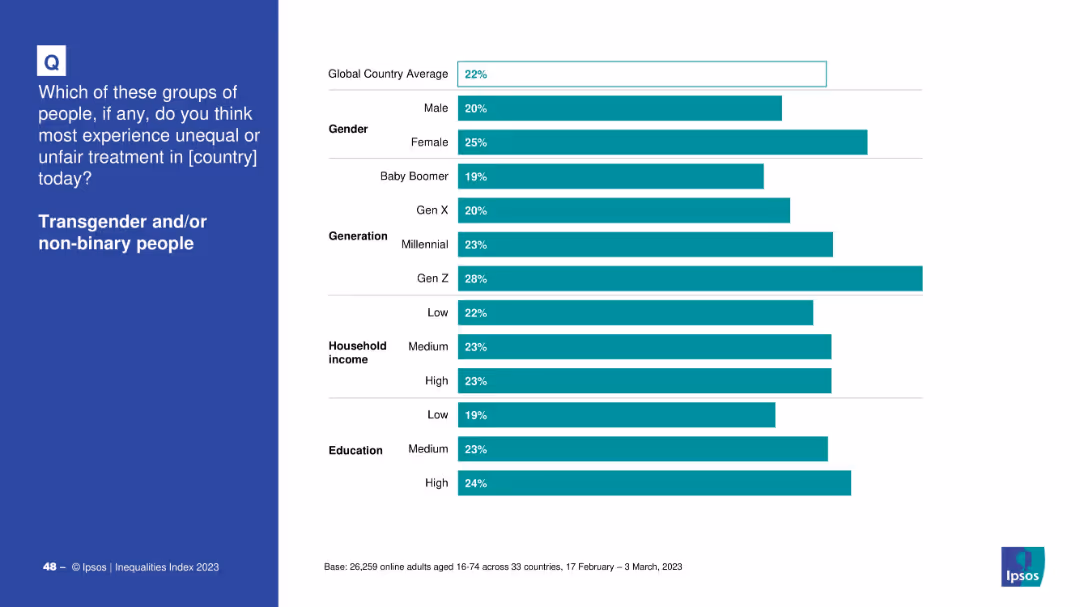
Bar chart segmented by demographics: gender, generation, income, and education
Market Analysis and Trends
Government & Public Sector
The slide shows perceptions of unfair treatment of transgender and non-binary people across global demographics. Gen Z and females perceive the highest levels of discrimination, suggesting generational awareness and gendered perspectives.
transgender, demographics, Gen Z, gender gap, Ipsos, income, education, inequality, survey
false
Market Analysis and Trends
Government & Public Sector
Mixed Chart
IPSOS
Add to my slides
Remove from favorites
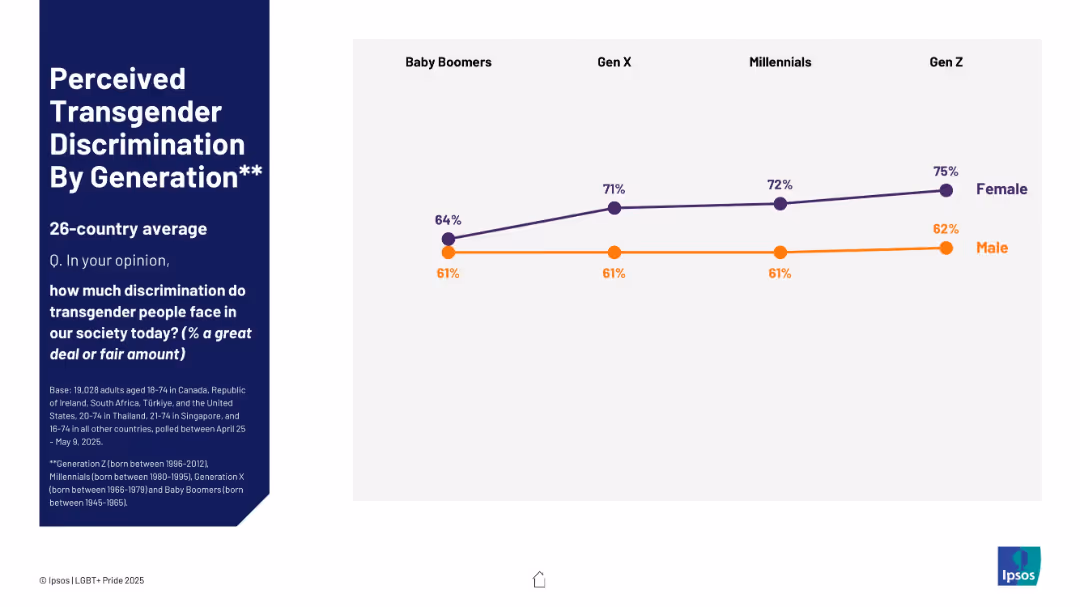
Line chart with male and female lines across four generations
Risk Assessment and Management
Government & Public Sector
This slide shows generational perceptions of transgender discrimination. Female respondents increasingly perceive high levels of discrimination from Baby Boomers to Gen Z. Male perceptions remain largely stable, with a slight increase among Gen Z.
transgender, discrimination, perception, gender difference, generation gap, Ipsos
false
Risk Assessment and Management
Government & Public Sector
Mixed Chart
IPSOS
Add to my slides
Remove from favorites
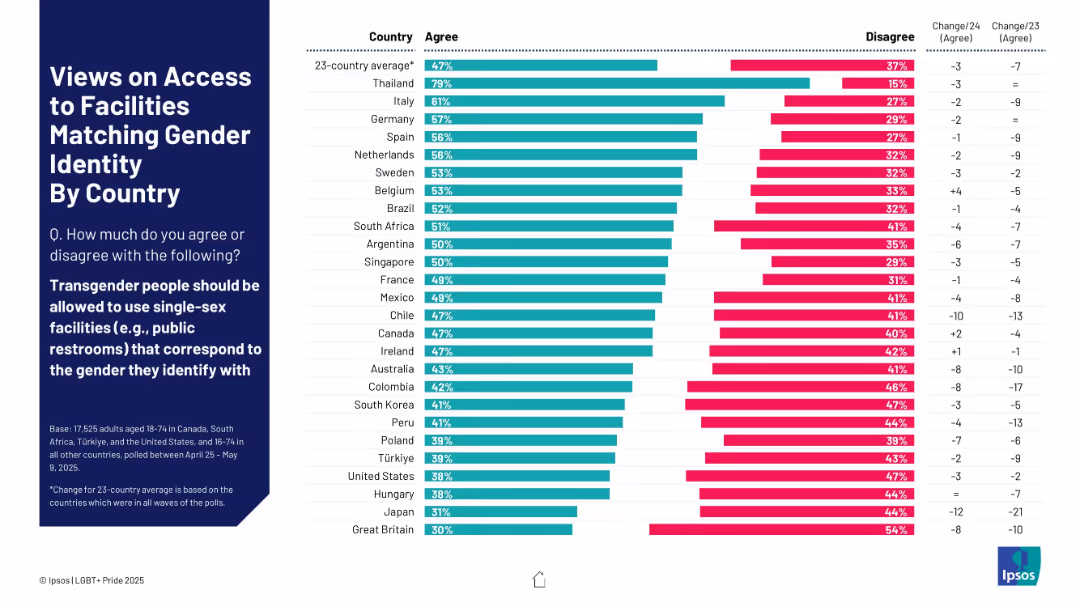
Horizontal bar chart ranking agreement/disagreement across countries; left-aligned title and subtitle; color-coded bars (turquoise for "Agree", pink for "Disagree"); includes change vs. previous years.
Regulatory and Compliance
Government & Public Sector
This slide shows public opinion in 23 countries regarding whether transgender individuals should be allowed to use facilities matching their gender identity. It includes agreement and disagreement percentages, as well as year-over-year changes in agreement.
transgender, gender identity, public restrooms, country comparison, opinion poll, LGBTQ+, facilities, access rights, international views, Ipsos
false
Regulatory and Compliance
Government & Public Sector
Mixed Chart
IPSOS
Add to my slides
Remove from favorites
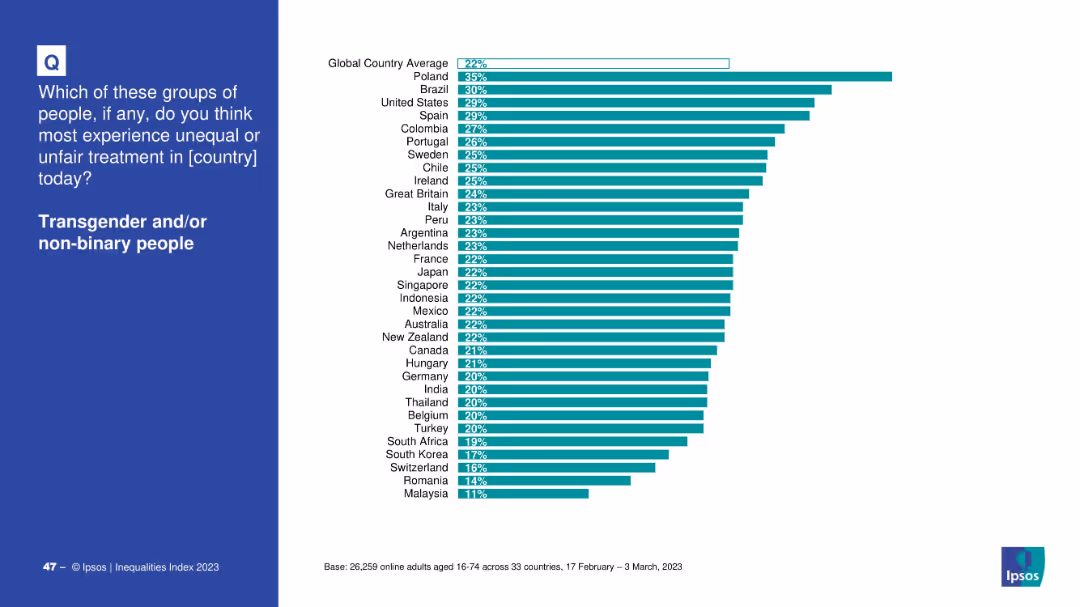
Bar chart showing global country comparison, teal bars on white background, blue text panel on left
Market Analysis and Trends
Government & Public Sector
This slide presents the perceived unfair treatment of transgender and/or non-binary individuals across 33 countries. Poland, Brazil, and the US top the chart. A global average of 22% indicates notable concern for this group.
transgender, non-binary, inequality, global perception, survey, discrimination, Ipsos, bar chart, 2023
false
Market Analysis and Trends
Government & Public Sector
Mixed Chart
IPSOS
Add to my slides
Remove from favorites
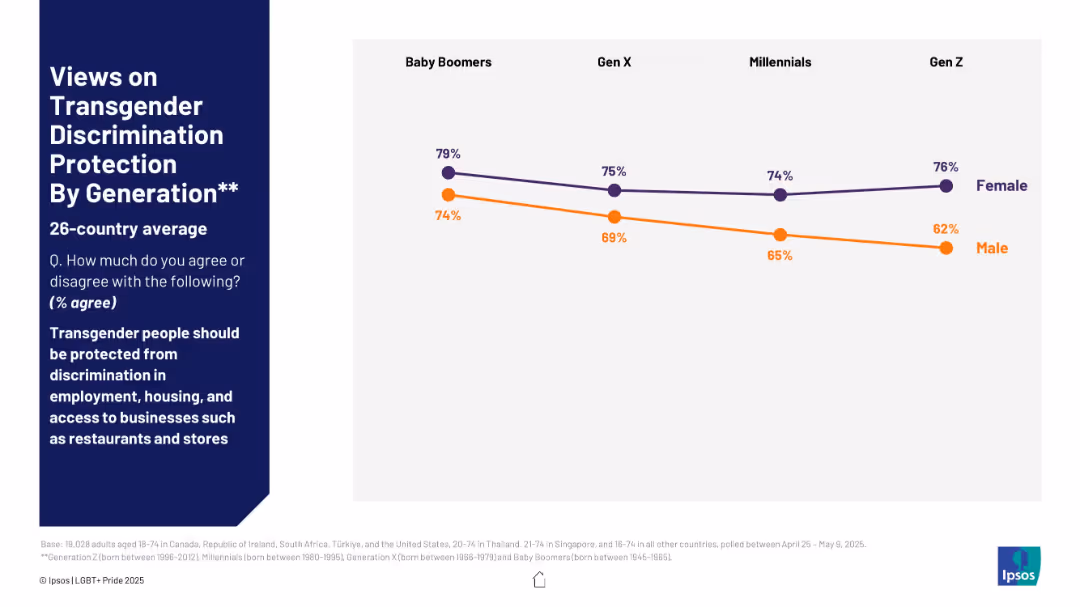
Line graph by generation and gender; female and male response trends
Market Analysis and Trends
Government & Public Sector
This slide tracks generational differences in agreement with protecting transgender people from discrimination. Female agreement remains higher across all generations, with Baby Boomers and Gen Z females showing the highest support. Male support declines notably in Gen Z.
transgender protection, generation gap, male vs female, social support, discrimination, Ipsos
false
Market Analysis and Trends
Government & Public Sector
Mixed Chart
IPSOS
Add to my slides
Remove from favorites
A column chart displaying agreement and disagreement percentages across countries regarding transgender rights and freedoms. Countries are listed on the x-axis.
Market Analysis and Trends
Government & Public Sector
The slide highlights significant cultural differences in the acceptance of transgender rights across various countries, showing where support is highest and lowest.
transgender rights, cultural differences, freedoms, agreement, disagreement, column chart, countries
false
Market Analysis and Trends
Government & Public Sector
Multiple Chart
IPSOS
Add to my slides
Remove from favorites
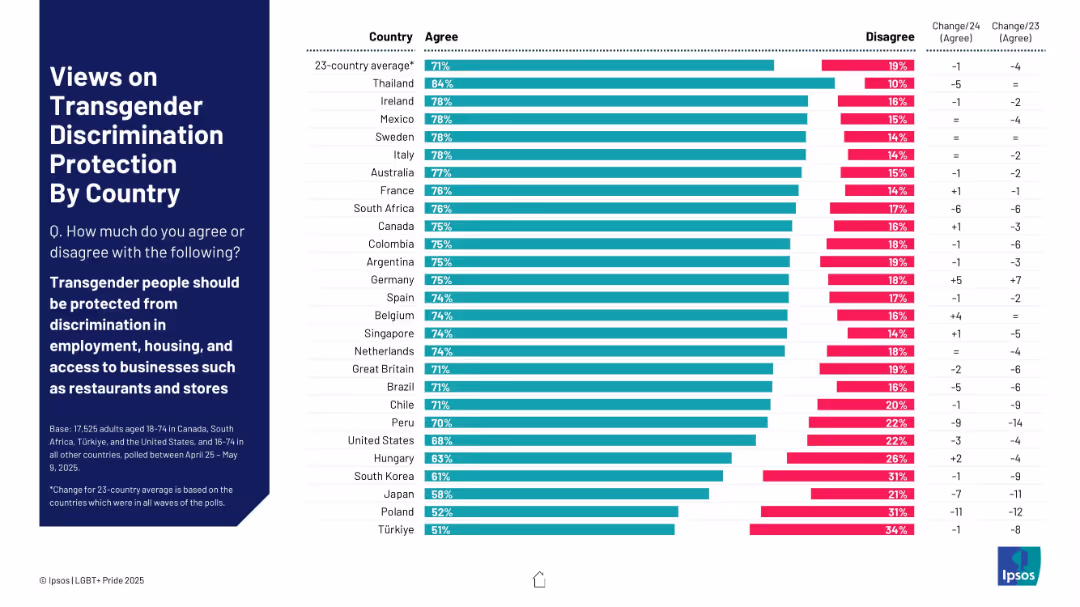
Horizontal bar chart by country; comparison of agreement/disagreement levels
Market Analysis and Trends
Government & Public Sector
This slide examines public agreement on protecting transgender individuals from discrimination in work and business settings. Thailand shows the highest agreement (84%), while Türkiye and Poland have the lowest (51%–52%). Changes over two years reflect regional policy shifts and public sentiment evolution.
transgender rights, discrimination, workplace, agreement, international, social attitudes, Ipsos
false
Market Analysis and Trends
Government & Public Sector
Mixed Chart
IPSOS
Add to my slides
Remove from favorites
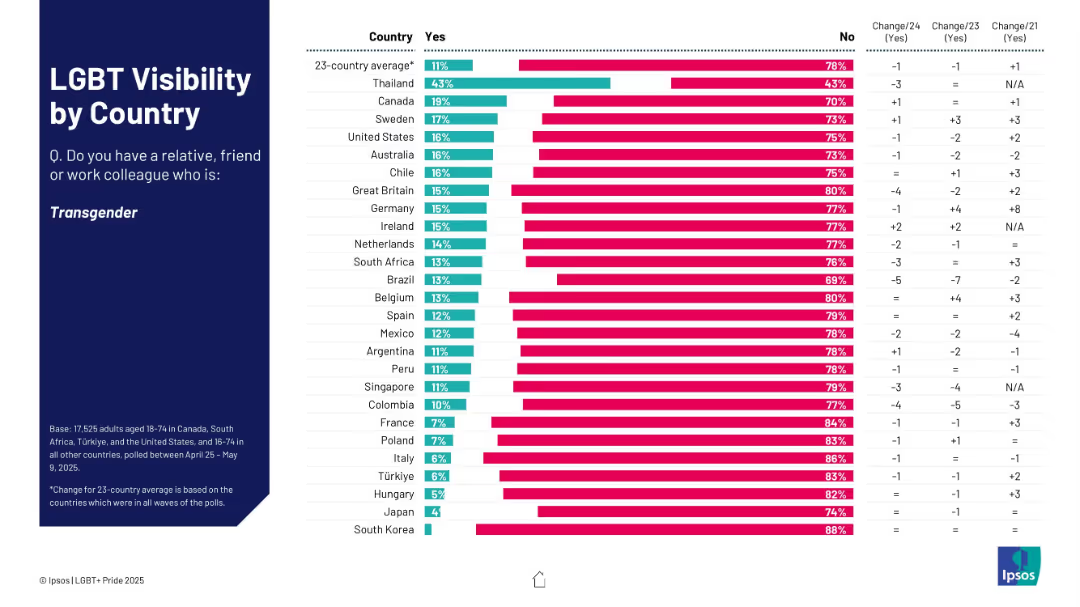
Bar chart showing % who know someone transgender; ranked by country with yes/no breakdown.
Market Analysis and Trends
Government & Public Sector
This slide assesses how many respondents know a transgender person, broken down by country. Thailand shows the highest visibility; South Korea and Japan the lowest. Change data is also displayed.
transgender, visibility, country ranking, social awareness, Ipsos survey
false
Market Analysis and Trends
Government & Public Sector
Mixed Chart
IPSOS
Add to my slides
Remove from favorites
Multiple sections with text and a small bar chart showing renewable energy capacity additions.
Strategic Planning
Energy & Utilities
Discusses Turkey's shift towards domestic renewable energy sources and the consistent increase in renewable energy generation.
Transition, Renewable, Energy, Domestic, Growth
false
Strategic Planning
Energy & Utilities
Multiple Chart
Kearney
Add to my slides
Remove from favorites
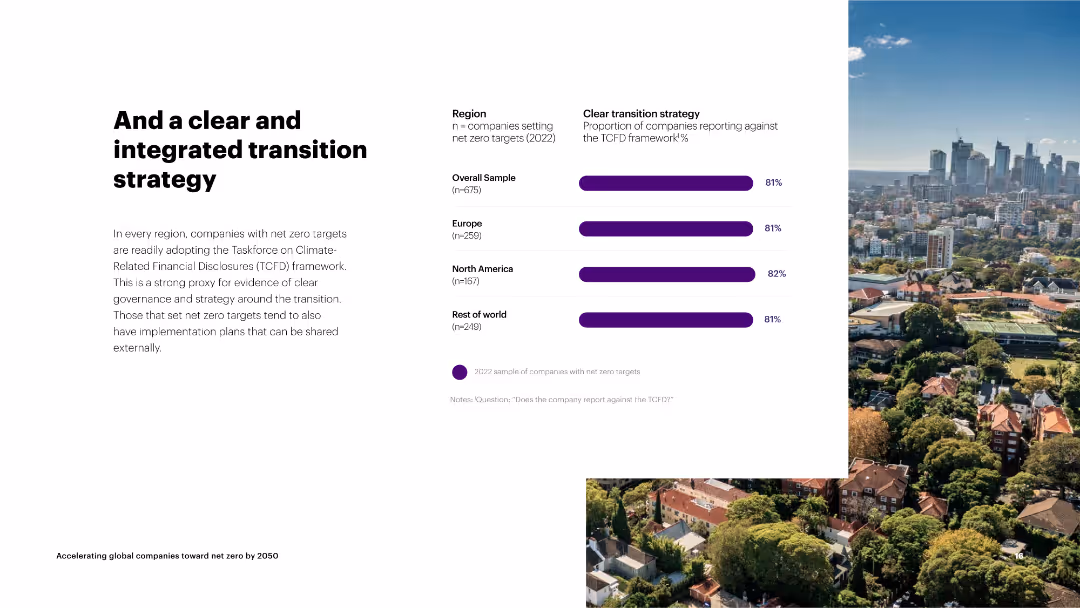
The slide has a column chart on the right depicting the proportion of companies with clear transition strategies by region.
Strategic Planning
Environmental Services & Sustainability
The slide focuses on companies adopting the TCFD framework for clear transition strategies towards net zero, showing consistent adoption across regions.
transition strategy, TCFD, net zero, overall sample, Europe, North America, rest of world, clear governance
false
Strategic Planning
Environmental Services & Sustainability
Mixed Chart
Accenture
Add to my slides
Remove from favorites
The slide features a scatter plot with annotations for various transportation authorities like MTA, WMATA, etc., showing trends in annual ridership versus year-over-year growth rates, using different colored circles to represent each entity.
Market Analysis and Trends
Transportation & Logistics
This slide analyzes trends in bus ridership across different systems, comparing annual ridership rates and growth, highlighting how entities like MTA and others are performing. Useful for assessing transportation trends and planning.
transit, ridership, trends, comparison, analysis, bus, MTA, growth, decline
false
Market Analysis and Trends
Transportation & Logistics
Single Chart
BCG
Add to my slides
Remove from favorites
This slide shows a scatter plot similar to the previous, but focuses on the impact of "SafeTrack" on WMATA's performance by comparing its data with other transport entities like MTA and CTA, using differently colored circles for each.
Market Analysis and Trends
Transportation & Logistics
Here, the slide presents the impact of the "SafeTrack" initiative on WMATA's bus ridership in 2015, juxtaposed with other transit systems, useful for evaluations of specific interventions in public transport.
transit, WMATA, SafeTrack, impact, comparison, 2015, ridership
false
Market Analysis and Trends
Transportation & Logistics
Single Chart
BCG
Add to my slides
Remove from favorites
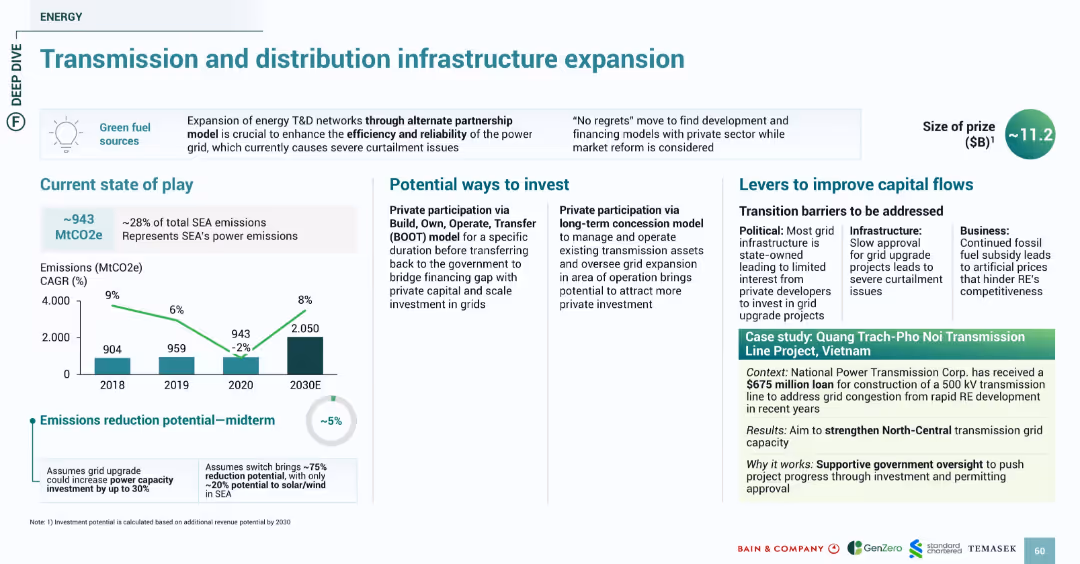
Consistent block design with emission graphs, investment options, challenges, and green-shaded case study section. Blue and green color scheme emphasizing energy and infrastructure.
Strategic Planning
Energy & Utilities
Discusses the critical need to expand SEA's energy transmission and distribution to improve reliability and accommodate renewable energy. Midterm emissions reduction is ~5%. Investment paths include private participation via BOOT and concession models. The Vietnam-based case study illustrates a $675M loan to expand transmission infrastructure to reduce grid congestion.
transmission, grid, energy, BOOT, investment, Vietnam, infrastructure, emissions
false
Strategic Planning
Energy & Utilities
Multiple Chart
Bain
Add to my slides
Remove from favorites
The slide includes a network diagram illustrating the split of New South Wales into sub-regions or zones, with connectors and node labels.
Operational Efficiency
Energy & Utilities
Details the modeling choices for New South Wales transmission forecasts, including the creation of sub-regions and application of dynamic loss equations.
transmission, New South Wales, sub-regions, network flows, dynamic loss, connectors, modeling
false
Operational Efficiency
Energy & Utilities
Graphic
EY
Add to my slides
Remove from favorites
A structured slide with three distinct sections of bullet points outlining key elements of transparency, accountability, and alignment within a firm.
Regulatory and Compliance
Financial Services
This slide provides an overview of the company's strategic emphasis on transparency, accountability, and alignment with key takeaways.
transparency, accountability, strategy, alignment
false
Regulatory and Compliance
Financial Services
Table
Goldman Sachs
Add to my slides
Remove from favorites
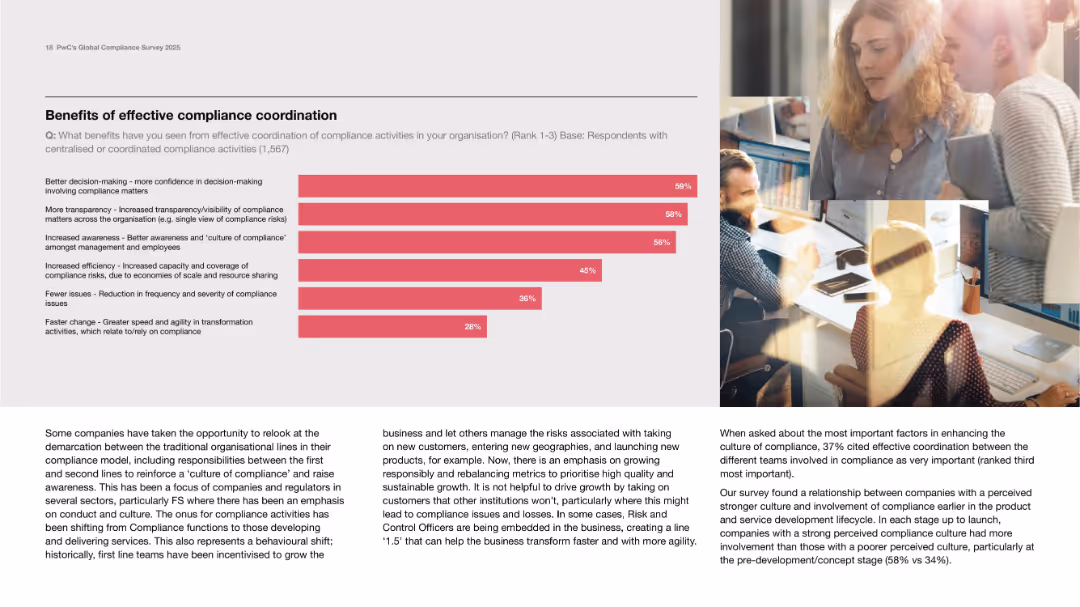
Left-aligned horizontal bar chart; supporting text beneath and on the right with imagery.
Operational Efficiency
Professional Services
Shows benefits of coordinated compliance such as transparency, awareness, efficiency, and fewer issues. Text emphasizes breaking down organizational silos and improving risk control via cultural and functional alignment.
transparency, agility, coordination, culture, risk management
false
Operational Efficiency
Professional Services
Mixed Chart
PwC/Strategy&
Add to my slides
Remove from favorites
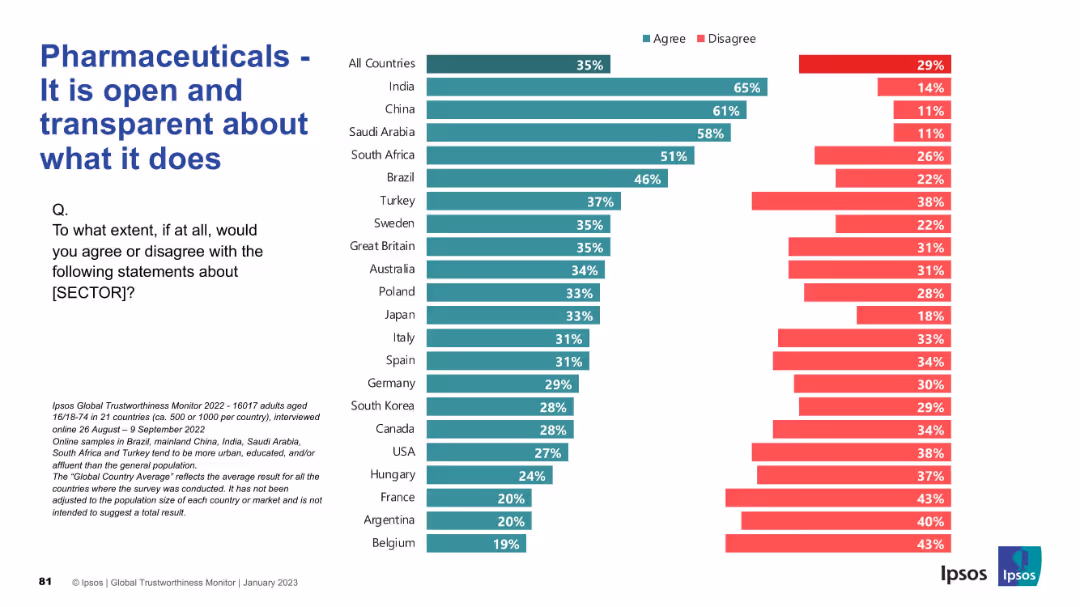
Horizontal bar chart by country with strong red presence (disagreement). Design format mirrors others, with clean layout and left-aligned question and title.
Market Analysis and Trends
Healthcare & Pharmaceuticals
The slide explores public belief in the pharmaceutical sector’s transparency. Agreement is notably low across most countries, especially in France, Belgium, and Argentina. Only China and India show majority agreement, highlighting widespread skepticism about openness.
transparency, communication, public opinion, pharma, survey, global data, Ipsos, accountability, openness, perception
false
Market Analysis and Trends
Healthcare & Pharmaceuticals
Mixed Chart
IPSOS
Add to my slides
Remove from favorites
Comprises a header with bold text and multiple bar charts detailing perceptions of employer transparency across different areas such as health, safety, economic impact, and environmental effects.
Regulatory and Compliance
Government & Public Sector
Investigates employees' perspectives on the importance of transparency in various operational areas of their companies. It underscores the high value workers place on transparency concerning health, safety, and environmental impacts, suggesting areas where businesses could improve communication and practices to build trust.
transparency, employer trust, operational impact, health and safety
false
Regulatory and Compliance
Government & Public Sector
Single Chart
PwC/Strategy&
Add to my slides
Remove from favorites
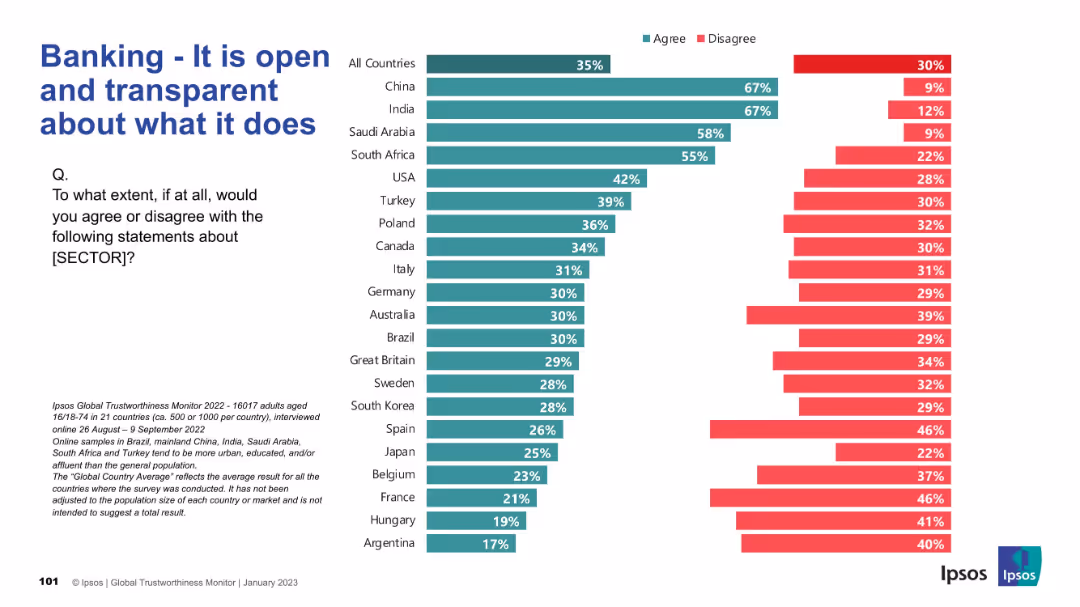
Bar chart format as before. Rankings by country on agreement/disagreement levels about banking sector transparency.
Regulatory and Compliance
Financial Services
Highlights cross-national opinions on transparency in the banking sector. India and China again show high trust, while European nations report lower agreement, with transparency seen as lacking in many regions.
transparency, finance, regulation, trust, Ipsos, banking sector, public perception
false
Regulatory and Compliance
Financial Services
Mixed Chart
IPSOS
Add to my slides
Remove from favorites
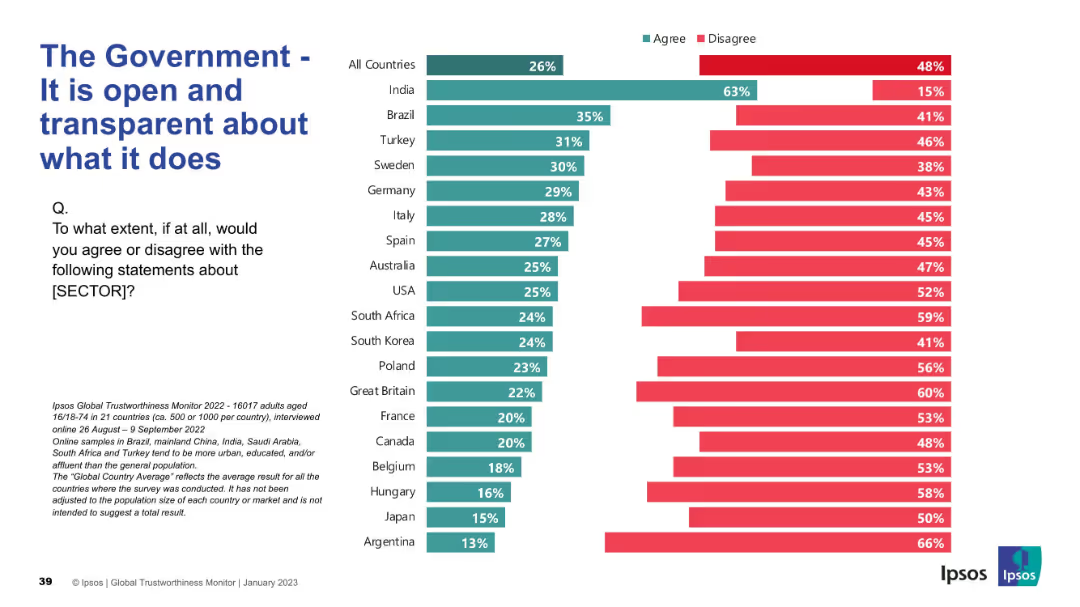
Split bar chart by country with green (agree) and red (disagree) proportions
Regulatory and Compliance
Government & Public Sector
The slide illustrates public sentiment about government transparency. While India leads in agreement, a majority of countries report high disagreement percentages.
transparency, governance, openness, public trust, compliance, Ipsos, survey, global responses
false
Regulatory and Compliance
Government & Public Sector
Mixed Chart
IPSOS
Add to my slides
Remove from favorites
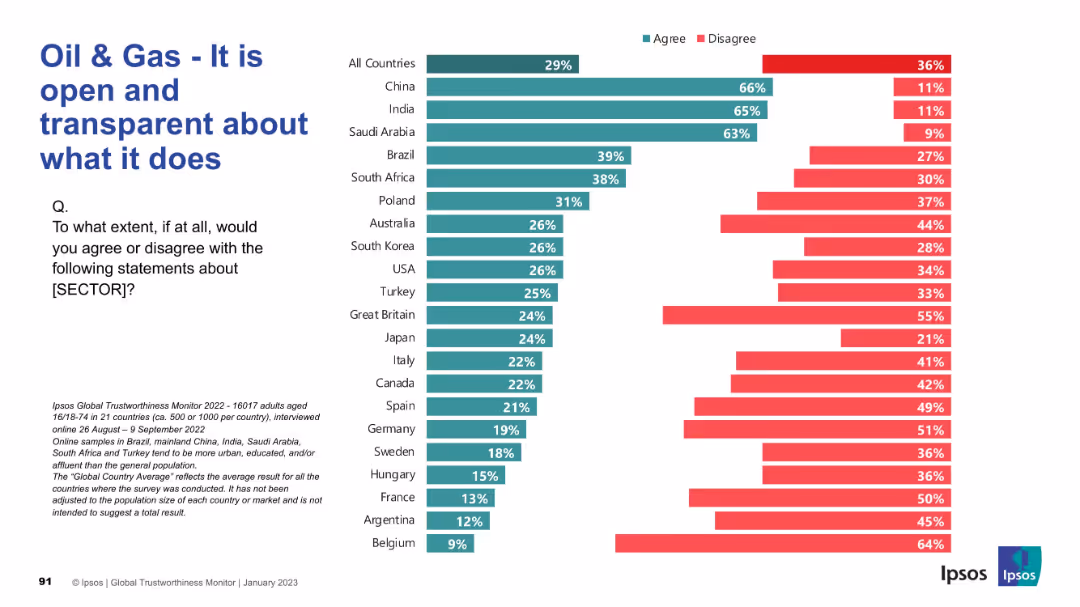
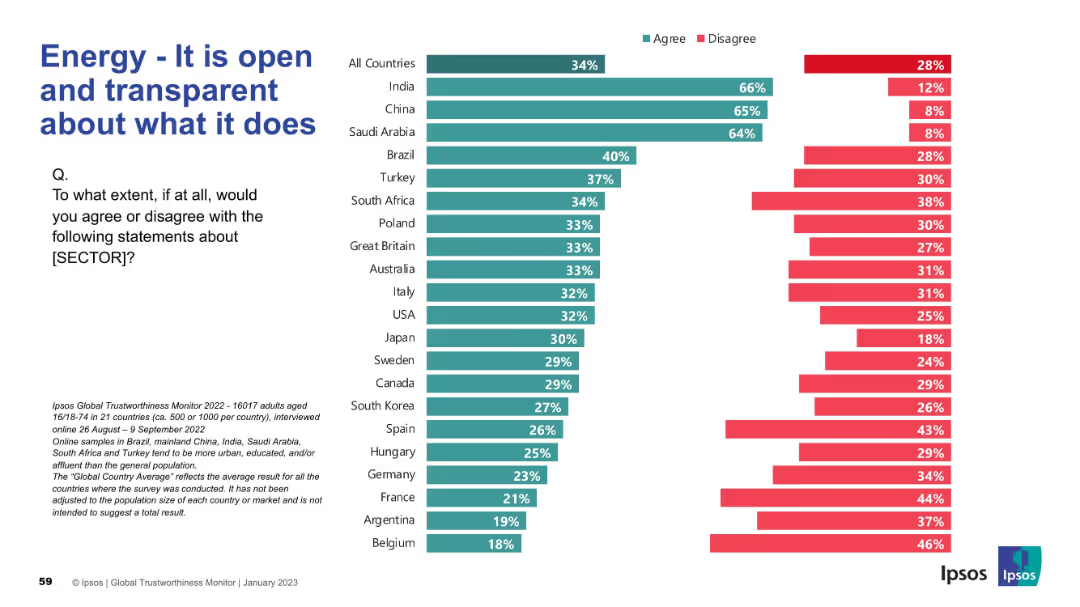
Classic Ipsos layout with green/red bar charts. Countries ranked by agreement with transparency statement; disagreement visualized on the right.
Market Analysis and Trends
Energy & Utilities
The chart ranks perceptions of transparency in the oil & gas sector, with highest agreement in China, India, and Saudi Arabia. Western nations exhibit more skepticism, reflected in high disagreement scores.
Transparency, Oil & Gas, Global Poll, Public Trust, Sector Ethics, Perceptions, Openness, Ipsos, Energy Markets, Country Comparison
false
Market Analysis and Trends
Energy & Utilities
Mixed Chart
IPSOS
Add to my slides
Remove from favorites
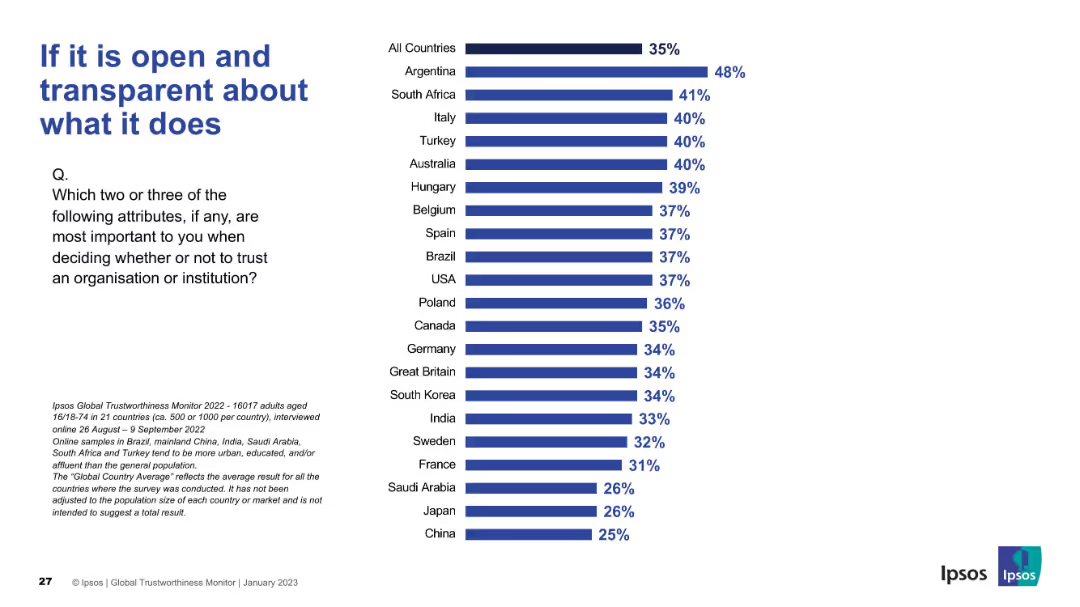
Features a global country bar ranking. Argentina ranks highest in prioritizing transparency. Uniform Ipsos slide layout.
Market Analysis and Trends
Professional Services
Transparency is shown as a top driver of organizational trust, especially in Argentina and South Africa. Consistent chart format with clear visual emphasis.
transparency, open communication, trust, Ipsos, survey insights, values
false
Market Analysis and Trends
Professional Services
Mixed Chart
IPSOS
Add to my slides
Remove from favorites
Vertical bar chart; standard layout consistent with others; transparency-focused perception question
Market Analysis and Trends
Energy & Utilities
The slide reveals how transparent the energy sector is perceived to be globally. India, China, and Saudi Arabia are seen as the most transparent, while European countries like Belgium and France show significantly lower agreement levels.
transparency, openness, energy sector, perception, trust, Ipsos, survey, global rankings, agreement
false
Market Analysis and Trends
Energy & Utilities
Mixed Chart
IPSOS
Add to my slides
Remove from favorites
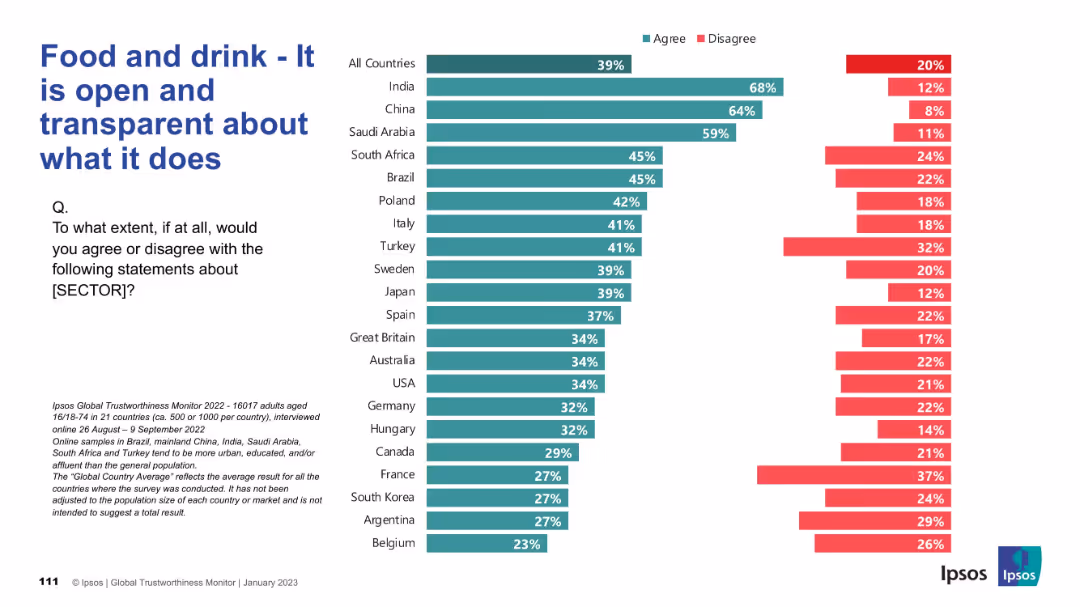
Same format as previous: horizontal bar chart; agree/disagree split by country, left-side question text.
Market Analysis and Trends
Consumer Goods
The slide presents survey results on whether people believe the food and drink sector is open and transparent. Countries are listed with corresponding agreement and disagreement levels. High transparency perception is concentrated in India and China.
transparency, openness, food industry, survey, global data, consumer trust, Ipsos, public opinion, chart, comparison
false
Market Analysis and Trends
Consumer Goods
Mixed Chart
IPSOS
Add to my slides
Remove from favorites
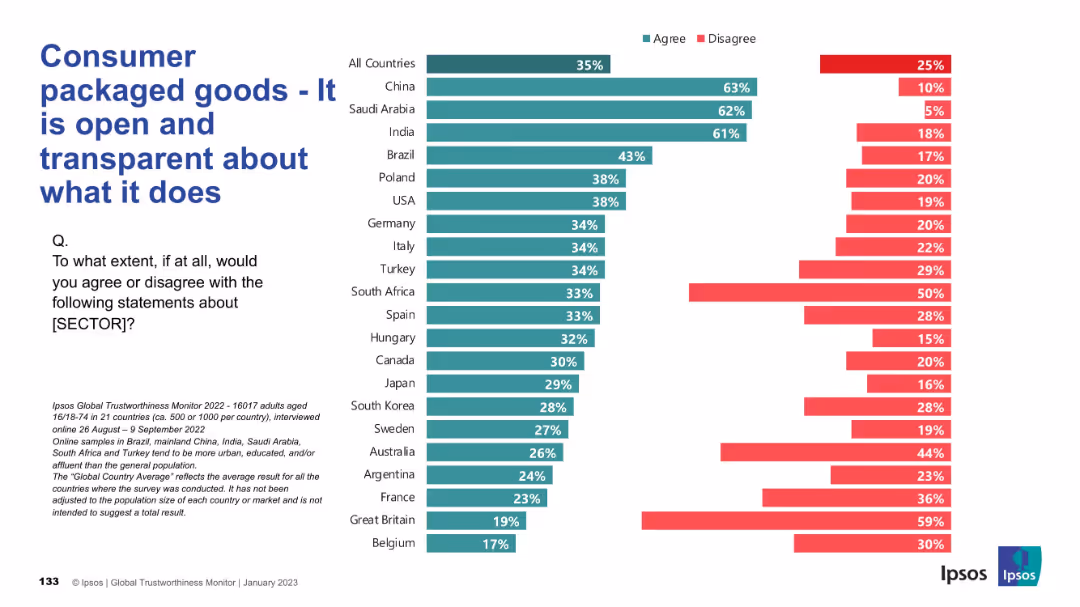
Similar design to previous slide. Green and red bar chart displaying agreement/disagreement levels by country on CPG transparency.
Market Analysis and Trends
Consumer Goods
The slide illustrates how open and transparent people perceive the CPG sector to be across various countries, showing significant variation in trust.
transparency, openness, perception, trust, consumer goods, global survey, Ipsos, public opinion, chart
false
Market Analysis and Trends
Consumer Goods
Mixed Chart
IPSOS
Add to my slides
Remove from favorites
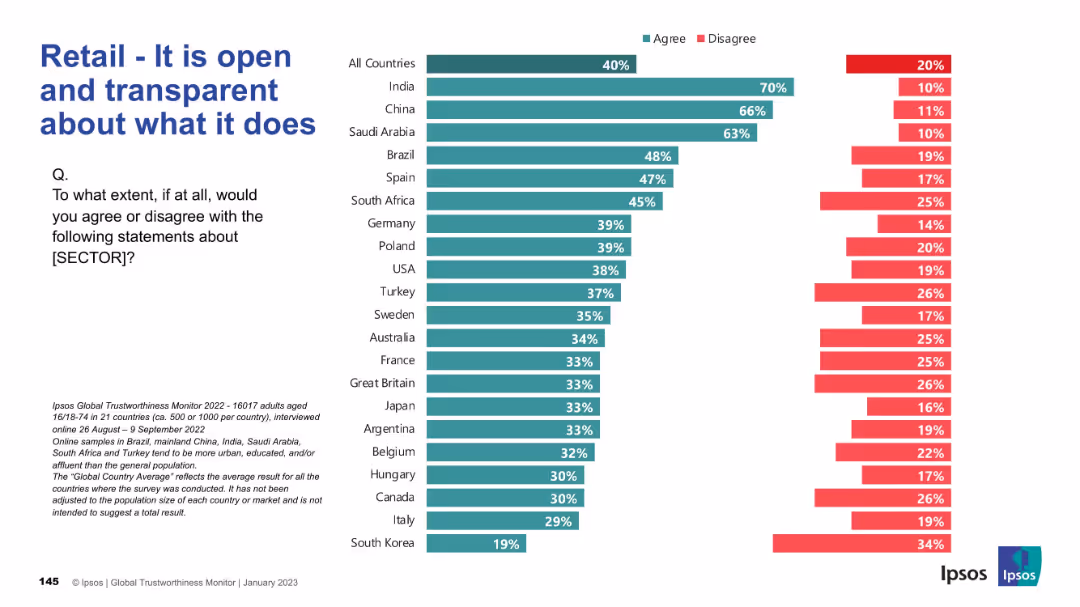
Bar chart with country comparison on transparency, green/red coded; Ipsos branding at bottom.
Market Analysis and Trends
Retail & E-commerce
The chart measures how transparent the public finds the retail sector. Transparency perception is highest in India, China, and Saudi Arabia, with Western countries trailing.
transparency, openness, public trust, retail, Ipsos, global, opinion, bar chart
false
Market Analysis and Trends
Retail & E-commerce
Mixed Chart
IPSOS
Add to my slides
Remove from favorites
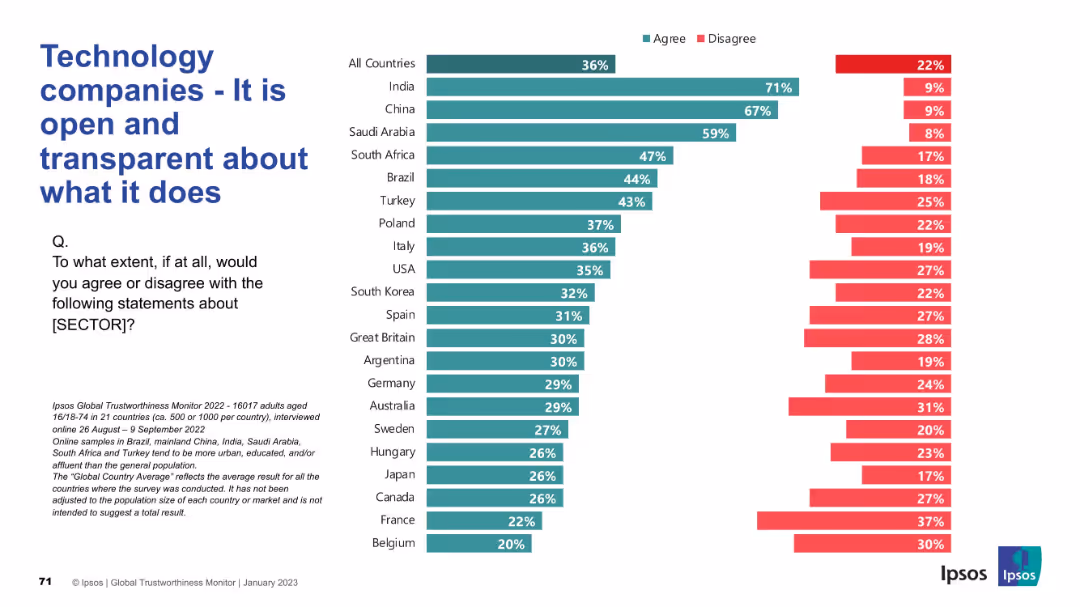
Classic Ipsos layout with split section: left for title/question, right for a country-wise horizontal bar chart.
Regulatory and Compliance
Technology & Software
This slide shows the perceived transparency of tech companies, presenting agreement percentages by country on whether these firms are open about their operations.
transparency, openness, tech companies, global opinion, regulation, Ipsos, corporate trust, perception, public view, accountability
false
Regulatory and Compliance
Technology & Software
Mixed Chart
IPSOS
Add to my slides
Remove from favorites
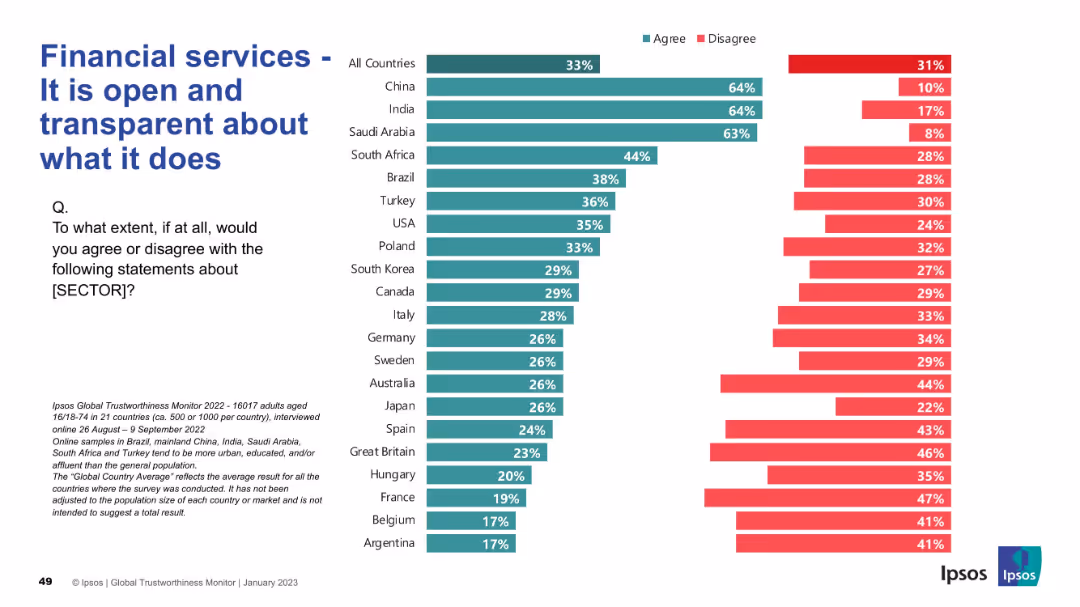
Split bar chart with clean format, agreement vs disagreement across countries
Regulatory and Compliance
Financial Services
The chart gauges public opinion on transparency in financial services. China, India, and Saudi Arabia again show strong trust, while countries like France, Belgium, and Argentina have high disagreement, highlighting trust issues.
transparency, openness, trust, perception, Ipsos, countries, financial services, public opinion
false
Regulatory and Compliance
Financial Services
Mixed Chart
IPSOS
Add to my slides
Remove from favorites
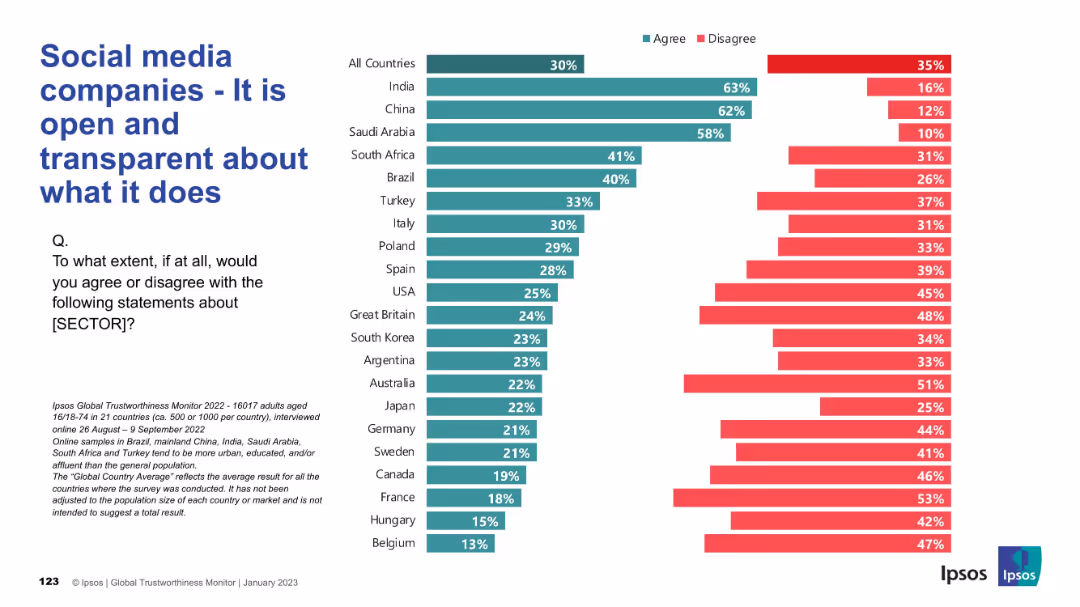
Horizontal bar graph layout with agreement and disagreement rates by country; consistent design language and branding from earlier slides.
Market Analysis and Trends
Technology & Software
This slide reveals perceptions about the transparency of social media companies. While some countries (India, China) express high trust in transparency, most Western countries exhibit skepticism, with agreement percentages frequently under 30%.
transparency, openness, trust, perception, social media, global, Ipsos, agreement
false
Market Analysis and Trends
Technology & Software
Mixed Chart
IPSOS
Add to my slides
Remove from favorites
Dual panel layout with bar charts showing satisfaction metrics by generation on the right and an image on the left.
Market Analysis and Trends
Healthcare & Pharmaceuticals
Discusses how transparency about costs and time savings in healthcare appointments affects consumer satisfaction across different generations.
transparency, time, savings, healthcare, satisfaction
false
Market Analysis and Trends
Healthcare & Pharmaceuticals
Mixed Chart
Accenture
Add to my slides
Remove from favorites
Slide features multiple charts: a pie chart showing consumer opinions on vehicle ownership, and bar charts reflecting agreement levels on transportation convenience.
Market Analysis and Trends
Transportation & Logistics
The slide presents consumer opinions on vehicle ownership due to shared transportation use, and their views on the convenience of changing transportation modes.
Transportation, consumer opinions, vehicle ownership, convenience, shared transportation
false
Market Analysis and Trends
Transportation & Logistics
Multiple Chart
Deloitte
Add to my slides
Remove from favorites
Contains multiple column charts ranking the key factors influencing transportation mode choice before and after a health crisis.
Market Analysis and Trends
Transportation & Logistics
Ranks the primary factors influencing transportation choices before and after a health crisis.
transportation, health concerns, mode choice, rankings
false
Market Analysis and Trends
Transportation & Logistics
Multiple Chart
McKinsey
Add to my slides
Remove from favorites
Slide with lists comparing the perceived safety of various transportation modes in terms of health risks during a crisis.
Market Analysis and Trends
Transportation & Logistics
Highlights shifts in transportation mode preferences due to health safety concerns.
transportation, health risks, safety, mode choice, crisis
false
Market Analysis and Trends
Transportation & Logistics
Table
McKinsey
Add to my slides
Remove from favorites
Slide displays a combination of line and column charts showing the impact on airline, cruiseline, and online travel agencies in NY. Each chart is annotated with data points and trends highlighted.
Market Analysis and Trends
Transportation & Logistics
Analyzes the near-term impact of the pandemic on various transportation sectors in New York, detailing the decline in travel and potential paths to recovery. Discusses how shifts in consumer behavior might influence future industry patterns.
Transportation, Impact, COVID-19, Recovery, New York
false
Market Analysis and Trends
Transportation & Logistics
Multiple Chart
BCG
Add to my slides
Remove from favorites
A column chart showing the number of strategic alliances over time and their types, with GDP correlation.
Strategic Planning
Transportation & Logistics
Evaluates the trend and types of strategic alliances in the transport sector against economic growth trends.
Transportation, Logistics, Alliances, Strategic, Trends, GDP, Planning, Types
false
Strategic Planning
Transportation & Logistics
Mixed Chart
PwC/Strategy&
Add to my slides
Remove from favorites
Multiple line charts displaying global freight rates by sea and air, with annotations for major events affecting prices.
Market Analysis and Trends
Transportation & Logistics
Analyzes the impact of global events on sea and air freight rates, highlighting trends and fluctuations.
Transportation, Logistics, Freight, Global, Rates, Sea, Air, Trends, Market Analysis
false
Market Analysis and Trends
Transportation & Logistics
Multiple Chart
PwC/Strategy&
Add to my slides
Remove from favorites
Column and line charts correlating deal activity in the transport and logistics sector with global GDP growth.
Mergers and Acquisitions
Transportation & Logistics
Discusses the correlation between economic performance and merger activities in the transportation sector.
Transportation, Logistics, GDP, Deals, Mergers, Acquisitions, Economic, Correlation
false
Mergers and Acquisitions
Transportation & Logistics
Mixed Chart
PwC/Strategy&
Add to my slides
Remove from favorites
Multiple line charts comparing GDP growth scenarios and their impacts on the transportation and logistics sector.
Market Analysis and Trends
Transportation & Logistics
Discusses potential future impacts of various economic scenarios on the T&L industry.
Transportation, Logistics, GDP, Growth, Impact, Economic, Scenarios, Industry Analysis
false
Market Analysis and Trends
Transportation & Logistics
Multiple Chart
PwC/Strategy&
Add to my slides
Remove from favorites
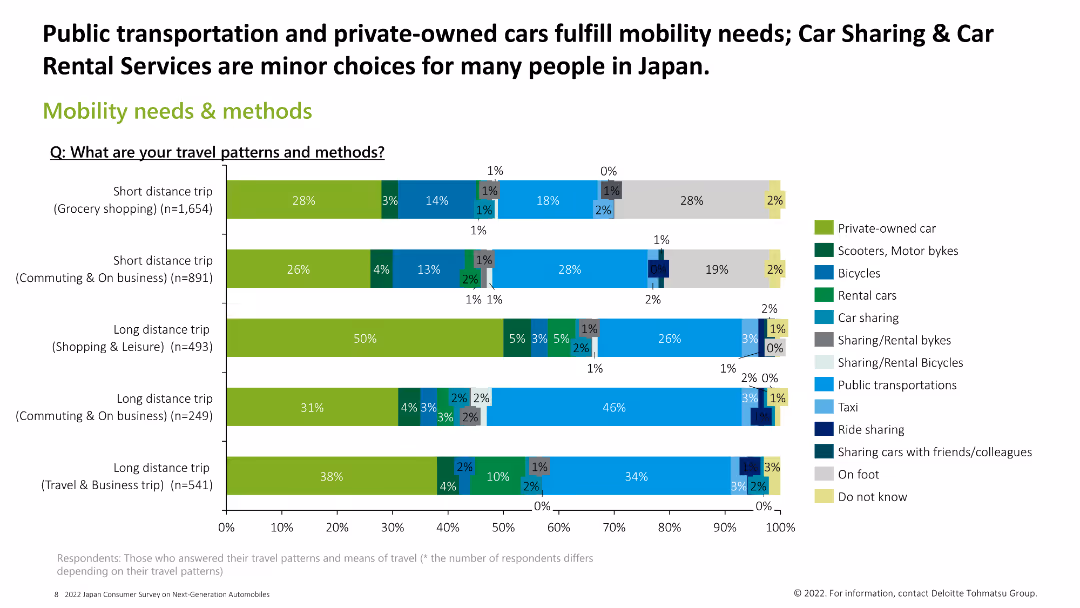
Features a series of horizontal bar charts depicting different travel patterns and methods across various trip types.
Market Analysis and Trends
Transportation & Logistics
The slide presents data on the preferred methods of transportation for short and long-distance trips, showing the distribution of different modes of transport.
transportation methods, travel patterns, survey, mobility needs
false
Market Analysis and Trends
Transportation & Logistics
Single Chart
Deloitte
Add to my slides
Remove from favorites
This slide features multiple line charts illustrating the year-over-year change in ridership for various NY transportation authorities. Annotations and a clear color-coded legend are included.
Operational Efficiency
Transportation & Logistics
Focuses on the drastic reduction in ridership across different public transportation modes in New York during the COVID-19 pandemic, highlighting significant drops and a comparative analysis with previous months.
Transportation, NY, COVID-19, Ridership, Decline
false
Operational Efficiency
Transportation & Logistics
Multiple Chart
BCG
Add to my slides
Remove from favorites
The slide includes multiple bar charts comparing the change in transportation modes across different regions. Each chart represents changes in percentages and is colored based on region.
Market Analysis and Trends
Transportation & Logistics
Compares regional responses in transportation mode usage shifts before and after a global crisis.
transportation, regional, mode shift, crisis, comparison
false
Market Analysis and Trends
Transportation & Logistics
Multiple Chart
McKinsey
Add to my slides
Remove from favorites
The slide contains multiple bar charts tracking the usage of different transportation modes before and after a crisis. Each chart displays data across different waves, comparing the percentages of users.
Market Analysis and Trends
Transportation & Logistics
Analyzes changes in transportation mode usage due to a crisis, projecting future trends in mobility preferences.
transportation, trends, micromobility, crisis, projections
false
Market Analysis and Trends
Transportation & Logistics
Multiple Chart
McKinsey
Add to my slides
Remove from favorites
A column chart displaying the cost per passenger mile for different transport modes including public transport, taxis, and autonomous vehicles like Uber and robotaxis, with costs represented by varying heights of bars in different shades of green.
Competitive Landscape
Transportation & Logistics
Compares the cost-effectiveness of traditional public transport with emerging options like ridesharing and autonomous vehicles, particularly focusing on scenarios like NYC. Useful for strategic decision-making in transport economics.
transport costs, ridesharing, autonomous vehicles, public transit, NYC
false
Competitive Landscape
Transportation & Logistics
Single Chart
BCG
Add to my slides
Remove from favorites
The slide features a column chart detailing the transport energy consumption forecast by subsectors (cars, trucks, other road vehicles, aviation, shipping, rail) from 2018 to 2040 under a stated policies scenario. It highlights the contributions of biofuels growth in transport industries.
Market Analysis and Trends
Transportation & Logistics
This slide forecasts energy consumption within the transport sector, emphasizing the role of biofuels in the growth of energy use in cars, trucks, aviation, and shipping, and projecting the contributions from different transport subsectors by 2040.
transport energy consumption, forecast, subsectors, cars, trucks, aviation, shipping, rail, biofuels growth
false
Market Analysis and Trends
Transportation & Logistics
Single Chart
Kearney
Add to my slides
Remove from favorites
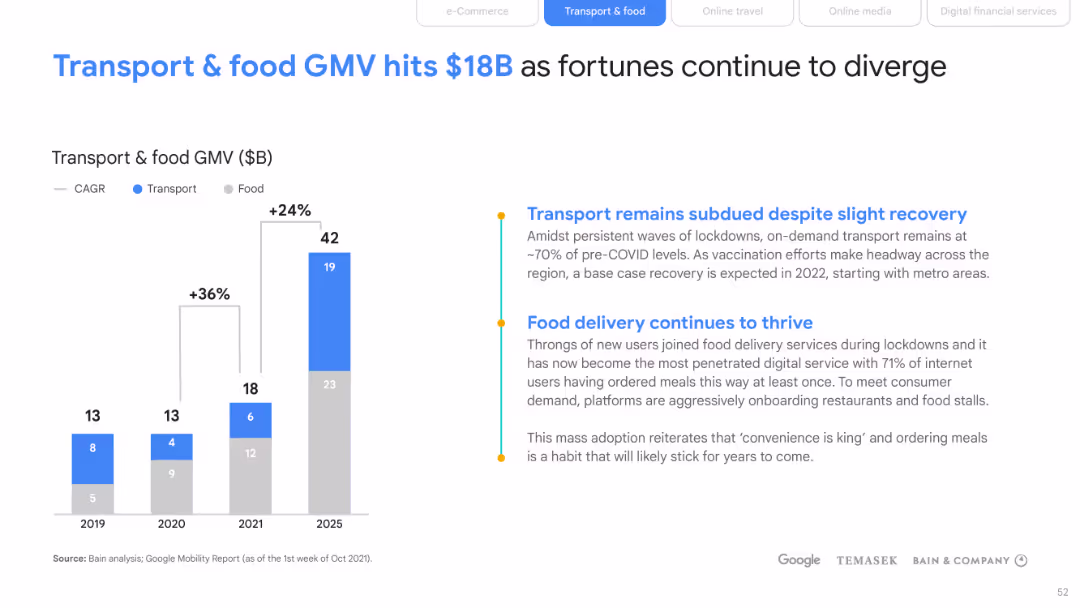
Includes a bar and column chart combo showcasing the GMV in transport and food, with color differentiation and growth percentage annotations.
Market Analysis and Trends
Transportation & Logistics
Examines the divergent fortunes of transport and food segments within the GMV, highlighting the resilience and growth of food delivery services compared to transport. It is useful for stakeholders in the transport and food industries to assess current market conditions and plan accordingly.
Transport, Food, GMV, Growth
false
Market Analysis and Trends
Transportation & Logistics
Mixed Chart
Bain
Add to my slides
Remove from favorites
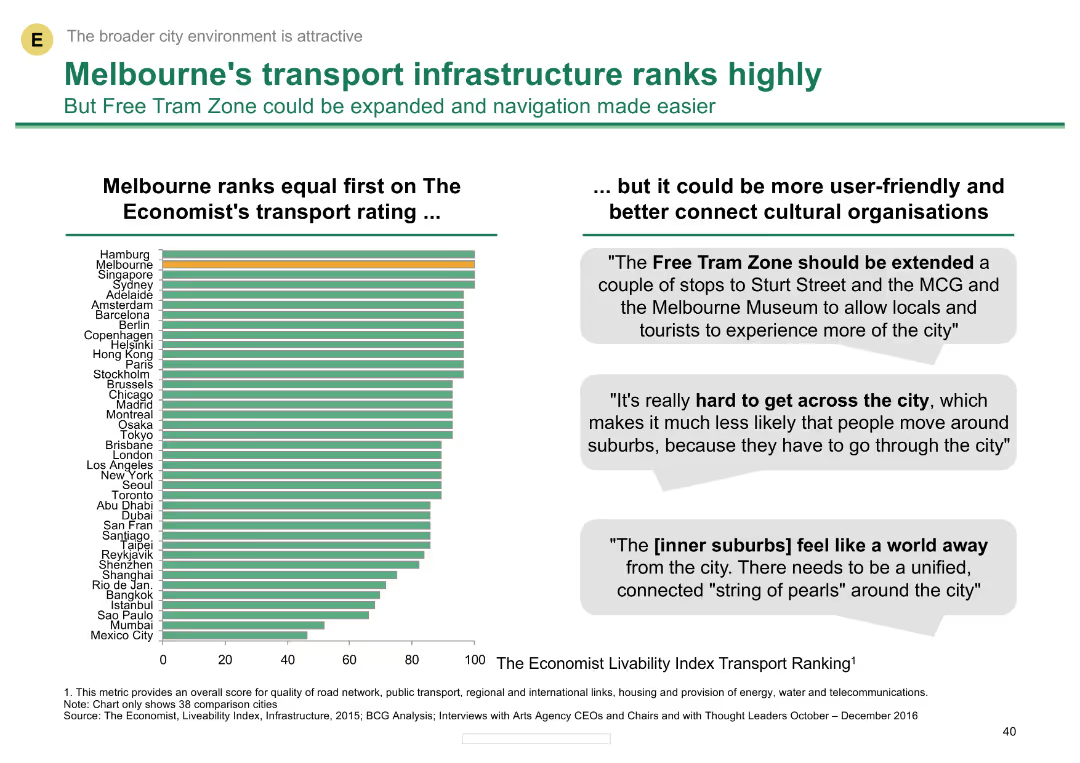
A column chart comparing Melbourne's transport rating with other cities. Includes quotes on improving the Free Tram Zone and connectivity across the city.
Competitive Landscape
Transportation & Logistics
Shows Melbourne's high ranking in transport infrastructure according to The Economist, with suggestions for expanding the Free Tram Zone and improving city connectivity.
transport, infrastructure, Melbourne, Free Tram Zone, city connectivity
false
Competitive Landscape
Transportation & Logistics
Mixed Chart
BCG
Add to my slides
Remove from favorites
Previous
Next
You don't have any favorites yet.
Please wait loading your favorites slides...
Create a FREE account to continue browsing
Receive Instant Access to 1,000+ slides from companies like McKinsey, Google, and Goldman Sachs
First Name
Last Name
Email
Password
I agree to all
Terms & Privacy Policy
Thank you! Your submission has been received!
Oops! Something went wrong while submitting the form.
Have an account?
Sign in
Upgrade to PRO to Save slides
Advanced Search and Filters
Access to 15,000+ slides
Access to Category Pages
Save/Bookmark Slides
PowerPoint Template Library
Pick a Plan
MONTHLY
$12/month
Billed every month, Cancel anytime.
YEARLY
$9/year
Billed $108 annually, Cancel anytime.
Checkout for $12/month
Checkout for $108/yr
Secured by Stripe | AES-256 bit encryption


![Astir NPL Finance 2020-1 DAC Corporate NPL Attica Bank [securitisation] 341](https://cdn.prod.website-files.com/654e70fb59937215cac87b19/68741398908f234fc404baac_sclYmiYEBokzRz8F_C7pEyE0uSzieGt1BotYqiIPXYE.avif)

![BCC NPLs 2020 RED NPL ICCREA Banca [GACS securitisation] 2,400](https://cdn.prod.website-files.com/654e70fb59937215cac87b19/6874138129684364c5529579_Yck3nY557ugW_N3mHTb2daAkH0GpyhH4KIYW3bEDyT8.avif)