My Account
My Slides
Search by Category
Pricing
Templates
View All Templates
Download Template Slides
✦ AI Search
Feedback
Login
Logout
Get Started
Browse all Slides
Browse all Slides
Create a FREE Account
Instant access to 1,000+ real slides from top companies like McKinsey, BCG, Goldman Sachs, Google and many more!
First Name
Last Name
Email
Password
I agree to all
Terms & Privacy Policy
Thank you! Your submission has been received!
Oops! Something went wrong while submitting the form.
Have an account?
Sign in
Saved Slides
Total No. of slides saved
0
↻ Refresh
✖ Clear all
Features a bar chart highlighting various business risks.
Risk Assessment and Management
Financial Services
This slide identifies key reasons for trapped company value, including unclear growth strategies and management credibility issues, crucial for risk management.
trapped value, growth strategy, management, risk
false
Risk Assessment and Management
Financial Services
Mixed Chart
BCG
Add to my slides
Remove from favorites
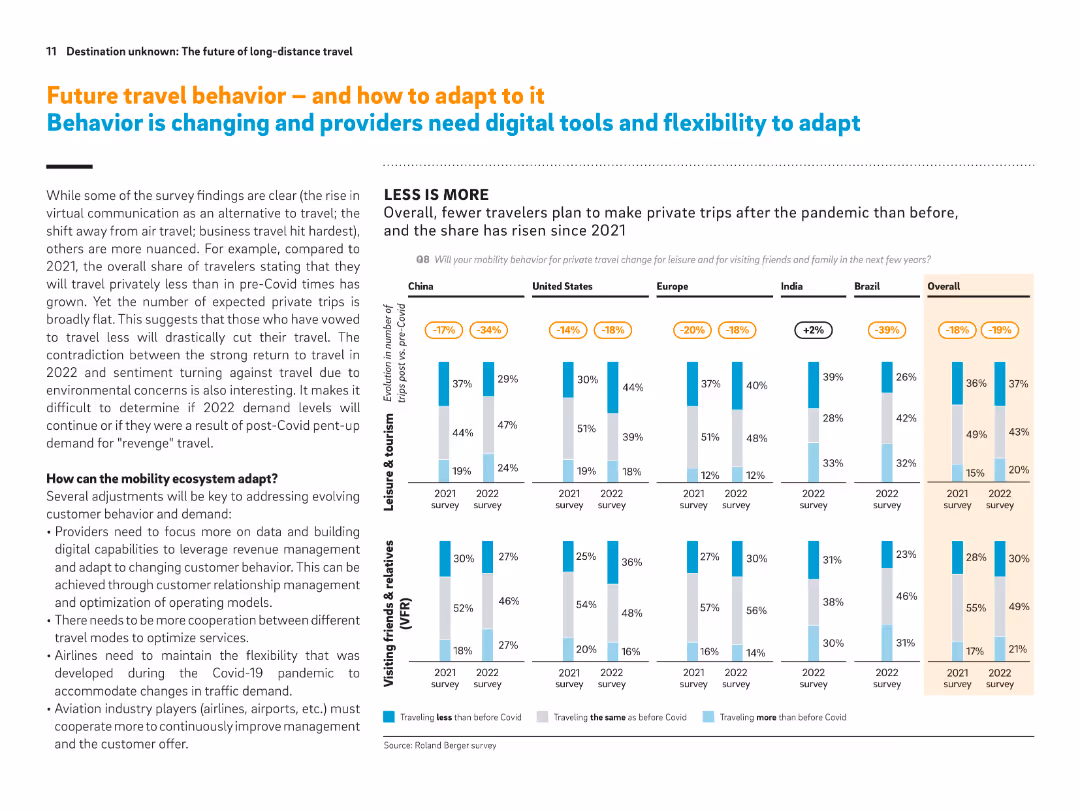
Two-column layout with text on the left and a vertical bar chart comparison on the right, showing survey results from multiple countries. Headline in orange and blue.
Market Analysis and Trends
Transportation & Logistics
This slide explores changes in private travel behavior post-COVID, emphasizing reduced travel intentions despite the strong recovery in 2022. It presents comparative survey data across countries and provides insights on how mobility providers should adapt using digital tools and ecosystem cooperation.
travel behavior, post-COVID, digital tools, survey data, market adaptation, mobility, private trips, international comparison, ecosystem
false
Market Analysis and Trends
Transportation & Logistics
Multiple Chart
Roland Berger
Add to my slides
Remove from favorites
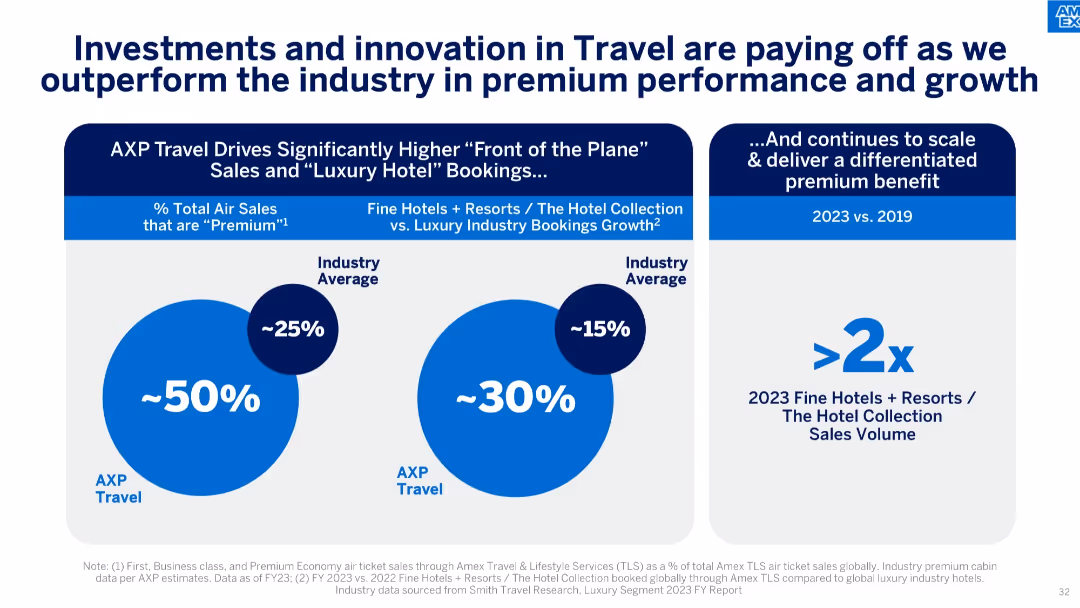
Three-panel design using large circular charts and callouts. Visual emphasis on AXP travel performance vs. industry.
Product and Service Analysis
Financial Services
Demonstrates AXP’s strength in travel services, with higher percentages of premium air sales and luxury hotel bookings, significantly outperforming industry benchmarks.
travel bookings, premium travel, luxury hotels, industry benchmark, travel innovation, Amex travel
false
Product and Service Analysis
Financial Services
Mixed Chart
McKinsey
Add to my slides
Remove from favorites
Features multiple infographics and data visualizations related to COVID-19's impact on travel companies, including adaptations in operations and cost management.
Strategic Planning
Transportation & Logistics
Outlines how travel companies can leverage digital transformation and sustainable practices to navigate post-pandemic challenges.
travel companies, COVID-19 impact, digital transformation, sustainable practices, cost management, operational adaptations
false
Strategic Planning
Transportation & Logistics
Table
BCG
Add to my slides
Remove from favorites
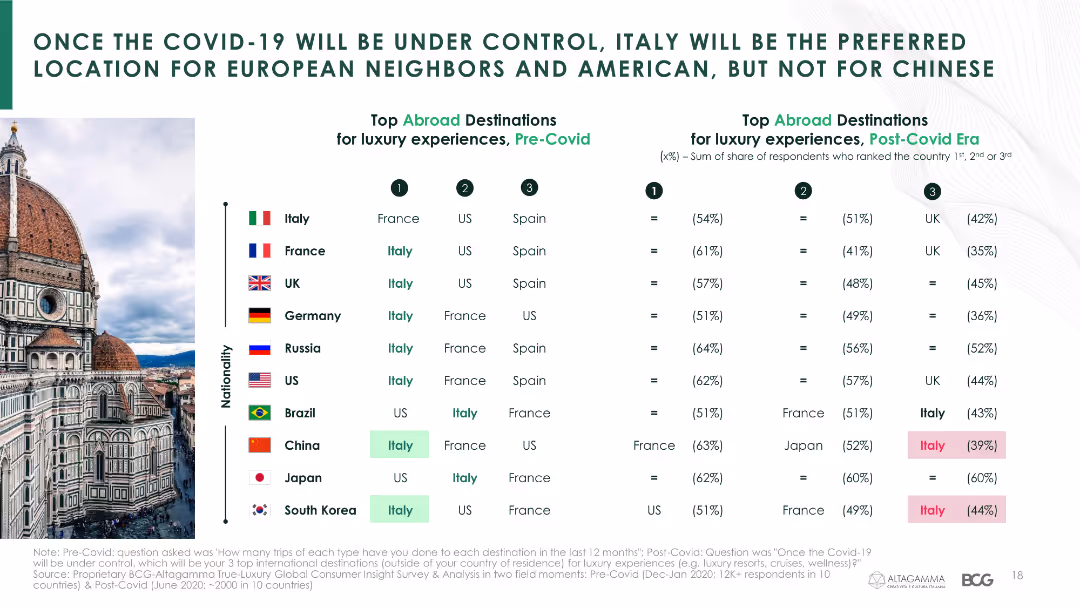
The slide presents a table comparing pre- and post-COVID-19 preferred luxury travel destinations among consumers from various countries.
Market Analysis and Trends
Hospitality & Tourism
It analyzes the shifts in preferred luxury travel destinations for various nationalities before and after the pandemic, with a focus on Italy's popularity.
travel destinations, luxury travel, consumer preferences, COVID-19, Italy, country comparison
false
Market Analysis and Trends
Hospitality & Tourism
Header Horizontal
BCG
Add to my slides
Remove from favorites
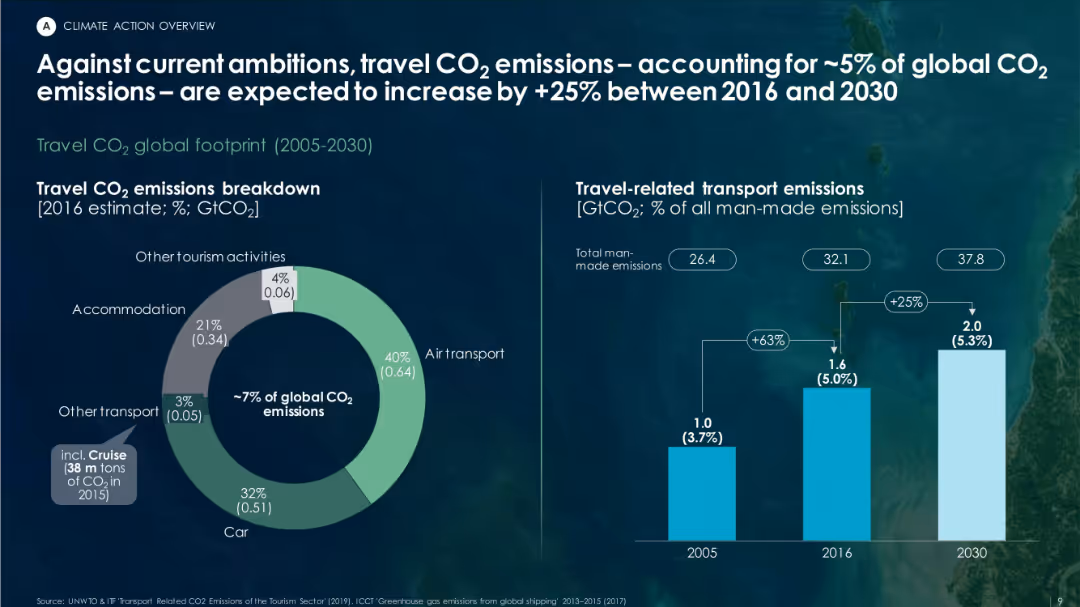
Split layout with pie chart on left showing CO₂ sources in travel; bar chart on right illustrating emissions growth from 2005 to 2030.
Market Analysis and Trends
Environmental Services & Sustainability
This slide breaks down the carbon footprint of global travel, showing how it accounts for about 5% of global CO₂ emissions. It forecasts a 25% increase from 2016 to 2030, with air transport and cars being major contributors.
travel emissions, CO₂, tourism footprint, air transport, sustainability, global warming
false
Market Analysis and Trends
Environmental Services & Sustainability
Multiple Chart
Roland Berger
Add to my slides
Remove from favorites
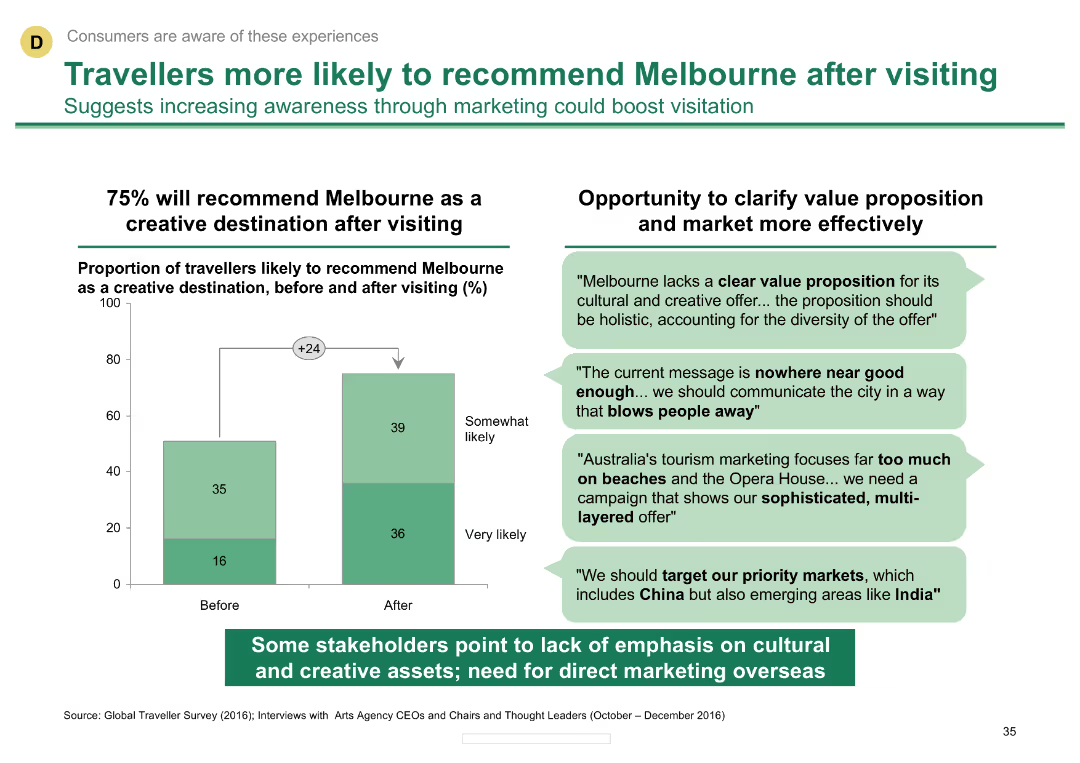
Column chart showing the likelihood of travelers recommending Melbourne before and after visiting
Customer and Market Segmentation
Hospitality & Tourism
Indicates that travelers are more likely to recommend Melbourne as a creative destination after visiting, suggesting marketing improvements.
Traveler recommendations, Melbourne, creative destination, marketing, survey results
false
Customer and Market Segmentation
Hospitality & Tourism
Mixed Chart
BCG
Add to my slides
Remove from favorites
Full-page split layout; left side underwater diver image, right side structured bar graphs. Minimal text, vibrant design.
Customer and Market Segmentation
Financial Services
Presents survey data on travel behaviors: frequency of air travel, reasons for past and future trips, loyalty program enrollment, and changes in planned travel volume for the year.
travel frequency, loyalty programs, personal vs business, 2024 plans, consumer habits, survey, Barclays
false
Customer and Market Segmentation
Financial Services
Mixed Chart
Barclays
Add to my slides
Remove from favorites
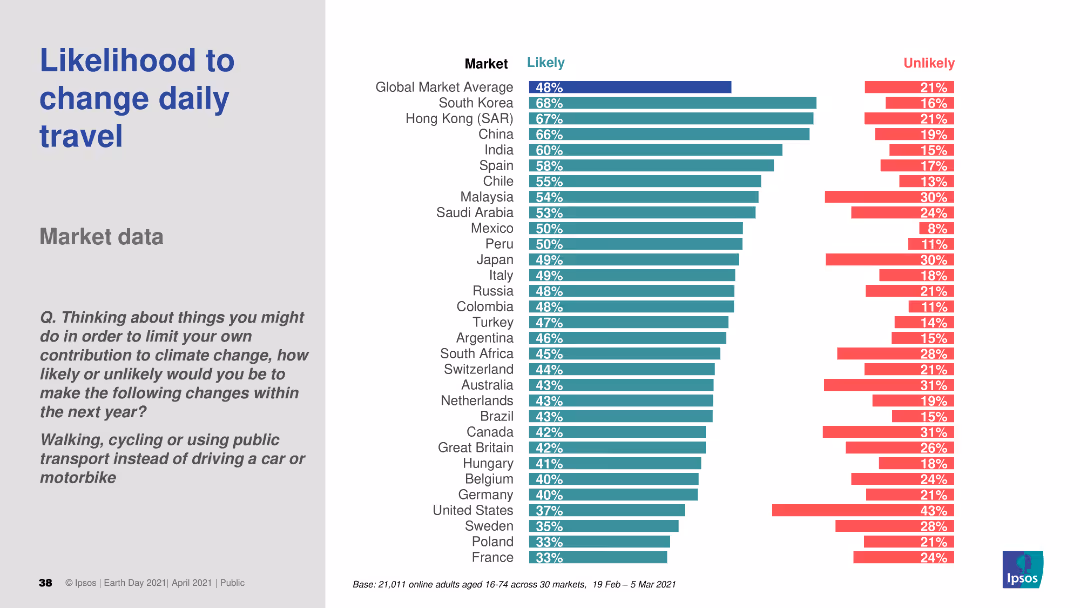
A bar chart (horizontal) showing the likelihood of changing daily travel habits across various countries. The chart uses different colors to indicate likely and unlikely responses.
Market Analysis and Trends
Transportation & Logistics
The slide examines global consumer trends in changing daily travel habits to more sustainable options like walking, cycling, or public transport. It provides a comparative view across multiple countries.
travel habits, sustainability, consumer behavior, transportation, global trends
false
Market Analysis and Trends
Transportation & Logistics
Multiple Chart
IPSOS
Add to my slides
Remove from favorites
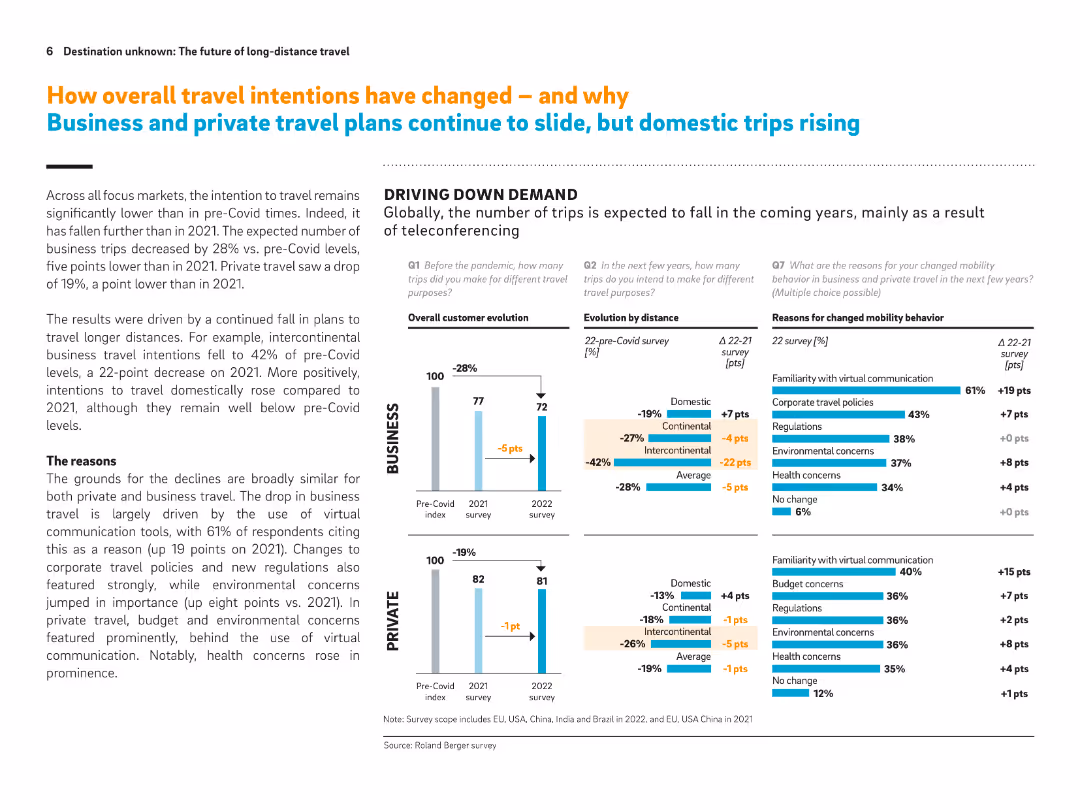
Split between text explanation and bar graphs; visualizes pre- and post-Covid travel trends for business and private sectors, showing drivers like virtual communication and policy changes.
Market Analysis and Trends
Transportation & Logistics
This slide shows that business travel is expected to fall significantly due to virtual communication, regulations, and environmental concerns. Private travel also declines but less sharply. Domestic travel shows some resilience. Key reasons are clearly visualized.
Travel intentions, business travel decline, private travel, virtual tools, environmental concerns, domestic travel, teleconferencing
false
Market Analysis and Trends
Transportation & Logistics
Multiple Chart
Roland Berger
Add to my slides
Remove from favorites
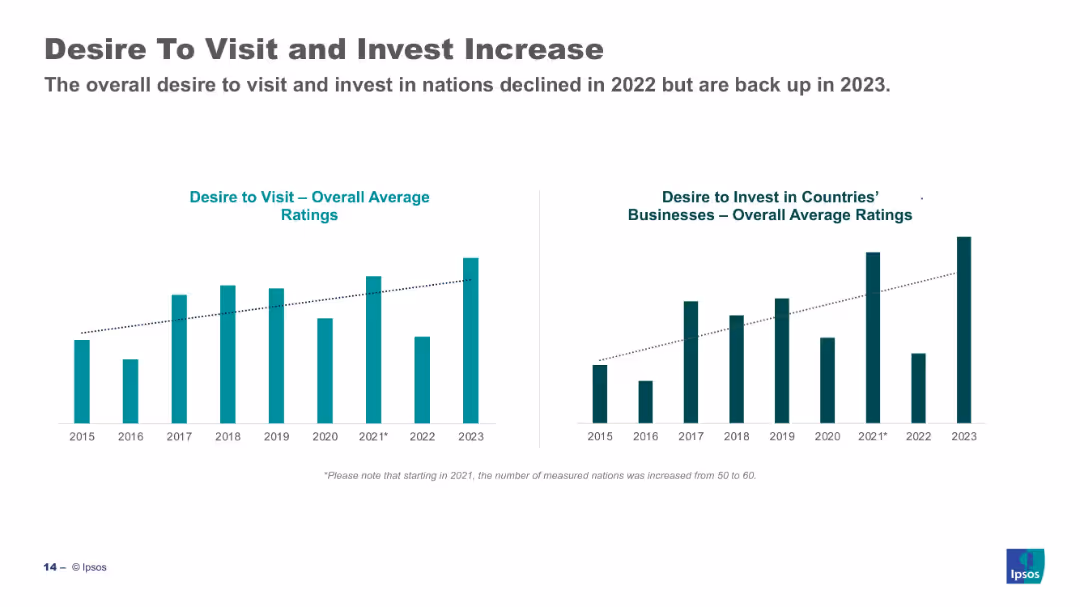
Two bar graphs showing rise in desire to visit and invest in nations (2015–2023), with trend lines.
Market Analysis and Trends
Professional Services
This slide shows global sentiment rebound in 2023 after a dip in 2022 regarding international travel and investment. The bar charts suggest increasing optimism and attractiveness of countries for tourism and business investment.
travel, investment, sentiment, Ipsos, global trend, 2023, recovery, tourism, business
false
Market Analysis and Trends
Professional Services
Multiple Chart
IPSOS
Add to my slides
Remove from favorites
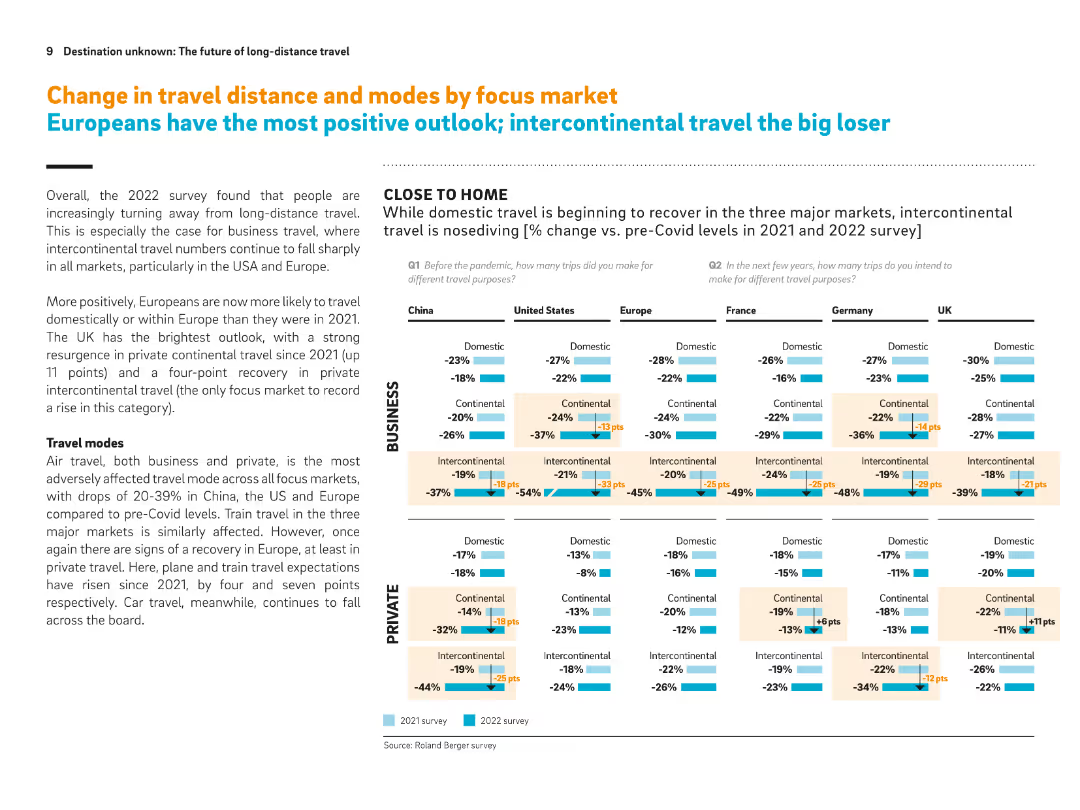
Grid layout with side-by-side regional bar charts comparing 2021 vs. 2022 data. Highlights travel mode and distance expectations.
Market Analysis and Trends
Transportation & Logistics
The slide presents regional changes in business and private travel distances and modes. Europe shows improved optimism for domestic and continental travel. Intercontinental travel is sharply down in all regions. Recovery in train usage is emerging, especially in Europe.
Travel modes, intercontinental travel, domestic recovery, regional trends, rail alternatives, Europe optimism
false
Market Analysis and Trends
Transportation & Logistics
Multiple Chart
Roland Berger
Add to my slides
Remove from favorites
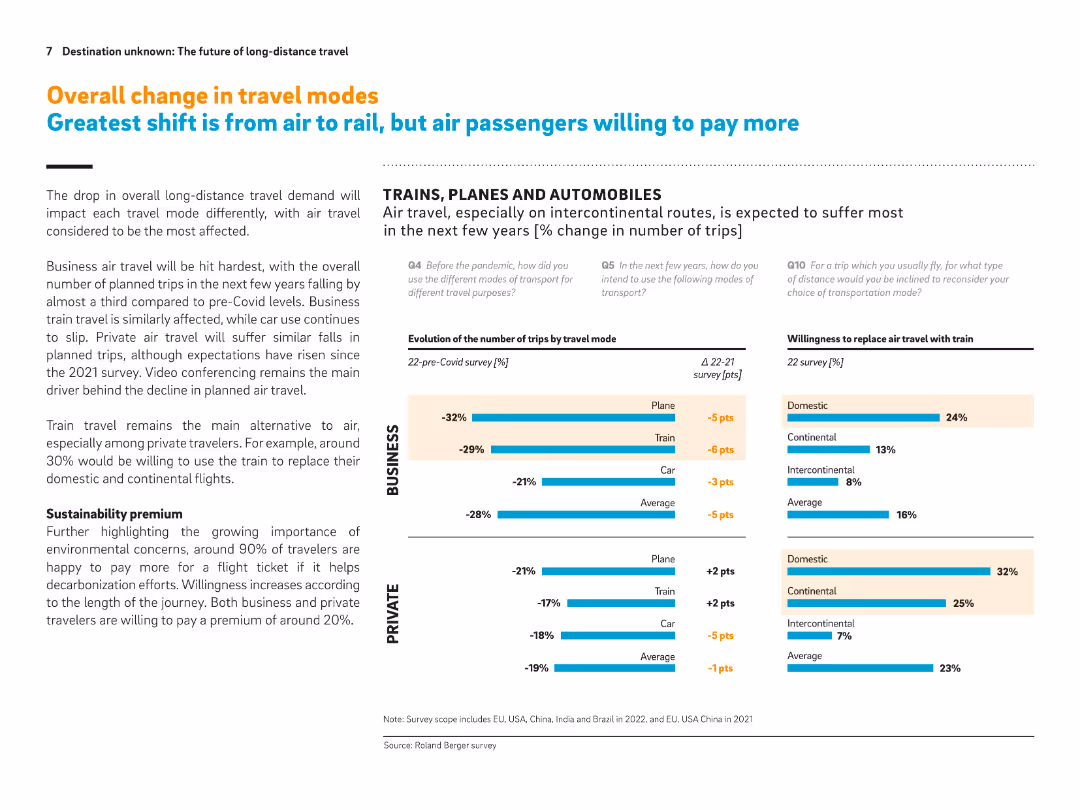
Bar charts on travel modes (plane, train, car) and willingness to replace air travel with trains. Text discusses sustainability and cost concerns.
Market Analysis and Trends
Transportation & Logistics
Air travel is expected to be the most affected mode of transport post-pandemic, especially among business travelers. A significant portion of travelers are open to using trains, particularly for short to medium distances. Willingness to pay premiums for sustainability is highlighted.
Travel modes, sustainability, air travel, train substitution, consumer preferences, post-Covid shifts, premium willingness
false
Market Analysis and Trends
Transportation & Logistics
Multiple Chart
Roland Berger
Add to my slides
Remove from favorites
Column chart with additional ratio comparisons
Customer and Market Segmentation
Hospitality & Tourism
Analyzes preferred activities of high-end travelers in Europe compared to global averages, highlighting interests in food, wine, nature, and history.
travel, preferences, Europe, activities, comparison
false
Customer and Market Segmentation
Hospitality & Tourism
Single Chart
Bain
Add to my slides
Remove from favorites
Column charts showing percentages of consumers wanting to travel again, segmented by country, and a text section on the right discussing travel preferences and safety considerations.
Market Analysis and Trends
Technology & Software
Discusses consumer readiness to resume travel, with a focus on domestic trips and safety considerations. Offers insights for tourism and hospitality sectors on post-pandemic travel behaviors and safety as a decision-making factor.
Travel readiness, Consumer sentiment, Safety considerations, Domestic trips, Post-COVID
false
Market Analysis and Trends
Technology & Software
Mixed Chart
Bain
Add to my slides
Remove from favorites
Featuring a line graph of search trends for Germany related to Singapore's travel announcements, this slide marks significant increases with an accent color. It includes sidebar bullet points discussing expected leisure travel demand, changing consumer behaviors, and the importance of flexibility and safety in travel offerings.
Market Analysis and Trends
Hospitality & Tourism
This slide presents an optimistic view on the recovery of the travel sector, suggesting a rapid rebound driven by pent-up demand and a shift in consumer travel behaviors, as demonstrated by the spike in search interest following Singapore's introduction of the Vaccinated Travel Lane (VTL) with Germany.
travel recovery, search trends, consumer demand, COVID-19, vaccinated travel, Singapore, Germany, industry analysis, consumer behavior
false
Market Analysis and Trends
Hospitality & Tourism
Mixed Chart
Bain
Add to my slides
Remove from favorites
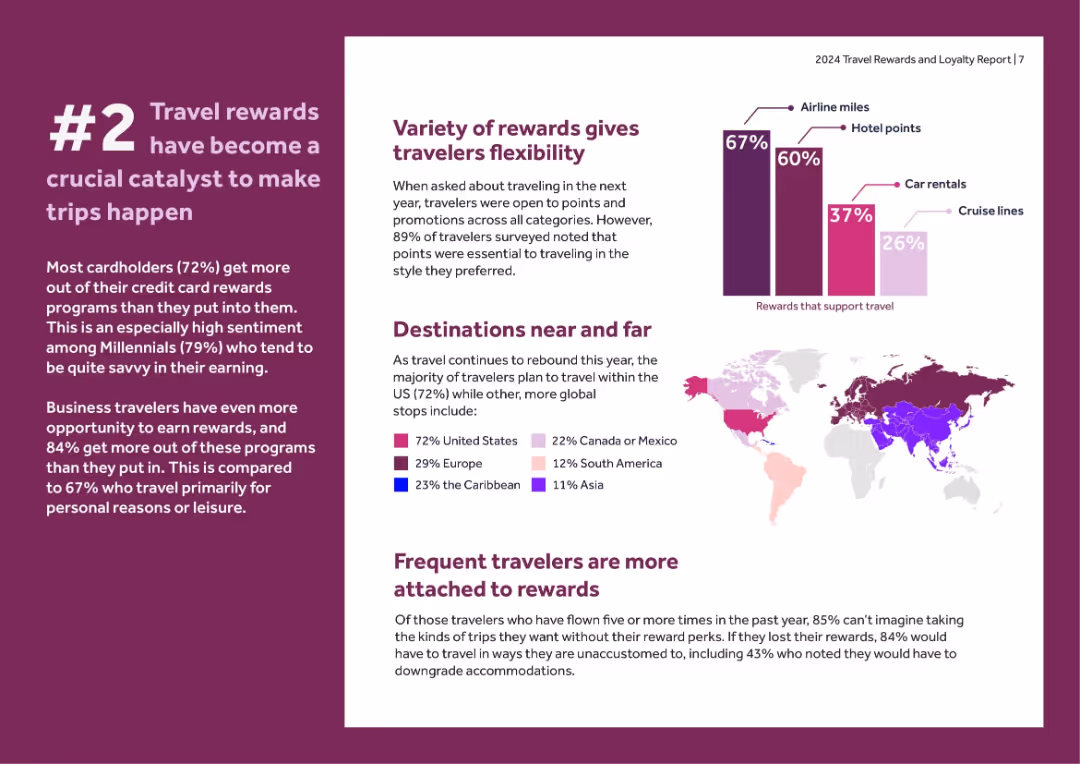
Purple-toned split slide with map, bar chart, and supporting commentary on travel destinations and reward flexibility.
Customer and Market Segmentation
Financial Services
Explores how travel rewards influence trip planning, with stats on types of rewards used, destinations, and how frequent travelers depend on loyalty perks to maintain their travel quality.
travel rewards, loyalty, airline miles, hotel points, destinations, consumer sentiment, survey data, US travelers
false
Customer and Market Segmentation
Financial Services
Multiple Chart
Barclays
Add to my slides
Remove from favorites
A slide with blue column chart bars showing Chase Travel sales volume over time, with additional details on marketplace strategies and acquisitions.
Financial Performance
Technology & Software
Projects growth in consumer travel, discussing marketplace strategies and highlighting the value of recent acquisitions.
travel sales, growth projection, marketplace strategy, acquisitions, premium customers, Chase
false
Financial Performance
Technology & Software
Mixed Chart
JP Morgan
Add to my slides
Remove from favorites
The slide shows a layered column chart for 2015 and 2025, subdivided into hotels, airlines, and rides, with a side description.
Market Analysis and Trends
Hospitality & Tourism
It discusses the SEA online travel market, expected to quadruple by 2025. The chart breaks down the market size by sectors, with additional details on the drivers of this growth.
travel, SEA, growth, hotels, airlines, rides
false
Market Analysis and Trends
Hospitality & Tourism
Mixed Chart
Bain
Add to my slides
Remove from favorites
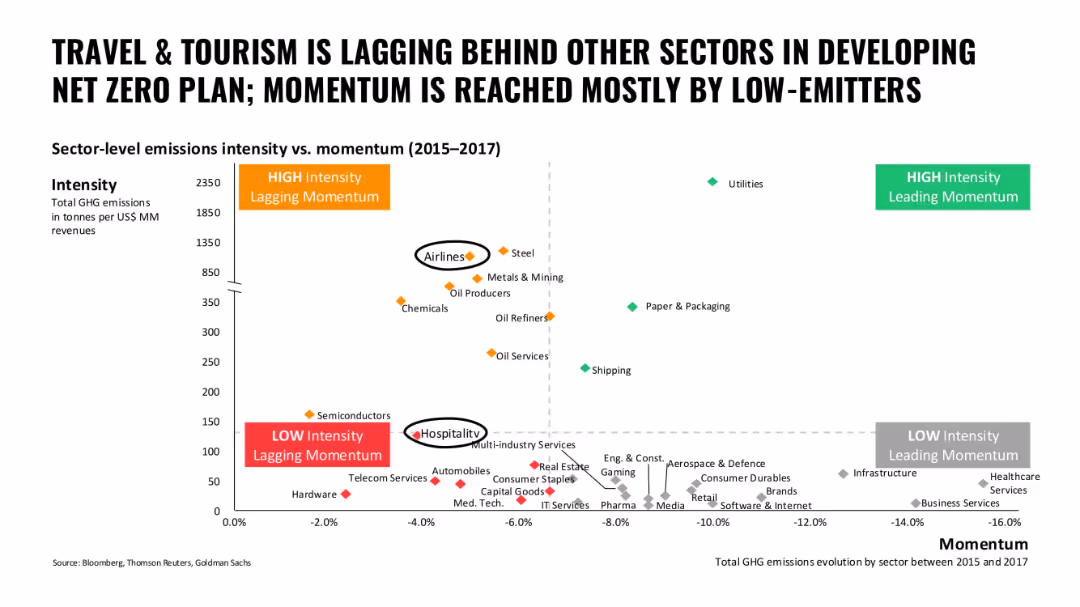
Scatter plot of sectors comparing GHG emissions intensity to momentum; color-coded sectors; high and low quadrants marked
Performance Metrics and KPIs
Hospitality & Tourism
This slide compares travel and tourism sectors to others in terms of carbon intensity and decarbonization momentum, showing airlines and hospitality as lagging in progress.
travel, tourism, emissions, momentum, lagging sectors, airlines, hospitality
false
Performance Metrics and KPIs
Hospitality & Tourism
Single Chart
Oliver Wyman
Add to my slides
Remove from favorites
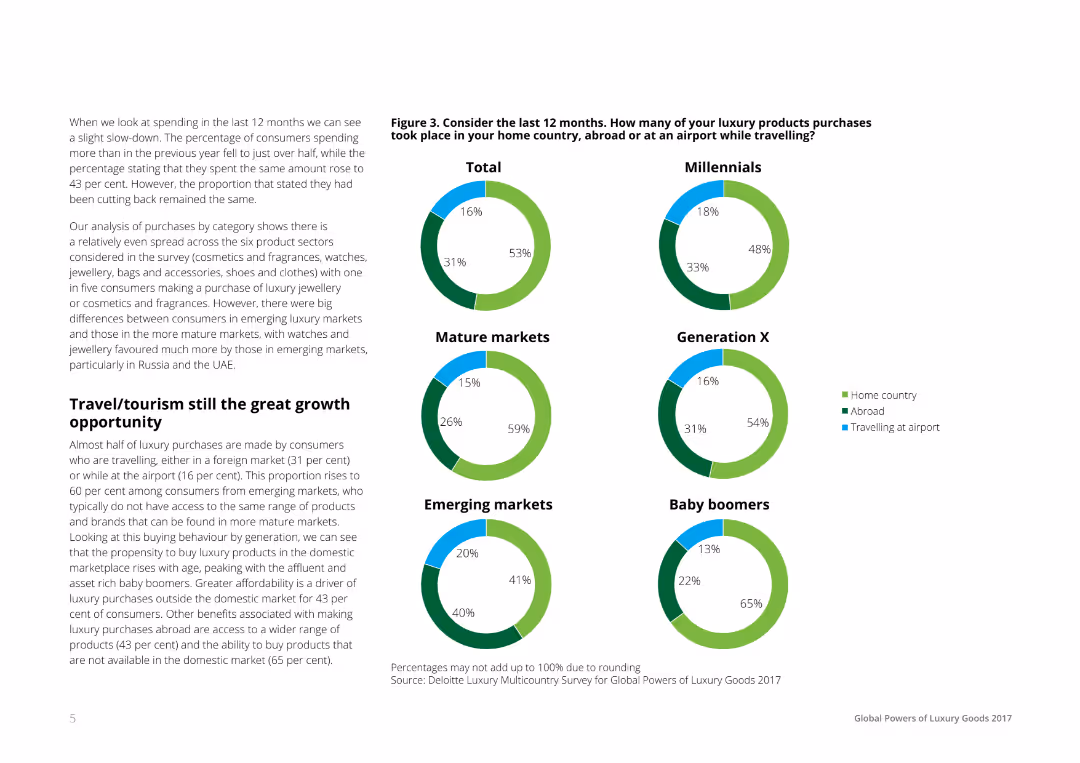
Textual analysis on the left with pie charts on the right, representing data on where luxury purchases took place: home country, abroad, or at the airport. Each pie chart is segmented and color-coded to represent different demographic groups.
Market Analysis and Trends
Hospitality & Tourism
The slide highlights the travel and tourism sector as a key growth area for luxury goods, presenting data on where consumers purchase luxury products, segmented by demographic groups such as Millennials, Generation X, and Baby Boomers.
Travel, Tourism, Luxury, Market, Growth
false
Market Analysis and Trends
Hospitality & Tourism
Multiple Chart
Deloitte
Add to my slides
Remove from favorites
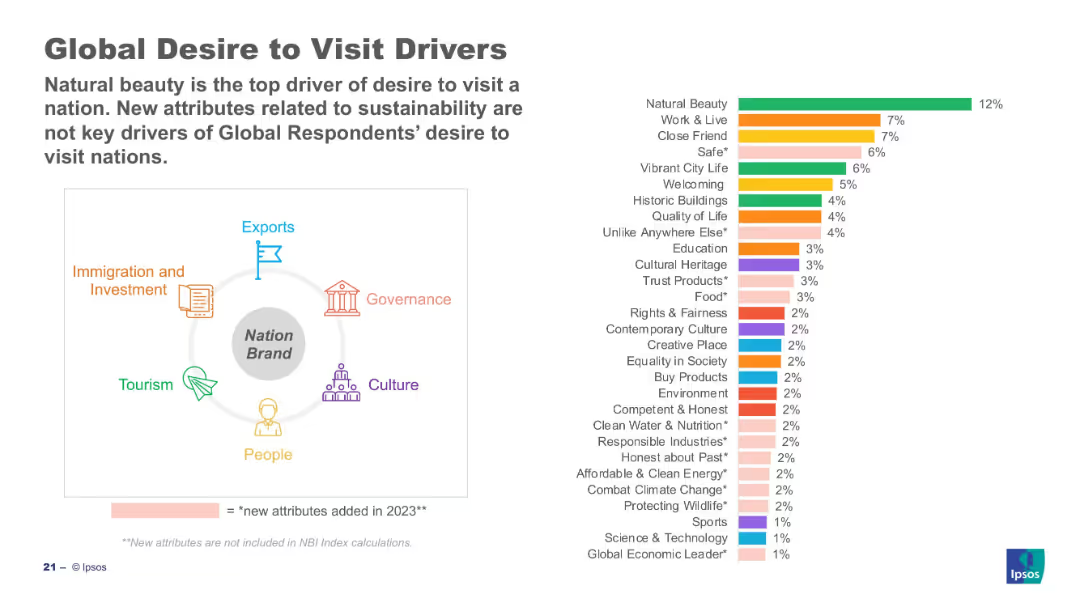
Bar chart on right ranks visit drivers; left visual links drivers to nation brand components.
Customer and Market Segmentation
Professional Services
The slide explores what attributes influence global desire to visit a country. “Natural beauty” ranks highest, followed by livability and safety. Sustainability-related attributes score lower. The left graphic categorizes drivers under areas like governance, tourism, and culture.
travel, tourism, motivations, Ipsos, visit drivers, global ranking, attributes, perception
false
Customer and Market Segmentation
Professional Services
Mixed Chart
IPSOS
Add to my slides
Remove from favorites
Features a world map showing global airline capacity reduction and a line chart tracking vaccine doses and ticket volumes.
Market Analysis and Trends
Transportation & Logistics
This slide discusses the varied recovery of global travel demand linked to vaccine distribution, highlighting specific metrics like airline capacity and ticket volume changes.
travel, tourism, vaccine, recovery, airline capacity, ticket volumes, global demand
false
Market Analysis and Trends
Transportation & Logistics
Mixed Chart
BCG
Add to my slides
Remove from favorites
This slide uses a combination of line charts and textual analysis to illustrate past and projected trends in the travel industry, particularly focusing on the impact of COVID-19 on leisure and business travel. The design is informative, with color-coded elements for clarity.
Market Analysis and Trends
Hospitality & Tourism
Explores the dual impact of COVID-19 on business and leisure travel, highlighting the rapid recovery in leisure travel fueled by pent-up demand, against a backdrop of a long-term decline in business travel due to shifts in work and meeting habits. It provides forecasts and strategies for adapting to these changes.
travel trends, COVID-19 impact, leisure travel, business travel, market forecast, recovery strategies, sustainability
false
Market Analysis and Trends
Hospitality & Tourism
Mixed Chart
BCG
Add to my slides
Remove from favorites
A column chart illustrates the expected travel nights by income segment, with top reasons for travel changes listed in descending order.
Market Analysis and Trends
Hospitality & Tourism
This slide analyzes U.S. travel trends, focusing on the anticipated increase in travel activity post-COVID-19 by different income groups. Useful for understanding travel preferences and planning in the hospitality and tourism sectors.
travel, trends, USA, post-COVID, income groups
false
Market Analysis and Trends
Hospitality & Tourism
Mixed Chart
BCG
Add to my slides
Remove from favorites
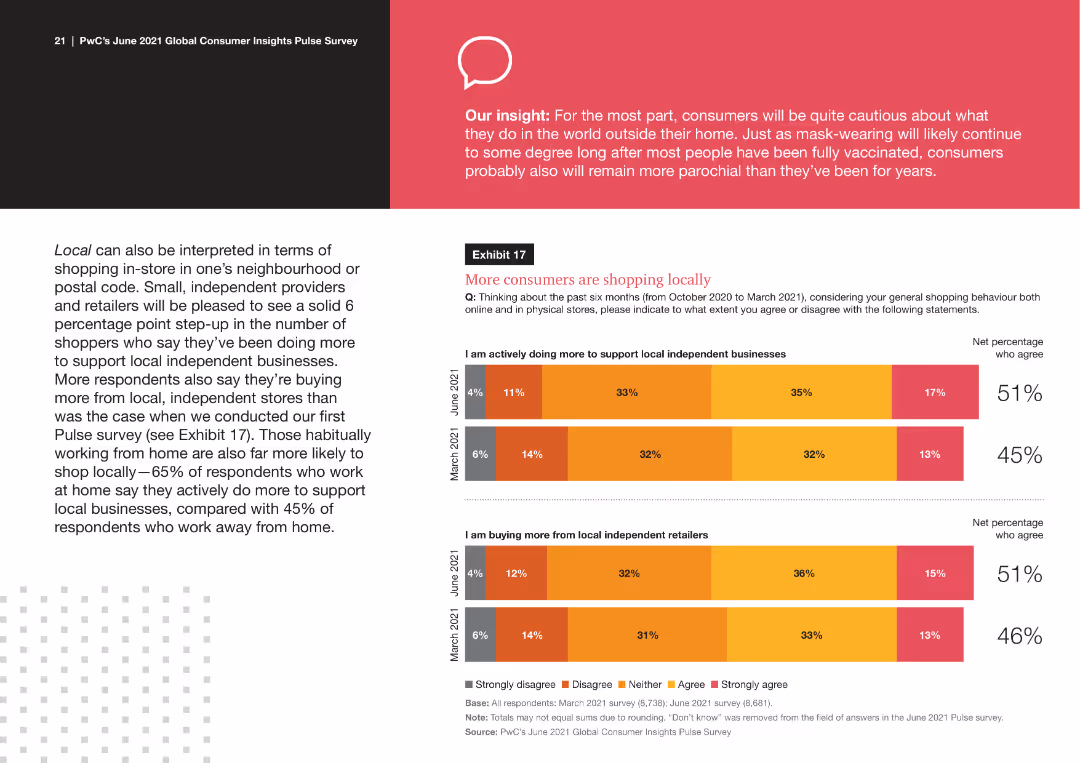
A series of column charts showing the change in consumer willingness to travel via public transport, stay in hotels, and fly domestically and internationally, comparing responses from June 2021 and March 2021.
Market Analysis and Trends
Hospitality & Tourism
The slide analyzes changes in consumer willingness to travel, highlighting increases in likelihood to use public transport, stay in hotels, and fly, based on survey data from June and March 2021.
travel willingness, consumer behavior, public transport, hotels, domestic flights, international flights
false
Market Analysis and Trends
Hospitality & Tourism
Multiple Chart
PwC/Strategy&
Add to my slides
Remove from favorites
Contains a simple layout with icons and text describing various treasury capabilities offered, focusing on client-centered solutions.
Operational Efficiency
Financial Services
Describes JPMorgan Chase & Co.'s range of treasury capabilities, emphasizing client value and service efficiency.
Treasury, banking solutions, client value, JPMorgan Chase, financial services, liquidity management, payment processing, fraud protection
false
Operational Efficiency
Financial Services
Pillar
JP Morgan
Add to my slides
Remove from favorites
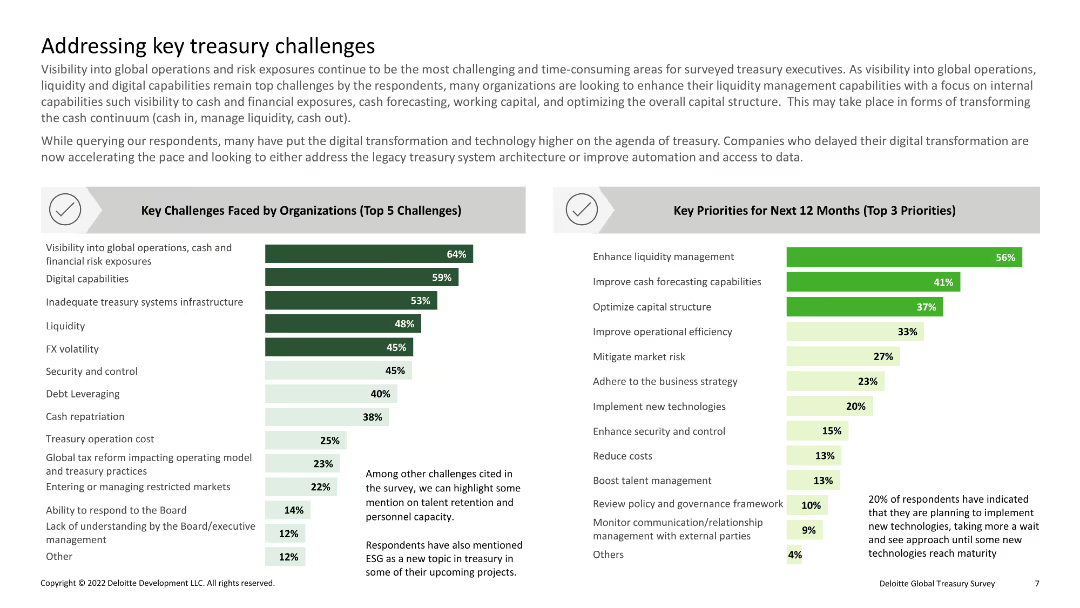
Two sections with bar charts listing key challenges faced by organizations and their priorities for the next 12 months. Uses a green color scheme for priorities and challenges.
Risk Assessment and Management
Financial Services
This slide addresses key challenges in treasury management and highlights the priorities for the upcoming year, focusing on areas like liquidity management, cash forecasting, and capital structure optimization.
Treasury, Challenges, Priorities, Liquidity, Management
false
Risk Assessment and Management
Financial Services
Multiple Chart
Deloitte
Add to my slides
Remove from favorites
Graphs comparing revenue performance and rankings, and text blocks highlighting commercial deposit franchise features. Logos for banking services and an accompanying graphic.
Operational Efficiency
Financial Services
Details on the commercial deposit franchise and treasury management, showcasing revenue performance and service features. Used for demonstrating business achievements and operational capabilities in treasury services.
treasury management, commercial deposits, banking services, revenue performance, FDIC
false
Operational Efficiency
Financial Services
Multiple Chart
Morgan Stanley
Add to my slides
Remove from favorites
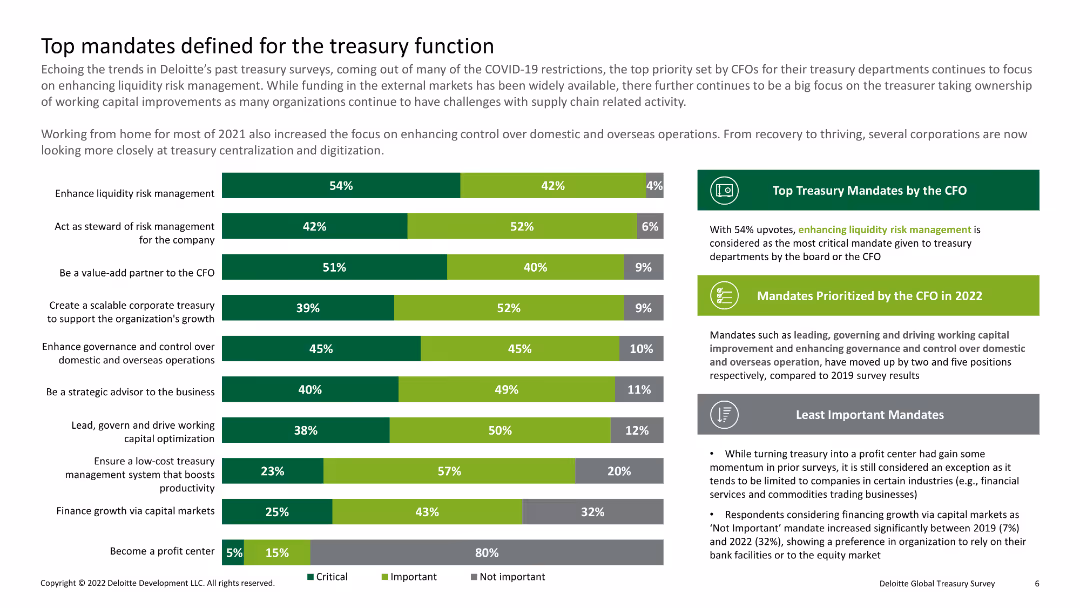
Bar chart and bullet points listing top mandates for treasury functions as prioritized by CFOs. The slide uses green and grey color schemes to categorize the mandates based on their importance.
Strategic Planning
Financial Services
This slide identifies the top mandates for treasury functions according to CFO priorities, emphasizing areas such as liquidity risk management, risk management, and strategic advisory roles.
Treasury, Mandates, CFO, Liquidity, Risk
false
Strategic Planning
Financial Services
Mixed Chart
Deloitte
Add to my slides
Remove from favorites
Three content sections with icons, each listing features and benefits targeted at different client segments, from small businesses to multinational corporations, along with a descriptive title.
Client Case Studies
Financial Services
Offers a detailed overview of payment and treasury solutions tailored to various client segments, providing insights into company strategies to meet diverse needs, useful for client engagement and business development purposes.
Treasury, Payments, Client Segments, Solutions, Strategy
false
Client Case Studies
Financial Services
Pillar
JP Morgan
Add to my slides
Remove from favorites
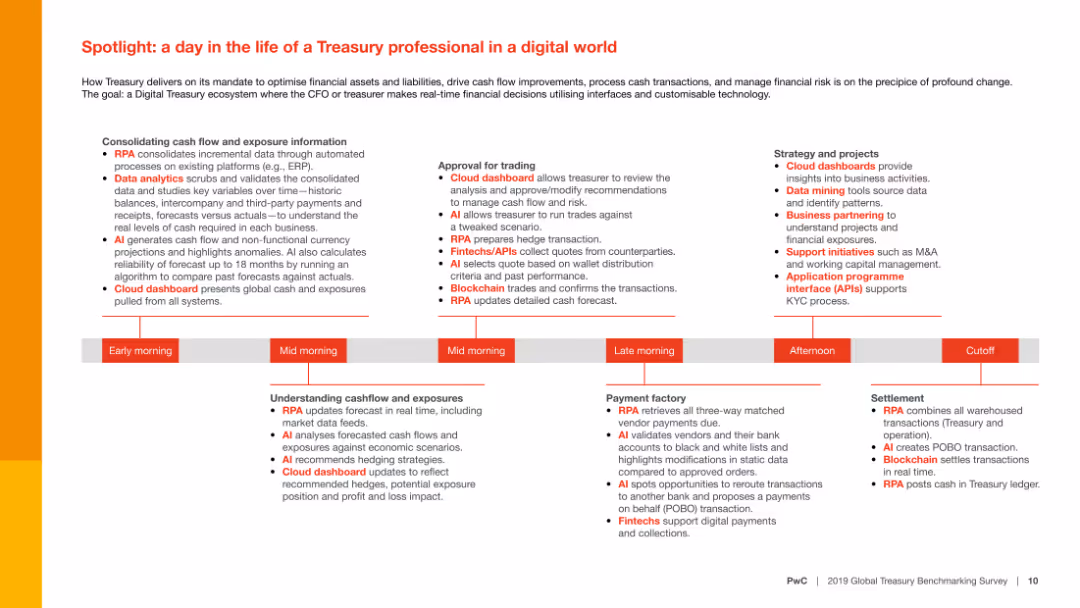
Detailed text with a timeline outlining a typical day of a treasury professional, highlighting the use of technologies like RPA, AI, and cloud dashboards in different tasks.
Operational Efficiency
Financial Services
The slide provides a detailed timeline of a treasury professional's daily tasks, showcasing how various digital tools and technologies streamline financial operations and decision-making.
Treasury professional, digital tools, RPA, AI, cloud dashboards
false
Operational Efficiency
Financial Services
Linear Flow
PwC/Strategy&
Add to my slides
Remove from favorites
Contains column charts showing treasury services revenue and client engagement metrics, with a list of achievements.
Market Analysis and Trends
Financial Services
Illustrates the firm’s growth in treasury services compared to competitors and their engagement with large corporations.
Treasury Services, Growth, Competitors, Fortune 500, Client Engagement, Market Share
false
Market Analysis and Trends
Financial Services
Multiple Chart
JP Morgan
Add to my slides
Remove from favorites
Column chart with treasury services firmwide revenue growth and a column chart comparing revenue growth with peers, highlighted with growth percentages.
Financial Performance
Financial Services
Highlights significant revenue growth of treasury services within the firm compared to industry peers, underlining resilience against rate headwinds.
Treasury Services, Revenue Growth, Industry Comparison, Financial Services
false
Financial Performance
Financial Services
Multiple Chart
JP Morgan
Add to my slides
Remove from favorites
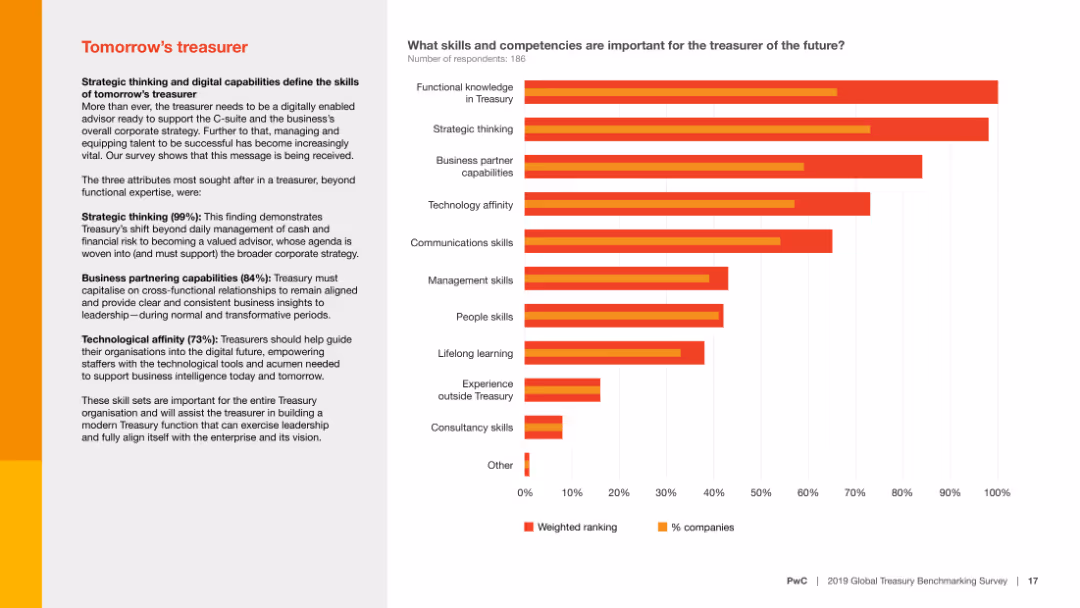
Includes a column chart displaying the importance of various skills and competencies for future treasurers. Text explains the findings.
Strategic Planning
Financial Services
The slide outlines the essential skills for future treasurers, emphasizing strategic thinking, business partnering capabilities, and technological affinity.
Treasury, skills, competencies, future, strategic thinking
false
Strategic Planning
Financial Services
Mixed Chart
PwC/Strategy&
Add to my slides
Remove from favorites
The slide employs a flowchart design to illustrate treasury management solutions, paired with text descriptions and icons. The layout is clear and organized, allowing easy navigation through the content.
Product and Service Analysis
Financial Services
It breaks down how commercial banking provides differentiated treasury solutions, making it suitable for presentations aimed to inform about value-driven client services in treasury management.
treasury solutions, commercial banking, client value, service analysis, flowchart
false
Product and Service Analysis
Financial Services
Header Vertical
JP Morgan
Add to my slides
Remove from favorites
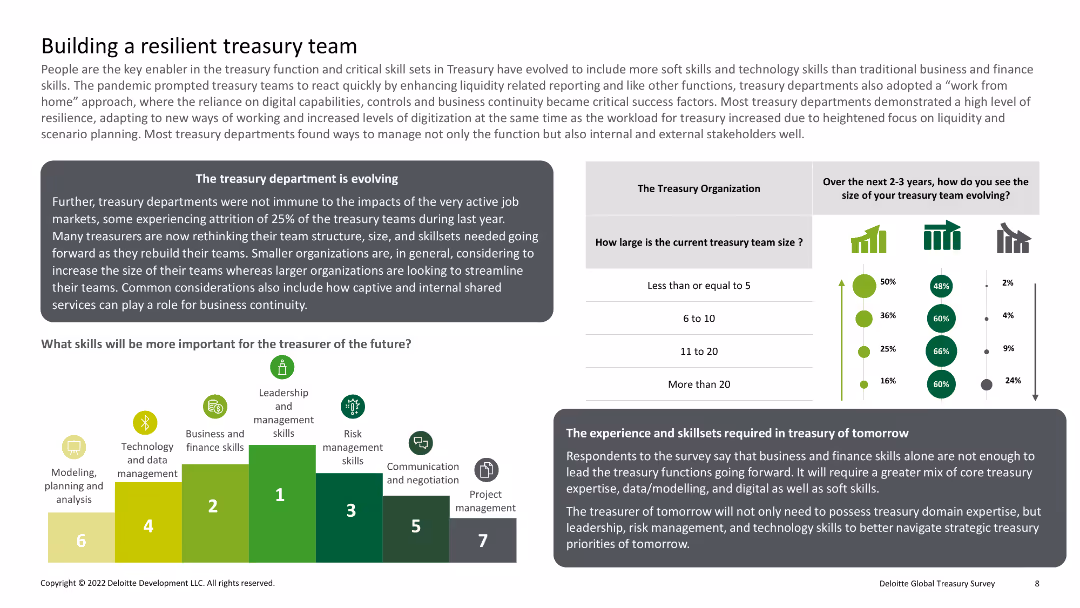
Text boxes and icons illustrating key skills required for treasury teams. Also includes a bar chart showing the current and projected size of treasury teams over the next 2-3 years.
Operational Efficiency
Professional Services
The slide outlines the skills and attributes necessary for building a resilient treasury team, highlighting the importance of leadership, risk management, and technological expertise. It also projects team size growth over time.
Treasury, Team, Skills, Resilience, Growth
false
Operational Efficiency
Professional Services
Multiple Chart
Deloitte
Add to my slides
Remove from favorites
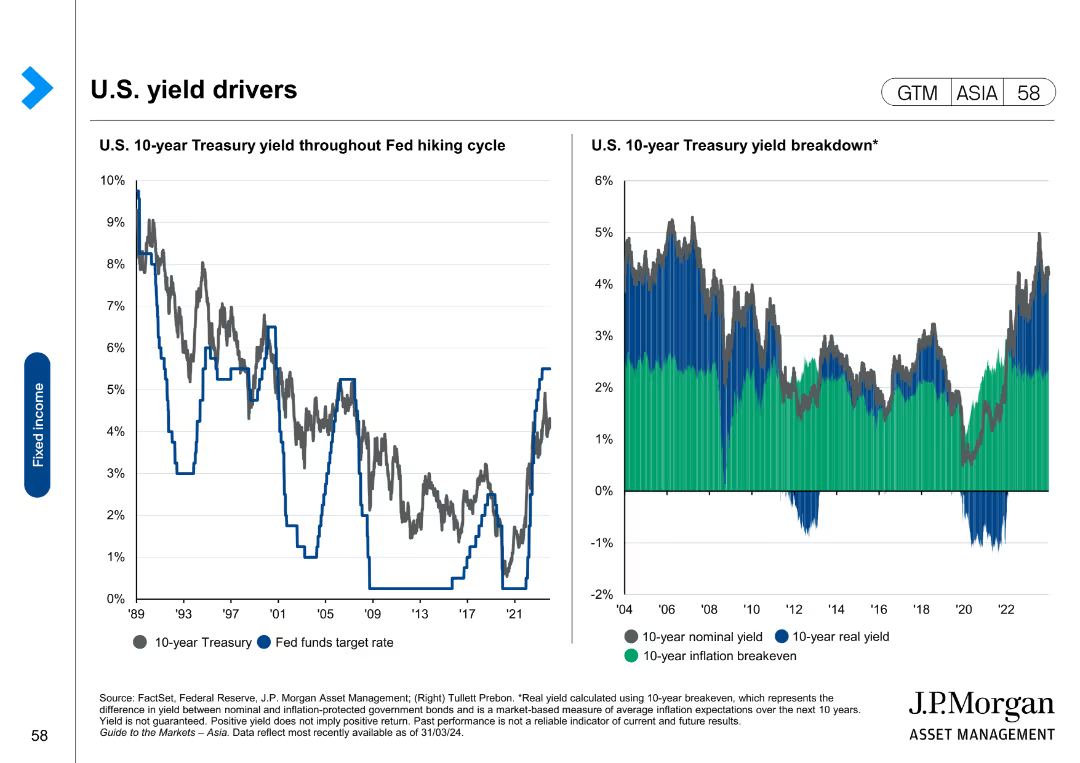
This slide contains two line charts on the left and a column chart on the right, depicting U.S. Treasury yields and their breakdown over time.
Market Analysis and Trends
Financial Services
The slide analyzes the U.S. 10-year Treasury yield across different periods and provides a breakdown of nominal, real, and inflation yields.
Treasury yields, Fed policy, inflation, financial trends, economic analysis
false
Market Analysis and Trends
Financial Services
Multiple Chart
JP Morgan
Add to my slides
Remove from favorites
Line chart showing U.S. Treasury yield curves and a table comparing yields and performance of various Treasury securities over different periods.
Investment Analysis
Financial Services
Presents U.S. Treasury yield curves and performance metrics for various Treasury securities, providing insights into interest rate trends and investment returns.
Treasury yields, investment, performance
false
Investment Analysis
Financial Services
Mixed Chart
Morgan Stanley
Add to my slides
Remove from favorites
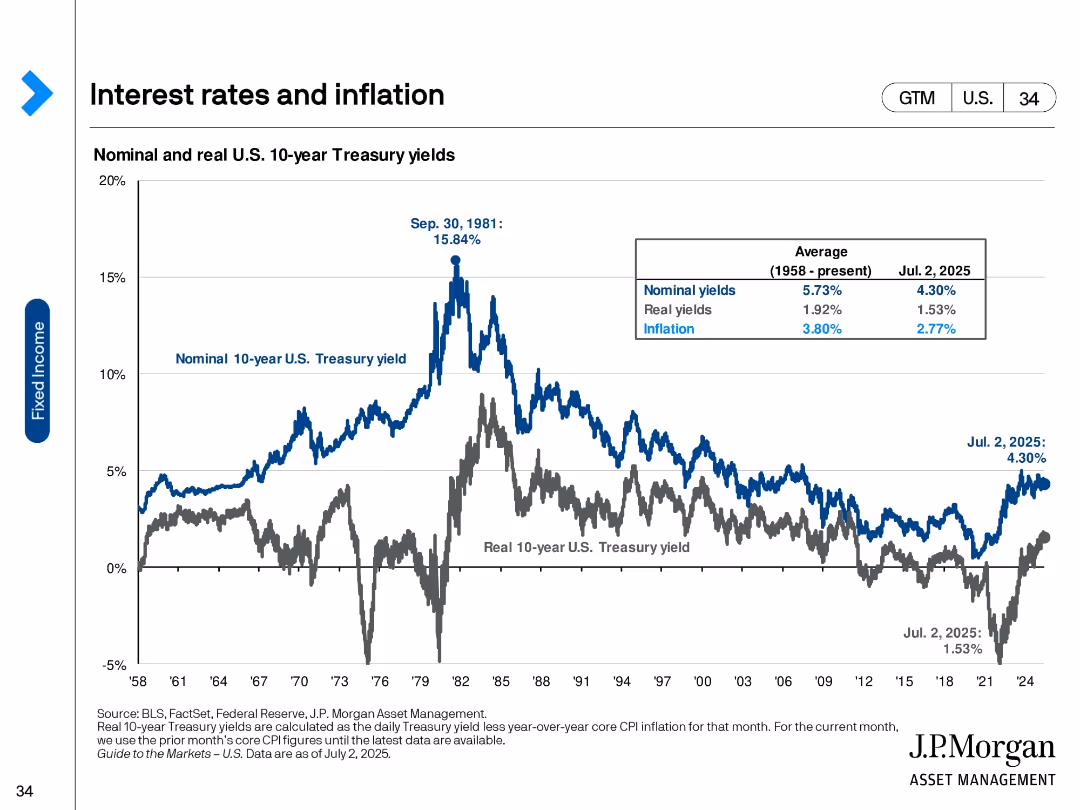
Line chart comparing nominal and real U.S. 10-year Treasury yields since 1958, annotated with peaks and averages; inset table shows yield data.
Investment Analysis
Financial Services
This slide contrasts nominal and real yields on the 10-year U.S. Treasury bond, showing historical trends, inflation adjustments, and the current levels as of July 2025. It offers perspective on real returns versus inflation impact.
Treasury yields, real yields, inflation, interest rates, fixed income, bond market
false
Investment Analysis
Financial Services
Single Chart
JP Morgan
Add to my slides
Remove from favorites
The slide includes a line chart displaying U.S. Treasury Yield Curves for different durations and a table comparing yields and performance over different periods.
Investment Analysis
Financial Services
The slide provides an analysis of U.S. Treasury yields, showing how they have changed over time and comparing current yields with past performance.
Treasury Yields, Yield Curves, Performance, Investment, U.S. Treasury
false
Investment Analysis
Financial Services
Mixed Chart
Morgan Stanley
Add to my slides
Remove from favorites
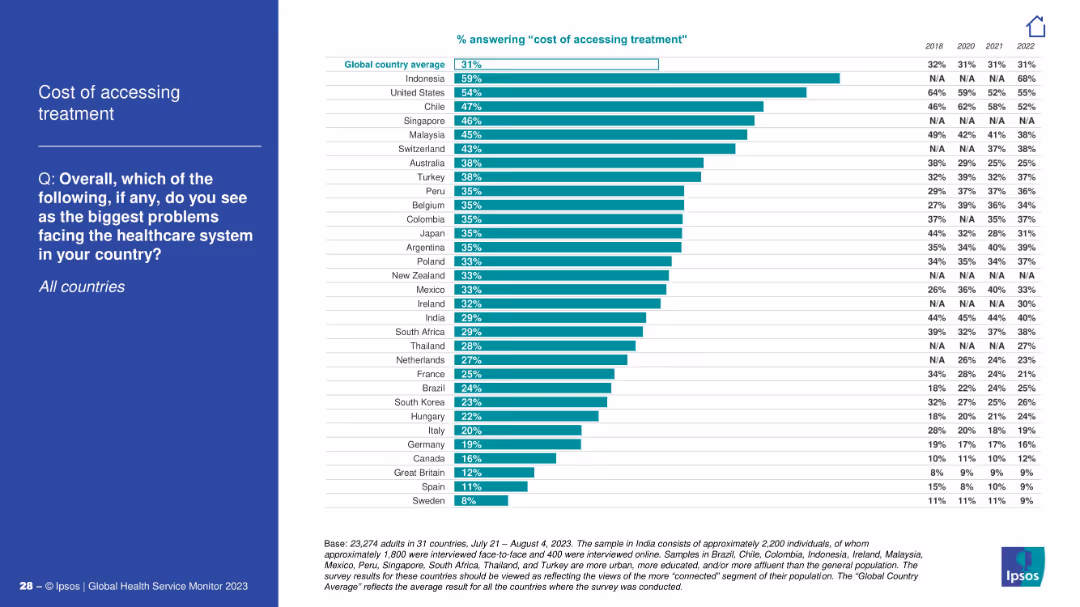
Bar chart by country; ranked by percentage; blue left panel with title/question.
Market Analysis and Trends
Healthcare & Pharmaceuticals
This slide shows the percentage of people in each country identifying treatment cost as a major issue. Indonesia and the U.S. lead the list. Historical data from 2018–2022 is shown alongside each country.
treatment cost, affordability, access, global data
false
Market Analysis and Trends
Healthcare & Pharmaceuticals
Mixed Chart
IPSOS
Add to my slides
Remove from favorites
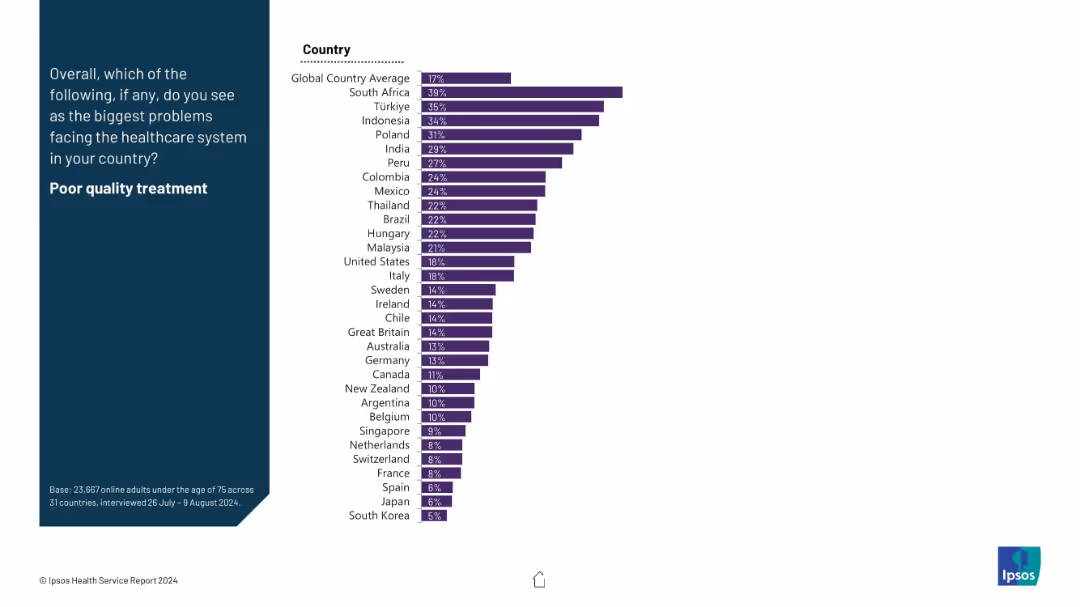
A horizontal bar chart ranks countries by the percentage of people who identify poor treatment quality as a major issue.
Risk Assessment and Management
Healthcare & Pharmaceuticals
This slide shows which populations are most concerned about the quality of healthcare treatments. South Africa and Türkiye rank highest. The global concern average is 17%.
treatment quality, healthcare service, dissatisfaction, patient care, quality assurance, public health perception
false
Risk Assessment and Management
Healthcare & Pharmaceuticals
Mixed Chart
IPSOS
Add to my slides
Remove from favorites
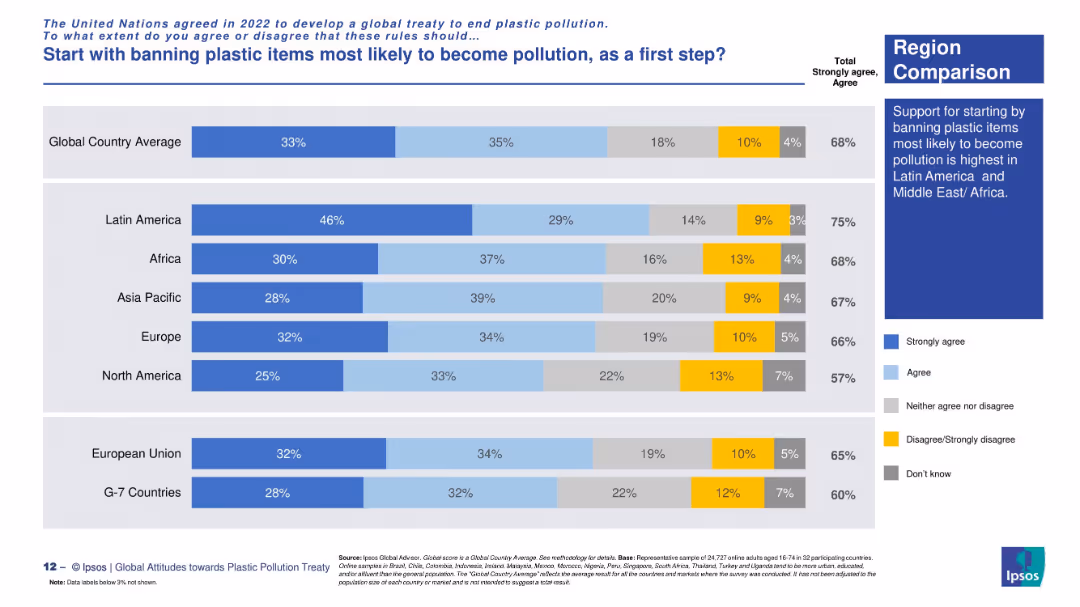
Regional view using a consistent stacked bar chart layout with commentary in a right-aligned box.
Regulatory and Compliance
Environmental Services & Sustainability
Regional analysis of support for initial bans on likely pollutive plastics. Latin America has the strongest support (75%), followed by Africa and Asia Pacific. G7 countries show the lowest backing.
treaty phases, regional policy, plastic waste, first-step strategy, Ipsos data, environmental concern, ban support, public opinion
false
Regulatory and Compliance
Environmental Services & Sustainability
Mixed Chart
IPSOS
Add to my slides
Remove from favorites
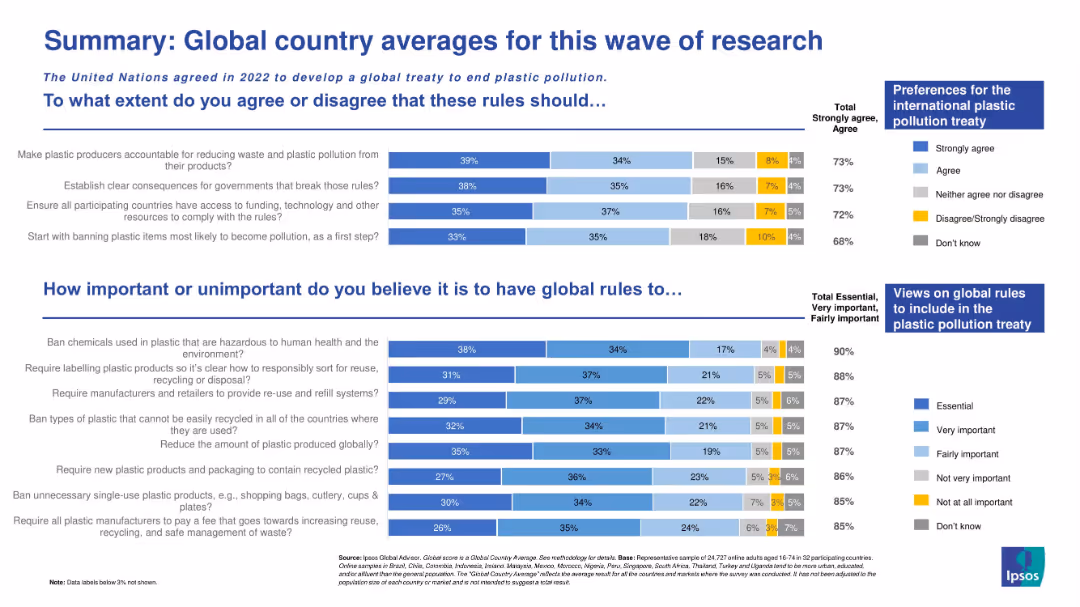
Two-section layout with horizontal bar charts: one for agreement on treaty rules and another for rule importance. Clear color-coded response categories.
Regulatory and Compliance
Environmental Services & Sustainability
This slide shows global sentiment toward proposed plastic pollution treaty rules, detailing both agreement levels and perceived importance of actions such as banning hazardous chemicals and labeling plastic products.
treaty support, global survey, plastic regulation, importance ratings, Ipsos data, environmental policy, waste reduction, consumer perspectives
false
Regulatory and Compliance
Environmental Services & Sustainability
Multiple Chart
IPSOS
Add to my slides
Remove from favorites
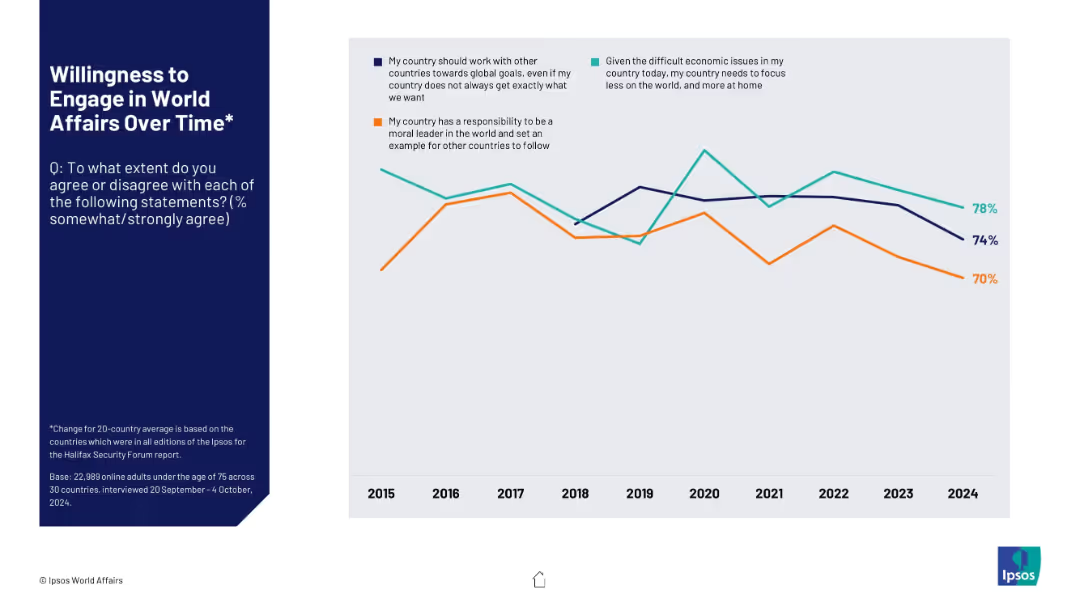
Left-aligned label; right side is a line graph tracking agreement with 3 key statements from 2015 to 2024.
Market Analysis and Trends
Government & Public Sector
This historical line chart visualizes the trend over time for global public agreement with statements about moral leadership, international cooperation, and domestic focus. It helps track shifts in global attitudes on foreign policy engagement.
trend analysis, global opinion, foreign policy, public sentiment, international cooperation, Ipsos data, time series, engagement
false
Market Analysis and Trends
Government & Public Sector
Mixed Chart
IPSOS
Add to my slides
Remove from favorites
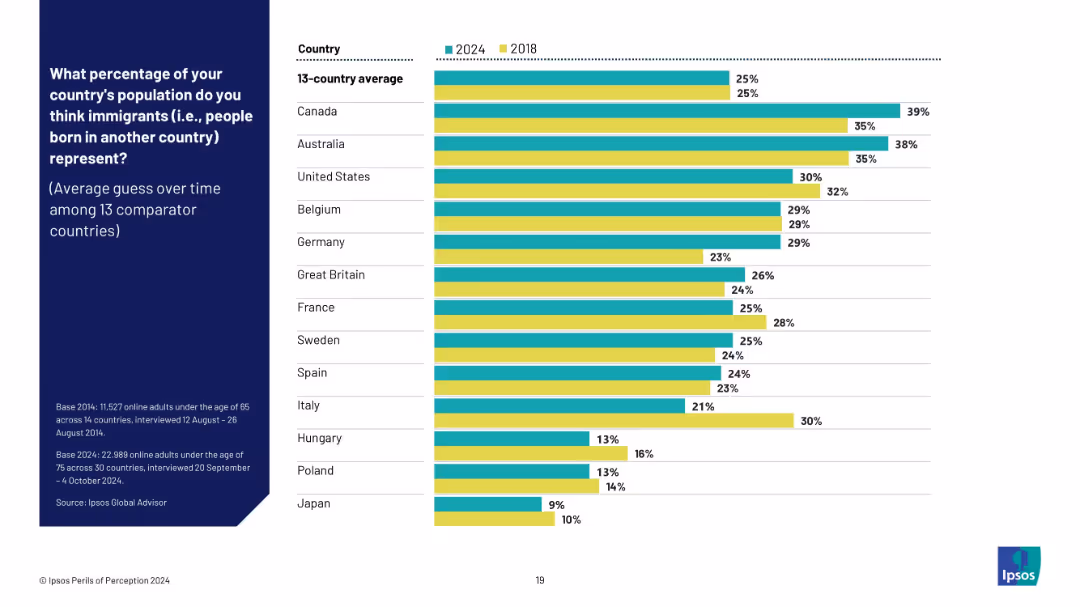
Dual bar chart (2024 vs 2018) showing perception trends in 13 countries; green and yellow bars distinguish years.
Market Analysis and Trends
Government & Public Sector
This trend slide compares changes over time in public perception of immigrant populations across 13 countries from 2018 to 2024. It shows whether the average guess has risen or fallen, revealing persistent overestimation in most cases.
trend analysis, immigration perception, longitudinal data, public opinion trends, overestimation, Ipsos data, perception change
false
Market Analysis and Trends
Government & Public Sector
Mixed Chart
IPSOS
Add to my slides
Remove from favorites
Introductory slide detailing the purpose and methodology of the compendium.
Industry Overview
Professional Services
Explains the scope and intent of the Roland Berger Trend Compendium 2030.
trend analysis, methodology, strategic planning, global trends, 2030
false
Industry Overview
Professional Services
Table
Roland Berger
Add to my slides
Remove from favorites
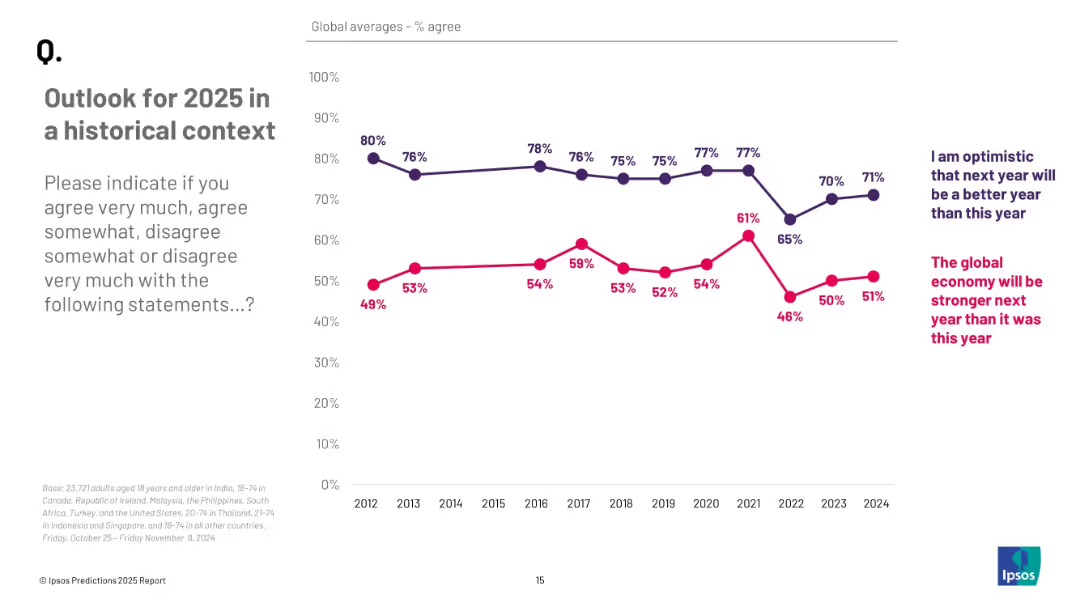
Line graph showing multi-year trends in agreement for two outlook statements from 2012 to 2024.
Market Analysis and Trends
Professional Services
The slide tracks historical sentiment for two forward-looking views: optimism that next year will be better, and belief in global economic improvement. Optimism dropped in 2022 but rebounded slightly to 71% in 2024, while economic expectations are slowly rising.
trend analysis, optimism, economy, historical data, public opinion, global forecast
false
Market Analysis and Trends
Professional Services
Mixed Chart
IPSOS
Add to my slides
Remove from favorites
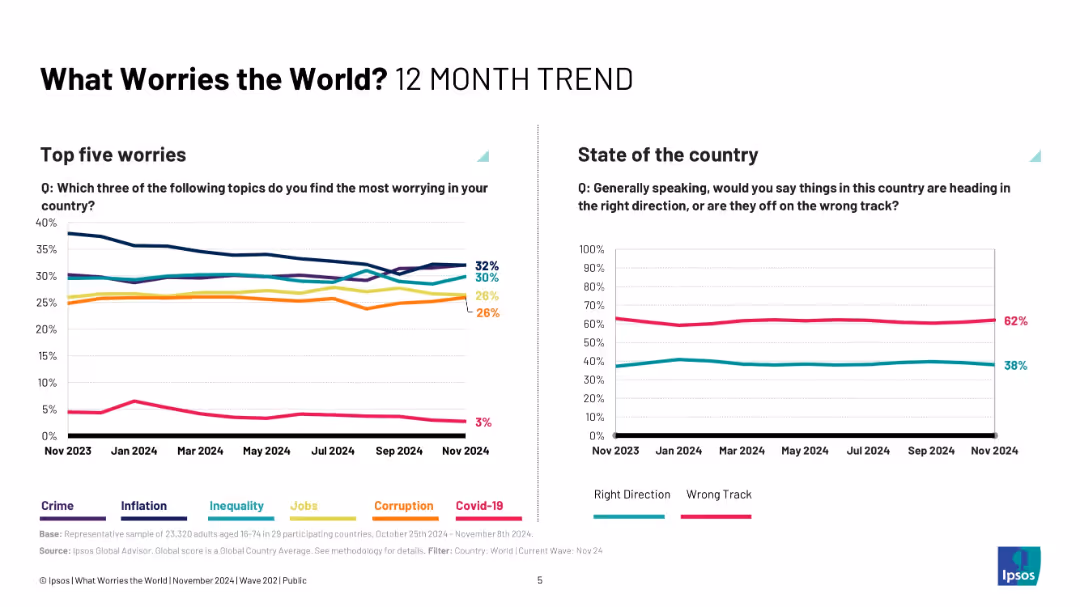
Two-panel chart layout; left side line graph on worries, right side line graph on country direction.
Market Analysis and Trends
Professional Services
This slide shows 12-month trends in global concerns, revealing shifts in the prominence of crime, inequality, inflation, and corruption as key worries. Parallel tracking of public perception of national direction illustrates consistent dissatisfaction over the past year.
trend analysis, public opinion, inflation, crime, inequality, corruption, Ipsos, monthly change
false
Market Analysis and Trends
Professional Services
Multiple Chart
IPSOS
Add to my slides
Remove from favorites
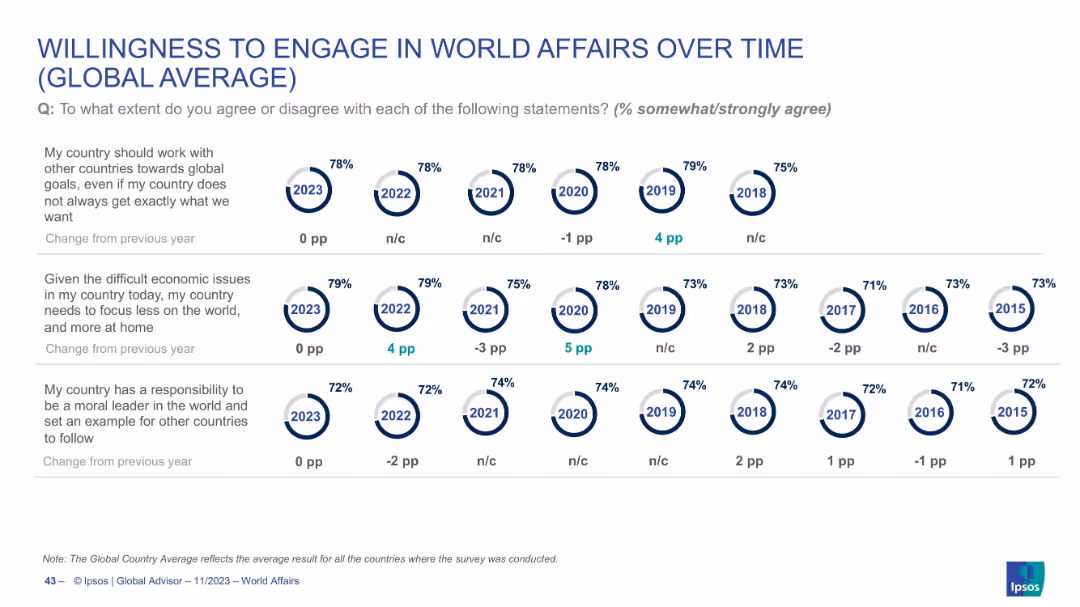
Circular icons and line-style comparisons from 2015–2023, segmented by engagement themes
Market Analysis and Trends
Government & Public Sector
Tracks trends in global attitudes from 2015–2023 on cooperation, internal economic focus, and moral leadership. Provides visual history of public opinion shifts, with data consistency or modest changes across years.
trend analysis, world affairs, global opinion, survey history, policy engagement, Ipsos
false
Market Analysis and Trends
Government & Public Sector
Single Chart
IPSOS
Add to my slides
Remove from favorites
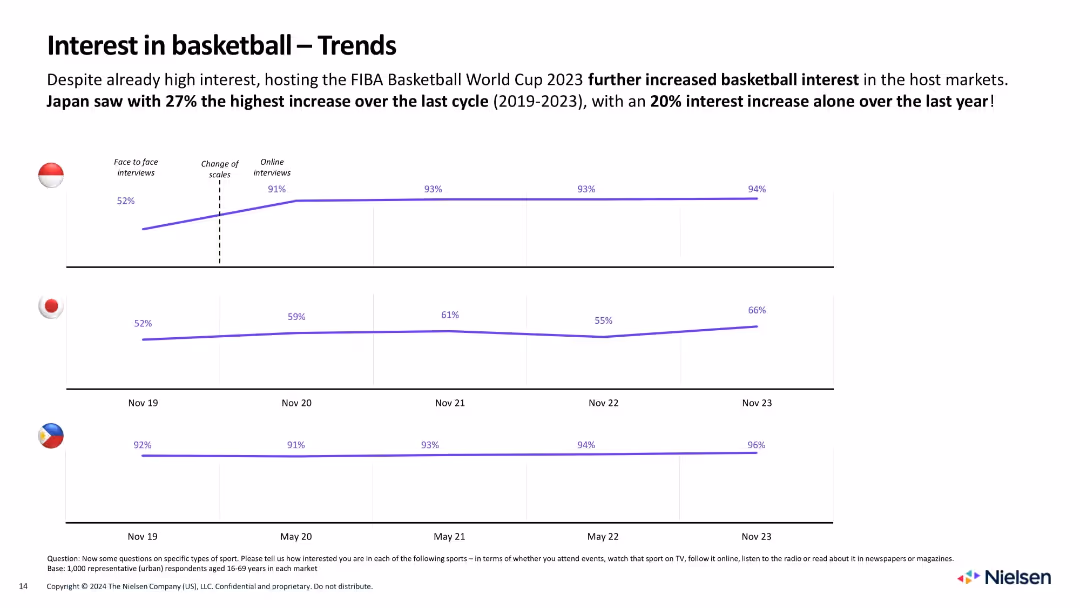
Time series line graphs for 3 countries showing change in basketball interest from 2019–2023
Market Analysis and Trends
Media & Entertainment
Tracks rising interest in basketball across Indonesia, Japan, and the Philippines. Japan had the highest 4-year growth at 27%, with 20% gain in 2023 alone.
trend, basketball, time series, Indonesia, Japan, Philippines, fan interest, growth, Nielsen, 2023
false
Market Analysis and Trends
Media & Entertainment
Single Chart
Nielsen
Add to my slides
Remove from favorites
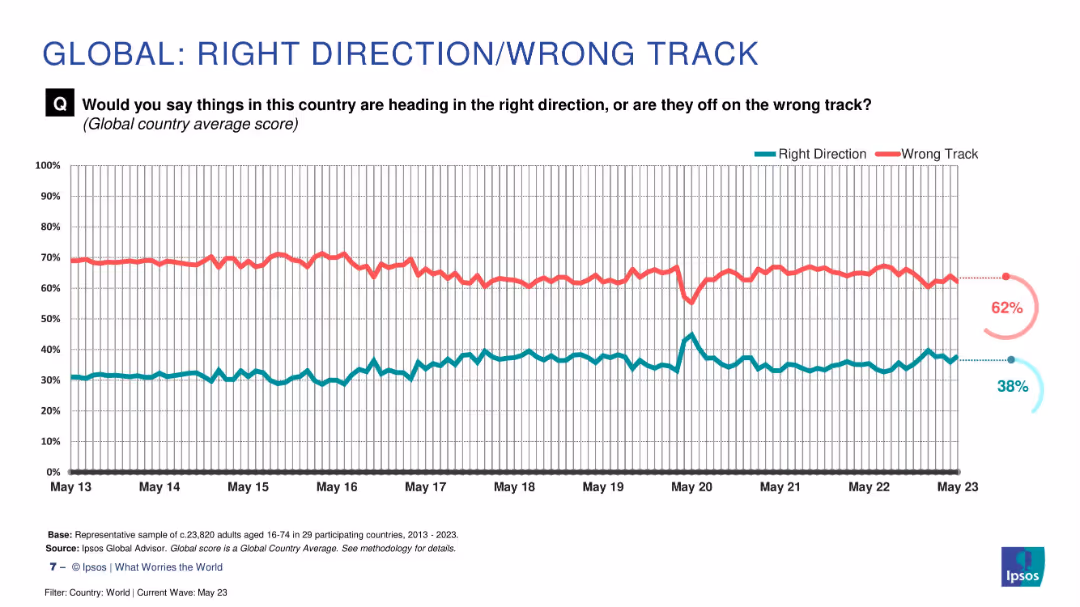
Longitudinal line graph from 2013 to 2023 comparing “Right Direction” vs. “Wrong Track” percentages
Market Analysis and Trends
Government & Public Sector
A long-term trend line illustrating global average perception of national direction over 10 years. "Wrong Track" has consistently remained higher than "Right Direction", although the latter shows recent modest gains. The gap has narrowed slightly but remains significant.
trend, decade, direction, sentiment, wrong track
false
Market Analysis and Trends
Government & Public Sector
Multiple Chart
IPSOS
Add to my slides
Remove from favorites
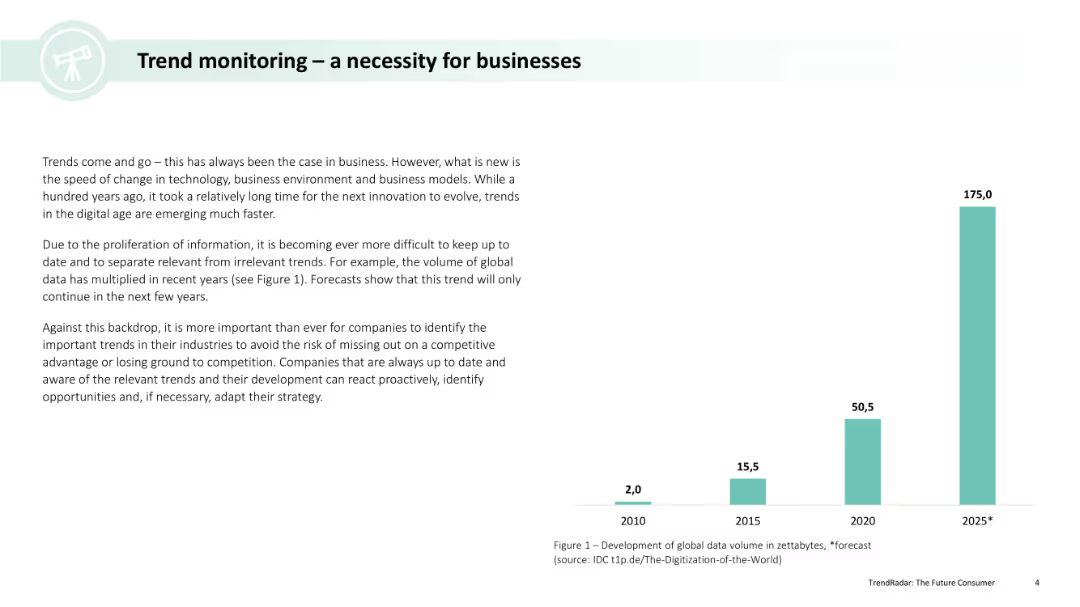
A vertical layout with a column chart showing the development of global data volume in zettabytes from 2010 to 2025. The slide includes a textual explanation of the importance of trend monitoring.
Market Analysis and Trends
Professional Services
This slide discusses the importance of trend monitoring for businesses, emphasizing the rapid increase in global data volume and the need for companies to stay updated with relevant trends to remain competitive.
Trend monitoring, business, data volume, column chart, trends
false
Market Analysis and Trends
Professional Services
Mixed Chart
Deloitte
Add to my slides
Remove from favorites
Circular diagram with six main trend categories around the rim and smaller trend points inside, each color-coded.
Market Analysis and Trends
Professional Services
Overview of 32 macro trends grouped into six mega trends, showing the current and future impact on industries and adoption times.
TrendRadar, future consumer, trends, mega trends, macro trends
false
Market Analysis and Trends
Professional Services
Mixed Chart
Deloitte
Add to my slides
Remove from favorites
Text and icons on the left explaining mega, macro, and micro trends; text and laptop image on the right for impact and adoption assessment.
Market Analysis and Trends
Professional Services
Describes the steps in the TrendRadar process, focusing on trend screening (mega, macro, micro trends) and trend assessment (impact and adoption time).
TrendRadar, mega trends, macro trends, micro trends, impact
false
Market Analysis and Trends
Professional Services
Header Horizontal
Deloitte
Add to my slides
Remove from favorites
A flowchart with three main sections: Trend Screening, Trend Assessment, and TrendRadar, visually connecting these steps through a funnel.
Market Analysis and Trends
Professional Services
Explains the three-step procedure of TrendRadar, which includes trend screening, assessment, and visualization for identifying and assessing industry trends.
TrendRadar, procedure, trend screening, assessment, visualization
false
Market Analysis and Trends
Professional Services
Mixed Chart
Deloitte
Add to my slides
Remove from favorites
A radar chart dividing trends into Watch, Prepare, and Act categories, with varying sizes of circles representing different trends.
Market Analysis and Trends
Professional Services
Visual representation of trends categorized by their impact and timeframe for adoption, classified into Watch, Prepare, and Act.
TrendRadar, radar chart, watch, prepare, act
false
Market Analysis and Trends
Professional Services
Mixed Chart
Deloitte
Add to my slides
Remove from favorites
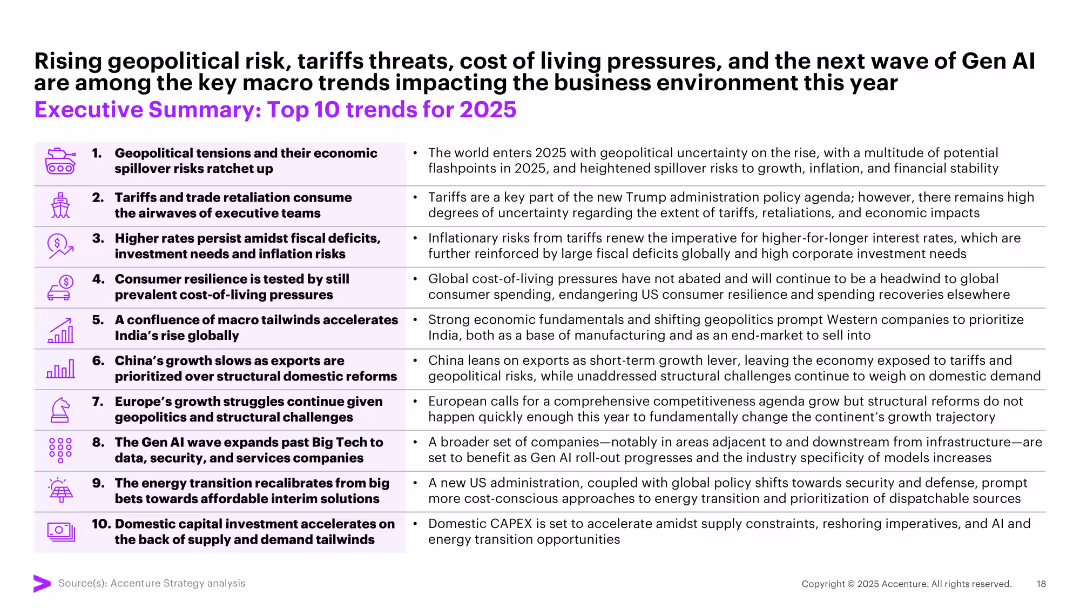
Left side has a ranked and icon-supported list of top 10 macro trends for 2025; right side offers concise explanatory bullets. Simple and highly readable layout with a lavender-accented color theme.
Market Analysis and Trends
Professional Services
This executive summary highlights the top 10 macro trends for 2025, including rising geopolitical risks, inflation, tariff battles, China and India’s diverging roles, and energy transition strategies. It provides a high-level overview of major global forces likely to impact businesses this year.
Trends 2025, Geopolitics, Inflation, Tariffs, Consumer Pressure, Gen AI, India Growth, China Export, Strategy, CAPEX
false
Market Analysis and Trends
Professional Services
Table
Accenture
Add to my slides
Remove from favorites
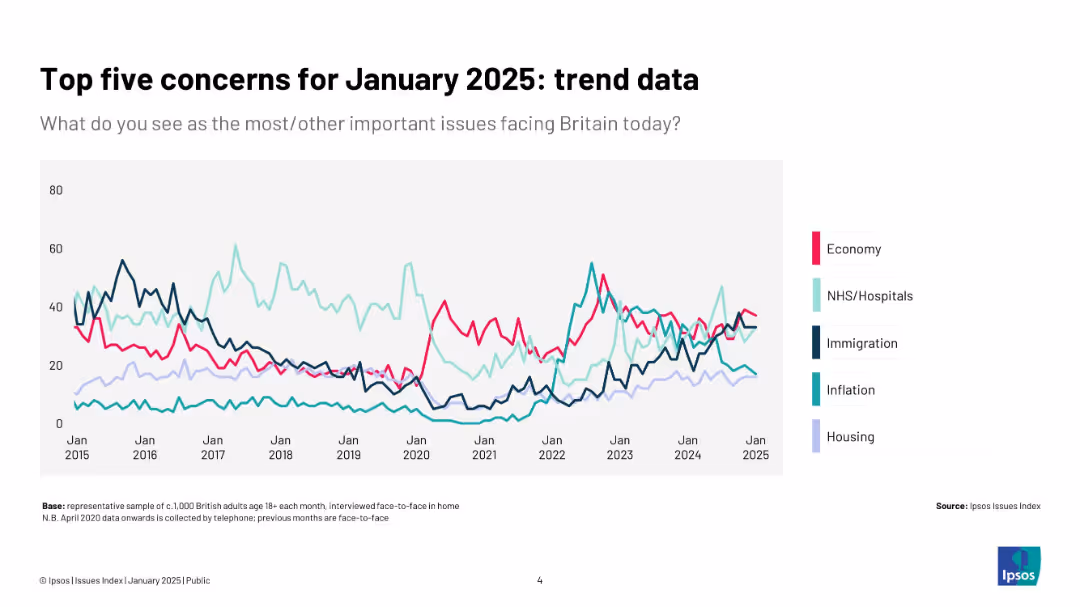
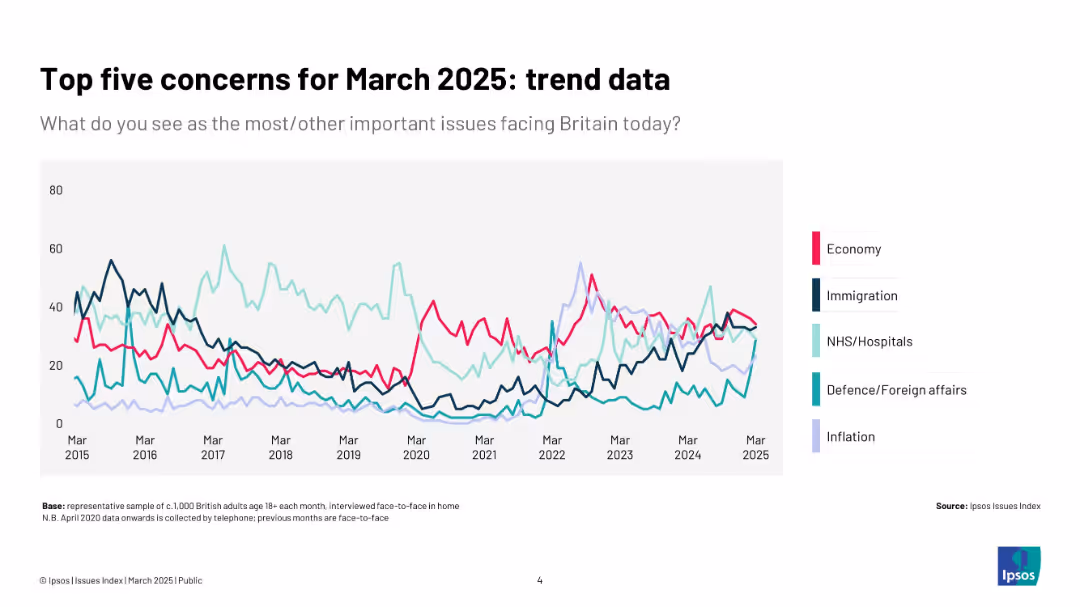
Line chart tracking five key concerns over time (2015–2025); colored lines with a legend on the right
Market Analysis and Trends
Government & Public Sector
The slide tracks trends in concern levels over a decade for economy, NHS, immigration, inflation, and housing. It shows how public concern fluctuates over time and peaks at various points.
trends, concern, Ipsos, UK, healthcare, economy, housing, inflation, immigration, public sentiment
false
Market Analysis and Trends
Government & Public Sector
Single Chart
IPSOS
Add to my slides
Remove from favorites
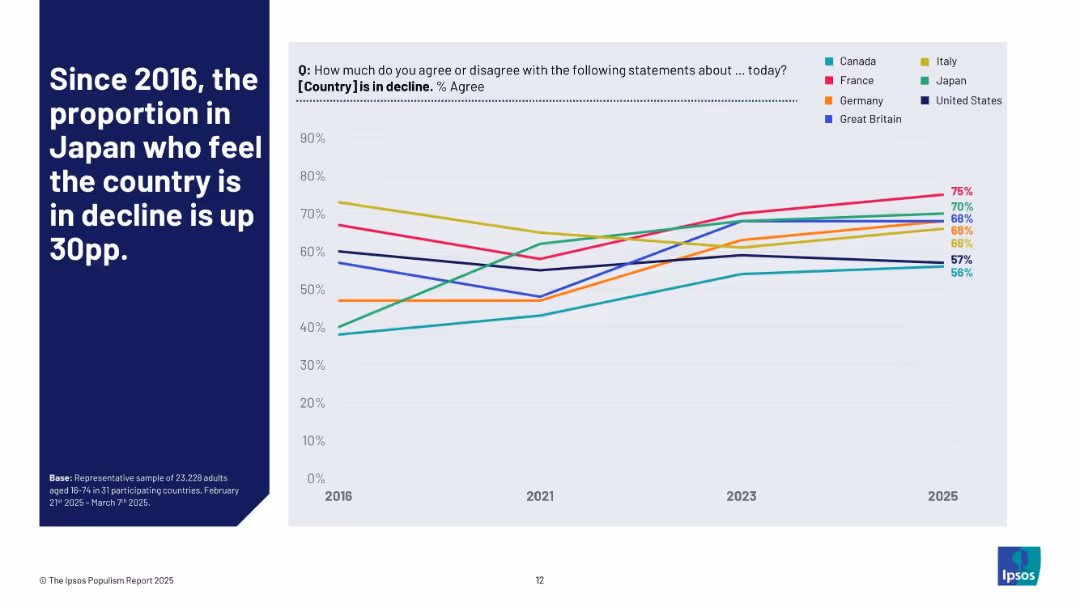
Line chart showing trends (2016–2025) in agreement with the “is in decline” statement across selected countries. Color-coded lines show country-specific sentiment shifts over time.
Market Analysis and Trends
Government & Public Sector
This chart tracks public agreement with the belief that one’s country is in decline across multiple nations. Japan shows the most dramatic increase (+30pp) since 2016, while other countries such as France, U.S., and U.K. exhibit more stable or varied trajectories.
trends, country sentiment, decline perception, Ipsos, public opinion, Japan, international comparison, long-term view
false
Market Analysis and Trends
Government & Public Sector
Mixed Chart
IPSOS
Add to my slides
Remove from favorites
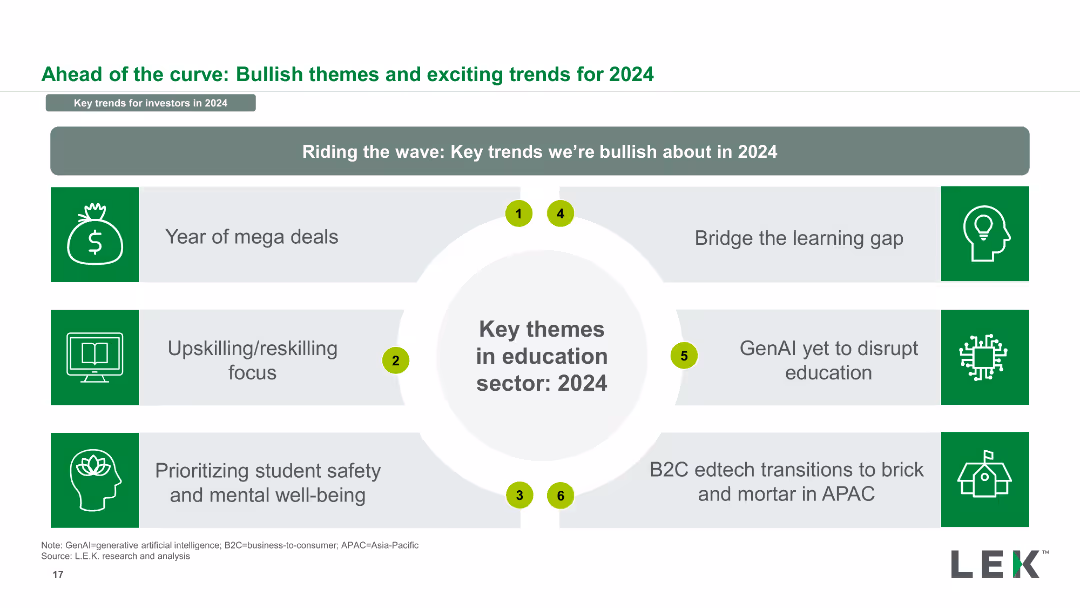
The slide features a central circle with "Key themes in education sector: 2024" surrounded by six rectangular blocks highlighting trends, with icons in each block.
Strategic Planning
Education & Training
This slide highlights key bullish trends in the education sector for 2024, including mega deals, upskilling focus, student safety, learning gap bridging, GenAI, and B2C edtech.
trends, education, 2024, key themes, bullish, mega deals, upskilling, GenAI, B2C edtech
false
Strategic Planning
Education & Training
Diagram
LEK
Add to my slides
Remove from favorites
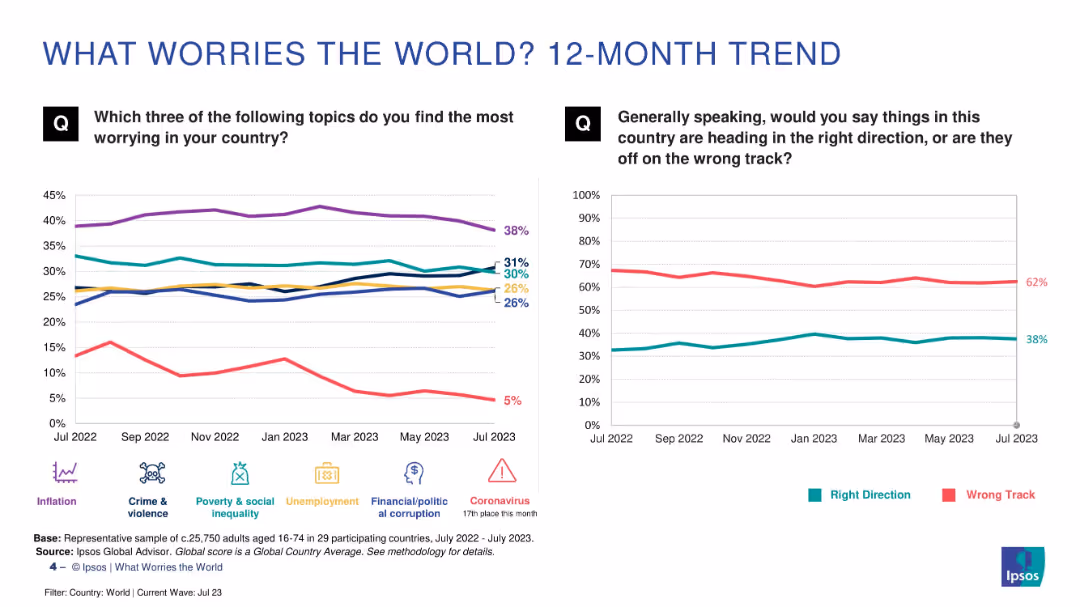
Two line charts comparing month-by-month concern levels and national sentiment trends over 12 months
Market Analysis and Trends
Professional Services
This slide tracks how public concerns and sentiment about national direction have changed over a year. Inflation shows a consistently high concern. The majority (62%) still feel their countries are on the wrong track, though the “right direction” metric has slightly improved over time.
trend, sentiment, inflation, inequality, year-over-year
false
Market Analysis and Trends
Professional Services
Multiple Chart
IPSOS
Add to my slides
Remove from favorites
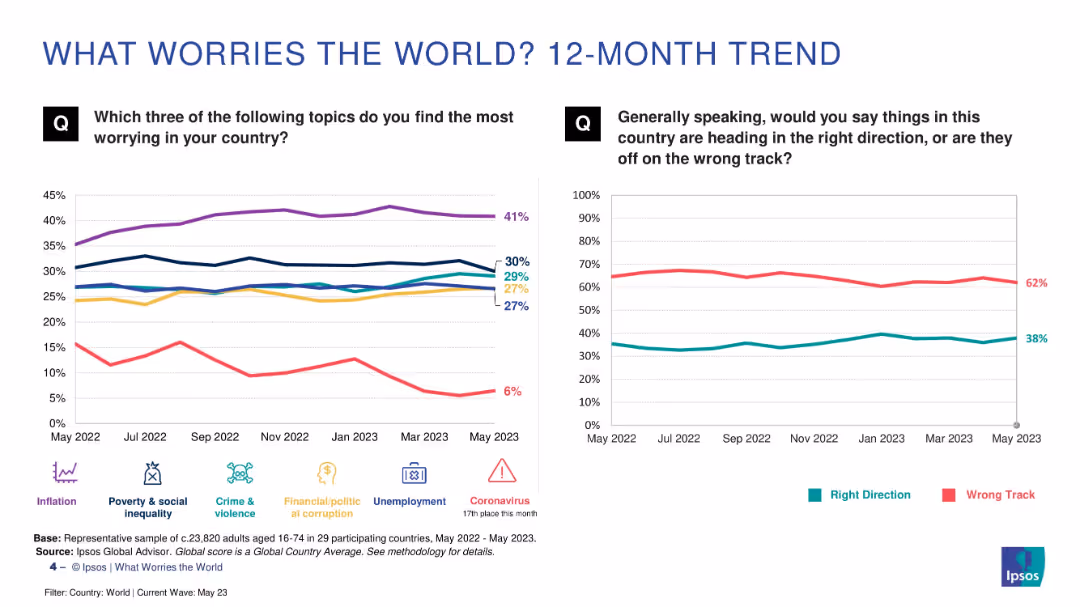
Two line charts comparing trends over time: left shows issues like inflation, crime, etc.; right shows global sentiment (right vs. wrong track). Clean, comparative layout.
Market Analysis and Trends
Professional Services
This slide tracks worry trends over 12 months, showing persistent concern over inflation and crime. The "wrong track" sentiment remains dominant, with minor fluctuations. It provides a temporal view of public priorities and dissatisfaction.
trends, inflation, global concerns, sentiment analysis, public opinion, Ipsos, 12-month trend
false
Market Analysis and Trends
Professional Services
Multiple Chart
IPSOS
Add to my slides
Remove from favorites
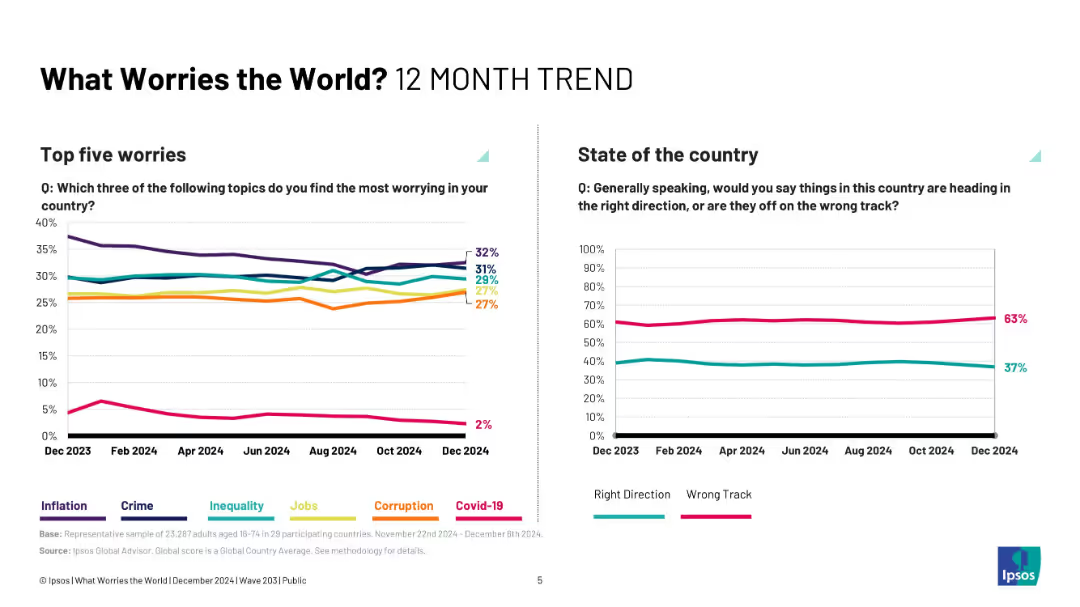
Two line charts showing trend data over time; color-coded categories; minimal labels with timeline axis.
Strategic Planning
Government & Public Sector
This slide visualizes 12-month trends in public concern for various global issues and perception of country direction. Inflation and crime remain high, while confidence in national direction remains consistently low.
trends, public worry, country direction, Ipsos, inflation, crime, inequality, time series, data visualization, perception
false
Strategic Planning
Government & Public Sector
Multiple Chart
IPSOS
Add to my slides
Remove from favorites
Line chart showing time-series data (2015–2025) for five top issues; each line color-coded by topic.
Market Analysis and Trends
Government & Public Sector
The slide tracks the changing importance of five key issues—economy, immigration, NHS, defence, and inflation—over the past decade. It visually emphasizes shifting public concern over time.
trends, top concerns, line chart, public opinion, decade, issues, Ipsos, UK
false
Market Analysis and Trends
Government & Public Sector
Single Chart
IPSOS
Add to my slides
Remove from favorites
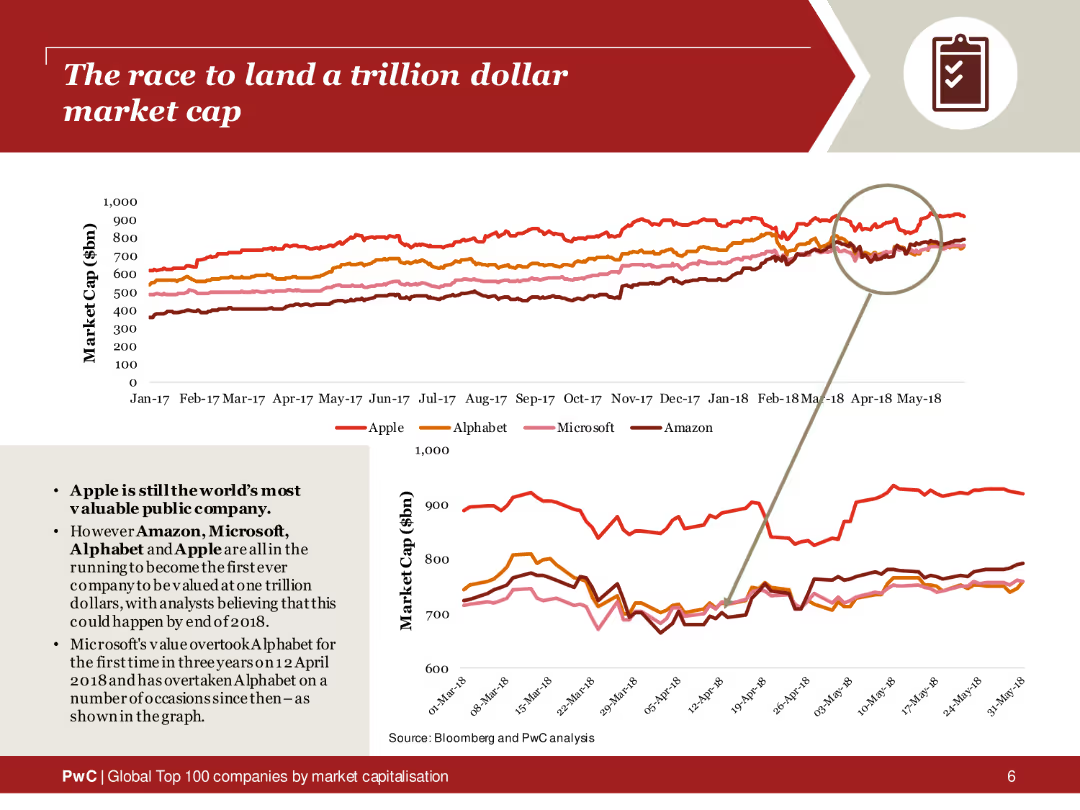
The slide features a line chart tracking the market caps of Apple, Alphabet, Microsoft, and Amazon from 2017 to 2018. The lines are color-coded for each company, with a magnified section highlighting recent trends. The layout includes a brief text summary on the left, explaining the race to a trillion-dollar valuation.
Market Analysis and Trends
Financial Services
This slide analyzes the market cap trends of major tech companies competing to reach a trillion-dollar valuation. The line chart provides a visual comparison of Apple, Alphabet, Microsoft, and Amazon over time, highlighting the competitive landscape and significant milestones in their market cap growth.
Trillion-dollar market cap, tech companies, market trends, Apple, Alphabet, Microsoft, Amazon, line chart
false
Market Analysis and Trends
Financial Services
Multiple Chart
PwC/Strategy&
Add to my slides
Remove from favorites
This slide features a line chart showing the TRREB average price forecast from 1988 to 2021 (F). The line is blue, indicating a projected rise in average prices.
Market Analysis and Trends
Real Estate & Construction
The slide forecasts the average price trend for TRREB MLS® system, providing insights into future pricing dynamics based on historical data trends.
TRREB, average price, price forecast, line chart, pricing trends
false
Market Analysis and Trends
Real Estate & Construction
Single Chart
IPSOS
Add to my slides
Remove from favorites
This slide features a line chart showing TRREB sales and new listings forecast from 1988 to 2021 (F). Sales are in blue, and new listings are in gray, with future forecasts marked.
Market Analysis and Trends
Real Estate & Construction
The slide forecasts TRREB MLS® system sales and new listings, providing insights into future market conditions and trends based on historical data.
TRREB, MLS, sales forecast, new listings, market outlook
false
Market Analysis and Trends
Real Estate & Construction
Single Chart
IPSOS
Add to my slides
Remove from favorites
This slide presents a column chart showing the number of truck drivers and road freight demand over several years. Bullet points provide insights into driver shortages and their impacts on costs.
Operational Efficiency
Industrial & Manufacturing
The slide highlights the shortage of heavy vehicle drivers in the cement industry and its impact on labor costs, particularly in metropolitan areas, with projected trends and reasons for the shortage.
truck drivers, cement industry, labor cost, shortage, metropolitan areas
false
Operational Efficiency
Industrial & Manufacturing
Mixed Chart
LEK
Add to my slides
Remove from favorites
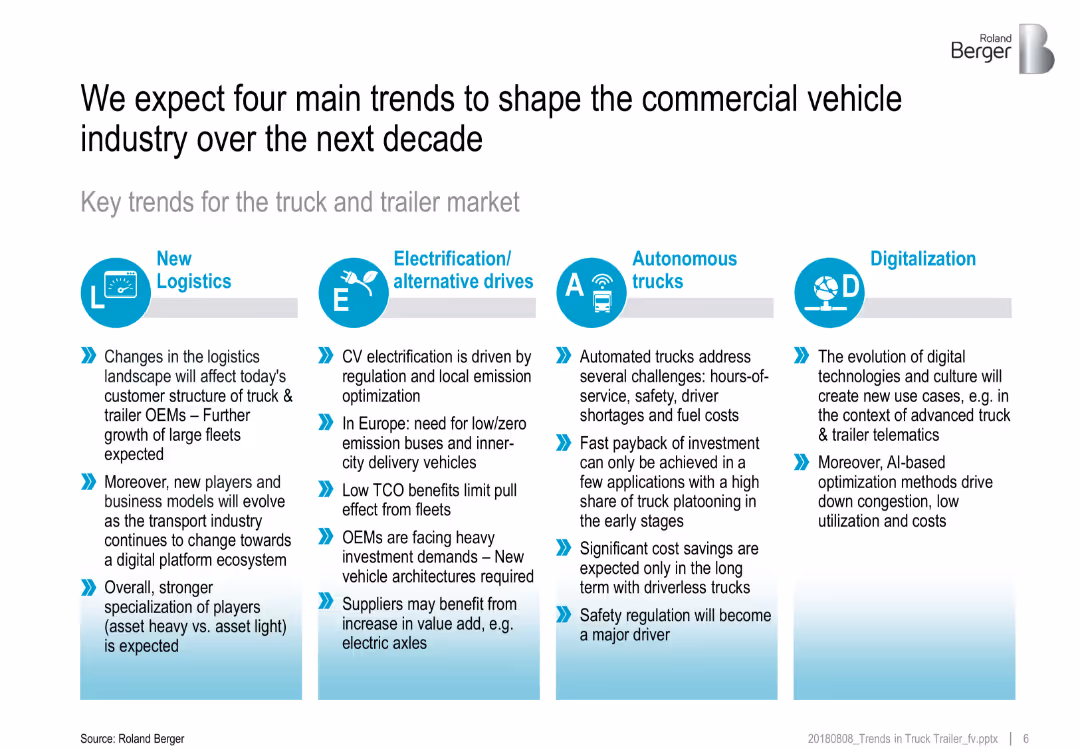
Four-column layout, each trend in a box with icon and bullets below; visually segmented with light blue gradients
Strategic Planning
Transportation & Logistics
This slide identifies four transformative trends in the truck/trailer industry: New Logistics, Electrification, Autonomous Trucks, and Digitalization. Each trend is explained with its drivers and implications, indicating industry-wide shifts toward smarter and more sustainable operations.
truck market, logistics, electrification, autonomous trucks, digitalization, industry trends, future of transport
false
Strategic Planning
Transportation & Logistics
Pillar
Roland Berger
Add to my slides
Remove from favorites
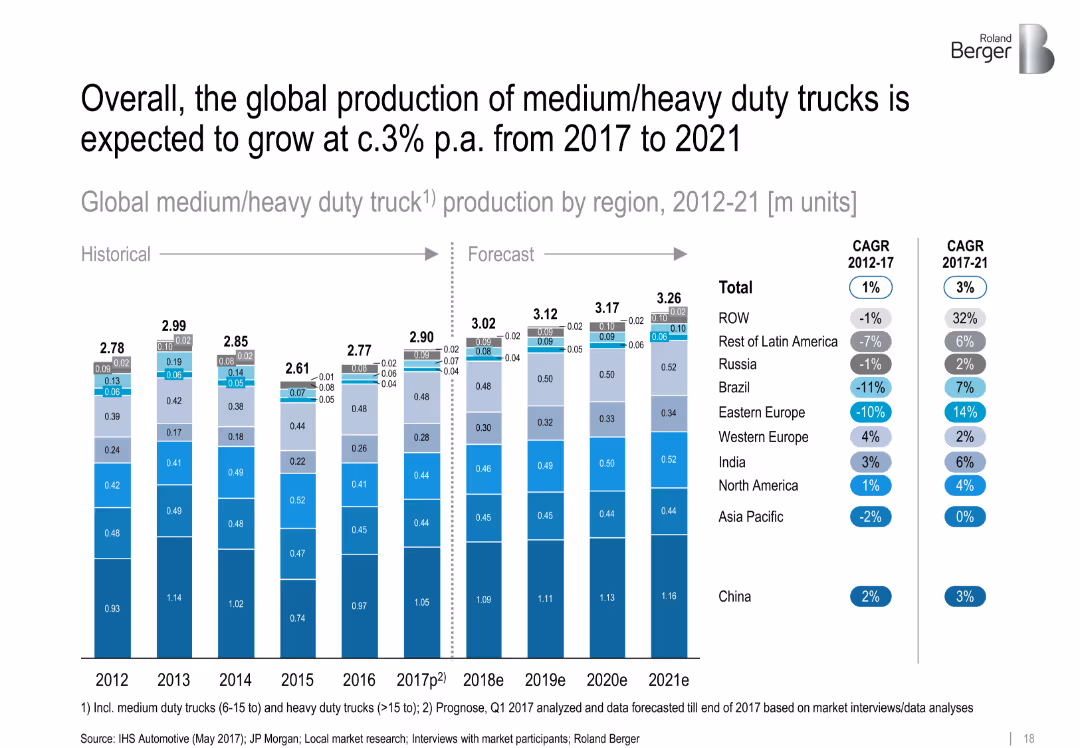
Stacked bar chart comparing truck production by region (2012–2021) with CAGR data. Segments color-coded and neatly aligned.
Financial Performance
Transportation & Logistics
This slide presents the volume and forecast of global medium/heavy duty truck production. Regional breakdowns show China as the leader, while emerging markets see modest growth. Includes CAGR data for historic and forecast periods.
['truck production', 'heavy duty', 'regional growth', 'CAGR', 'China', 'forecast', 'manufacturing', 'automotive']
false
Financial Performance
Transportation & Logistics
Single Chart
Roland Berger
Add to my slides
Remove from favorites
The slide features a column chart forecasting trucks energy consumption by fuel type (oil, electricity, biofuels) from 2018 to 2040 under a stated scenario. It also includes a detailed analysis of the industry environment and bioenergy economic competitiveness.
Market Analysis and Trends
Transportation & Logistics
This slide projects energy consumption in the trucks industry, highlighting the significant potential for biofuels to meet the demand, and analyzing the economic competitiveness and industry environment.
trucks industry, energy consumption, fuel type, biofuels, 2018-2040, economic competitiveness, industry environment
false
Market Analysis and Trends
Transportation & Logistics
Mixed Chart
Kearney
Add to my slides
Remove from favorites
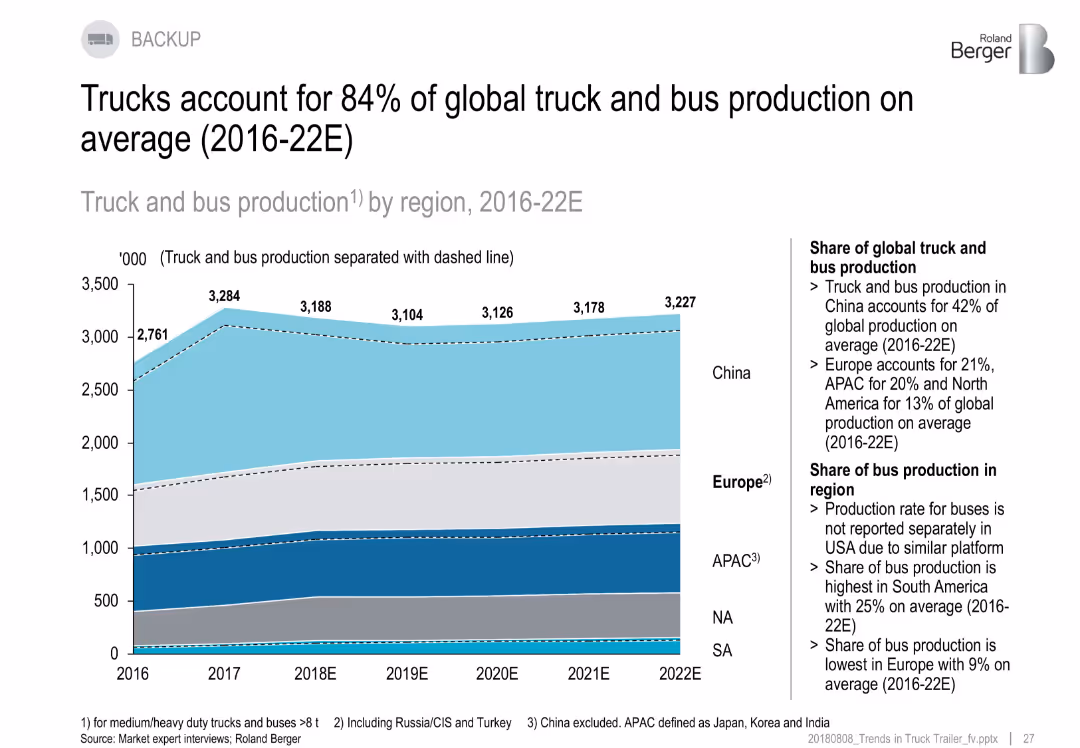
Area chart with shaded regional production segments, notes on right side providing key insights.
Market Analysis and Trends
Industrial & Manufacturing
Trucks dominate global commercial vehicle production, making up 84% on average from 2016–2022. China leads global share (42%), followed by Europe and APAC. Bus production varies significantly by region, being lowest in Europe and highest in South America.
trucks vs buses, regional share, production average, 2016–2022, China, APAC, Europe
false
Market Analysis and Trends
Industrial & Manufacturing
Mixed Chart
Roland Berger
Add to my slides
Remove from favorites
This slide presents a global market analysis for the truck tire segment, using a world map with associated color-coded bar charts and annotations. The charts differentiate between OE and RT market changes, with strategic regional comparisons. Branding is consistent with the Michelin logo placement, and the design is simple, focusing the viewer on the data.
Market Analysis and Trends
Transportation & Logistics
This slide analyzes the global truck tire market, excluding China, with a focus on OE and RT segments. It aims to provide market intelligence and inform strategic decisions in logistics and supply chain planning, suitable for industry analysis briefings or business strategy discussions.
truck tire, market, analysis, OE, RT, global, Michelin, trends, logistics, strategy
false
Market Analysis and Trends
Transportation & Logistics
Mixed Chart
Morgan Stanley
Add to my slides
Remove from favorites
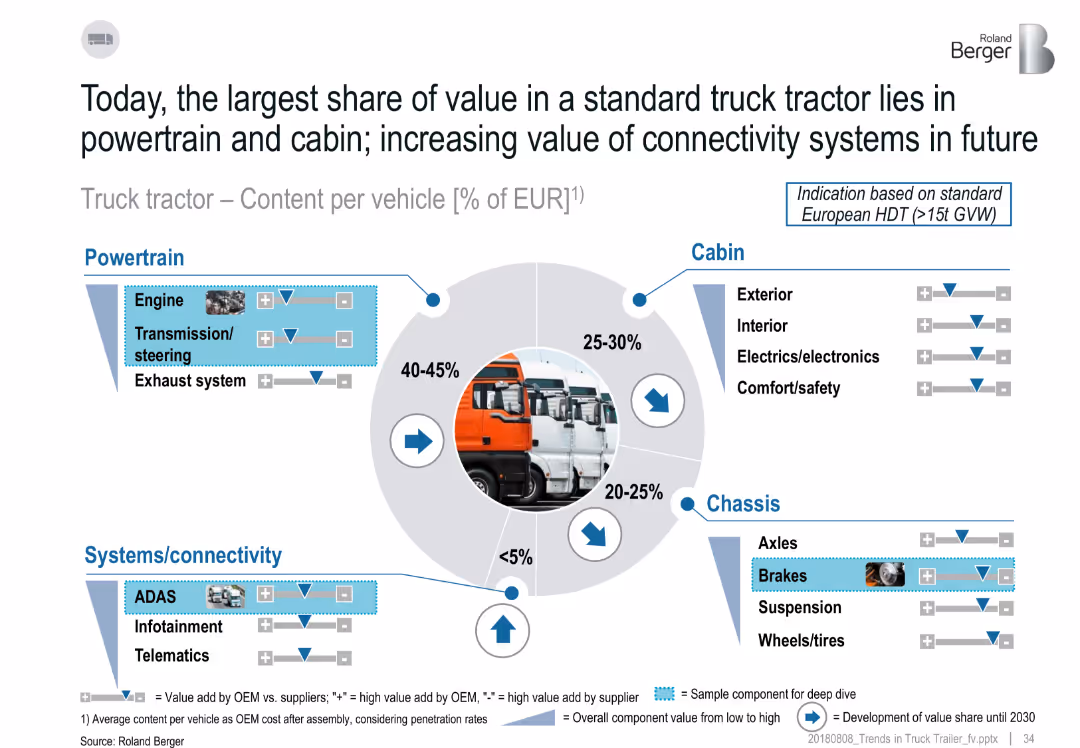
Circular pie chart showing value distribution by truck tractor component (EUR%), with callouts for powertrain, cabin, chassis, systems/connectivity
Product and Service Analysis
Industrial & Manufacturing
The slide illustrates how value in a truck tractor is distributed across components. Powertrain holds the largest share (40–45%), followed by the cabin and chassis. Connectivity systems hold minimal value currently but are expected to grow. Value-add is analyzed by OEM vs. supplier, with trend indicators until 2030.
truck tractor, component value, powertrain, cabin, chassis, connectivity, OEM, supplier
false
Product and Service Analysis
Industrial & Manufacturing
Single Chart
Roland Berger
Add to my slides
Remove from favorites
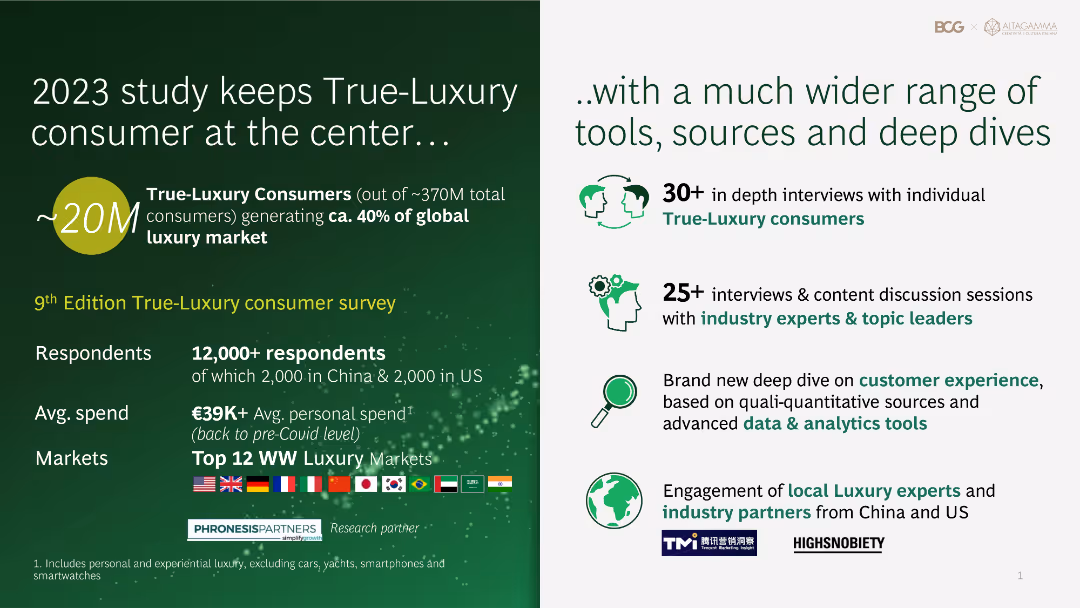
Informational layout with text and icons summarizing the key findings and methodologies of a 2023 study on true-luxury consumers.
Market Analysis and Trends
Media & Entertainment
Provides an overview of a 2023 study on true-luxury consumers, detailing the respondent demographics, average spending, and key methodologies used in the research.
true-luxury, consumer study, 2023, demographics, spending
false
Market Analysis and Trends
Media & Entertainment
Boxed
BCG
Add to my slides
Remove from favorites
Includes checklists comparing Truist Securities to other bank types and a column chart showing investment banking income over time. The design is professional with a clear comparison layout.
Mergers and Acquisitions
Financial Services
Highlights the competitive strengths of Truist Securities, particularly useful for illustrating market position, growth potential, or in discussions of mergers and acquisitions.
Truist Securities, competitive advantage, investment banking, growth
false
Mergers and Acquisitions
Financial Services
Mixed Chart
Goldman Sachs
Add to my slides
Remove from favorites
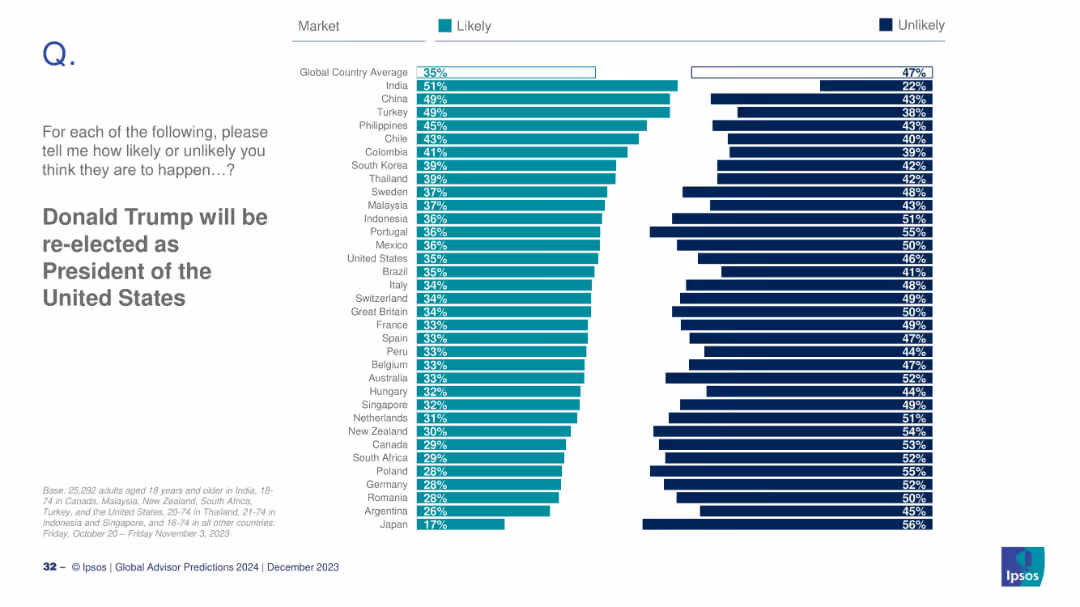
Horizontal bar chart showing likelihood by country; sorted descending by perceived likelihood.
Market Analysis and Trends
Government & Public Sector
This slide displays global public opinion on whether Donald Trump will be re-elected as U.S. President. India and China show the highest expectations. The U.S. perception (35%) is equal to the global average. The layout visualizes "likely" vs. "unlikely" opinion across countries.
Trump, election, politics, U.S. presidency, international opinion, 2024 prediction, Ipsos
false
Market Analysis and Trends
Government & Public Sector
Mixed Chart
IPSOS
Add to my slides
Remove from favorites
Contains a pie chart, using contrasting colors (green, purple, black) to highlight differences in perceptions between frontline employees and leaders.
Human Resources and Talent Management
Technology & Software
Highlights the variance in trust levels regarding responsible AI use between frontline employees and organizational leaders.
trust, AI, perception, employees, leaders
false
Human Resources and Talent Management
Technology & Software
Multiple Chart
BCG
Add to my slides
Remove from favorites
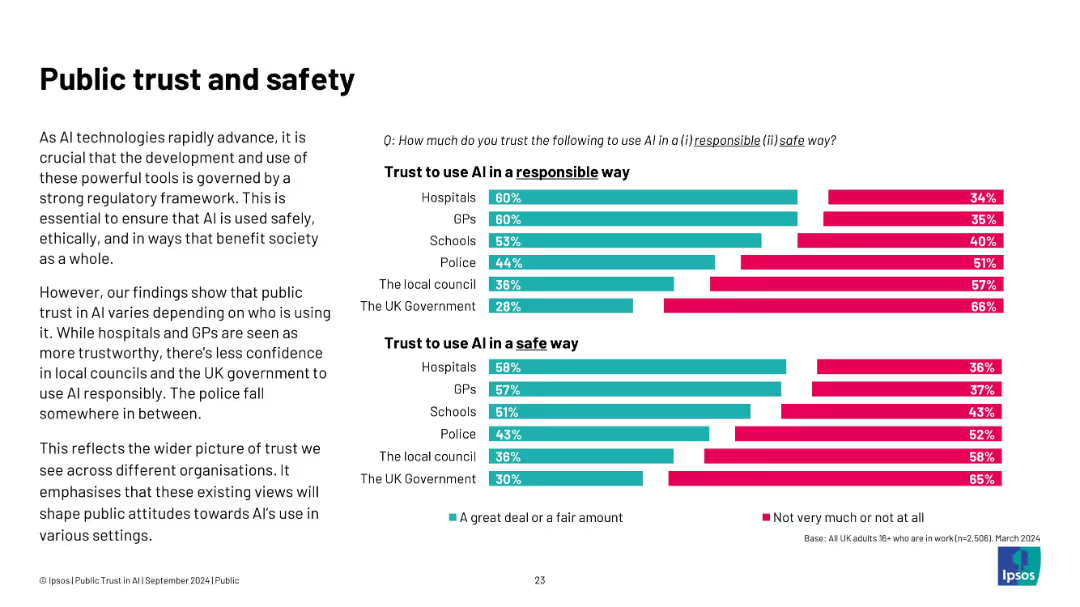
Two sets of horizontal bar charts on the right, comparing “Trust to use AI responsibly” and “Trust to use AI safely” across public institutions. Left-aligned explanatory text.
Risk Assessment and Management
Artificial Intelligence
This slide explores varying public trust levels in institutions using AI. Hospitals and GPs are trusted the most, while the UK Government and local councils rank lowest. Trust levels are split between “a great deal/fair amount” and “not very much/not at all,” indicating skepticism about responsible and safe AI use. This illustrates the role of institutional reputation in AI governance.
trust, AI safety, responsible use, healthcare, government, public perception, ethics, regulation, UK institutions
false
Risk Assessment and Management
Artificial Intelligence
Mixed Chart
IPSOS
Add to my slides
Remove from favorites
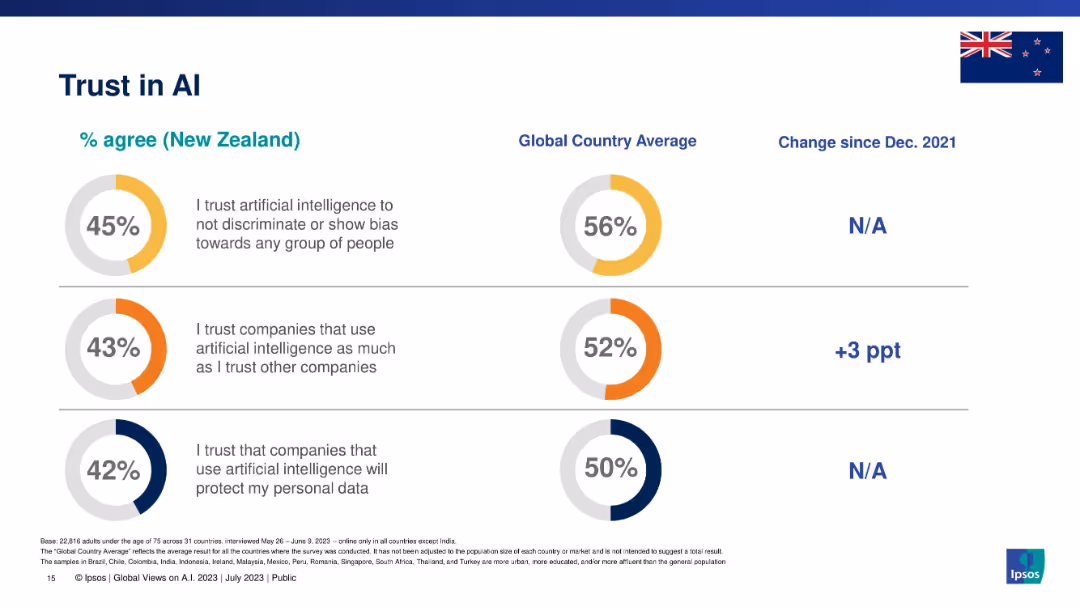
Three circular graphs (donuts) showing New Zealand trust levels compared to global averages.
Risk Assessment and Management
Artificial Intelligence
This slide outlines New Zealanders’ trust in AI regarding bias, corporate integrity, and personal data protection, compared to global averages, with a noted trust gap.
trust, bias, AI companies, data protection, New Zealand, Ipsos, global comparison, ethical AI
false
Risk Assessment and Management
Artificial Intelligence
Single Chart
IPSOS
Add to my slides
Remove from favorites
The slide displays a bar graph depicting levels of agreement among leaders on trust-building within organizations. The graph uses varying shades of orange to represent different degrees of agreement, complemented by a minimalistic design for clear communication.
Organizational Structure and Change
Professional Services
This slide explores leadership perspectives on building trust within organizations, emphasizing the need for intentional actions to foster trust and alignment between workers and supervisors. It is useful for discussions on organizational culture and leadership strategies.
Trust Building, Leadership, Organizational Culture, Bar Graph
false
Organizational Structure and Change
Professional Services
Mixed Chart
PwC/Strategy&
Add to my slides
Remove from favorites
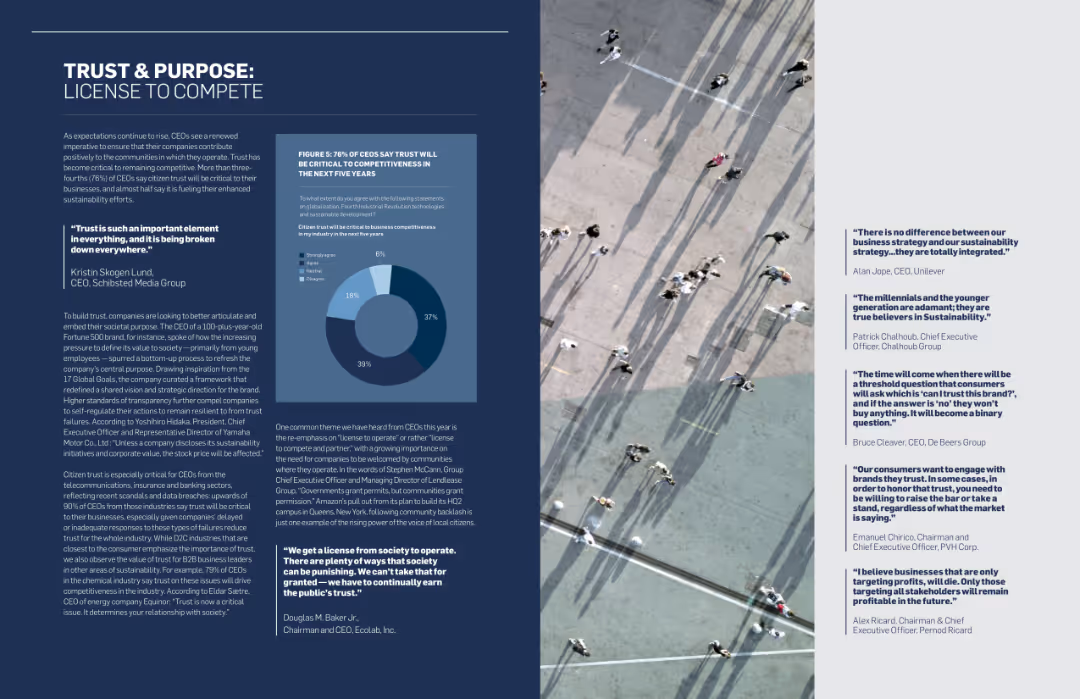
The slide features a combination of text and a column chart. The background shows an aerial view of people walking on a large surface. Quotes from various CEOs are highlighted on the right side.
Strategic Planning
Professional Services
The slide discusses the importance of trust for CEOs, emphasizing how it impacts their business competitiveness and sustainability strategies. It includes quotes from CEOs and a column chart showing survey data.
Trust, CEOs, Competitiveness, Sustainability, Business Strategy, Survey Data, Professional Services, Strategic Planning
false
Strategic Planning
Professional Services
Mixed Chart
Accenture
Add to my slides
Remove from favorites
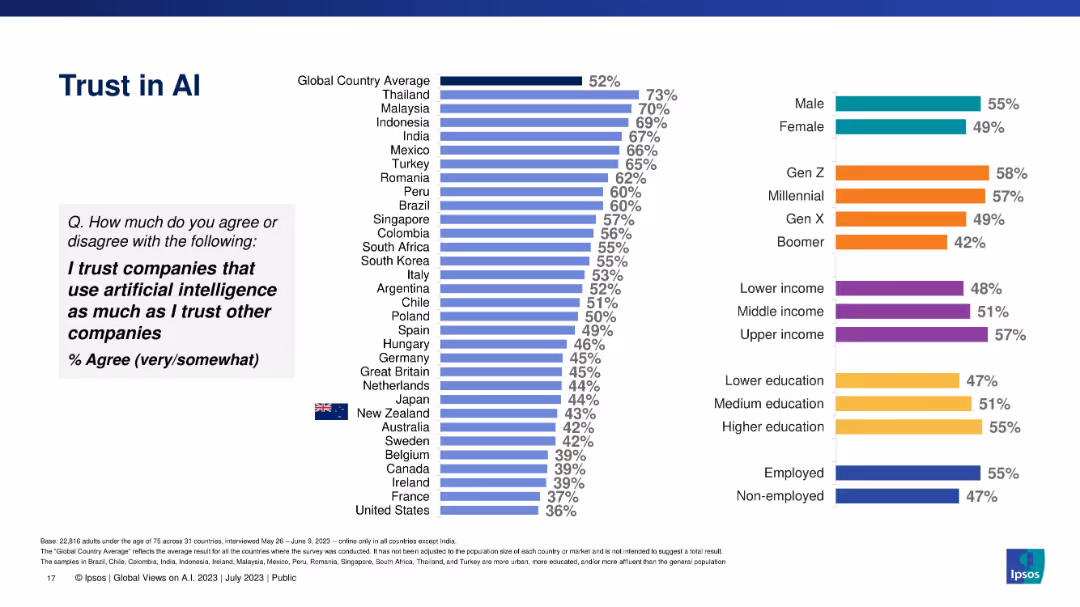
Vertical bar chart displaying trust in AI-using companies vs. other companies, segmented globally.
Risk Assessment and Management
Artificial Intelligence
Explores whether people trust AI-using companies as much as traditional companies, showing global and demographic variations, with Thailand leading and U.S. trailing.
trust, corporate AI, consumer confidence, demographic variation, Ipsos, ethical business
false
Risk Assessment and Management
Artificial Intelligence
Multiple Chart
IPSOS
Add to my slides
Remove from favorites
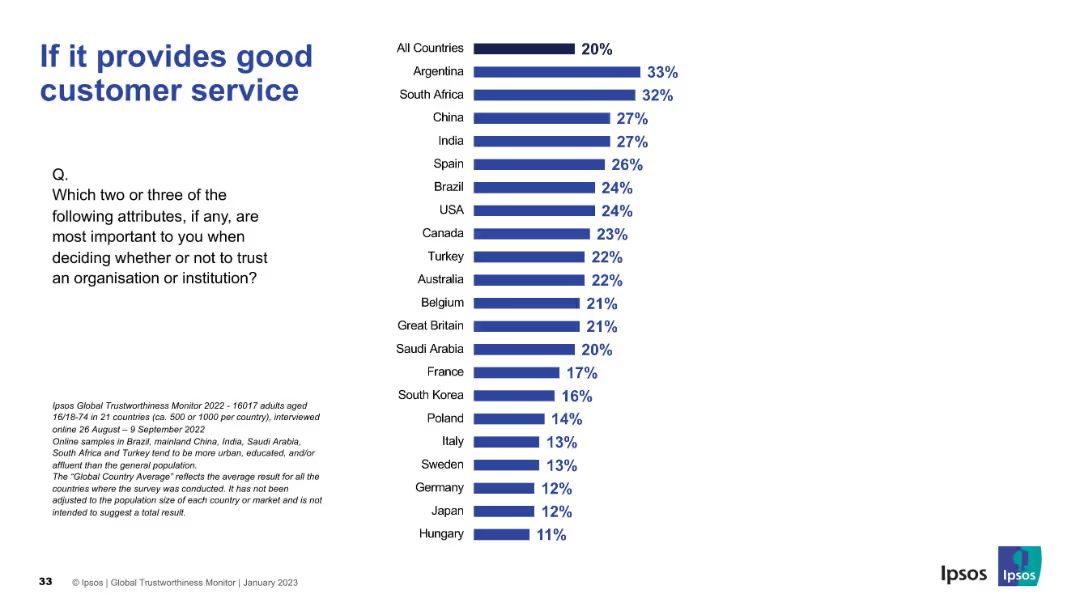
Similar layout to Slide 19191; bar chart on the right, with country rankings in blue
Customer and Market Segmentation
Professional Services
The slide ranks countries by the importance they place on customer service as a factor in trusting organizations. Argentina and South Africa top the list.
trust, customer service, global, Ipsos, satisfaction, ranking, trust factors, support, perception, organizations
false
Customer and Market Segmentation
Professional Services
Mixed Chart
IPSOS
Add to my slides
Remove from favorites
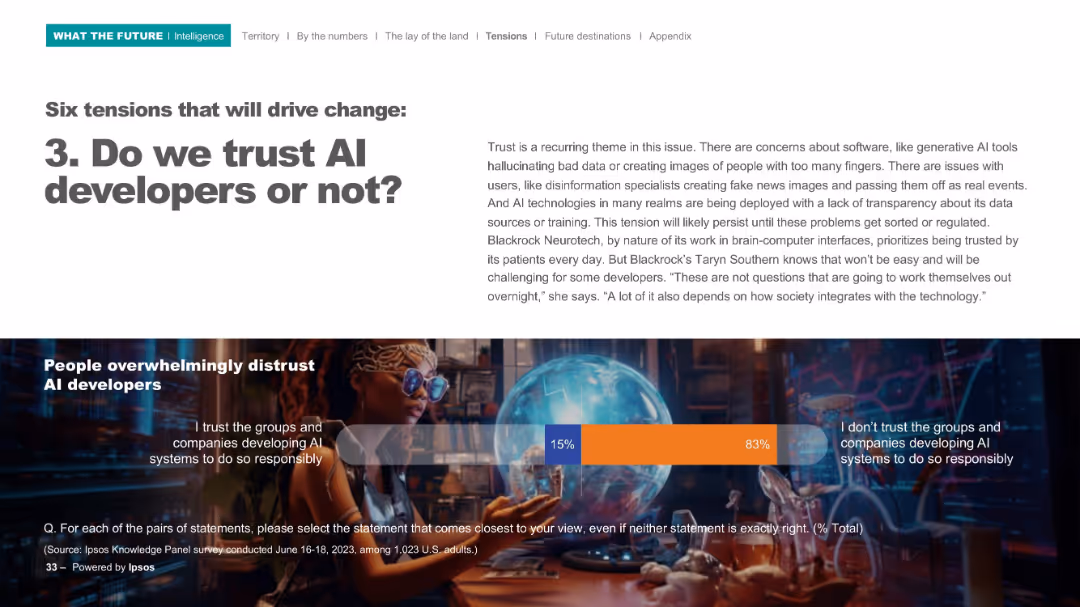
Upper portion includes title and commentary; lower section shows a bar chart indicating trust levels, against a sci-fi visual background.
Risk Assessment and Management
Artificial Intelligence
This slide emphasizes the distrust in AI developers. The majority of people surveyed do not trust companies to develop AI responsibly, reflecting transparency concerns and ethical challenges in AI deployment.
trust, developers, ethics, AI systems, survey
false
Risk Assessment and Management
Artificial Intelligence
Mixed Chart
IPSOS
Add to my slides
Remove from favorites
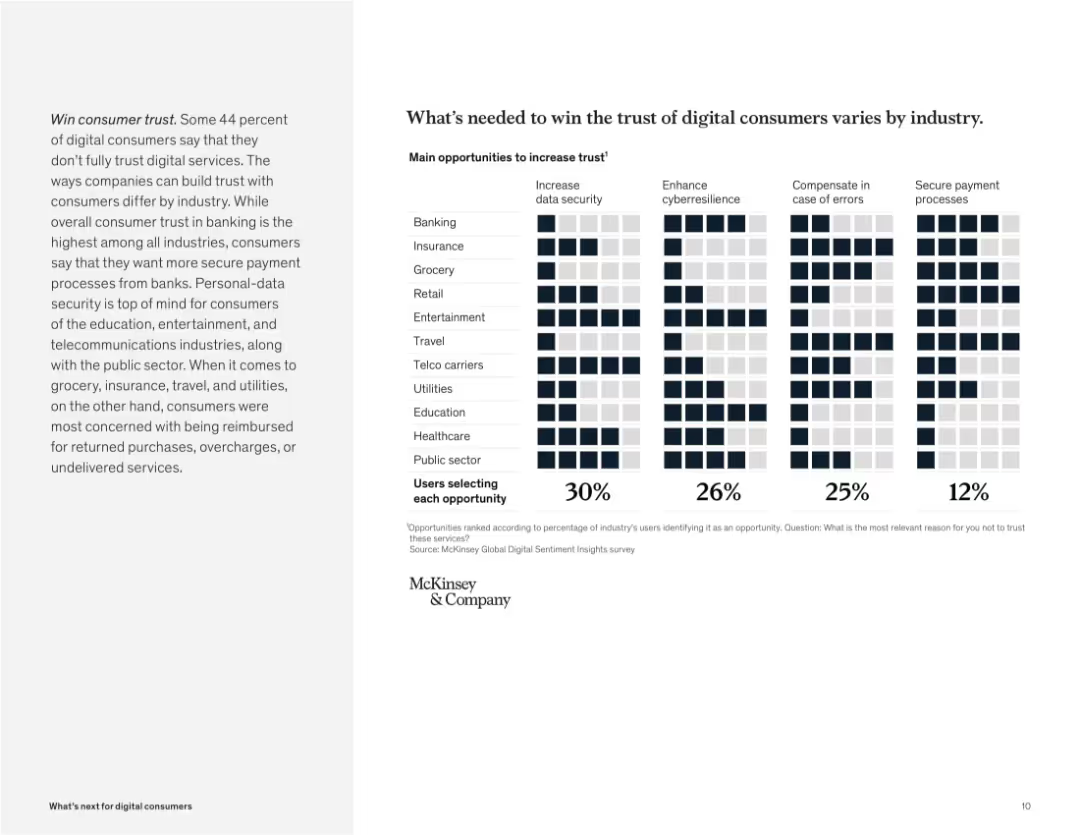
Grid chart with industries on the y-axis and trust factors on the x-axis. Icons filled based on user selections.
Human Resources and Talent Management
Technology & Software
The slide shows factors needed to increase trust in digital services, such as data security, error compensation, and secure payments. Each industry shows a different priority, emphasizing tailored approaches to building user trust.
trust, digital consumers, security, cybersecurity, industry variation, compensation, payment, McKinsey survey
false
Human Resources and Talent Management
Technology & Software
Mixed Chart
McKinsey
Add to my slides
Remove from favorites
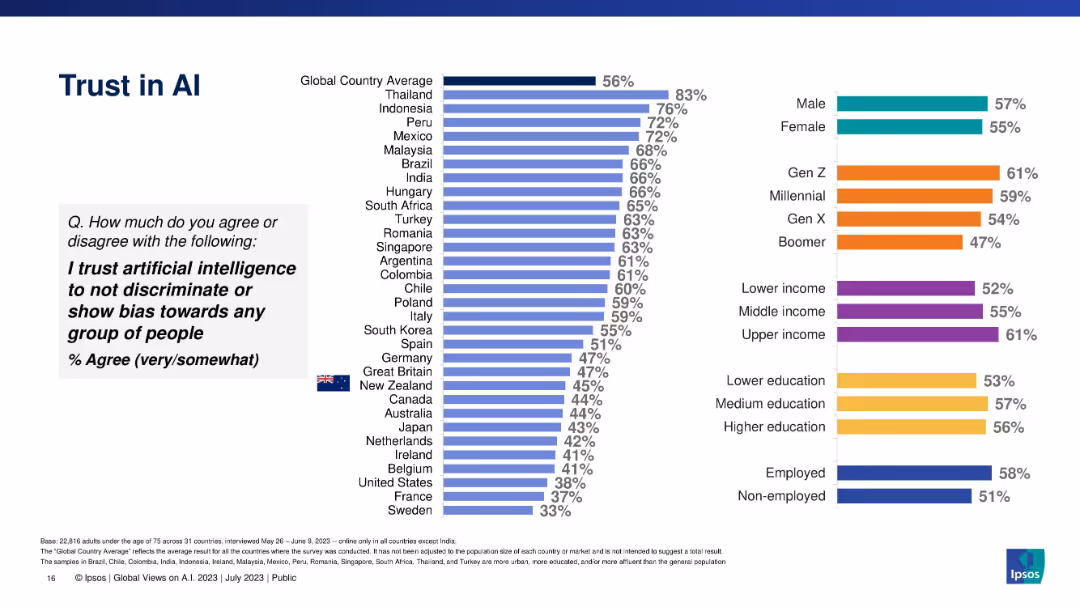
Bar chart comparing country and demographic trust levels in AI being unbiased.
Risk Assessment and Management
Artificial Intelligence
Shows percentage of respondents who trust AI not to discriminate. Data segmented by countries and demographics with a global average baseline.
trust, discrimination, bias, AI ethics, global survey, demographic trust, Ipsos
false
Risk Assessment and Management
Artificial Intelligence
Multiple Chart
IPSOS
Add to my slides
Remove from favorites
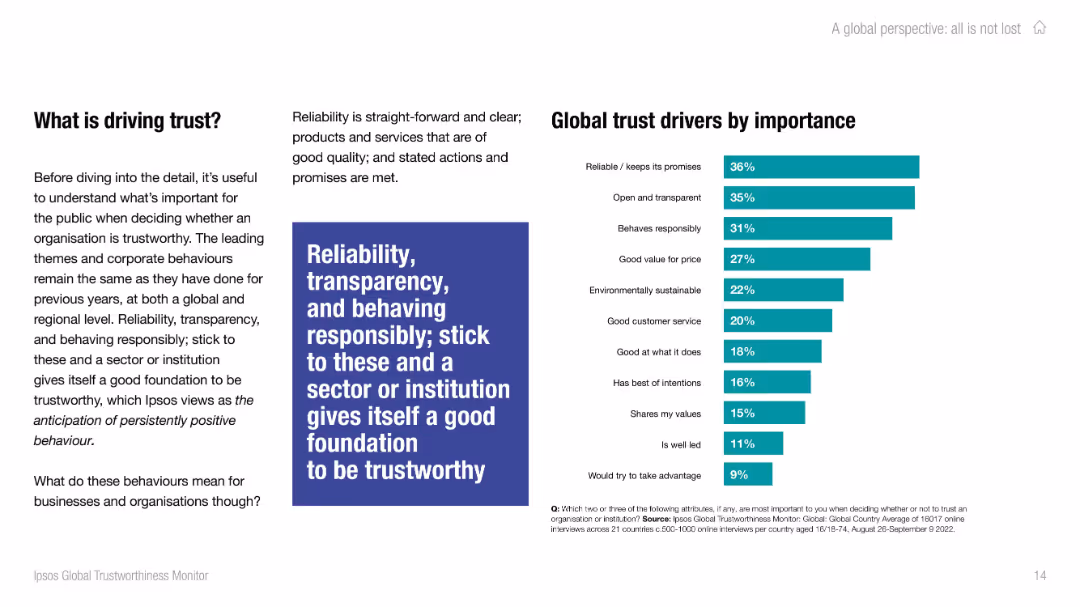
Split layout: left column with explanatory text; right column shows a bar chart ranking trust drivers. A large quote box emphasizes reliability.
Strategic Planning
Professional Services
The slide discusses key attributes that drive trust in organizations, with reliability, transparency, and responsibility as top contributors. A bar chart quantifies the importance of each attribute according to public opinion. It emphasizes actionable principles to build institutional trust.
trust drivers, public opinion, reliability, transparency, organizational behavior, trust foundation, trust strategy
false
Strategic Planning
Professional Services
Mixed Chart
IPSOS
Add to my slides
Remove from favorites
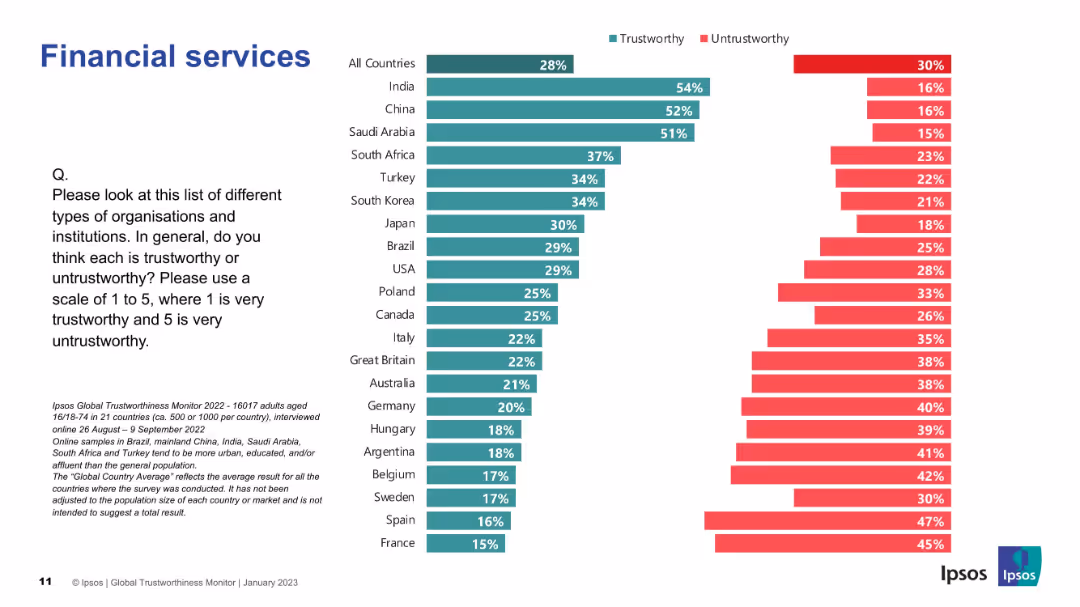
Bar chart with two-color bars (green for trustworthy, red for untrustworthy); countries ranked vertically; title on top left.
Market Analysis and Trends
Financial Services
The slide shows the perceived trustworthiness of financial services across 21 countries, with India, China, and Saudi Arabia ranking highest in trust.
trust, financial services, perception, Ipsos, global, trustworthiness, survey, countries, data, chart
false
Market Analysis and Trends
Financial Services
Mixed Chart
IPSOS
Add to my slides
Remove from favorites
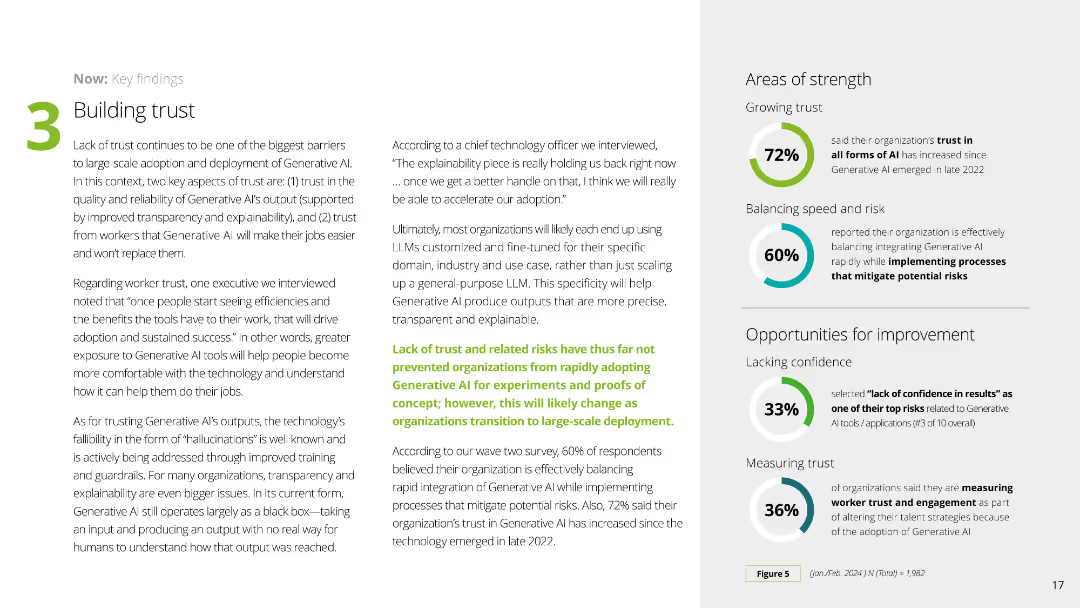
This slide contains a mix of text and percentage graphics to discuss the importance of building trust in Generative AI. The layout is structured with clear sections and supportive color elements for visual appeal.
Technology and Digital Transformation
Technology & Software
It addresses the barriers to Generative AI adoption related to trust, emphasizing the need for transparency, explainability, and worker trust, along with key statistics on organizational trust levels and risk management.
trust, Generative AI, adoption, barriers, transparency
false
Technology and Digital Transformation
Technology & Software
Multiple Chart
Deloitte
Add to my slides
Remove from favorites
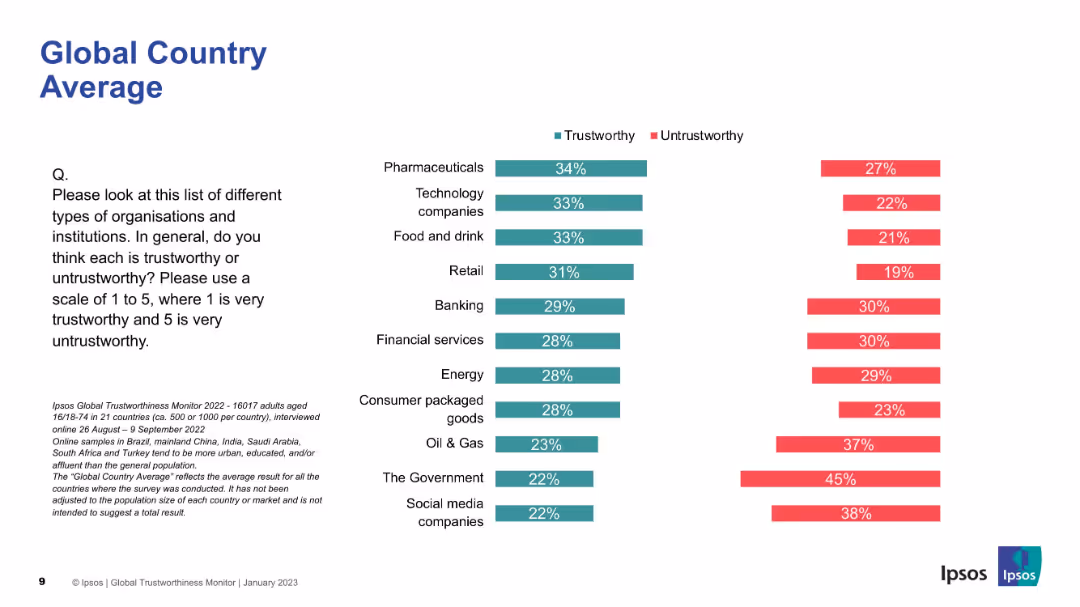
Split vertical bar chart comparing “Trustworthy” vs “Untrustworthy” across sectors; layout is clean and minimal.
Industry Overview
Healthcare & Pharmaceuticals
This slide offers a global average view of trust and distrust in various sectors. Pharmaceuticals top the list for trust, followed by tech and food. Government and social media are the least trusted sectors globally.
trust, global average, pharmaceuticals, sectors, Ipsos, public opinion, untrustworthy, tech, industry comparison
false
Industry Overview
Healthcare & Pharmaceuticals
Mixed Chart
IPSOS
Add to my slides
Remove from favorites
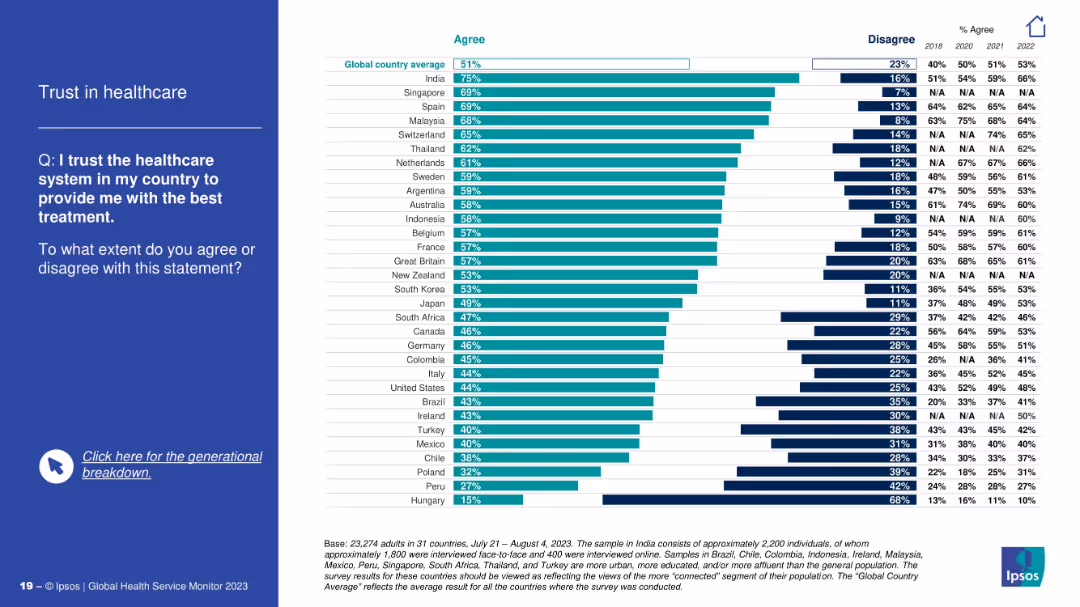
Left question panel; right bar chart showing agreement with the statement about trusting healthcare systems.
Strategic Planning
Healthcare & Pharmaceuticals
This slide shows how much citizens trust their country's healthcare system to provide the best treatment. India, Singapore, and Spain have high trust, while Hungary and Peru report low trust levels. Trends over recent years are also shown.
trust, healthcare systems, confidence, patient opinion, Ipsos, survey, treatment quality, global comparison
false
Strategic Planning
Healthcare & Pharmaceuticals
Mixed Chart
IPSOS
Add to my slides
Remove from favorites
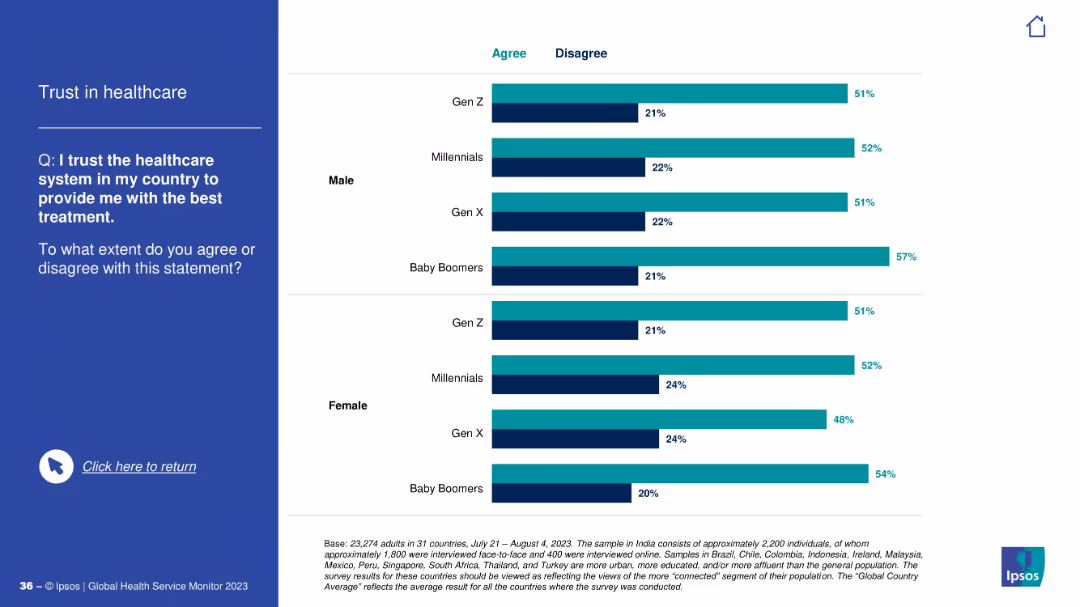
Same visual layout as previous: question and text on left, horizontal bar chart on right categorized by gender and generation.
Risk Assessment and Management
Healthcare & Pharmaceuticals
This slide explores trust in the healthcare system to provide the best treatment, comparing agreement and disagreement percentages across gender and generations. Baby Boomers show highest trust levels overall.
trust, healthcare, treatment, survey, gender, generations, perceptions, Ipsos, agreement, confidence
false
Risk Assessment and Management
Healthcare & Pharmaceuticals
Mixed Chart
IPSOS
Add to my slides
Remove from favorites
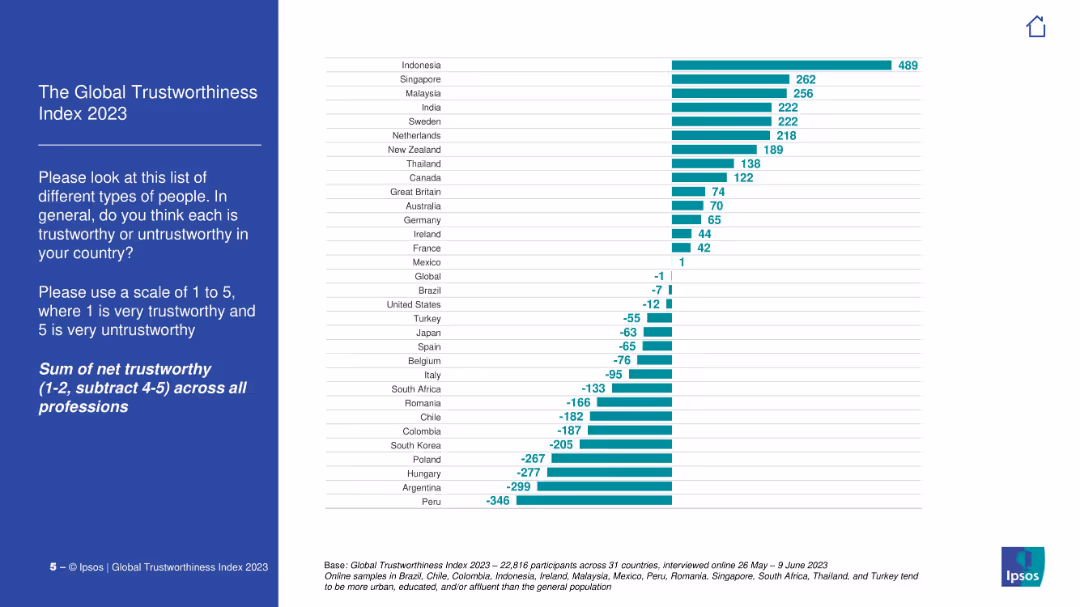
Vertical bar chart showing net trust score by country, with countries sorted from highest to lowest. Includes a brief instruction on how trustworthiness was scored.
Market Analysis and Trends
Professional Services
The slide shows global variation in public trust levels across countries, derived from average net trust ratings of professions. Indonesia tops the list, while Peru ranks lowest. The slide reflects cultural and regional differences in institutional trust.
trust index, global perception, professions, Ipsos, survey data, public trust, credibility, international comparison
false
Market Analysis and Trends
Professional Services
Mixed Chart
IPSOS
Add to my slides
Remove from favorites
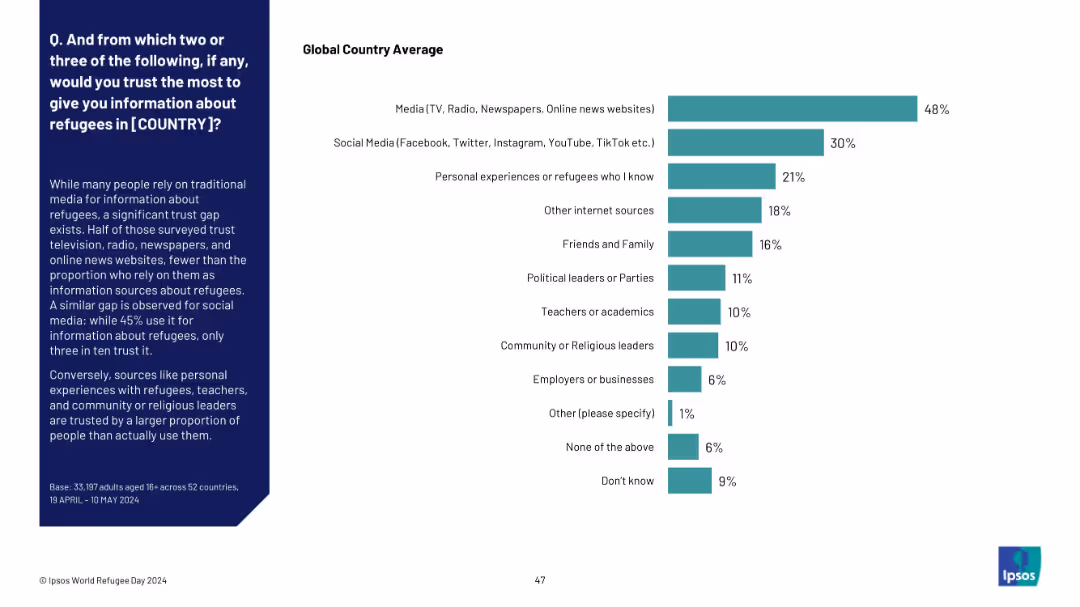
Horizontal bar chart ranking most trusted sources for refugee-related information, showing a trust gap between usage and credibility. Sidebar summarizes key findings.
Market Analysis and Trends
Media & Entertainment
This slide highlights a trust gap in refugee information sources. While media and social platforms are widely used, fewer people trust them. Personal experiences and educators are more trusted than used, showing a contrast in influence and credibility.
trust, information sources, refugee communication, media trust, public opinion, Ipsos, credibility, personal experience
false
Market Analysis and Trends
Media & Entertainment
Mixed Chart
IPSOS
Add to my slides
Remove from favorites
The slide displays a column chart showing agreement levels on trust in the internet across various countries.
Customer and Market Segmentation
Telecommunications
The slide shows the decline in internet trust over time, with a detailed breakdown by country.
trust, internet, agreement levels, countries, decline, 2020 findings, Ipsos
false
Customer and Market Segmentation
Telecommunications
Single Chart
IPSOS
Add to my slides
Remove from favorites
Bar chart slide with teal bars for "Agree" and red bars for "Disagree"; countries listed vertically; title and survey question on the left; Ipsos branding bottom-right.
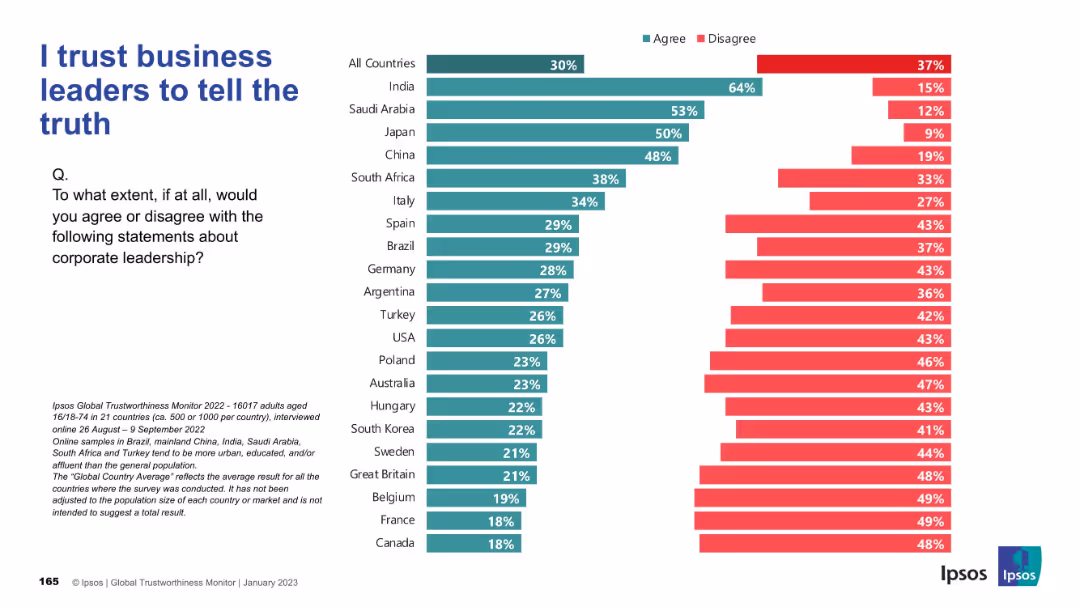
Strategic Planning
Professional Services
This slide presents international public opinion on whether business leaders are trusted to tell the truth, using survey data. India shows the highest trust, while Western countries tend to exhibit lower trust levels.
trust, leadership, corporate ethics, Ipsos, global survey, transparency, truthfulness, reputation, perception, business confidence
false
Strategic Planning
Professional Services
Mixed Chart
IPSOS
Add to my slides
Remove from favorites
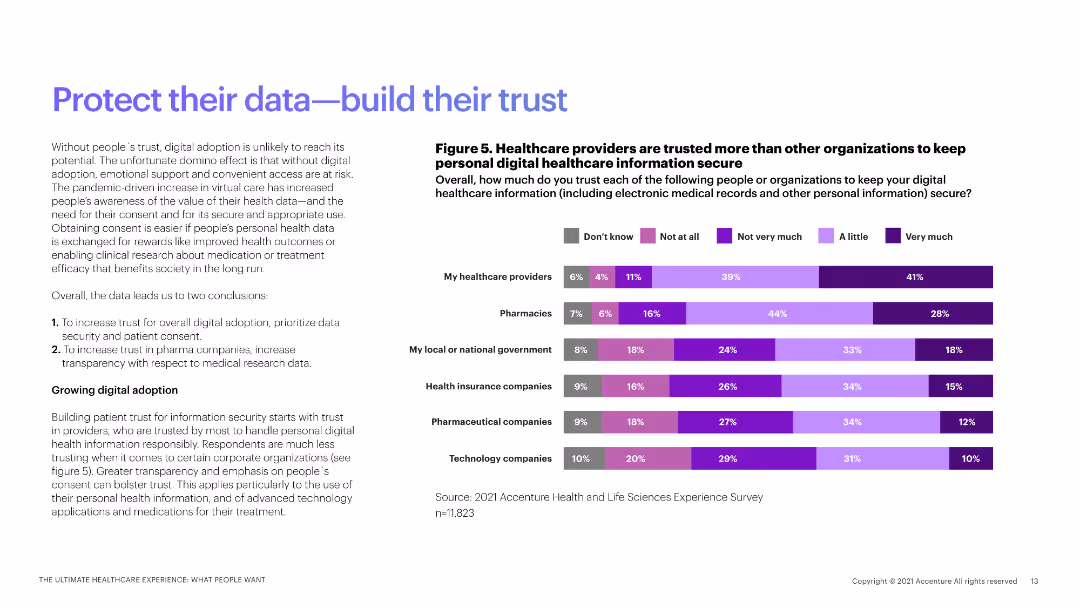
A bar chart showing trust levels in different organizations for keeping digital healthcare information secure, with a detailed explanation on the left.
Risk Assessment and Management
Healthcare & Pharmaceuticals
This slide presents survey data on trust levels in various organizations to secure personal digital healthcare information.
trust levels, healthcare providers, data security, digital information, survey results
false
Risk Assessment and Management
Healthcare & Pharmaceuticals
Mixed Chart
Accenture
Add to my slides
Remove from favorites
Previous
Next
You don't have any favorites yet.
Please wait loading your favorites slides...
Create a FREE account to continue browsing
Receive Instant Access to 1,000+ slides from companies like McKinsey, Google, and Goldman Sachs
First Name
Last Name
Email
Password
I agree to all
Terms & Privacy Policy
Thank you! Your submission has been received!
Oops! Something went wrong while submitting the form.
Have an account?
Sign in
Upgrade to PRO to Save slides
Advanced Search and Filters
Access to 15,000+ slides
Access to Category Pages
Save/Bookmark Slides
PowerPoint Template Library
Pick a Plan
MONTHLY
$12/month
Billed every month, Cancel anytime.
YEARLY
$9/year
Billed $108 annually, Cancel anytime.
Checkout for $12/month
Checkout for $108/yr
Secured by Stripe | AES-256 bit encryption


![[No visible slide title, but data-focused on travel habits]](https://cdn.prod.website-files.com/654e70fb59937215cac87b19/6899b0c256bdd950bd69269c_-DYgFEhQYBQYlAW9tBTcP9mNiGhmpNPe9XcSorQ6j3Q.avif)