My Account
My Slides
Search by Category
Pricing
Templates
View All Templates
Download Template Slides
✦ AI Search
Feedback
Login
Logout
Get Started
Browse all Slides
Browse all Slides
Create a FREE Account
Instant access to 1,000+ real slides from top companies like McKinsey, BCG, Goldman Sachs, Google and many more!
First Name
Last Name
Email
Password
I agree to all
Terms & Privacy Policy
Thank you! Your submission has been received!
Oops! Something went wrong while submitting the form.
Have an account?
Sign in
Saved Slides
Total No. of slides saved
0
↻ Refresh
✖ Clear all
The slide includes multiple column charts showing the percentage of "Very much" trust responses from 2017 to 2021 across different entities like healthcare providers, pharmacies, and technology companies. Colors differentiate the years.
Market Analysis and Trends
Healthcare & Pharmaceuticals
Discusses public trust levels in various healthcare ecosystem players concerning their handling of digital health information. This slide is useful for analyzing trends in consumer trust, which can inform strategies for improving public relations and trust-building initiatives within the healthcare sector.
trust levels, healthcare providers, digital health, consumer trends, industry analysis
false
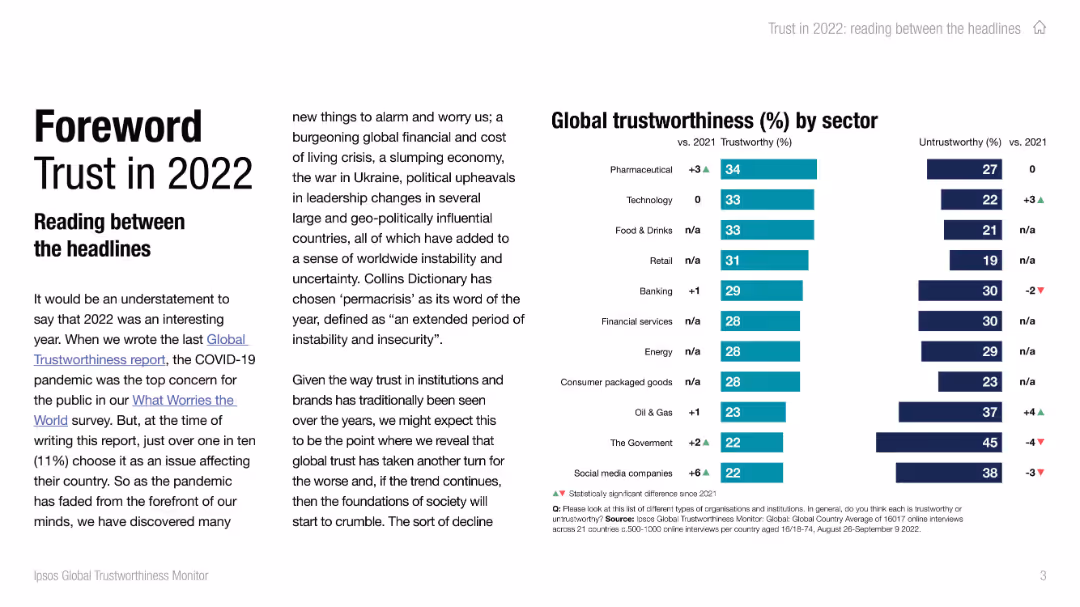
Market Analysis and Trends
Healthcare & Pharmaceuticals
Multiple Chart
Accenture
Add to my slides
Remove from favorites
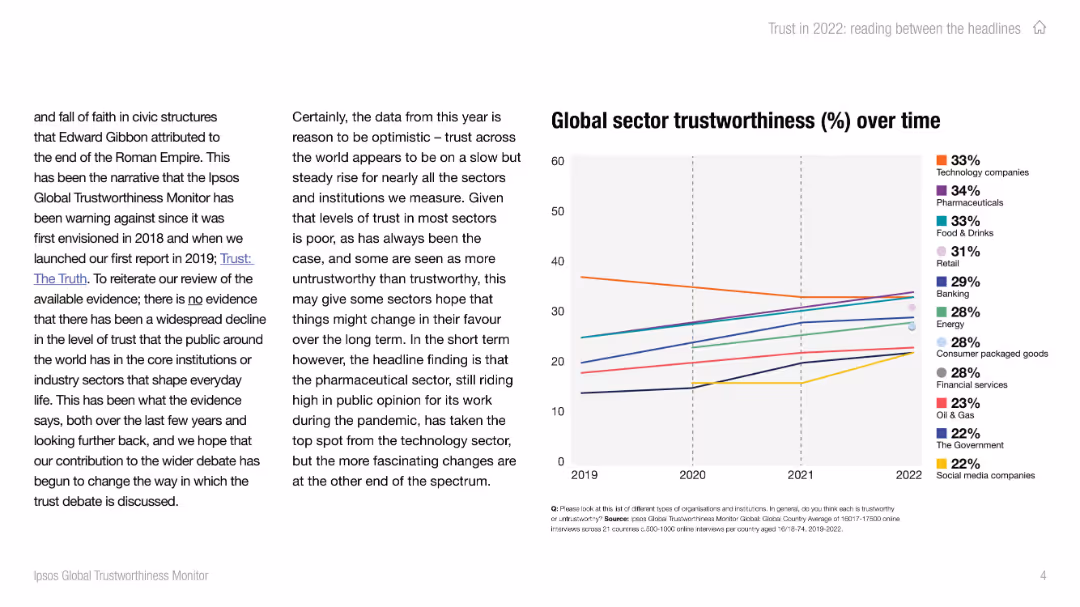
Dual-column layout: left side has narrative text on long-term trust trends; right side features a multi-line chart showing trust changes from 2019–2022 across sectors.
Market Analysis and Trends
Professional Services
This slide explores how trust in sectors has evolved over four years. Despite overall low trust levels, most sectors show a gradual increase in perceived trustworthiness. Pharmaceuticals now lead, overtaking technology. The visual highlights sector-specific trust shifts and long-term patterns.
trust over time, trend analysis, sector perception, public sentiment, pharmaceuticals, technology, global data
false
Market Analysis and Trends
Professional Services
Mixed Chart
IPSOS
Add to my slides
Remove from favorites
Text with images showing groups of employees in discussion and meeting environments, emphasizing trust and people experience in the workplace.
Human Resources and Talent Management
Professional Services
The slide emphasizes the importance of building trust and creating a sustainable people experience in the workplace, highlighting statistics on trust and employee support.
Trust, people experience, workplace, employee support, sustainability
false
Human Resources and Talent Management
Professional Services
Multiple Chart
EY
Add to my slides
Remove from favorites
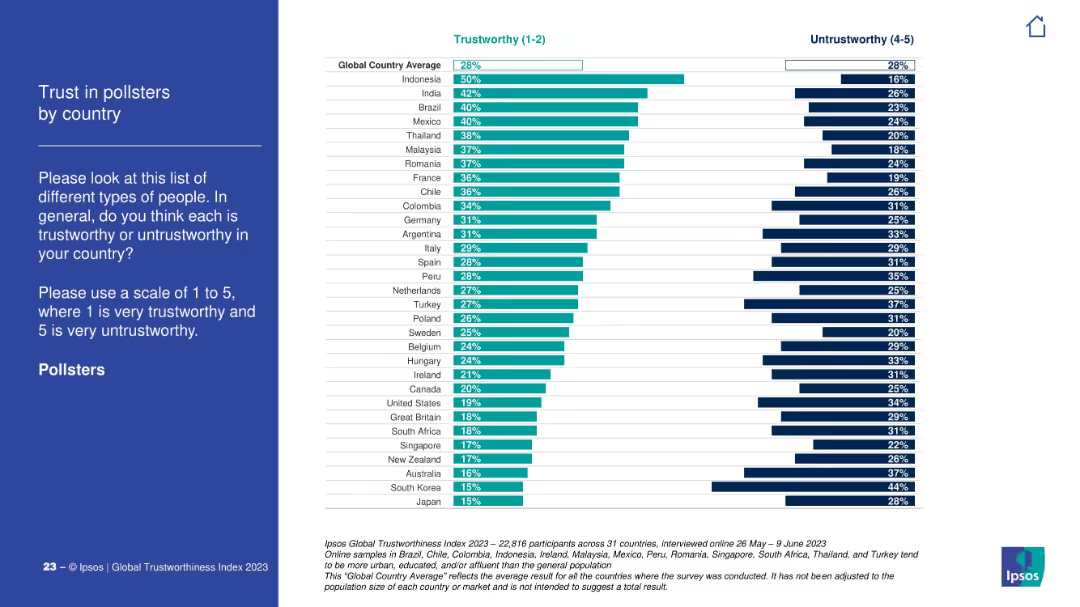
Left panel with title and description in white on blue. Right panel is a horizontal bar chart comparing "Trustworthy" vs. "Untrustworthy" by country.
Market Analysis and Trends
Media & Entertainment
The slide shows public trust levels in pollsters across countries based on Ipsos' 2023 global survey. It compares ratings on a 1–5 scale, highlighting notable disparities.
trust, pollsters, perception, global, country, Ipsos, bar chart, opinion, media, rating
false
Market Analysis and Trends
Media & Entertainment
Mixed Chart
IPSOS
Add to my slides
Remove from favorites
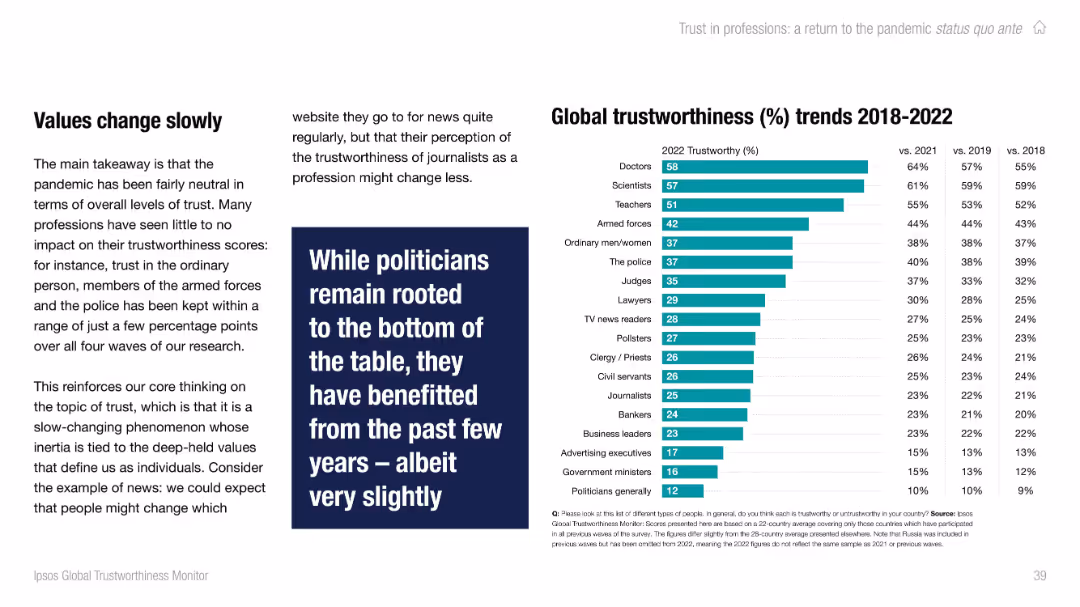
Left-aligned text with full-height vertical bar chart on the right showing trust ratings by profession. Teal color palette.
Performance Metrics and KPIs
Professional Services
This slide presents global trustworthiness scores for various professions from 2018–2022. Doctors and scientists rank highest in trust, while politicians and government ministers remain at the bottom. Changes since 2018 are relatively small, showing trust inertia.
trust, professions, global, Ipsos, doctors, scientists, politicians, stability, chart
false
Performance Metrics and KPIs
Professional Services
Mixed Chart
IPSOS
Add to my slides
Remove from favorites
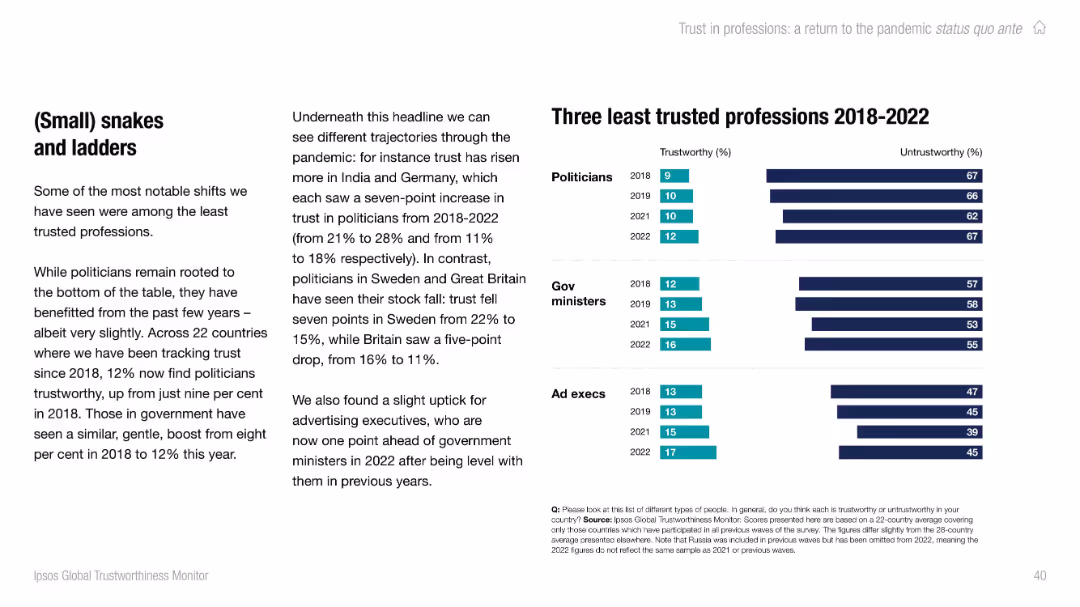
Left text block discussing notable trends; right shows side-by-side bar charts of trust/untrust ratings over time for politicians, gov ministers, and ad execs.
Performance Metrics and KPIs
Professional Services
Focuses on the three least trusted professions—politicians, government ministers, and advertising executives. Despite small improvements in trust since 2018, they remain at the bottom. The data illustrates the persistent skepticism toward these roles.
trust, professions, Ipsos, politicians, perception, reputation, trends, data
false
Performance Metrics and KPIs
Professional Services
Mixed Chart
IPSOS
Add to my slides
Remove from favorites
Horizontal bar chart ranking countries by concern about corruption; includes a summary text box.
Regulatory and Compliance
Government & Public Sector
One in four globally cite corruption as a major concern. South Africa, Indonesia, and Malaysia show the highest levels. The text highlights trends in countries experiencing growing or decreasing concern about corruption.
trust, professions, Ipsos, public opinion, global comparison, social perception, net trust, risk culture
false
Regulatory and Compliance
Government & Public Sector
Mixed Chart
IPSOS
Add to my slides
Remove from favorites
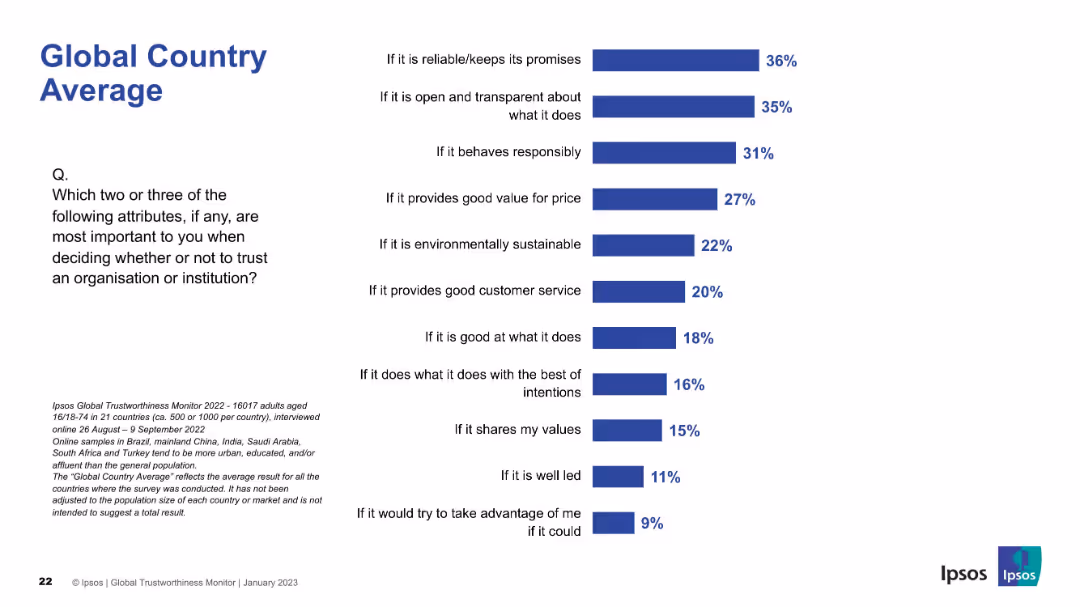
Left-aligned question text, right-aligned horizontal bar chart ranking attributes with percentages in blue. White background, clean layout.
Market Analysis and Trends
Professional Services
Summarizes the top attributes that influence global trust in organizations, based on a survey across 21 countries. Reliability, transparency, and responsibility lead.
trust, survey, global average, transparency, responsibility, Ipsos, ranking, values, perception, attributes
false
Market Analysis and Trends
Professional Services
Mixed Chart
IPSOS
Add to my slides
Remove from favorites
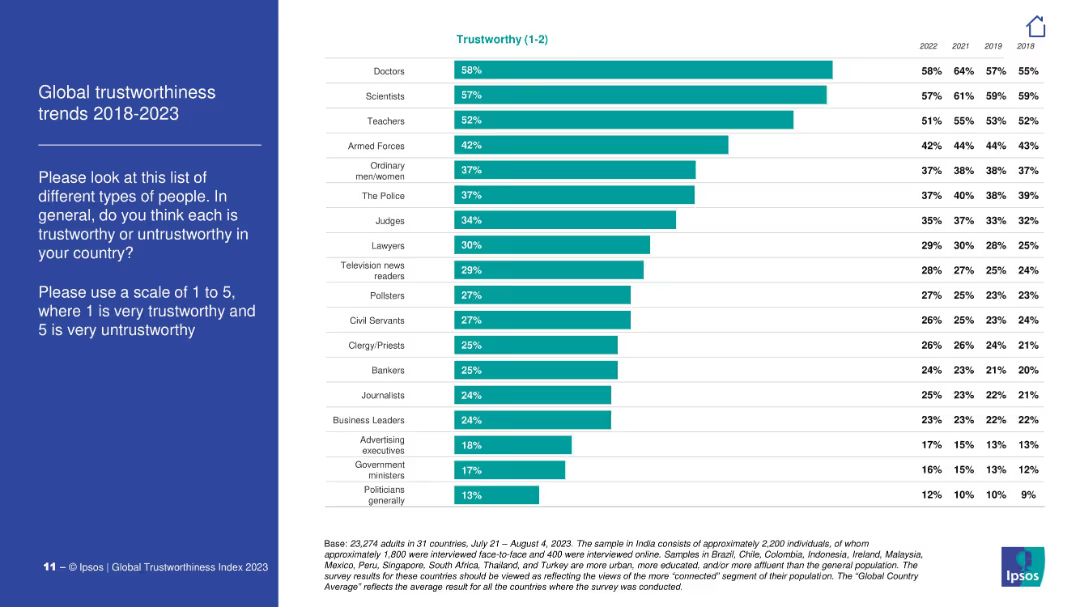
Vertical bar chart showing trends in trustworthiness ratings (1-2) for professions from 2018 to 2023. Includes multiple years for each profession.
Market Analysis and Trends
Professional Services
This slide illustrates trends in trust over time across professions. While doctors and scientists maintain high trust, most professions show a stable or declining trend, especially politicians and advertisers.
trust trends, longitudinal data, professions, public opinion, Ipsos, credibility, decline in trust, survey data
false
Market Analysis and Trends
Professional Services
Mixed Chart
IPSOS
Add to my slides
Remove from favorites
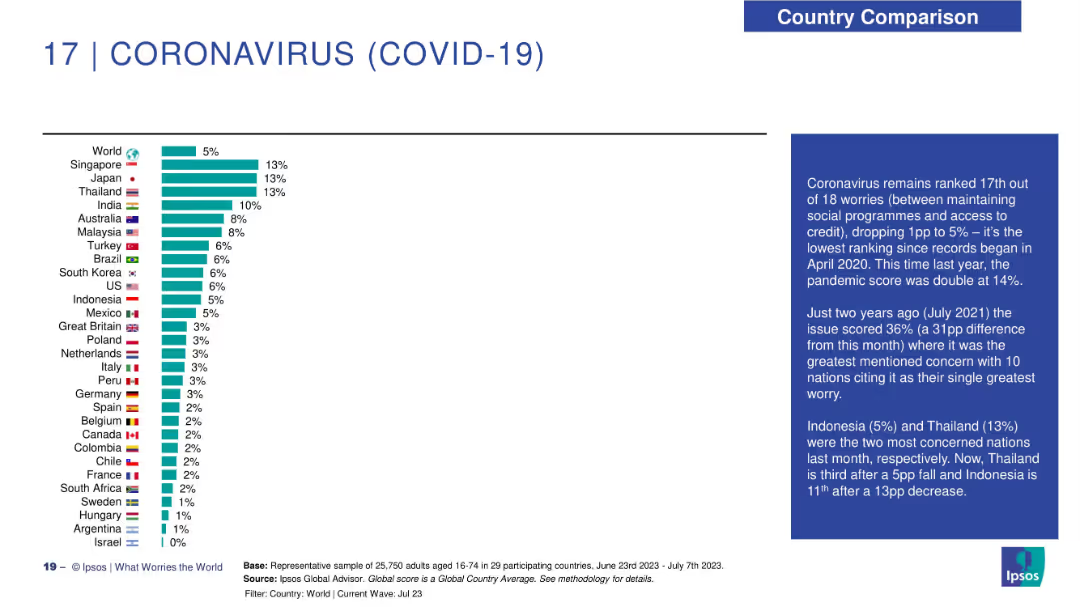
Horizontal bar chart showing concern over COVID-19 in different countries; includes descriptive analysis on right.
Risk Assessment and Management
Healthcare & Pharmaceuticals
COVID-19 has fallen to 17th place in global worries. Singapore, Japan, and Thailand show the highest current concern levels. The slide provides a timeline-based context comparing pandemic-related anxiety over the years.
trust trends, professional reputation, longitudinal data, Ipsos, social trust, governance, credibility evolution
false
Risk Assessment and Management
Healthcare & Pharmaceuticals
Mixed Chart
IPSOS
Add to my slides
Remove from favorites
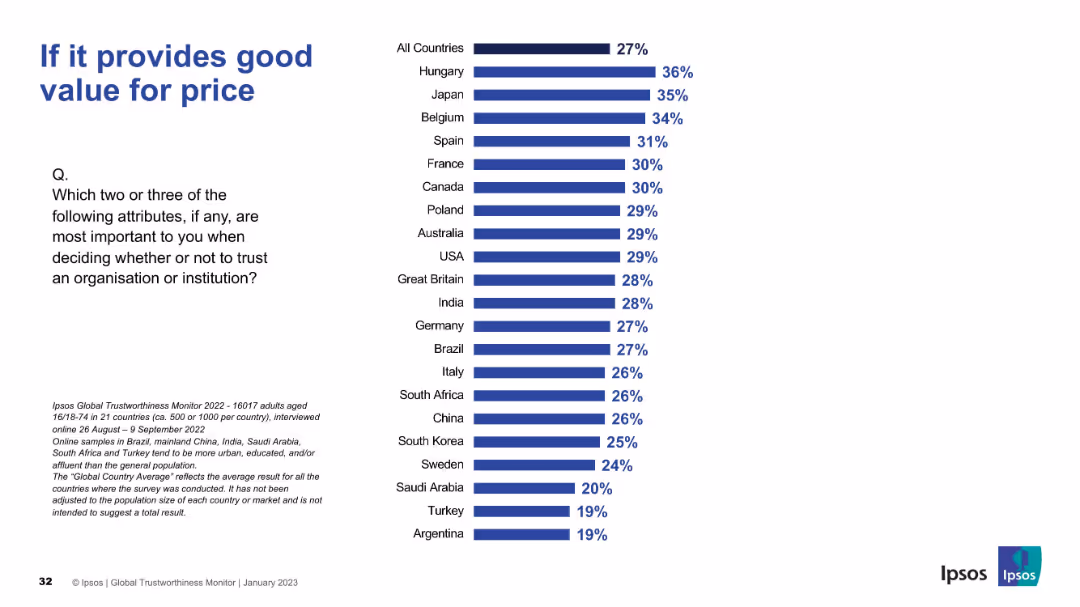
Left-aligned question text with right-aligned horizontal bar chart ranked by country; blue bars
Customer and Market Segmentation
Professional Services
This slide presents survey results on how important "good value for price" is in determining trust in organizations across countries. Hungary, Japan, and Belgium score highest.
trust, value, pricing, perception, Ipsos, international, survey, ranking, trustworthiness, consumer behavior
false
Customer and Market Segmentation
Professional Services
Mixed Chart
IPSOS
Add to my slides
Remove from favorites
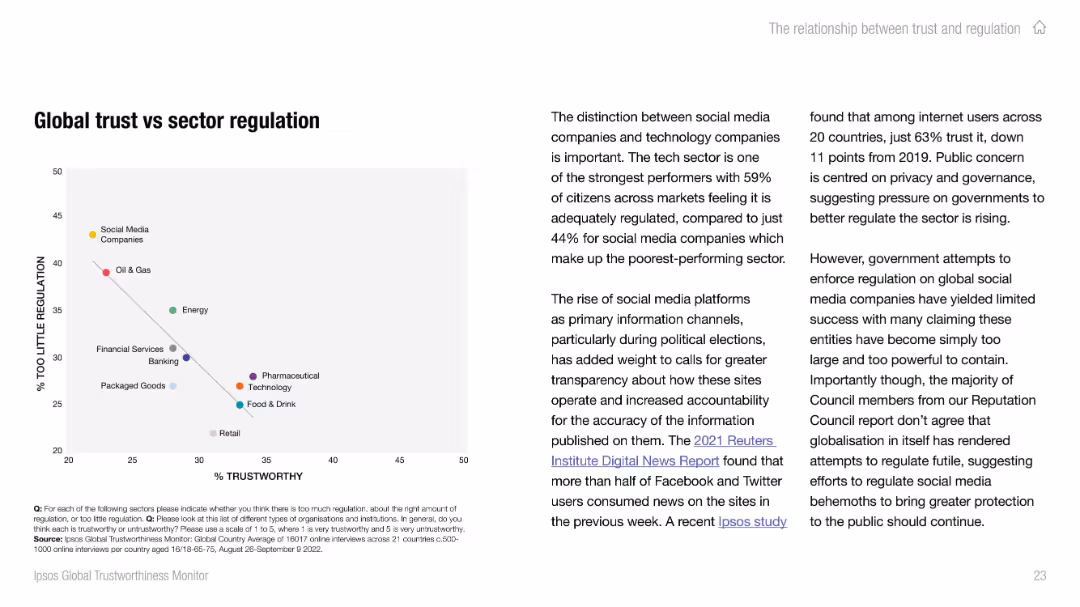
Split layout: left has a scatter plot mapping trust vs perception of under-regulation; right side contains analysis of distinctions between social media and tech regulation.
Risk Assessment and Management
Professional Services
This slide presents a scatter plot analyzing the relationship between sector trust and perceived need for regulation. It reveals that low-trust sectors (e.g., social media, oil & gas) are also viewed as under-regulated. Narrative explains growing concerns over governance and transparency.
trust vs regulation, risk analysis, public governance, sector perception, social media, oil & gas, scatter chart
false
Risk Assessment and Management
Professional Services
Mixed Chart
IPSOS
Add to my slides
Remove from favorites
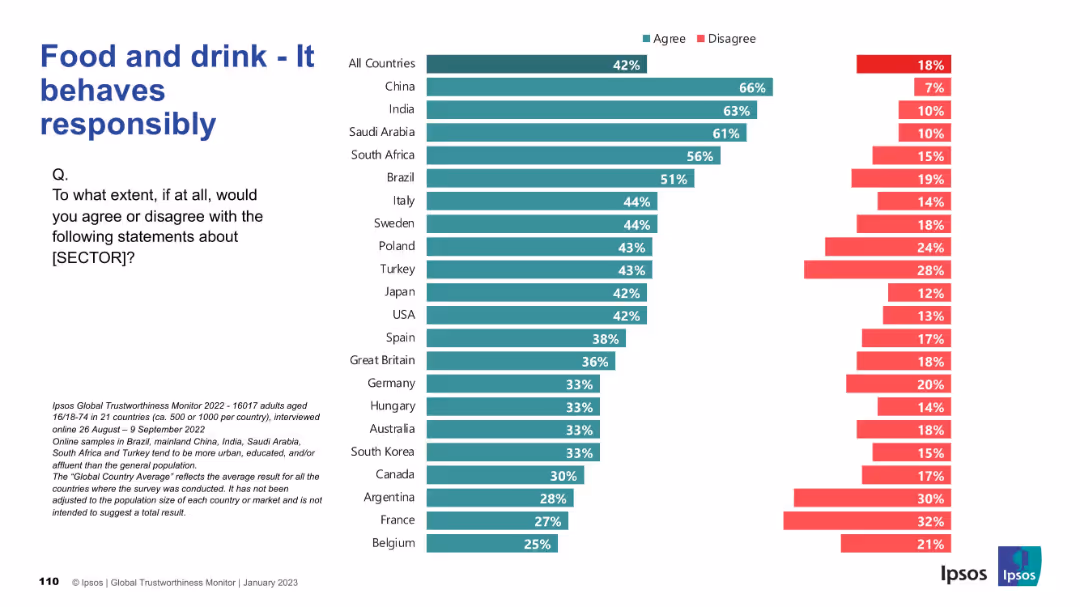
Split bar chart by country with “Agree” and “Disagree” percentages in teal and red; left-aligned question text.
Market Analysis and Trends
Consumer Goods
This slide shows the level of public agreement across countries with the statement that the food and drink sector behaves responsibly. It features a comparative bar chart of 21 countries showing agreement and disagreement rates.
trustworthiness, food sector, behavior, global opinions, Ipsos, consumer perceptions, responsibility, countries, chart, bar comparison
false
Market Analysis and Trends
Consumer Goods
Mixed Chart
IPSOS
Add to my slides
Remove from favorites
Left-aligned summary text with right-side vertical bar chart on trustworthiness by sector; includes year-over-year trend.
Industry Overview
Healthcare & Pharmaceuticals
This summary slide shows that the pharmaceutical sector has overtaken tech as the most trusted industry, according to a global Ipsos survey. Trust in government and social media has also seen slight increases.
trustworthiness, pharmaceuticals, industry ranking, Ipsos, global trends, public opinion, tech, social media
false
Industry Overview
Healthcare & Pharmaceuticals
Mixed Chart
IPSOS
Add to my slides
Remove from favorites
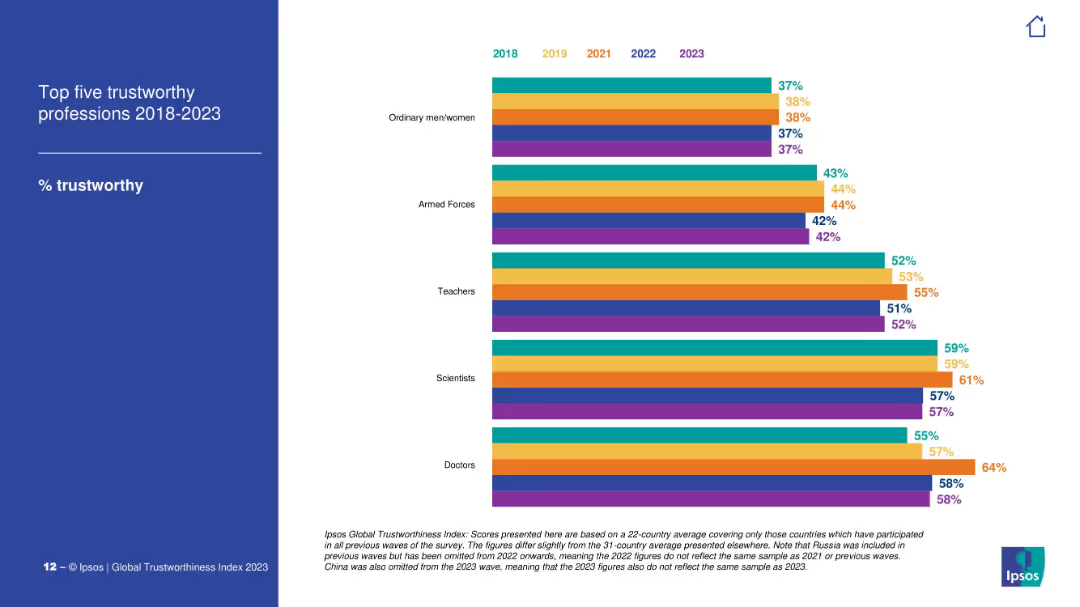
Horizontal bar chart with color-coded years (2018–2023) comparing the % trustworthiness of five professions. Left-aligned title, simple layout, white background.
Market Analysis and Trends
Professional Services
This slide presents a year-by-year comparison of the perceived trustworthiness of five professions globally: doctors, scientists, teachers, armed forces, and ordinary men/women. Doctors and scientists consistently lead in trust.
trustworthiness, professions, Ipsos, doctors, teachers, scientists, trend, bar chart, global, annual comparison
false
Market Analysis and Trends
Professional Services
Mixed Chart
IPSOS
Add to my slides
Remove from favorites
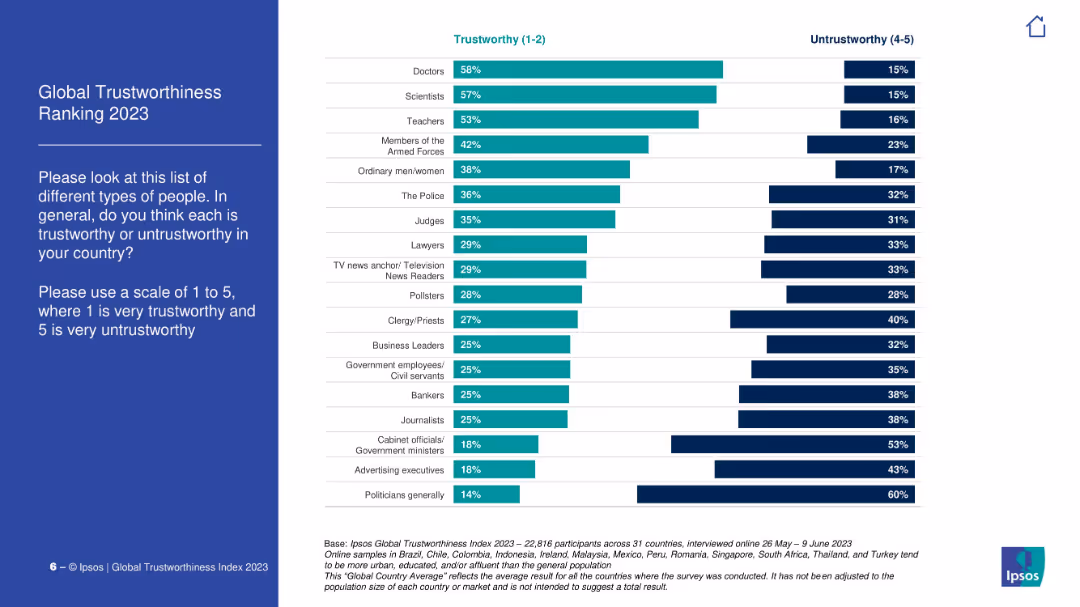
Horizontal bar chart with two data columns: % rating professions as trustworthy and untrustworthy. Professions listed on the left.
Market Analysis and Trends
Professional Services
This slide highlights the most and least trusted professions globally. Doctors, scientists, and teachers top the list for trustworthiness, while politicians, advertisers, and government officials are seen as the least trusted.
trustworthiness, professions, public opinion, Ipsos, survey, credibility, politics, media, science
false
Market Analysis and Trends
Professional Services
Mixed Chart
IPSOS
Add to my slides
Remove from favorites
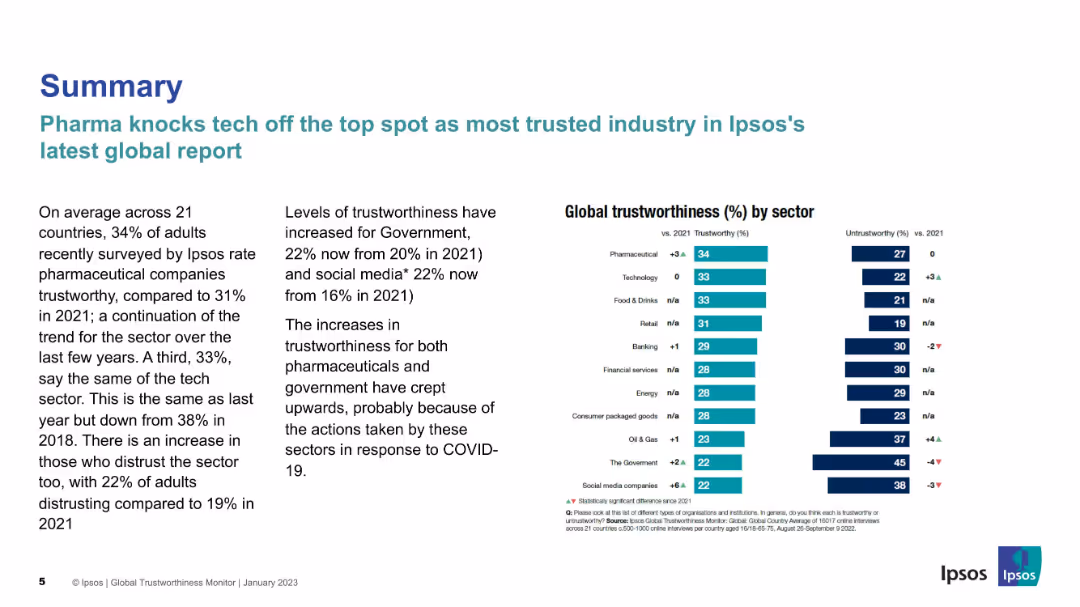
Left side contains text introduction to trust trends with bold title. Right side features a vertical bar chart of trustworthiness by sector.
Industry Overview
Professional Services
The slide introduces the 2022 trust report, highlighting the concept of 'permacrisis' and global unease. The bar chart ranks sectors by perceived trustworthiness, with pharmaceuticals and technology at the top, and government and social media companies at the bottom. Comparisons with 2021 are also shown.
trustworthiness, sectors, 2022 trends, public opinion, pharmaceuticals, technology, government, social media
false
Industry Overview
Professional Services
Mixed Chart
IPSOS
Add to my slides
Remove from favorites
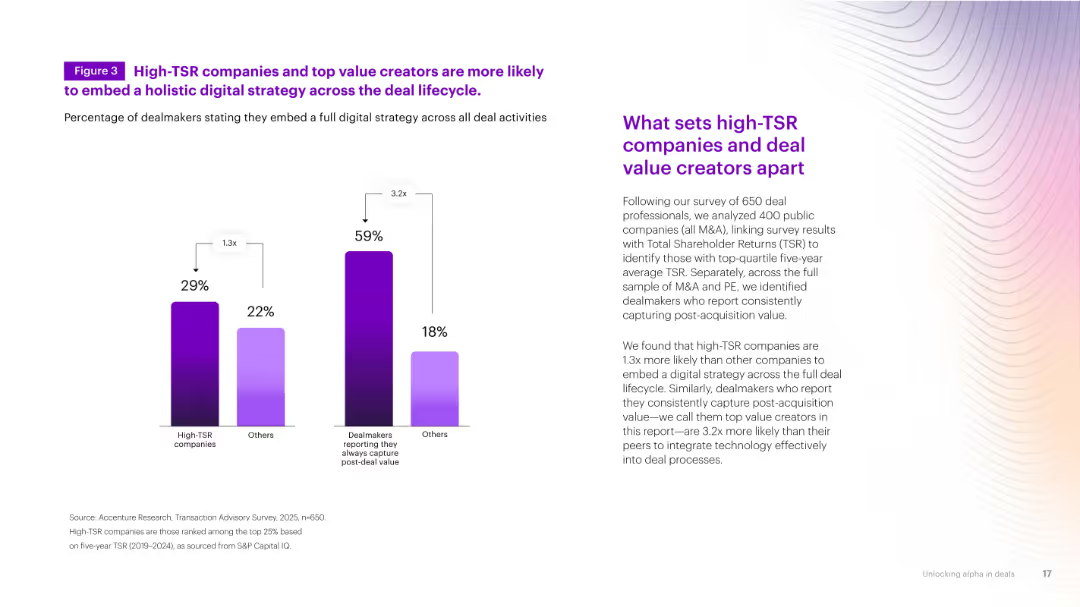
Dual bar chart comparing high-TSR vs. other companies in digital strategy embedding. Accompanied by explanatory paragraph on the right. Gradient background.
Performance Metrics and KPIs
Financial Services
Shows that high-TSR firms are significantly more likely to embed digital strategies and consistently capture post-deal value. Supports the case for digital transformation in M&A.
TSR, digital strategy, post-deal, performance, transformation
false
Performance Metrics and KPIs
Financial Services
Mixed Chart
Accenture
Add to my slides
Remove from favorites
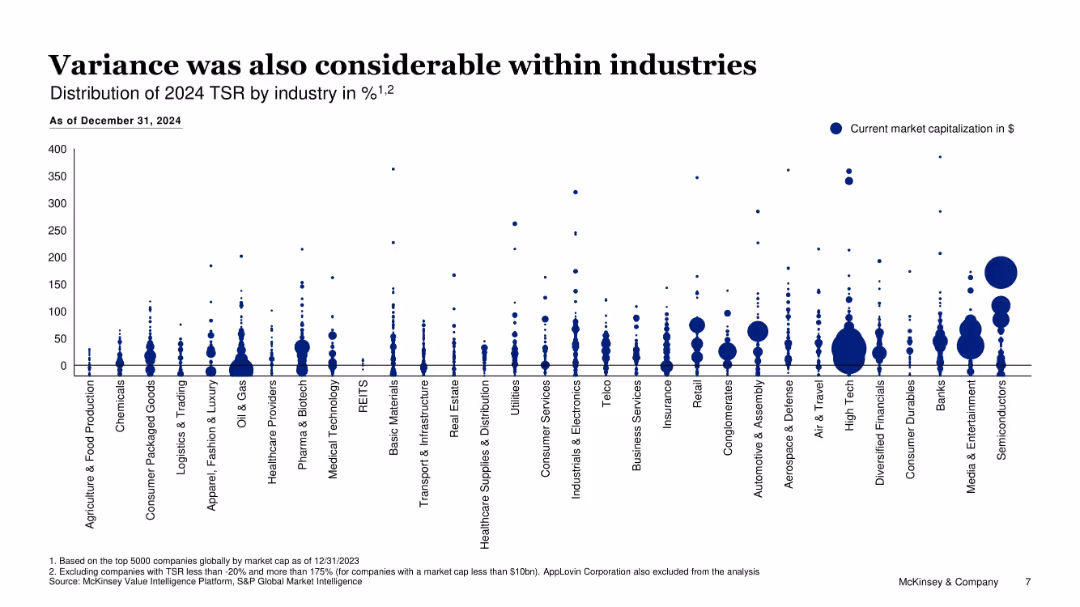
Bubble chart showing TSR distribution by industry with bubble size for market cap
Performance Metrics and KPIs
Financial Services
Shows intrasectional TSR variability within industries for 2024, suggesting dispersion in company performance despite sector trends; large bubbles show capital concentration.
TSR distribution, market cap, industry analysis, dispersion, company performance
false
Performance Metrics and KPIs
Financial Services
Single Chart
McKinsey
Add to my slides
Remove from favorites
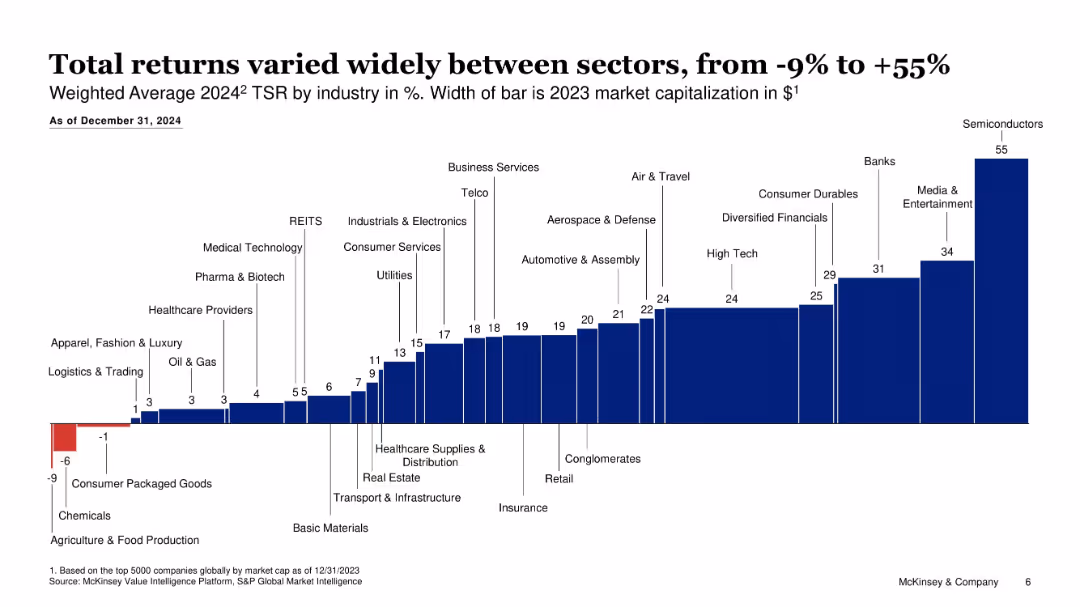
Horizontal bar chart ordered by sector TSR with width indicating market cap
Financial Performance
Financial Services
Analyzes 2024 TSR by sector, with semiconductors leading at 55% and consumer packaged goods underperforming at -6%; reveals broad variance across sectors.
TSR, industry returns, sector performance, capital markets, variance, semiconductors
false
Financial Performance
Financial Services
Single Chart
McKinsey
Add to my slides
Remove from favorites
The slide displays two column charts with varying backgrounds, showing survey responses by country.
Technology and Digital Transformation
Professional Services
This slide illustrates the principle of removing backgrounds to improve the clarity of data presentations in charts, following Tufte's guidelines.
Tufte, data-to-ink, ratio, survey, responses, visualization, backgrounds, chart, clarity, design
false
Technology and Digital Transformation
Professional Services
Multiple Chart
EY
Add to my slides
Remove from favorites
The slide features two column charts with and without bold effects, highlighting Tufte's principle to remove bold effects for clarity.
Technology and Digital Transformation
Professional Services
The slide explains how removing bold effects can enhance the clarity and effectiveness of data presentations, following Tufte's data-to-ink ratio principle.
Tufte, data-to-ink, ratio, survey, responses, visualization, bold effects, chart, clarity, design
false
Technology and Digital Transformation
Professional Services
Multiple Chart
EY
Add to my slides
Remove from favorites
The slide features two column charts with and without borders, emphasizing Tufte's principle of removing unnecessary borders.
Technology and Digital Transformation
Professional Services
This slide explains how removing borders can make data presentations clearer and more effective, in line with Tufte's data-to-ink ratio principle.
Tufte, data-to-ink, ratio, survey, responses, visualization, borders, chart, clarity, design
false
Technology and Digital Transformation
Professional Services
Multiple Chart
EY
Add to my slides
Remove from favorites
The slide displays two column charts showing survey responses by country with varying data-to-ink ratios.
Technology and Digital Transformation
Professional Services
The slide explains Tufte's data-to-ink ratio principle, demonstrating how reducing non-data ink can make charts clearer and more efficient.
Tufte, data-to-ink, ratio, survey, responses, visualization, chart, efficiency, clarity, design
false
Technology and Digital Transformation
Professional Services
Multiple Chart
EY
Add to my slides
Remove from favorites
The slide displays two column charts, one with colors and one with minimized color usage, following Tufte's principle to remove colors.
Technology and Digital Transformation
Professional Services
The slide illustrates the principle of removing colors to focus on data clarity and efficiency in presentations, as advised by Tufte.
Tufte, data-to-ink, ratio, survey, responses, visualization, colors, chart, clarity, design
false
Technology and Digital Transformation
Professional Services
Multiple Chart
EY
Add to my slides
Remove from favorites
The slide shows two column charts with different approaches to labeling, highlighting the removal of redundant labels for clarity.
Technology and Digital Transformation
Professional Services
The slide demonstrates how removing redundant labels can improve the clarity and effectiveness of data presentations according to Tufte's principles.
Tufte, data-to-ink, ratio, survey, responses, visualization, labels, chart, clarity, design
false
Technology and Digital Transformation
Professional Services
Multiple Chart
EY
Add to my slides
Remove from favorites
The slide displays two column charts with lighter labels, adhering to Tufte's principle to lighten labels for better data clarity.
Technology and Digital Transformation
Professional Services
This slide illustrates the principle of lightening labels to improve the clarity and focus of data presentations according to Tufte's guidelines.
Tufte, data-to-ink, ratio, survey, responses, visualization, light labels, chart, clarity, design
false
Technology and Digital Transformation
Professional Services
Multiple Chart
EY
Add to my slides
Remove from favorites
The slide shows two column charts, one with lines and one without, following Tufte's principle to lighten or remove lines for clarity.
Technology and Digital Transformation
Professional Services
The slide demonstrates how lightening or removing lines can enhance data clarity and focus in presentations, as per Tufte's data-to-ink ratio principle.
Tufte, data-to-ink, ratio, survey, responses, visualization, lines, chart, clarity, design
false
Technology and Digital Transformation
Professional Services
Multiple Chart
EY
Add to my slides
Remove from favorites
The slide shows two column charts, one with special effects and one without, emphasizing Tufte's principle of removing special effects.
Technology and Digital Transformation
Professional Services
This slide demonstrates how removing special effects can improve data clarity and focus in presentations according to Tufte's guidelines.
Tufte, data-to-ink, ratio, survey, responses, visualization, special effects, chart, clarity, design
false
Technology and Digital Transformation
Professional Services
Multiple Chart
EY
Add to my slides
Remove from favorites
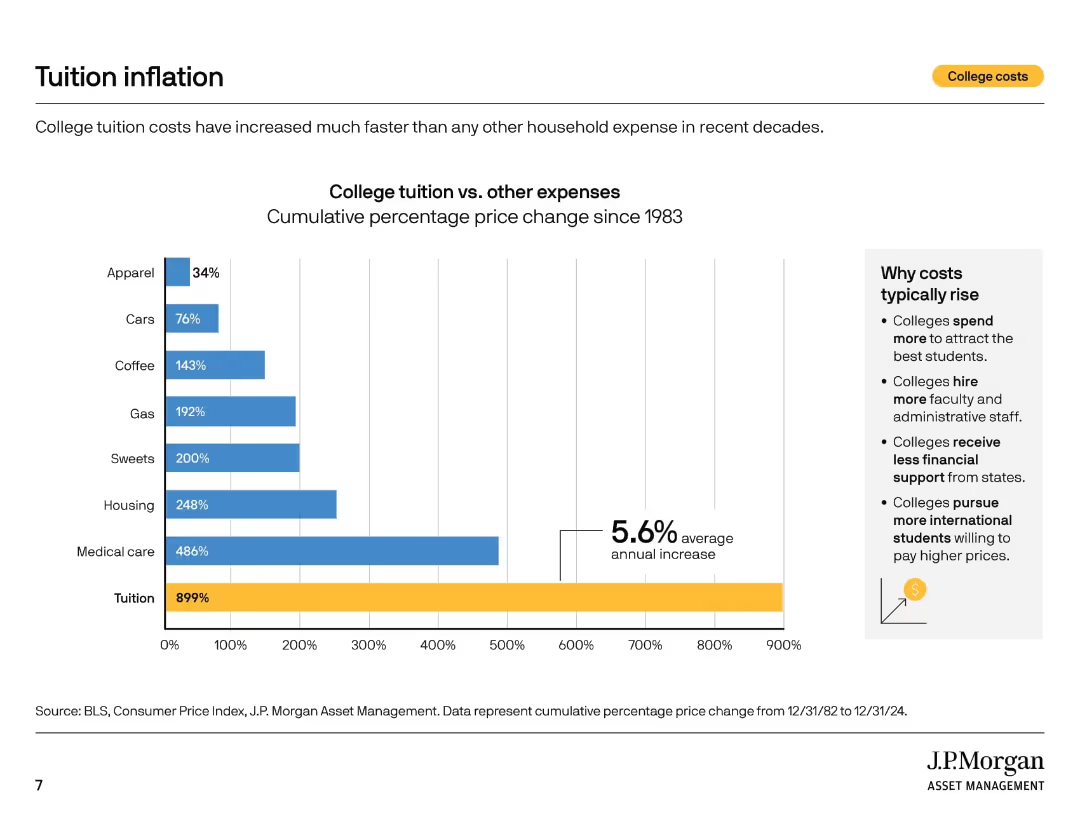
Vertical bar chart comparing cumulative price increases for tuition and other expenses since 1983. Sidebar explains cost drivers.
Market Analysis and Trends
Education & Training
This slide shows that tuition has increased by 899% since 1983—far outpacing other household costs. The sidebar details reasons for rising costs such as staffing, student competition, and reduced state funding.
tuition inflation, cost drivers, education costs, CPI, historical trends, household expenses, financial planning, college spending, cost comparison
false
Market Analysis and Trends
Education & Training
Mixed Chart
JP Morgan
Add to my slides
Remove from favorites
Line graph on white background showing economic sentiment from May 2013 to May 2023, with annotation at end.
Market Analysis and Trends
Government & Public Sector
This slide tracks public sentiment about Turkey's economic situation over a 10-year period. The graph reflects fluctuations in economic confidence, ending at 32% in May 2023. A note highlights a 9 percentage point increase in positive sentiment, continuing a 3-month upward trend.
Turkey, economy, perception, sentiment, Ipsos, trend, increase, data, public opinion, May 2023
false
Market Analysis and Trends
Government & Public Sector
Single Chart
IPSOS
Add to my slides
Remove from favorites
Column chart depicting Turkey's electricity generation by source from 2007 to 2022.
Market Analysis and Trends
Energy & Utilities
Illustrates the doubling of electricity generation over 15 years and the shift towards renewable sources.
Turkey, Electricity, Generation, Renewable, Sources
false
Market Analysis and Trends
Energy & Utilities
Mixed Chart
Kearney
Add to my slides
Remove from favorites
Slide features line and column charts, with a prominent image of a mosque.
Market Analysis and Trends
Financial Services
Details Turkey's GDP growth, loan growth, and net interest margin compared to peers.
Turkey, GDP, loans, growth
false
Market Analysis and Trends
Financial Services
Multiple Chart
Morgan Stanley
Add to my slides
Remove from favorites
The left side of the slide provides text information on power generation capacity additions in Turkey, while the right side features a stacked column chart showing the breakdown of power generation by source (hydropower, coal, natural gas, etc.) from 2007 to 2022.
Market Analysis and Trends
Energy & Utilities
The slide discusses the significant growth and diversification of power generation capacity in Turkey over the past 15 years, with a focus on renewable energy sources like wind, solar, and geothermal. It includes a column chart showing the changes in power generation sources over time.
Turkey, power, generation, renewable, diversification
false
Market Analysis and Trends
Energy & Utilities
Mixed Chart
Kearney
Add to my slides
Remove from favorites
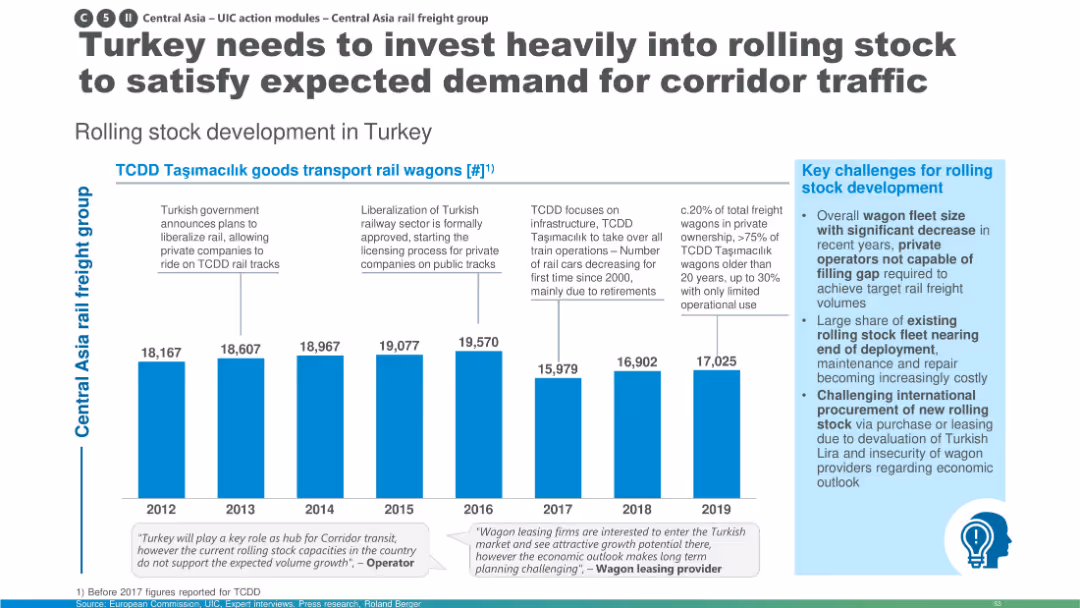
Bar chart tracking TCDD rail wagon quantities over time; callouts highlight policy milestones; includes summary box with key challenges.
Operational Efficiency
Transportation & Logistics
This slide details the development of Turkey's rail freight wagon fleet from 2012 to 2019. It emphasizes the need for increased investment due to aging stock, limited private capacity, and international procurement issues. Graphs and text boxes highlight quantitative and qualitative issues.
Turkey rail, rolling stock, investment need, wagon fleet, infrastructure, corridor traffic, freight transport, TCDD, private sector challenges
false
Operational Efficiency
Transportation & Logistics
Mixed Chart
Roland Berger
Add to my slides
Remove from favorites
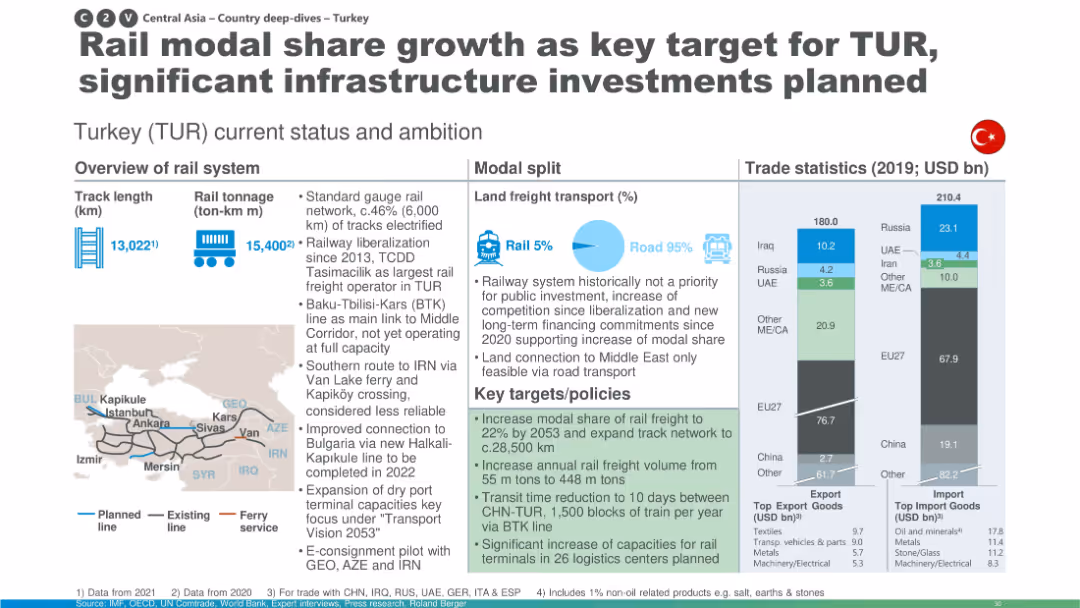
Similar to others: includes trade stats, modal split, and map; highlights investment plans to increase rail freight share.
Strategic Planning
Transportation & Logistics
Turkey’s rail network status and future ambitions are described, with plans to increase modal share of rail freight, expand the network, and improve logistics centers. The slide also touches on liberalization and international connectivity with surrounding countries.
Turkey, rail share, investment, modal split, BTK line, logistics, transport planning
false
Strategic Planning
Transportation & Logistics
Multiple Chart
Roland Berger
Add to my slides
Remove from favorites
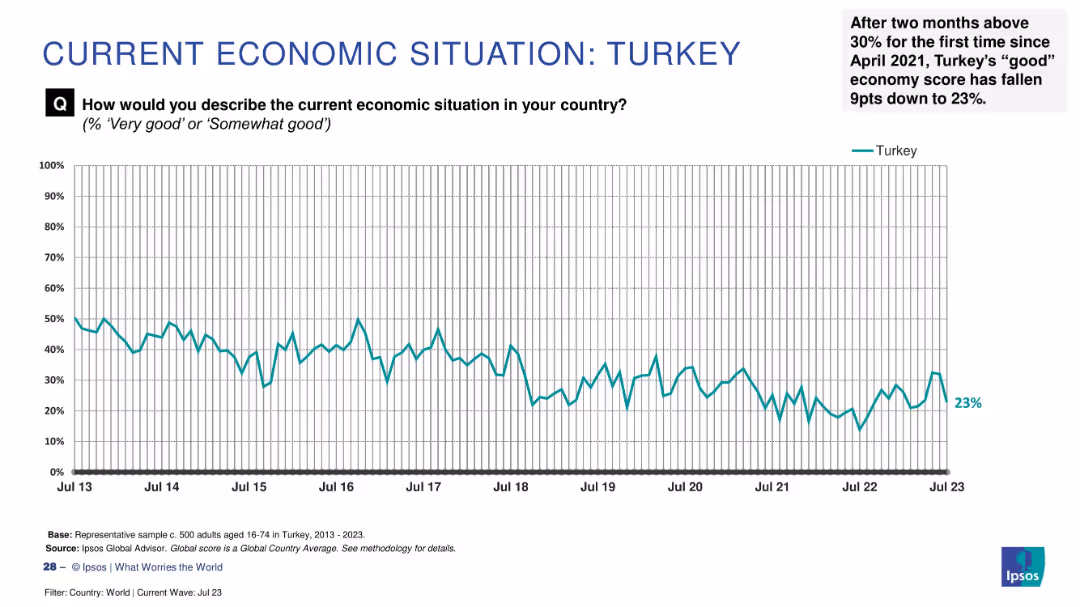
Line graph showing a declining trend from 2013 to 2023 with a recent 9-point drop to 23% marked in the annotation.
Market Analysis and Trends
Financial Services
Turkey's economic sentiment saw a sharp 9-point drop in July 2023, falling to 23% after briefly surpassing 30%. The slide captures fluctuating public confidence over time, reflecting recent instability.
Turkey, sentiment decline, economic outlook, 2023 drop, public perception, Ipsos, confidence fluctuation, barometer, historical data
false
Market Analysis and Trends
Financial Services
Single Chart
IPSOS
Add to my slides
Remove from favorites
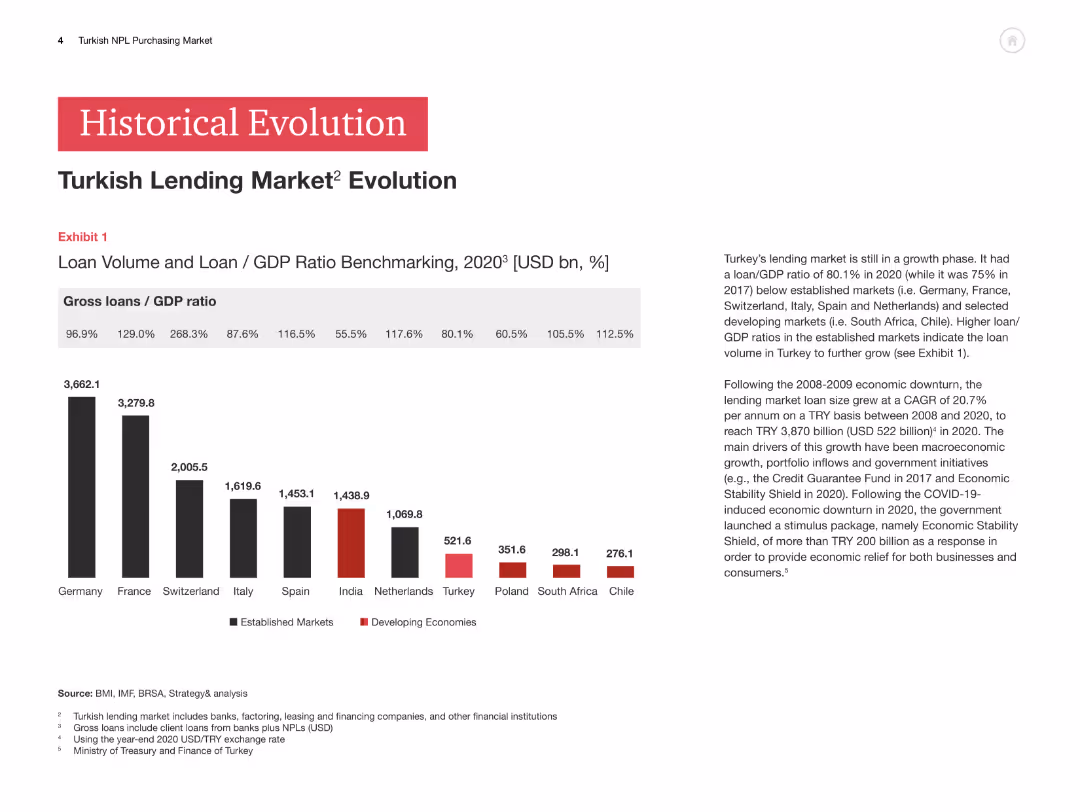
The slide features a column chart showing gross loans/GDP ratio for various countries in 2020. The text on the right explains the evolution of the Turkish lending market.
Market Analysis and Trends
Financial Services
This slide explains the historical evolution of the Turkish lending market, including a comparative analysis of loan volumes and GDP ratios across different countries.
Turkish Lending Market, Historical Evolution, GDP Ratio, Financial Analysis, Column Chart
false
Market Analysis and Trends
Financial Services
Mixed Chart
PwC/Strategy&
Add to my slides
Remove from favorites
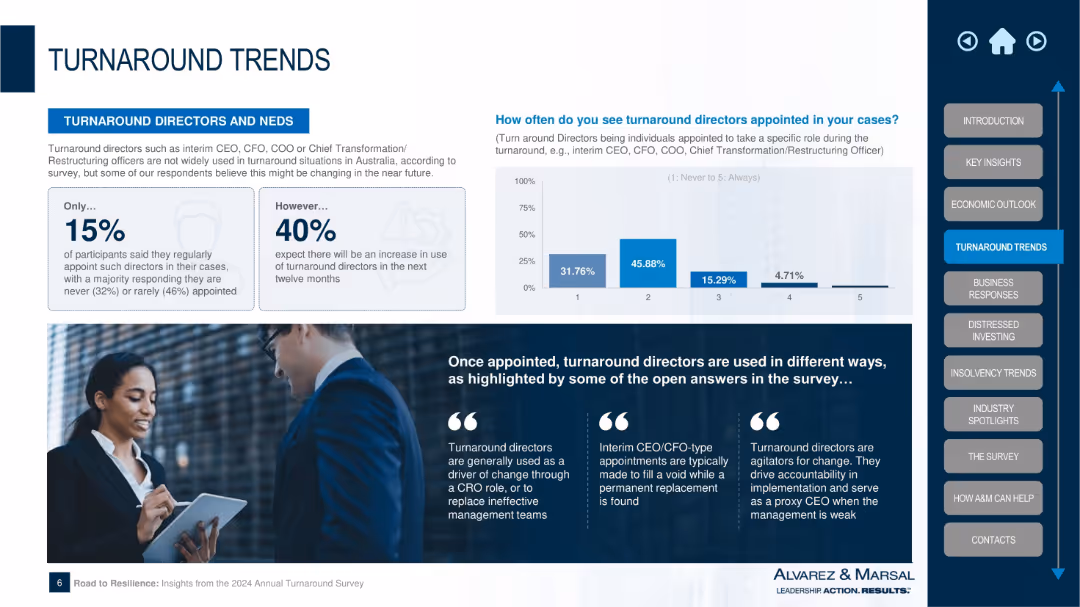
Split layout with left-side statistics on appointment frequency and expectations, and right-side chart showing frequency of director appointments; bottom section features quotes and an image; clean, corporate visual style.
Human Resources and Talent Management
Professional Services
This slide covers the role and appointment trends of turnaround directors in restructuring situations. Only 15% regularly appoint such roles, though 40% expect increased usage. Once appointed, these directors often act as agents of change, filling leadership gaps or executing transformation strategies. Quotes from participants provide qualitative insights into their value.
turnaround directors, leadership, interim roles, restructuring, Alvarez & Marsal, talent trends, CEO/CFO interim, organizational change
false
Human Resources and Talent Management
Professional Services
Mixed Chart
Alvarez & Marsal
Add to my slides
Remove from favorites
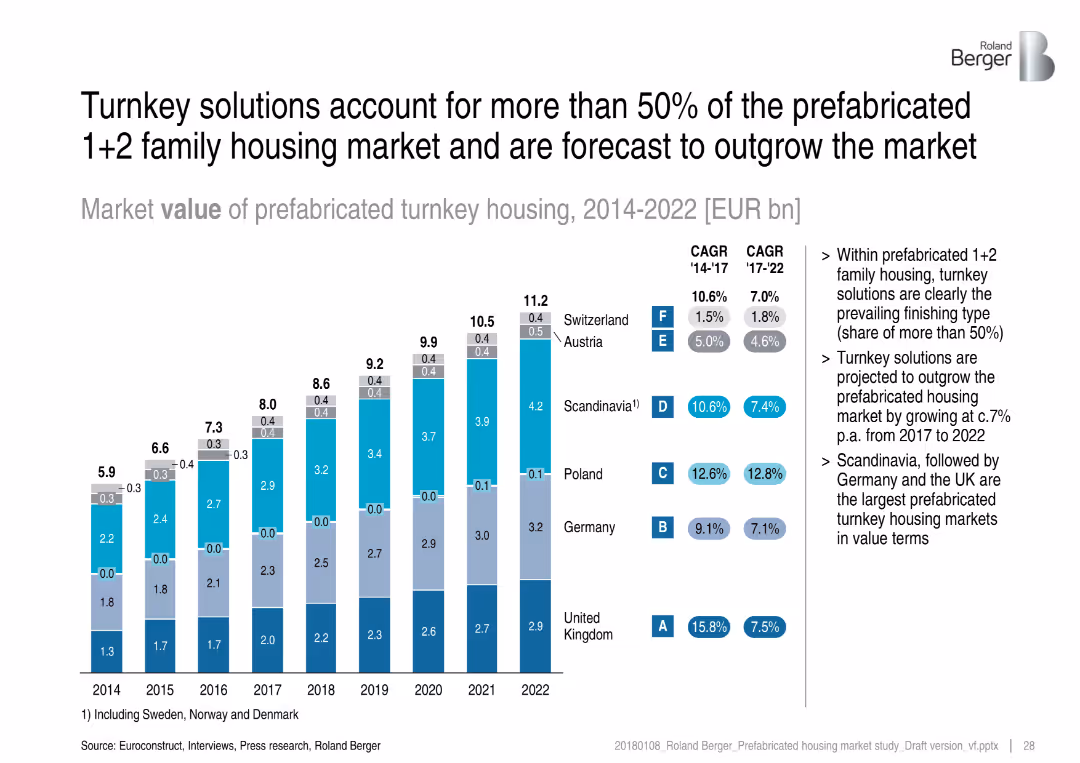
EUR value bar chart by country for turnkey housing, CAGR data, explanatory bullet points
Strategic Planning
Real Estate & Construction
The chart displays the value share of turnkey prefabricated housing from 2014 to 2022, highlighting its growing dominance and value share above 50%. Scandinavia, Germany, and the UK are the most significant markets for turnkey solutions.
turnkey, prefabricated, housing market, value, CAGR, growth forecast, Europe
false
Strategic Planning
Real Estate & Construction
Mixed Chart
Roland Berger
Add to my slides
Remove from favorites
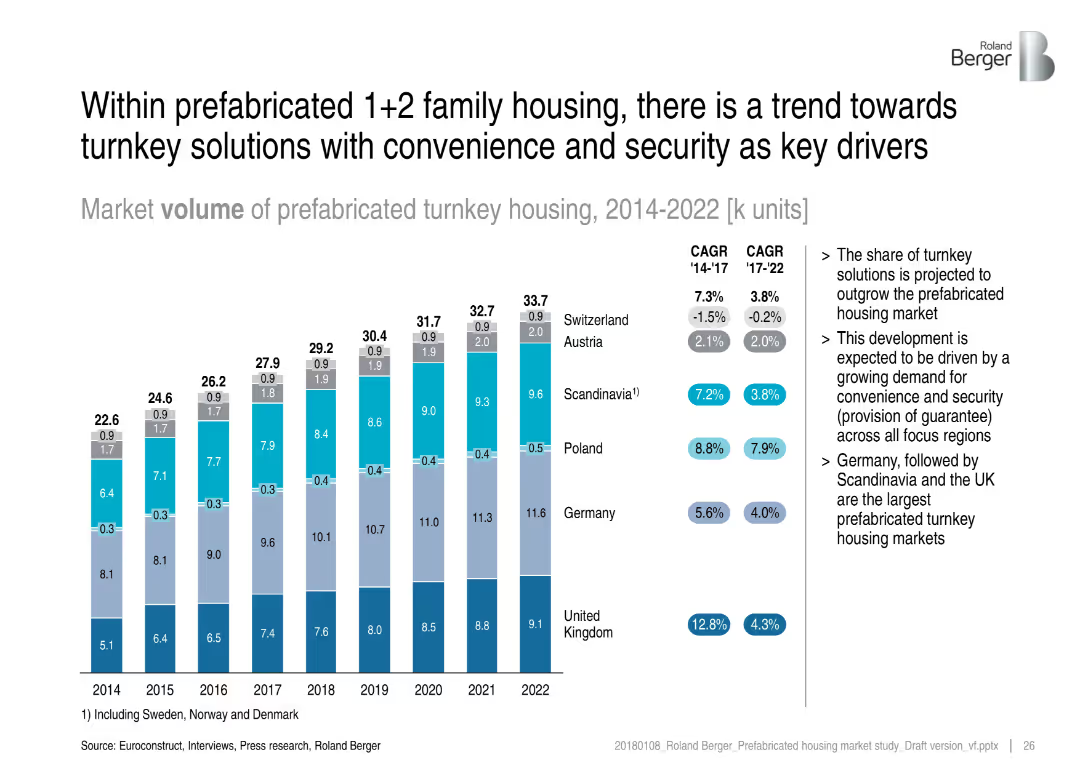
Bar chart layout with annual market volume in stacked segments by country, side notes on trends, and CAGR values for 2014–17 and 2017–22
Market Analysis and Trends
Real Estate & Construction
This slide presents the market volume of prefabricated turnkey housing across multiple European countries from 2014 to 2022. It highlights growth trends and CAGR data, emphasizing the shift towards turnkey solutions driven by convenience and security. Germany, Scandinavia, and the UK lead the market in volume.
turnkey, prefabricated, housing, market volume, CAGR, Germany, Scandinavia, UK, security, convenience
false
Market Analysis and Trends
Real Estate & Construction
Mixed Chart
Roland Berger
Add to my slides
Remove from favorites
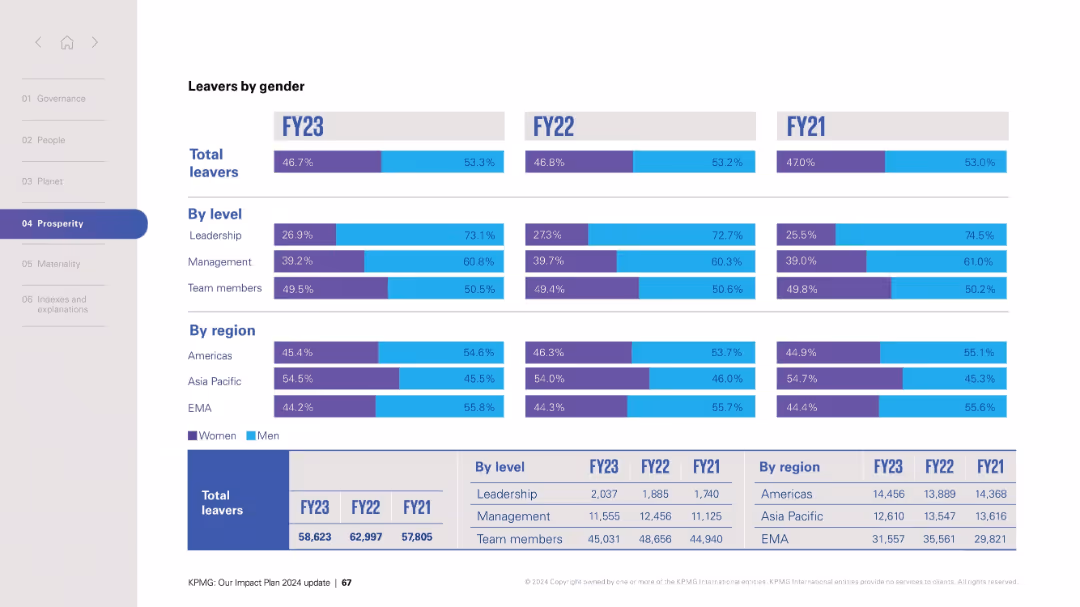
Horizontal bar chart layout with gender data split by level and region; raw totals listed at bottom.
Human Resources and Talent Management
Professional Services
Reports the proportion of employees leaving the company by gender across leadership, management, and team member levels, along with regional breakdowns. Presented over three fiscal years, this slide aids in evaluating turnover and retention efforts, especially concerning gender parity.
turnover, employee exits, gender breakdown, HR, leadership, team members, regions, FY data
false
Human Resources and Talent Management
Professional Services
Mixed Chart
KPMG
Add to my slides
Remove from favorites
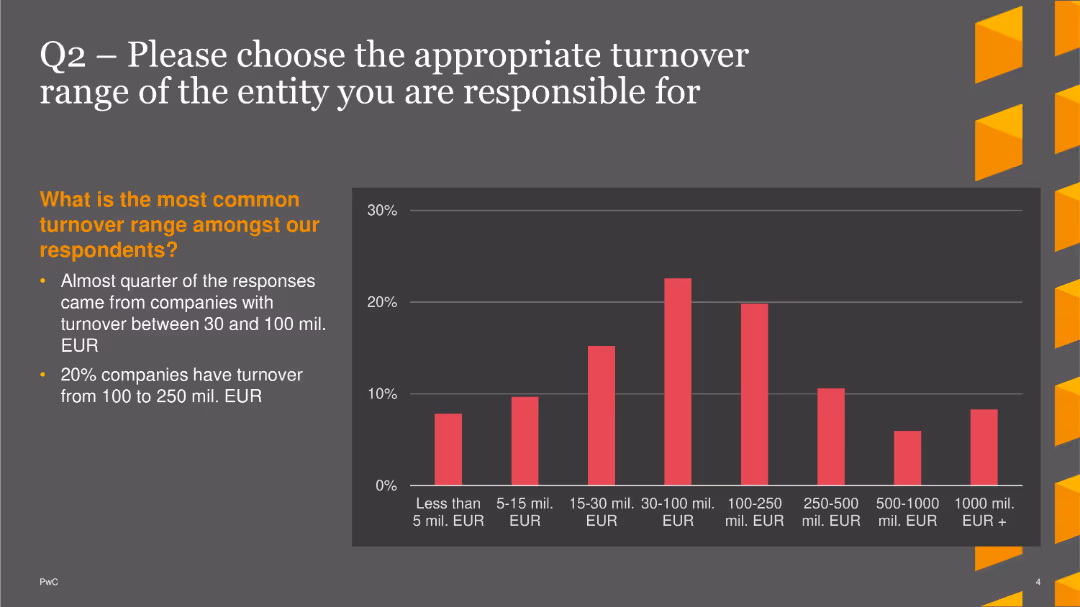
The slide includes a column chart illustrating company turnover ranges. The most common range is 30-100 million EUR, followed by 100-250 million EUR.
Market Analysis and Trends
Financial Services
This slide reveals that nearly a quarter of responses came from companies with turnover between 30 and 100 million EUR, with 20% between 100-250 million EUR.
Turnover, Financial, Column Chart, PwC, Survey, 2022, CFOs
false
Market Analysis and Trends
Financial Services
Mixed Chart
PwC/Strategy&
Add to my slides
Remove from favorites
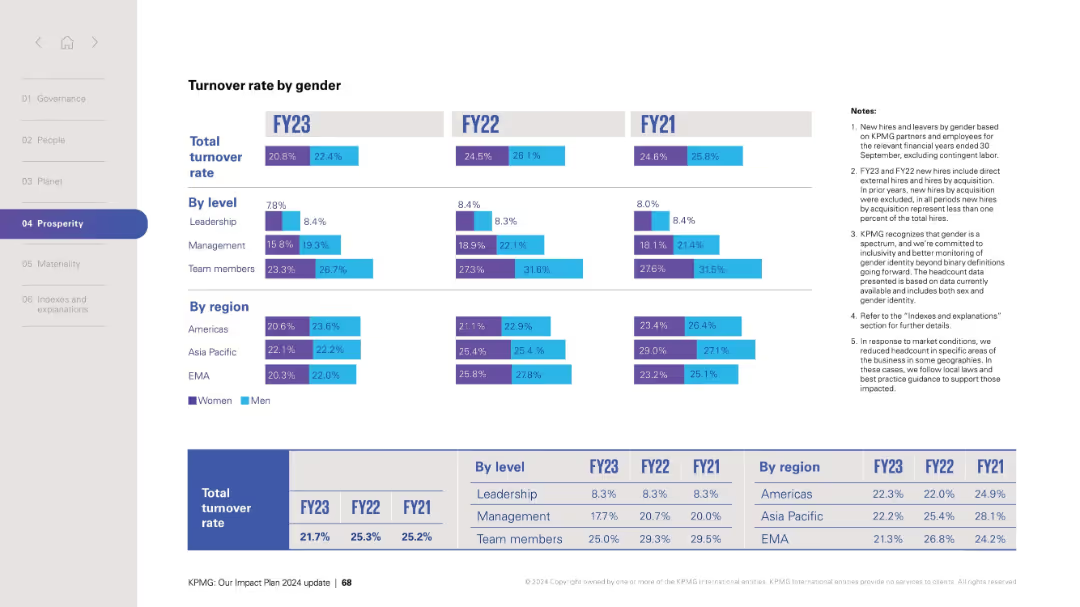
Layout mirrors previous slides with rates displayed by role and region; total turnover shown at bottom.
Human Resources and Talent Management
Professional Services
Analyzes turnover rate segmented by gender across fiscal years FY21–FY23. Detailed by leadership level and global region, the chart supports strategic planning and retention initiatives. Notes reiterate data scope and inclusion principles.
turnover rate, gender analysis, retention, HR strategy, leadership, team, regions, FY data
false
Human Resources and Talent Management
Professional Services
Mixed Chart
KPMG
Add to my slides
Remove from favorites
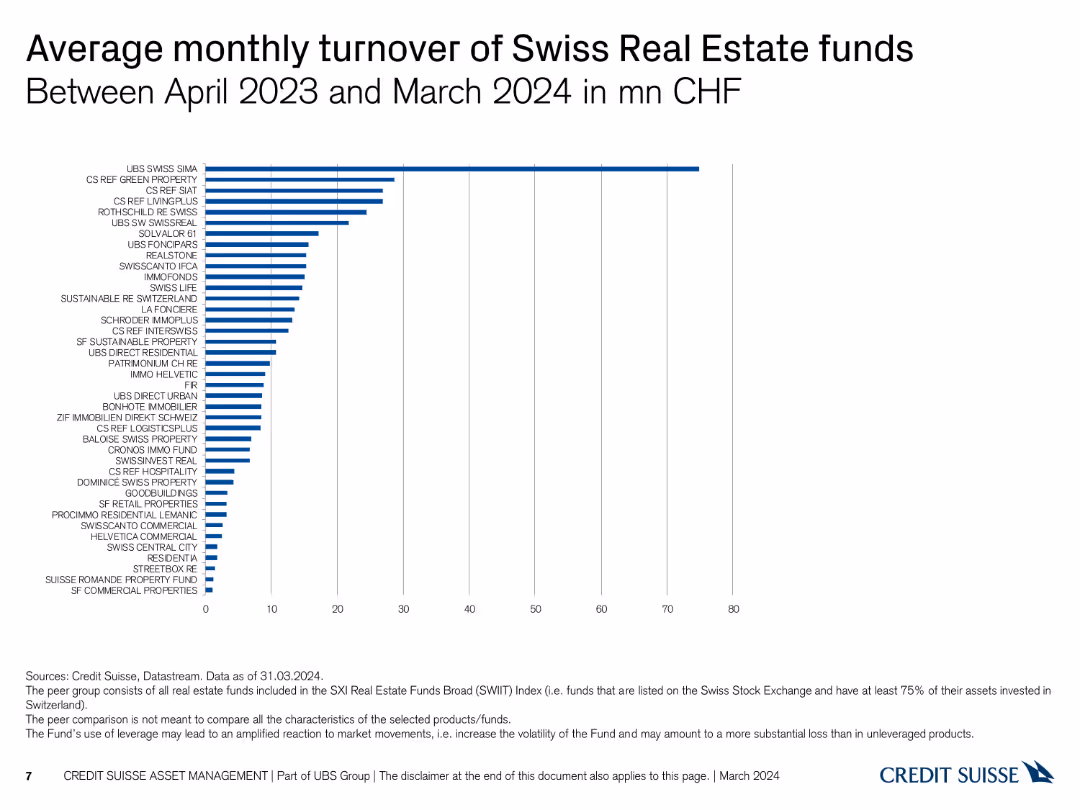
The slide displays a column chart illustrating the average monthly turnover in CHF for various Swiss Real Estate funds between April 2023 and March 2024, with bars in blue.
Financial Performance
Real Estate & Construction
This slide shows the average monthly turnover of different Swiss Real Estate funds, helping to analyze liquidity and fund performance over the specified period.
turnover, real estate, average, monthly, funds
false
Financial Performance
Real Estate & Construction
Single Chart
Credit Suisse
Add to my slides
Remove from favorites
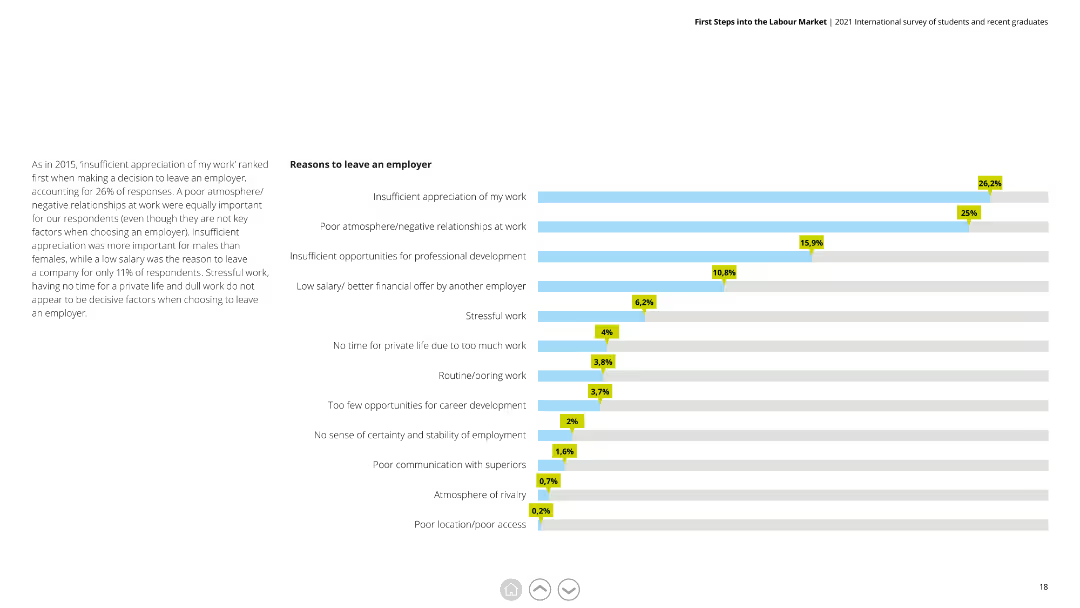
A horizontal bar chart (bar chart) indicating reasons for leaving an employer, with bars representing percentages for each reason.
Market Analysis and Trends
Professional Services
Identifies top reasons for employee turnover, such as insufficient appreciation, poor work atmosphere, and lack of professional development opportunities.
Turnover, Reasons, Employer, Appreciation, Atmosphere, Professional Development, Survey
false
Market Analysis and Trends
Professional Services
Mixed Chart
Deloitte
Add to my slides
Remove from favorites
A multi-line graph comparing revenue against media spend in different channels, emphasizing superior returns from TV advertising with numbered key insights.
Investment Analysis
Media & Entertainment
Focuses on the comparative ROI from various media channels, particularly highlighting the efficiency of TV advertising in generating higher returns.
TV advertising, media channels, ROI, investment returns, comparative analysis
false
Investment Analysis
Media & Entertainment
Mixed Chart
Accenture
Add to my slides
Remove from favorites
Slide displays column charts comparing global and Indian TV advertising revenues from 2020 to 2025, noting significant growth in India.
Market Analysis and Trends
Media & Entertainment
Discusses the global and Indian growth rates in TV advertising revenues, projecting strong future growth, especially in India.
TV advertising, revenue growth, India, global market, 2025 forecast, advertising industry
false
Market Analysis and Trends
Media & Entertainment
Multiple Chart
PwC/Strategy&
Add to my slides
Remove from favorites
A pie chart illustrating the percentage of U.S. TV screen consumption hours by category in January 2022. The chart includes segments for Streaming, Cable, Broadcast, and Other, with additional breakdowns for specific streaming services.
Market Analysis and Trends
Media & Entertainment
This slide depicts the share of TV screen consumption hours in the U.S. for January 2022, showing that streaming accounts for 29% of total consumption. It includes detailed percentages for major streaming platforms like Netflix, YouTube, Hulu, and others.
TV consumption, streaming, market share, U.S. TV, January 2022
false
Market Analysis and Trends
Media & Entertainment
Single Chart
Nielsen
Add to my slides
Remove from favorites
Displays a series of column charts with the central red column highlighting a 23% increase in sales ROI for TV, contrasted with other media channels showing a decrease or less increase.
Market Analysis and Trends
Media & Entertainment
Analyzes the impact of attributing sales ROI to specific media channels, with a focus on the significant increase seen in TV media spend.
TV media, sales ROI, media channels, attributed returns, increase
false
Market Analysis and Trends
Media & Entertainment
Single Chart
Accenture
Add to my slides
Remove from favorites
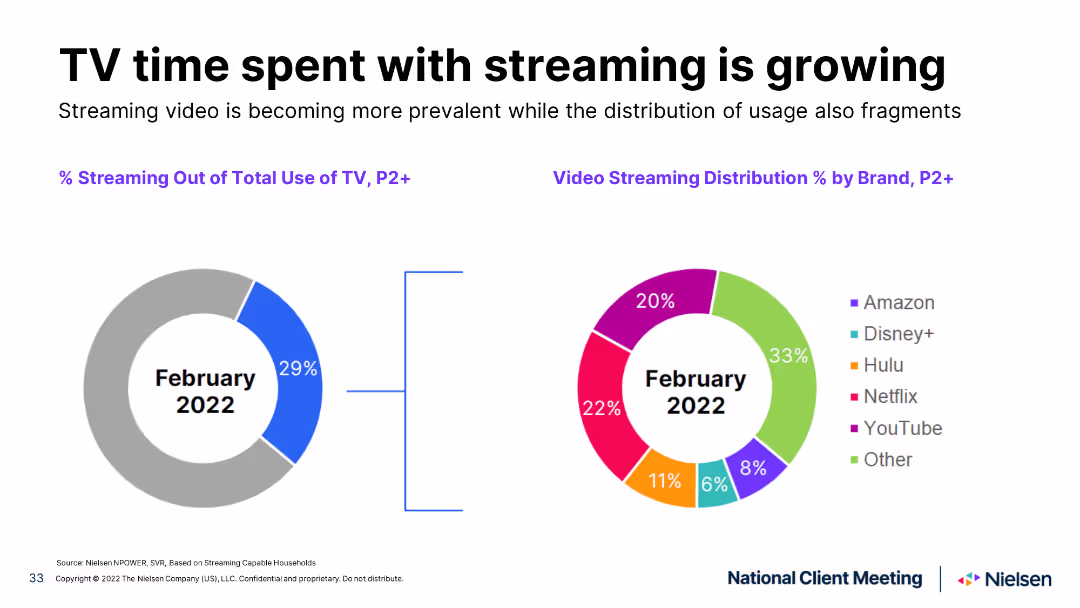
Pie chart slide comparing the percentage of TV time spent streaming in February 2021 and February 2022, with distinct color segments for different streaming services.
Market Analysis and Trends
Media & Entertainment
Compares the growth in TV streaming time over a year, showing an increase in streaming's share and the distribution across various services.
TV streaming, growth, comparison, streaming services, time spent
false
Market Analysis and Trends
Media & Entertainment
Multiple Chart
Nielsen
Add to my slides
Remove from favorites
Pie chart slide showing the percentage of TV time spent streaming in February 2021 and February 2022, with distinct color segments for different streaming services.
Market Analysis and Trends
Media & Entertainment
Illustrates the increase in TV streaming time and the changing distribution among streaming services over a year, highlighting trends.
TV streaming, growth, comparison, streaming services, trends
false
Market Analysis and Trends
Media & Entertainment
Multiple Chart
Nielsen
Add to my slides
Remove from favorites
A stacked column chart showing total TV reach composition by viewing source and ad model for P2+ over a year, highlighting a shift away from linear TV.
Market Analysis and Trends
Media & Entertainment
The slide illustrates a 10% year-over-year increase in viewers not tuning into any form of linear TV, with AVOD becoming more complementary to SVOD consumption.
TV, viewers, linear TV, AVOD, SVOD
false
Market Analysis and Trends
Media & Entertainment
Mixed Chart
Nielsen
Add to my slides
Remove from favorites
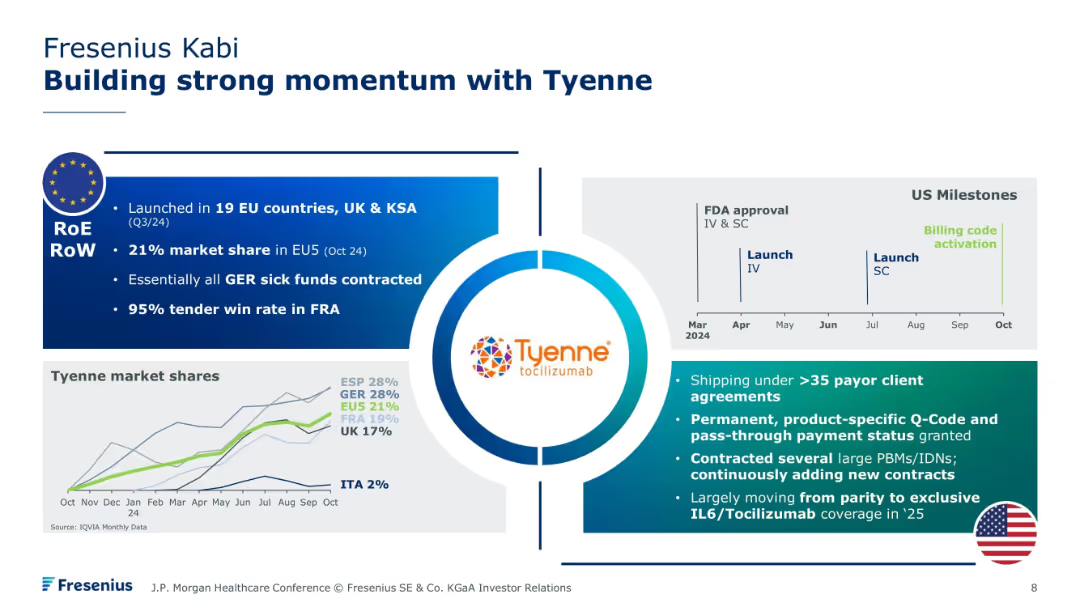
Centered logo with four surrounding blocks detailing regional launches, market shares, US milestones, and payer agreements. Includes small timeline and market share chart at bottom.
Sales and Business Development
Healthcare & Pharmaceuticals
Focuses on the rollout of Tyenne (tocilizumab), including European and U.S. market entry. Details regulatory milestones, growing payer adoption, and market share penetration across EU countries. Emphasizes expansion into exclusive contracts and favorable reimbursement terms.
Tyenne, tocilizumab, biosimilar launch, payer access, market share, Fresenius, EU launch
false
Sales and Business Development
Healthcare & Pharmaceuticals
Mixed Chart
JP Morgan
Add to my slides
Remove from favorites
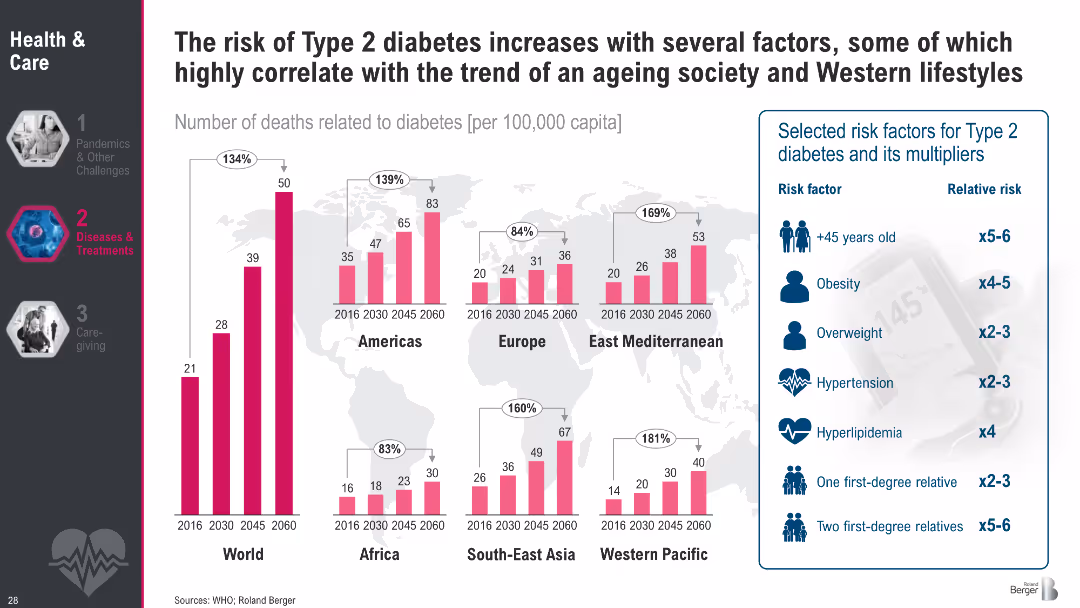
Regional bar charts showing diabetes death rates (2016–2060); sidebar lists key risk factors with relative risks
Risk Assessment and Management
Healthcare & Pharmaceuticals
This slide illustrates the correlation between Type 2 diabetes mortality and contributing risk factors such as age, obesity, and hypertension. It highlights regional trends and emphasizes how modern lifestyles amplify diabetes risk.
Type 2 diabetes, obesity, aging, risk factors, hypertension, mortality, lifestyle diseases, public health, metabolic disorders
false
Risk Assessment and Management
Healthcare & Pharmaceuticals
Multiple Chart
Roland Berger
Add to my slides
Remove from favorites
Displays a comparison of H2 vessel types by application and geography for 2023 and 2030, highlighting the expected dominance of Type IV vessels.
Technology and Digital Transformation
Energy & Utilities
Discusses the anticipated dominance of Type IV H2 vessels by 2030, focusing on their application in mobility and infrastructure and various pressure levels.
Type IV vessels, H2 storage, dominance, application, geography, mobility, infrastructure, pressure levels, 2030
false
Technology and Digital Transformation
Energy & Utilities
Table
Roland Berger
Add to my slides
Remove from favorites
This slide presents column charts showing Tyson's core product volume growth compared to the overall food and beverage market. The charts use shades of blue to signify Tyson's performance, contrasting with gray for the total market, effectively highlighting the differences.
Market Analysis and Trends
Agriculture & Food Production
Focuses on Tyson's significant volume growth within its core product range over several fiscal years, compared to the general food and beverage market. It aims to highlight Tyson's market strength and successful product performance, which may interest investors or business analysts evaluating industry leaders.
Tyson, Market Growth, Volume, Food, Beverage, Analysis
false
Market Analysis and Trends
Agriculture & Food Production
Single Chart
Barclays
Add to my slides
Remove from favorites
Standard layout with left-aligned narrative, center chart, and right-side quote. Color scheme and formatting match regional series.
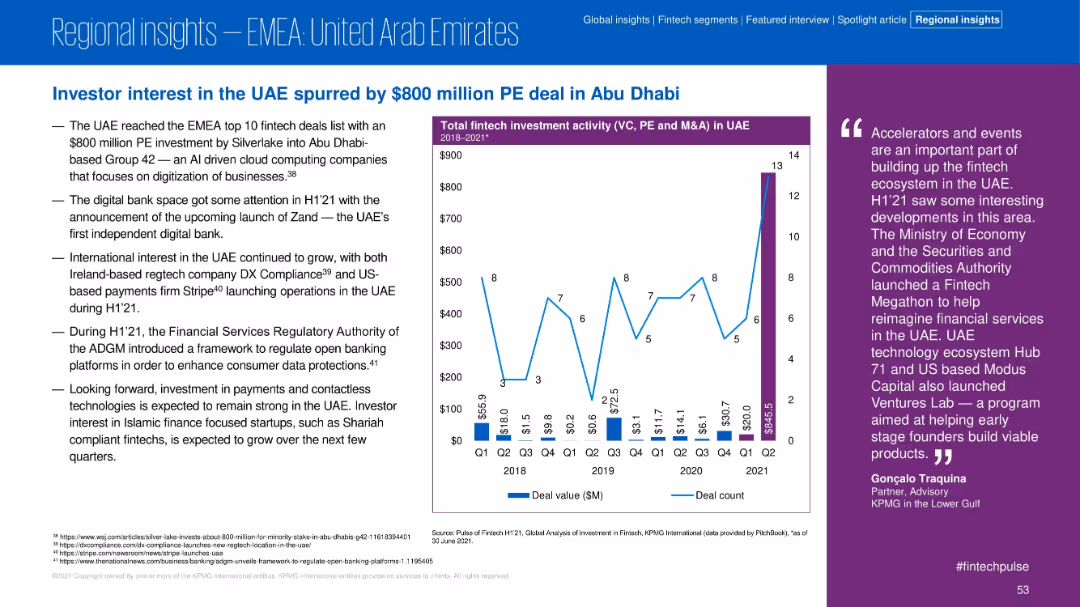
Investment Analysis
Financial Services
The UAE fintech market was boosted by an $800M PE deal in H1 2021. The slide highlights the growth of digital banks, international fintech activity, and regulatory frameworks enhancing consumer protections.
UAE, PE Deal, Fintech, Abu Dhabi, Digital Bank, Investment, Regulation, H1 2021
false
Investment Analysis
Financial Services
Mixed Chart
KPMG
Add to my slides
Remove from favorites
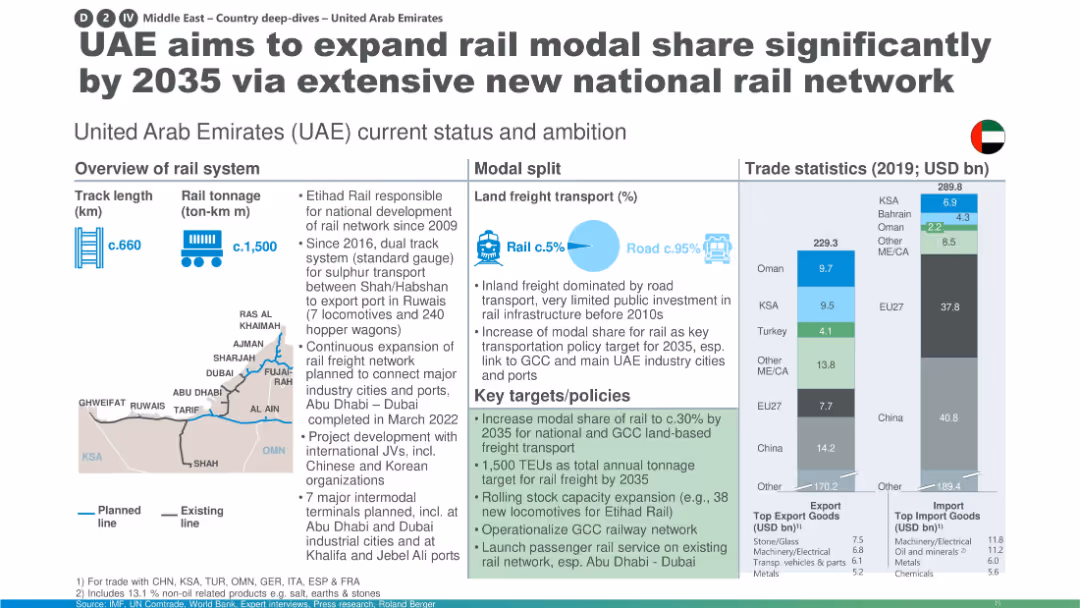
Visual includes rail system map, infrastructure data, modal split, trade statistics, and targets.
Strategic Planning
Transportation & Logistics
The slide explains UAE’s strategy to grow rail's share of freight transport through the Etihad Rail project. It shows the current road-heavy modal split and outlines infrastructure expansion, capacity goals, and regional integration efforts.
UAE rail, Etihad Rail, modal share, freight targets, transport infrastructure, trade stats, GCC integration, intermodal terminals
false
Strategic Planning
Transportation & Logistics
Multiple Chart
Roland Berger
Add to my slides
Remove from favorites
The slide contains a column chart showing 2023 issuances and redemptions along with a detailed table listing various bonds, their ISIN, instrument type, currency, and other metrics.
Financial Performance
Financial Services
This slide presents data on UBS's bond issuances and redemptions for 2023, detailing instrument types, currencies, and financial metrics, aimed at financial analysis.
UBS, 2023 issuances, bonds, financial metrics, redemptions
false
Financial Performance
Financial Services
Mixed Chart
UBS
Add to my slides
Remove from favorites
The slide includes a column chart of 2023 redemptions alongside a comprehensive table showing bond details, including ISIN, instrument type, currency, notional amounts, and maturity dates.
Financial Performance
Financial Services
This slide provides an overview of bond redemptions by UBS in 2023, detailing instrument types, currencies, and financial metrics, useful for financial analysis and reporting.
UBS, 2023 redemptions, bonds, financial metrics, maturity dates
false
Financial Performance
Financial Services
Mixed Chart
UBS
Add to my slides
Remove from favorites
Displays a balance sheet with vertical column charts of assets and liabilities as of Q4 2023, along with a coverage ratio indicator.
Financial Performance
Financial Services
Presents UBS Group AG's balance sheet for Q4 2023, detailing various asset and liability components and the overall coverage ratio.
UBS, balance sheet, assets, liabilities, coverage ratio, financial, performance, Q4 2023, analysis
false
Financial Performance
Financial Services
Multiple Chart
UBS
Add to my slides
Remove from favorites
The slide features text and icons representing different client segments and services offered. Sections provide details on corporate and personal banking.
Strategic Planning
Financial Services
This slide describes UBS's balanced mix of personal and corporate banking, highlighting the client base and services offered.
UBS, Banking, Client Segments, Services, Strategic Planning
false
Strategic Planning
Financial Services
Multiple Chart
UBS
Add to my slides
Remove from favorites
Features two vertical column charts displaying issuances and redemptions from 2023-2027+, alongside a list of recent funding activities.
Investment Analysis
Financial Services
Analyzes UBS Group AG's capital market activities, including bond issuances and redemptions, funding plans, and strategies for future issuances.
UBS, bonds, issuances, redemptions, funding, capital markets, investment, diversification, maturity
false
Investment Analysis
Financial Services
Mixed Chart
UBS
Add to my slides
Remove from favorites
This slide features two vertical column charts. The left chart shows UBS Group AG capital development from 2023-2026, with different capital components.
Financial Performance
Financial Services
Discusses UBS Group AG's strong capital position, future CET1 ratios, funding cost savings, and expected capital ratios post-Credit Suisse merger.
UBS, capital, CET1, funding, Credit Suisse, ratios, development, financial, performance, bank
false
Financial Performance
Financial Services
Multiple Chart
UBS
Add to my slides
Remove from favorites
Three vertical column charts showing CET1 capital development, risk-weighted assets, and leverage ratio denominator for Q3-Q4 2023.
Financial Performance
Financial Services
Analyzes UBS Group AG's CET1 capital changes, risk-weighted assets, and leverage ratio denominator, providing insights into financial health.
UBS, CET1, capital, RWA, LRD, risk-weighted assets, leverage ratio, financial health, analysis
false
Financial Performance
Financial Services
Multiple Chart
UBS
Add to my slides
Remove from favorites
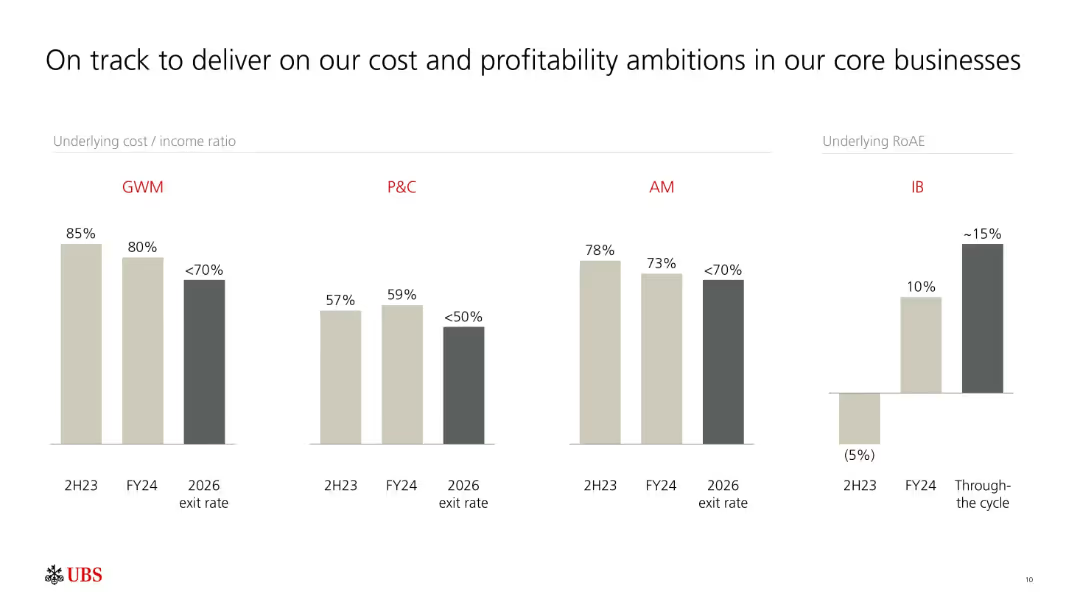
Multiple grouped bar charts comparing cost/income ratios and RoAE across business units (GWM, P&C, AM, IB). Color-coded by year and projection.
Performance Metrics and KPIs
Financial Services
Provides an overview of UBS’s progress in lowering cost/income ratios and improving RoAE across core business units. Forecasts continued improvement by 2026, aiming for sustainable profitability.
UBS, cost-income ratio, RoAE, profitability, core business, GWM, P&C, AM, IB, projections
false
Performance Metrics and KPIs
Financial Services
Single Chart
UBS
Add to my slides
Remove from favorites
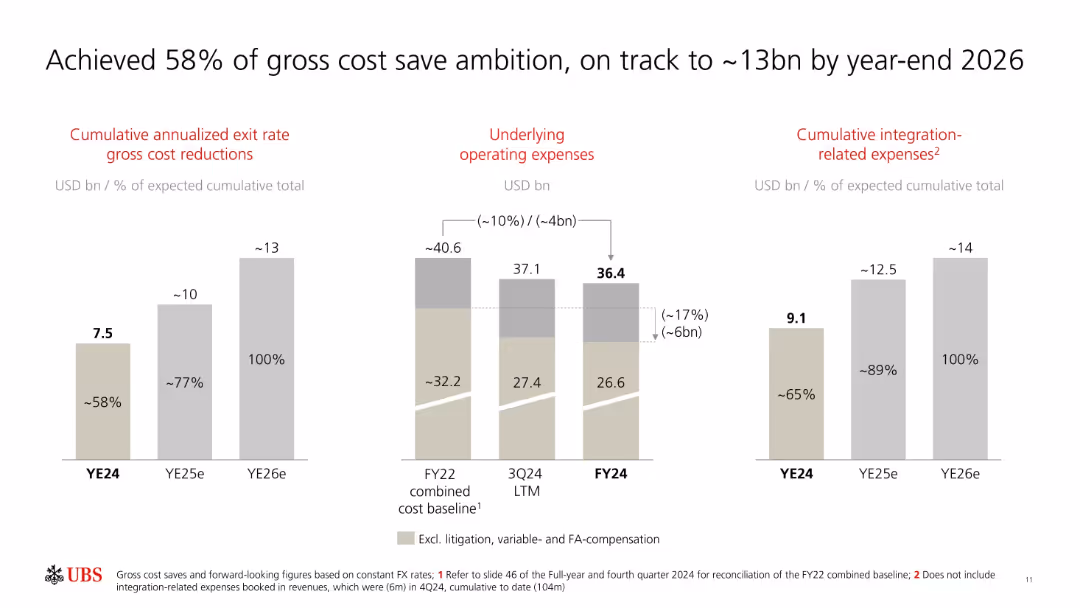
Three sets of vertical bar charts for cumulative cost savings, operating expenses, and integration-related costs. Data is shown by year.
Operational Efficiency
Financial Services
UBS reports achieving 58% of its cost save target by YE24 and projects reaching 13bn in savings by YE26. The slide details declines in operating expenses and outlines cumulative integration costs.
UBS, cost savings, integration, operating expenses, YE24, YE26, targets, financial strategy, efficiency
false
Operational Efficiency
Financial Services
Multiple Chart
UBS
Add to my slides
Remove from favorites
Comparison table of credit ratings for holding companies from Moody’s, S&P, and Fitch as of February 2024.
Competitive Landscape
Financial Services
Compares credit ratings of holding companies, highlighting UBS's position relative to other financial institutions.
UBS, credit ratings, holding company, Moody’s, S&P, Fitch, competitive, landscape, financial
false
Competitive Landscape
Financial Services
Table
UBS
Add to my slides
Remove from favorites
Features a comparison table of credit ratings from Moody’s, S&P, and Fitch for various banks as of February 2024.
Competitive Landscape
Financial Services
Compares long-term senior unsecured debt credit ratings of UBS and its peers across major rating agencies.
UBS, credit ratings, peer comparison, Moody’s, S&P, Fitch, competitive, landscape, debt
false
Competitive Landscape
Financial Services
Table
UBS
Add to my slides
Remove from favorites
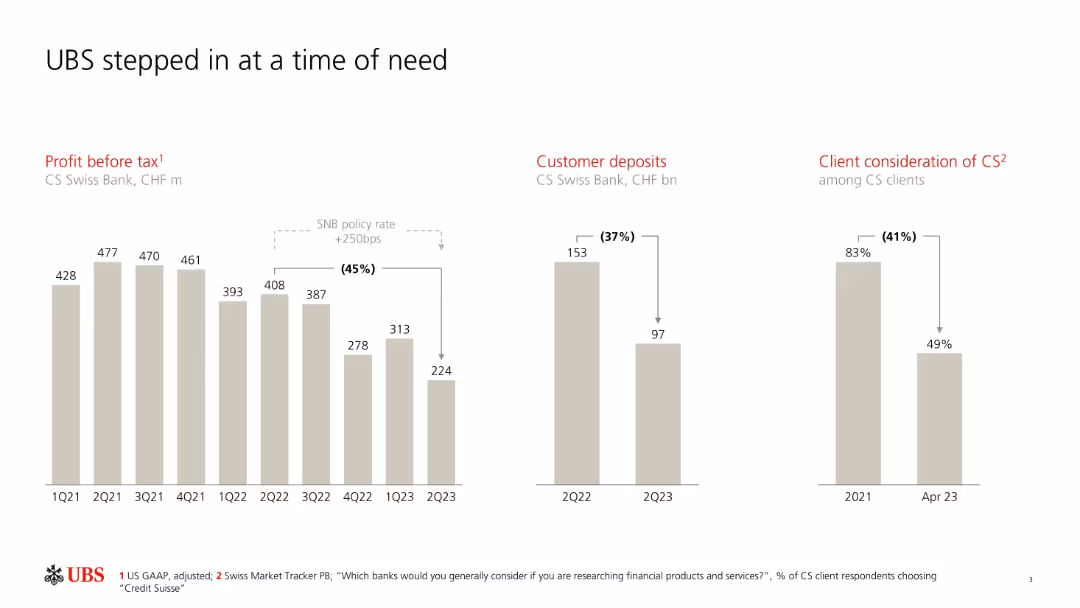
Three-panel layout; bar charts on profit before tax, customer deposits, and client consideration.
Client Case Studies
Financial Services
The slide depicts Credit Suisse's decline in profitability, customer deposits, and client trust leading up to UBS’s intervention. It emphasizes steep declines during 2022–2023 and underscores UBS's role in stabilizing the situation.
UBS, Credit Suisse, customer deposits, client trust, acquisition, Swiss bank, profit before tax
false
Client Case Studies
Financial Services
Multiple Chart
UBS
Add to my slides
Remove from favorites
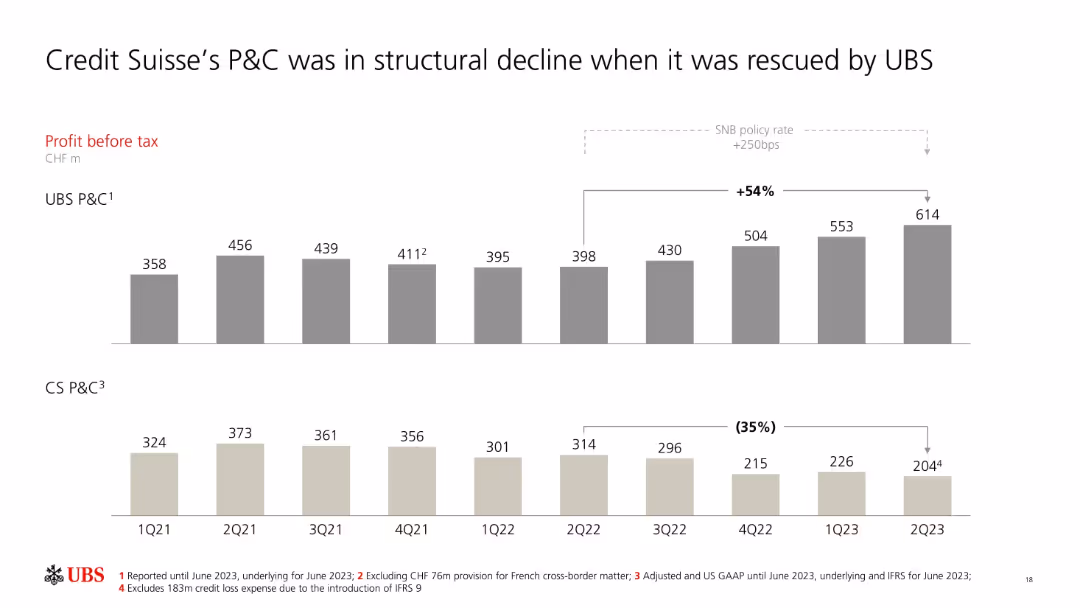
Dual bar chart comparing UBS and CS P&C profit before tax over 9 quarters.
Client Case Studies
Financial Services
The chart shows diverging performance trends between UBS and CS in their P&C segments. UBS’s profits rose steadily while CS experienced a 35% decline, emphasizing the rationale for UBS’s acquisition and integration efforts.
UBS, CS, profit before tax, P&C, structural decline, acquisition, integration, financial performance
false
Client Case Studies
Financial Services
Multiple Chart
UBS
Add to my slides
Remove from favorites
Three pie charts showing UBS Group's deposit base composition by type, currency, and client segment as of Q3 2023.
Customer and Market Segmentation
Financial Services
Analyzes UBS Group's diversified deposit base, including types of deposits, currency distribution, and client segments.
UBS, deposits, diversification, type, currency, client segment, analysis, composition, market
false
Customer and Market Segmentation
Financial Services
Multiple Chart
UBS
Add to my slides
Remove from favorites
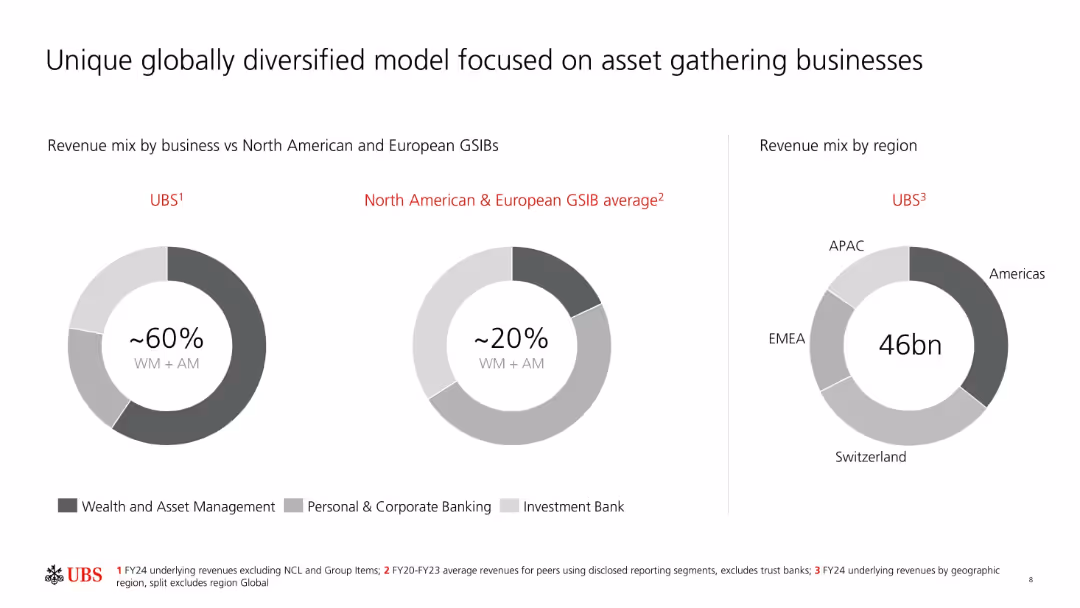
Three donut charts showing revenue mix by business and region, comparing UBS to GSIB averages. Minimalist design with gray tones.
Market Analysis and Trends
Financial Services
Compares UBS’s business model and revenue composition to GSIB averages, emphasizing UBS's 60% revenue share from wealth & asset management. The regional revenue breakdown highlights UBS’s global reach and diversified model.
UBS, diversification, revenue mix, GSIB, asset management, investment banking, APAC, EMEA, Americas
false
Market Analysis and Trends
Financial Services
Single Chart
UBS
Add to my slides
Remove from favorites
Side-by-side bar comparisons of guidance vs. actual for RoCET1, cost saves, RWA, and CET1 ratio. Gray and black color scheme with red highlights.
Strategic Planning
Financial Services
Highlights UBS’s outperformance of 2024 financial targets, including higher RoCET1 (8.7% vs. mid-single digit) and lower RWAs. It underscores efficient cost saving and a CET1 ratio exceeding guidance.
UBS, execution, RoCET1, CET1 ratio, cost savings, RWA, financial performance, FY24, guidance vs actual
false
Strategic Planning
Financial Services
Single Chart
UBS
Add to my slides
Remove from favorites
Three pie charts represent funding sources, remaining maturities, and funding by currency for UBS Group in Q4 2023.
Strategic Planning
Financial Services
Details UBS Group's funding diversification strategy, highlighting sources of funds, maturity timelines, and currency breakdowns.
UBS, funding, diversification, sources, maturity, currency, strategy, wholesale, financial
false
Strategic Planning
Financial Services
Multiple Chart
UBS
Add to my slides
Remove from favorites
This slide features a detailed hierarchical diagram outlining the planned changes to legal entities within UBS Group AG. The visual includes parent-child relationships between entities with labels.
Organizational Structure and Change
Financial Services
The slide explains the merger and restructuring of UBS Group AG's legal entities across various regions, including Switzerland, EU, UK, and the US, highlighting the simplification process.
UBS Group AG, legal entity changes, restructuring, financial services, merger
false
Organizational Structure and Change
Financial Services
Diagram
UBS
Add to my slides
Remove from favorites
Detailed organizational structure diagram showing the hierarchy and relationship between UBS Group AG and its subsidiaries. Simple color scheme and layout for clarity.
Organizational Structure and Change
Financial Services
Shows the merger plan of Credit Suisse AG into UBS AG in 2024, detailing the structure and entities involved as of 30 September 2023.
UBS, Group Structure, Credit Suisse, Merger, Subsidiaries
false
Organizational Structure and Change
Financial Services
Diagram
UBS
Add to my slides
Remove from favorites
The slide features a mix of text and icons illustrating growth strategies. Sections discuss personal banking, digital capabilities, and corporate clients.
Strategic Planning
Financial Services
This slide outlines UBS's strategies for driving efficient growth, focusing on client acquisition, digital capabilities, and market expertise.
UBS, Growth, Strategy, Digital Capabilities, Client Acquisition
false
Strategic Planning
Financial Services
Linear Flow
UBS
Add to my slides
Remove from favorites
Three-column layout: infographic on left, PBT margin bar chart in center, and key levers on right. Red headings and grayscale bars.
Sales and Business Development
Financial Services
Focuses on UBS’s GWM Americas business, showing consistent PBT margin growth potential from FY24 to FY28e. Lists key strategic levers like HNW growth, infrastructure, and ROI-driven tech investments.
UBS, GWM Americas, profitability, PBT margin, high-net-worth, growth strategy, advisory, assets, FY28
false
Sales and Business Development
Financial Services
Mixed Chart
UBS
Add to my slides
Remove from favorites
Features a vertical column chart depicting liquidity coverage ratio and a text box outlining liquidity management strategies and goals.
Risk Assessment and Management
Financial Services
Discusses UBS Group AG's liquidity coverage ratio, efficiency, safety, and strategies to meet stringent Swiss liquidity requirements.
UBS, liquidity, coverage ratio, efficiency, safety, funding, management, requirements, Swiss
false
Risk Assessment and Management
Financial Services
Mixed Chart
UBS
Add to my slides
Remove from favorites
The slide showcases a structured diagram highlighting UBS's liquidity and funding framework, including stress testing, regulatory requirements, governance, and contingency planning.
Risk Assessment and Management
Financial Services
This slide outlines UBS's liquidity and funding risk management framework, detailing regulatory requirements, stress testing scenarios, and governance structures for financial stability.
UBS, liquidity, funding, risk management, regulatory requirements
false
Risk Assessment and Management
Financial Services
Framework
UBS
Add to my slides
Remove from favorites
Pie chart of UBS Group's loan and advance composition, and a text box detailing various loan categories and their respective amounts.
Product and Service Analysis
Financial Services
Overview of UBS Group AG's loan portfolio, including mortgages, Lombard loans, corporate loans, and other loans with specific details.
UBS, loans, portfolio, mortgages, Lombard, corporate, analysis, high-quality, financial
false
Product and Service Analysis
Financial Services
Mixed Chart
UBS
Add to my slides
Remove from favorites
Three vertical bar chart sections showing complexity reduction, operating expenses, and RWA declines. Large numeric callouts and brief annotations.
Operational Efficiency
Financial Services
Highlights UBS’s progress in reducing non-core and legacy (NCL) complexity, operating expenses, and risk-weighted assets. Includes targets for FY25 and YE26 and progress on IT decommissioning and book closures.
UBS, NCL, run-down, complexity, RWA, operating expenses, FY25, YE26, decommissioning, risk management
false
Operational Efficiency
Financial Services
Multiple Chart
UBS
Add to my slides
Remove from favorites
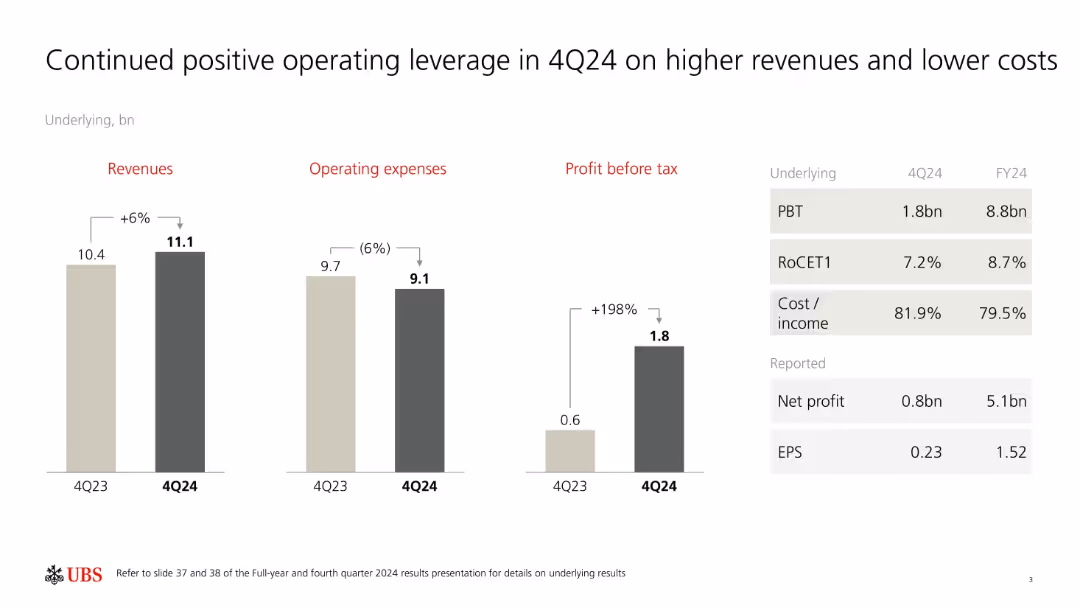
Three-bar chart clusters comparing 4Q23 vs. 4Q24 for revenues, operating expenses, and profit before tax. Supplemented by a data table on the right.
Financial Performance
Financial Services
Demonstrates improved operating leverage for UBS in Q4 2024, driven by a 6% revenue increase and a 6% cost reduction. Profit before tax jumped 198% YoY. Also shows reported net profit and EPS alongside return metrics.
UBS, operating leverage, 4Q24, revenue growth, cost reduction, profit before tax, EPS, RoCET1, cost-income
false
Financial Performance
Financial Services
Mixed Chart
UBS
Add to my slides
Remove from favorites
The slide contains a circular diagram illustrating partnerships and areas of collaboration. Text sections describe client types and collaborative services.
Strategic Planning
Financial Services
This slide emphasizes UBS's partnership approach, detailing various client types and areas of collaboration to deliver comprehensive services.
UBS, Partnerships, Collaboration, Client Services, Strategy
false
Strategic Planning
Financial Services
Diagram
UBS
Add to my slides
Remove from favorites
Column charts showing various financial results including net profit, profit before tax, negative goodwill, and integration expenses for 2Q23.
Financial Performance
Financial Services
Presents the financial results for UBS Group in 2Q23, highlighting profits, tax implications, and restructuring costs from the Credit Suisse acquisition.
UBS, profit, tax, goodwill, integration
false
Financial Performance
Financial Services
Single Chart
UBS
Add to my slides
Remove from favorites
The slide displays column charts comparing income splits and ambition targets. Text sections detail revenue growth strategies and income projections.
Financial Performance
Financial Services
This slide highlights UBS's strategies for growing revenues, emphasizing the importance of recurring and transaction income and future income projections.
UBS, Revenue Growth, Income, Strategy, Financial Projections
false
Financial Performance
Financial Services
Multiple Chart
UBS
Add to my slides
Remove from favorites
Column chart showing RoCET1 progression from FY22 to FY28e with cost/income ratios labeled above. Monochromatic beige and gray tones.
Strategic Planning
Financial Services
Tracks UBS’s RoCET1 from 17% in FY22 to a projected 18% in FY28. Emphasizes recovery from a dip in 2H23 and the role of integration in supporting long-term sustainable growth and lower cost/income ratios.
UBS, RoCET1, integration, growth, profitability, FY28, cost/income, return on capital, financial forecast
false
Strategic Planning
Financial Services
Single Chart
UBS
Add to my slides
Remove from favorites
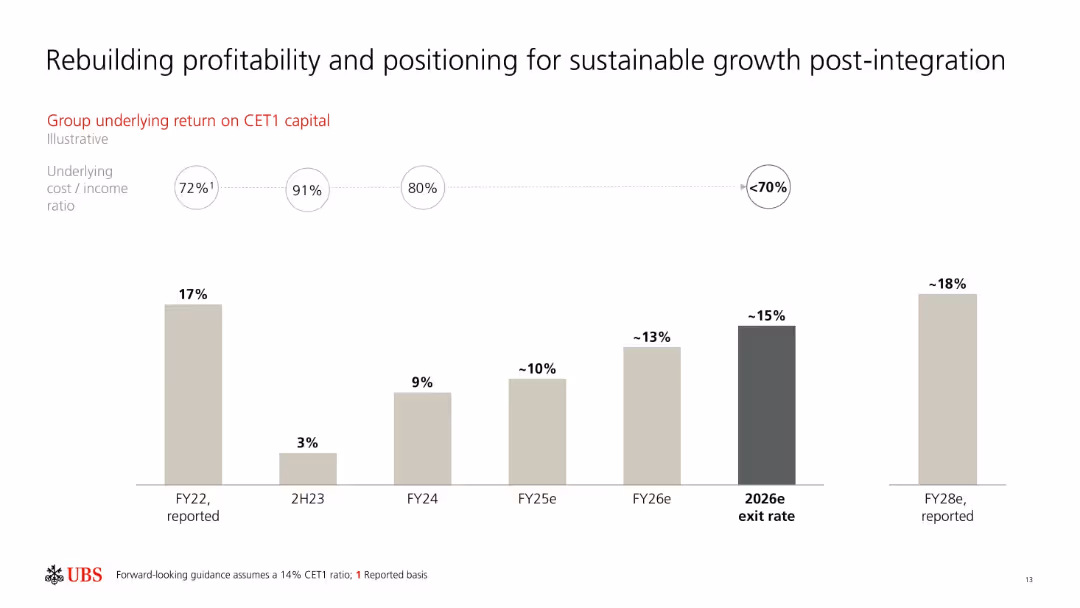
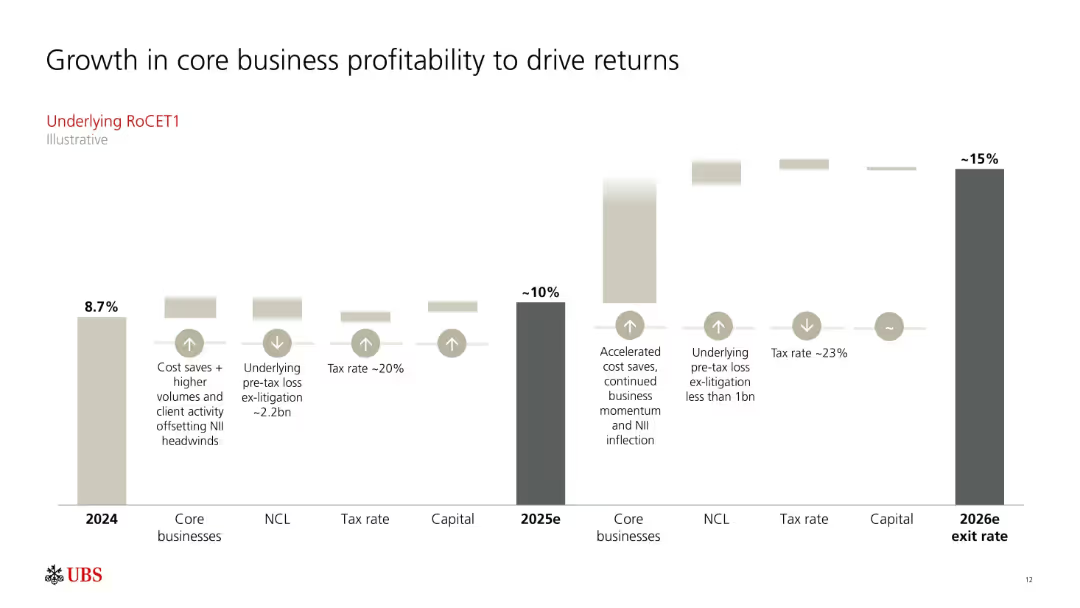
Waterfall-style chart projecting RoCET1 progression from 2024 (8.7%) to 2026 (~15%) exit rate with factors contributing to growth.
Strategic Planning
Financial Services
Illustrates UBS’s planned increase in underlying RoCET1 to ~15% by 2026 through core business growth, cost savings, and tax management. Each driver is annotated with expected quantitative and qualitative impacts.
UBS, RoCET1, profitability, growth drivers, core business, tax rate, financial return, 2026 projection
false
Strategic Planning
Financial Services
Single Chart
UBS
Add to my slides
Remove from favorites
The slide features comparative metrics such as GDP per capita, exports, public debt, and gross financial assets per capita. Text sections highlight UBS's market leadership in personal and corporate banking.
Industry Overview
Financial Services
This slide emphasizes UBS's leadership position in Switzerland's banking sector, supported by key financial metrics and market share data.
UBS, Switzerland, Banking, Market Leader, Financial Metrics
false
Industry Overview
Financial Services
Mixed Chart
UBS
Add to my slides
Remove from favorites
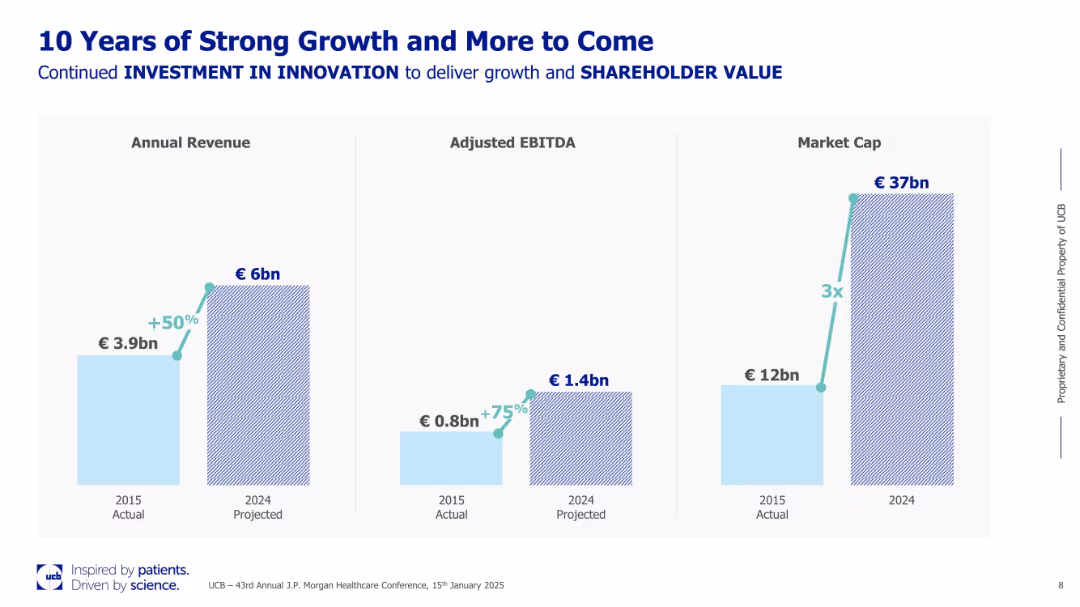
Clean, three-panel layout with bar charts for Annual Revenue, Adjusted EBITDA, and Market Cap from 2015 to 2024. Uses blue and teal color scheme. Title emphasizes innovation and shareholder value.
Financial Performance
Healthcare & Pharmaceuticals
Presents a decade of growth for UCB, showing a 50% increase in revenue, 75% rise in EBITDA, and a tripling of market cap from 2015 to 2024. The slide attributes this success to continuous innovation investment and underlines future commitment to shareholder value.
UCB, revenue growth, EBITDA, market cap, innovation, shareholder value, healthcare finances
false
Financial Performance
Healthcare & Pharmaceuticals
Single Chart
JP Morgan
Add to my slides
Remove from favorites
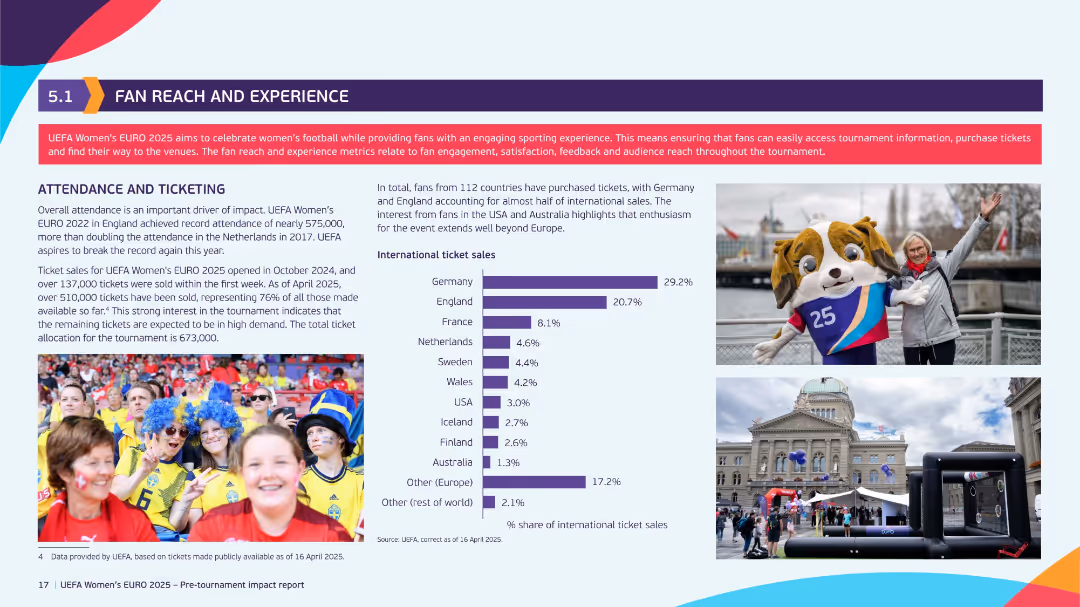
Bright, colorful layout with purple-red accents, bar chart of ticket sales by country, photos of fans and mascots, and two text columns explaining attendance and engagement.
Market Analysis and Trends
Hospitality & Tourism
Focused on UEFA Women’s EURO 2025, this slide analyzes ticket sales and fan engagement. It shows international reach (112 countries), top purchasing countries, and ticket sales statistics, highlighting the event’s global appeal and potential for high attendance.
UEFA, fan experience, ticket sales, international reach, engagement, audience metrics, event planning
false
Market Analysis and Trends
Hospitality & Tourism
Mixed Chart
EY
Add to my slides
Remove from favorites
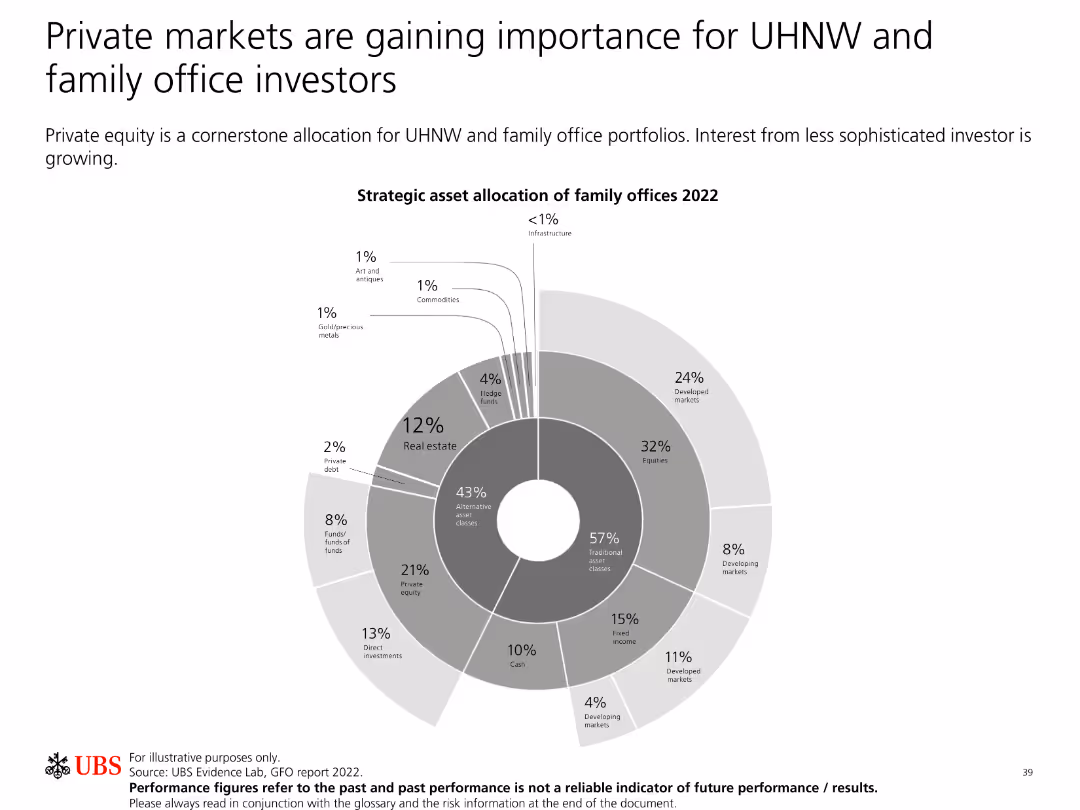
The slide features a pie chart depicting strategic asset allocation of family offices in 2022, with various segments.
Investment Analysis
Financial Services
This slide discusses the importance of private markets for ultra-high-net-worth (UHNW) and family office investors. It highlights the strategic asset allocation for 2022.
UHNW, family office, private markets, asset allocation, investment
false
Investment Analysis
Financial Services
Single Chart
UBS
Add to my slides
Remove from favorites
This slide includes a column chart showing the growth in strategic clients' revenues and a line chart demonstrating a client's journey from IPO to asset management.
Customer and Market Segmentation
Financial Services
The slide discusses strategies for growing top clients and outlines the client journey for entrepreneurs, highlighting significant growth opportunities.
UHNWI, Entrepreneurs, Client Journey, Revenue Growth, Strategic Clients
false
Customer and Market Segmentation
Financial Services
Multiple Chart
Credit Suisse
Add to my slides
Remove from favorites
Contains column charts, world map visualization.
Market Analysis and Trends
Retail & E-commerce
Focus on ultra-high-net-worth individuals' spending.
UHNWI, luxury, Americas, APAC, 2019
false
Market Analysis and Trends
Retail & E-commerce
Multiple Chart
Bain
Add to my slides
Remove from favorites
Includes flow chart, bold text for emphasis.
Market Analysis and Trends
Retail & E-commerce
Insights into personalized luxury shopping experiences.
UHNWI, personalized, luxury, digital, VIP
false
Market Analysis and Trends
Retail & E-commerce
Linear Flow
Bain
Add to my slides
Remove from favorites
The slide compares client profile and needs with the Credit Suisse one-stop-shop solution. It uses icons and text to illustrate strategic UHNW client needs and how the bank consolidates holdings, monetizes wealth, and reinvests loan proceeds.
Client Case Studies
Financial Services
The slide highlights the value Credit Suisse provides to UHNW clients by addressing their asset and liability needs, focusing on wealth investment, asset diversification, and tailored solutions for consolidating and monetizing wealth.
UHNW, wealth, consolidation, monetization, diversification
false
Client Case Studies
Financial Services
Boxed
Credit Suisse
Add to my slides
Remove from favorites
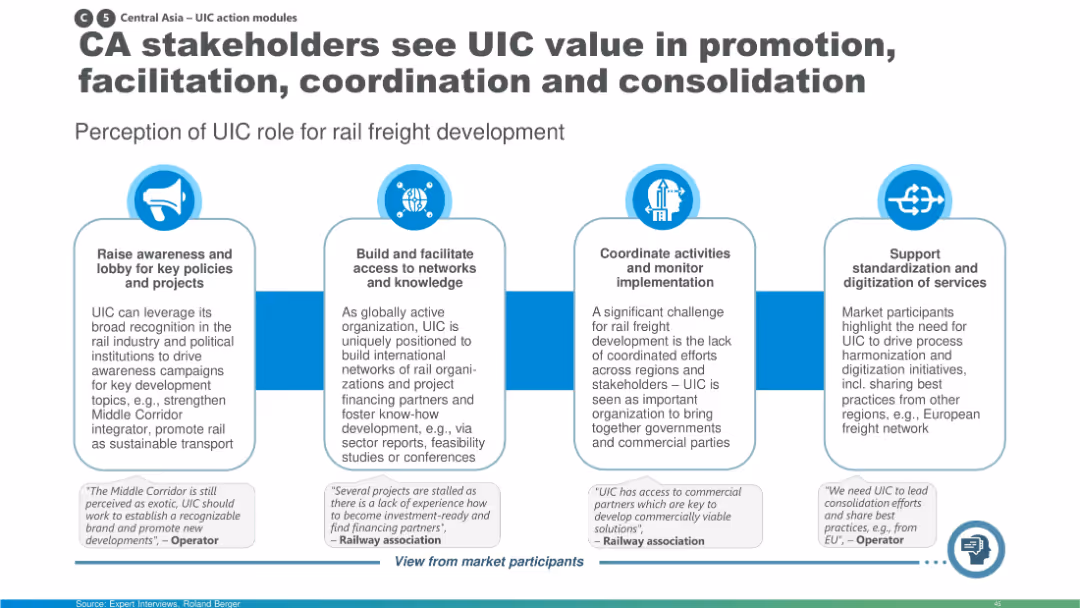
Four-column layout with icons representing actions by UIC; includes quotes from stakeholders and summary of UIC's perceived value.
Organizational Structure and Change
Transportation & Logistics
The slide presents market feedback on the role of UIC (International Union of Railways) in supporting Central Asia rail development. Stakeholders value UIC’s support in awareness-building, network access, coordination, and standardization efforts.
UIC, stakeholder input, coordination, rail development, Central Asia, rail freight
false
Organizational Structure and Change
Transportation & Logistics
Pillar
Roland Berger
Add to my slides
Remove from favorites
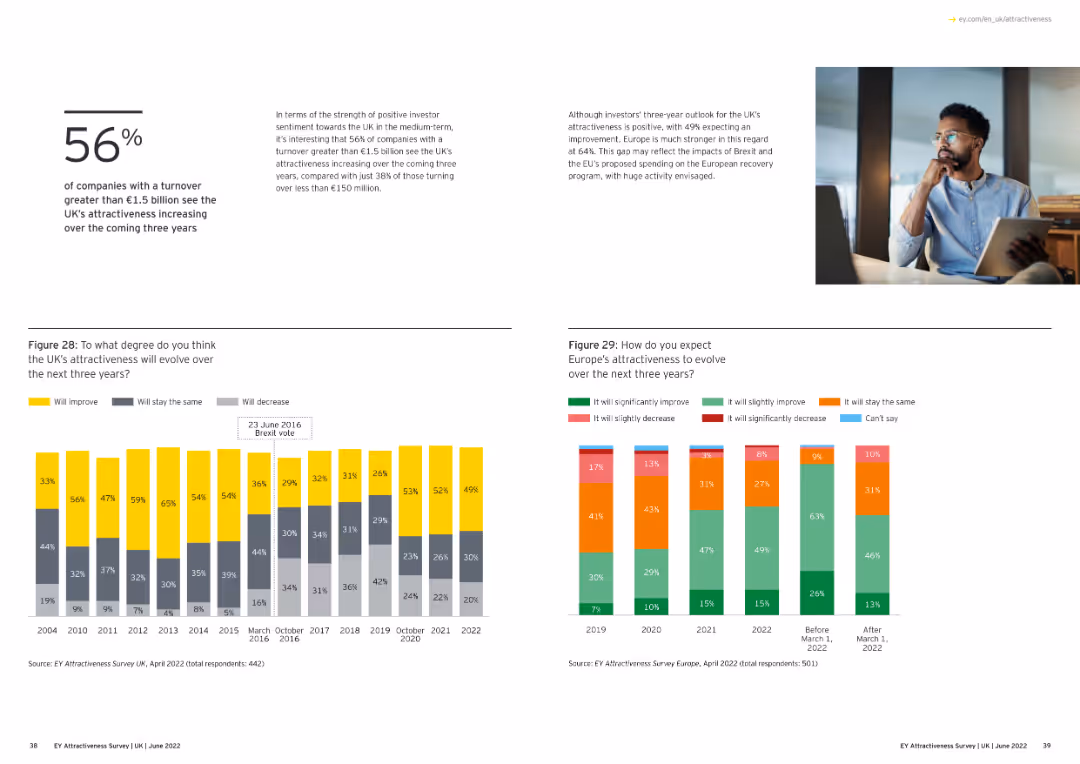
The slide contains text, a column chart, and a photo. The column chart shows data from 2010 to 2022, with yellow, gray, and black segments indicating various responses.
Market Analysis and Trends
Financial Services
The slide presents the attractiveness of the UK and Europe for investors, with detailed statistics and trends from surveys.
UK attractiveness, investor sentiment, survey, column chart, Europe
false
Market Analysis and Trends
Financial Services
Multiple Chart
EY
Add to my slides
Remove from favorites
Previous
Next
You don't have any favorites yet.
Please wait loading your favorites slides...
Create a FREE account to continue browsing
Receive Instant Access to 1,000+ slides from companies like McKinsey, Google, and Goldman Sachs
First Name
Last Name
Email
Password
I agree to all
Terms & Privacy Policy
Thank you! Your submission has been received!
Oops! Something went wrong while submitting the form.
Have an account?
Sign in
Upgrade to PRO to Save slides
Advanced Search and Filters
Access to 15,000+ slides
Access to Category Pages
Save/Bookmark Slides
PowerPoint Template Library
Pick a Plan
MONTHLY
$12/month
Billed every month, Cancel anytime.
YEARLY
$9/year
Billed $108 annually, Cancel anytime.
Checkout for $12/month
Checkout for $108/yr
Secured by Stripe | AES-256 bit encryption