My Account
My Slides
Search by Category
Pricing
Templates
View All Templates
Download Template Slides
✦ AI Search
Feedback
Login
Logout
Get Started
Browse all Slides
Browse all Slides
Create a FREE Account
Instant access to 1,000+ real slides from top companies like McKinsey, BCG, Goldman Sachs, Google and many more!
First Name
Last Name
Email
Password
I agree to all
Terms & Privacy Policy
Thank you! Your submission has been received!
Oops! Something went wrong while submitting the form.
Have an account?
Sign in
Saved Slides
Total No. of slides saved
0
↻ Refresh
✖ Clear all
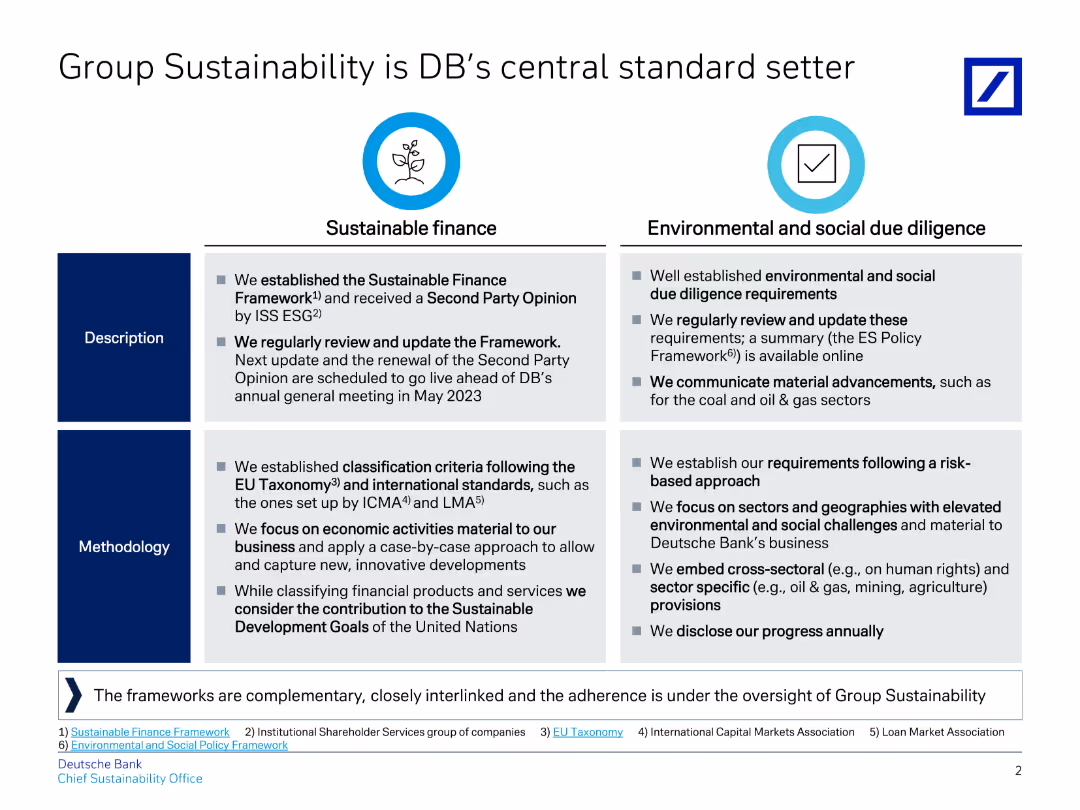
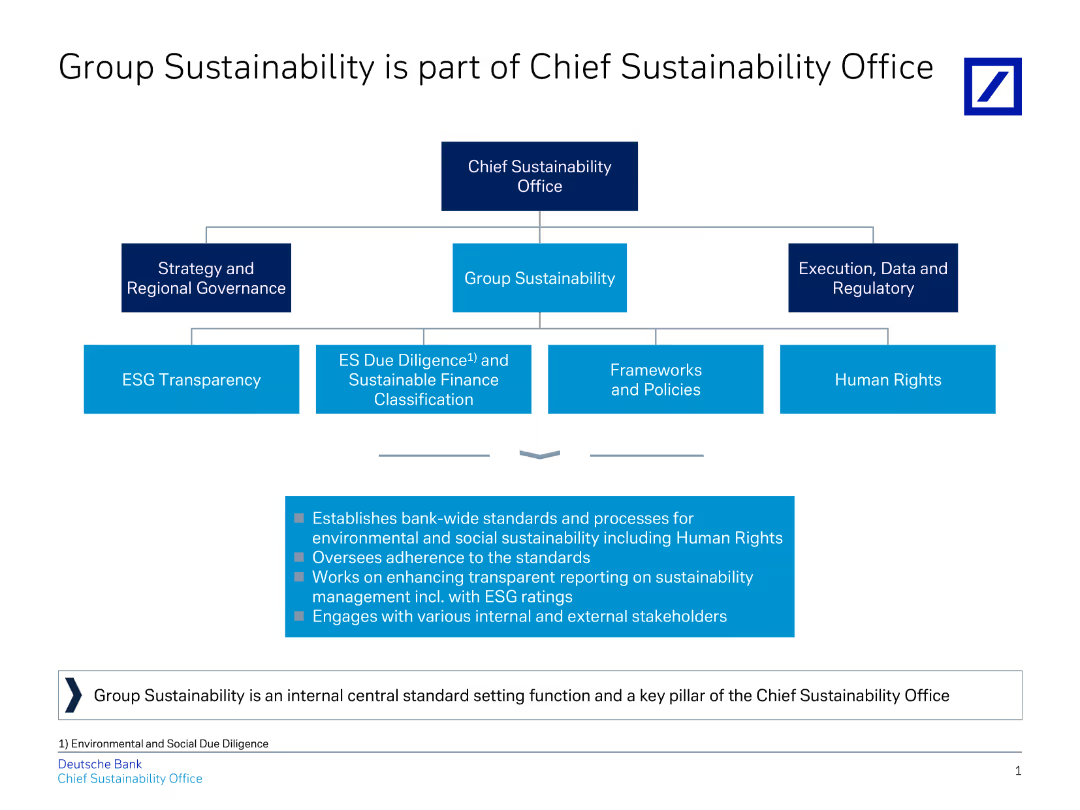
The slide features a two-column, three-row structure. Each cell contains a dark blue header, a thematic icon, and two bullet points in white font. A numerical page indicator is present in the bottom right corner.
Industry Overview
Financial Services
This slide lists nine themes central to the presenter's sustainable finance commitment. These include clean energy, sustainable transport, and accessible healthcare, among others. Each theme is supported by specific goals, like reducing energy consumption or increasing the affordability of healthcare. It's a strategic overview that can be used to communicate the company's priorities in sustainability to stakeholders or in corporate strategy meetings.
Sustainability, Finance, Healthcare, Clean Energy, Transport, Education, Community, Inclusion, Growth
false
Industry Overview
Financial Services
Table
Goldman Sachs
Add to my slides
Remove from favorites
The slide features column charts, lists with bullet points, and icons. The layout is clean with clear division between textual information and graphical data on the right.
Financial Performance
Financial Services
This slide summarizes the achievements in sustainable finance for Q4 2023, showing financial volumes in sustainable projects and detailed commitments in various financial services, aimed at enhancing sustainability. It provides an overview of strategic financial commitments, investments in renewable energy, and the inclusion of sustainability in corporate operations.
Sustainability, Finance, Renewable Energy, Corporate Strategy, Investments
false
Financial Performance
Financial Services
Mixed Chart
Deutsche Bank
Add to my slides
Remove from favorites
The slide uses a central circular graphic to show the firm's sustainable finance group structure, accompanied by lists of service offerings on either side.
Strategic Planning
Financial Services
Showcases the company's strategic approach to sustainability in finance, detailing services such as client advisory, risk management, and ESG product development, illustrating the company's commitment to integrating sustainable practices with client services.
Sustainability, Finance, Strategic Planning, Client Advisory, Risk Management, ESG
false
Strategic Planning
Financial Services
Framework
Goldman Sachs
Add to my slides
Remove from favorites
The slide is advanced, filled with both text and icons representing different aspects of sustainability. Each category such as "Addressing climate change" or "Promoting inclusion and diversity" is accompanied by relevant icons and a brief list of achievements or goals. The design is clean and organized, using the company's color scheme of blue and green to differentiate sections.
Operational Efficiency
Financial Services
This slide details the company's sustainability priorities and metrics, focusing on addressing climate change, promoting inclusion, keeping the customer at the center, demonstrating employee commitment, and community strengthening. It's used to communicate corporate social responsibility efforts and operational efficiency in these areas.
Sustainability, Inclusion, Customer Focus, Employee Commitment, Community Engagement, Environmental Goals, Diversity, Growth Metrics
false
Operational Efficiency
Financial Services
Pillar
Morgan Stanley
Add to my slides
Remove from favorites
Two column charts comparing the percentage spend on circular materials in direct and indirect categories across various percentages. Each chart is clearly labeled with scales and categories.
Product and Service Analysis
Environmental Services & Sustainability
Presents survey results assessing the inefficiency in material use, showing the percentage of spend on sustainable vs. non-sustainable materials. It highlights areas for potential improvement in sustainability practices.
Sustainability, Materials, Inefficiency, Survey, Circular Economy
false
Product and Service Analysis
Environmental Services & Sustainability
Multiple Chart
Accenture
Add to my slides
Remove from favorites
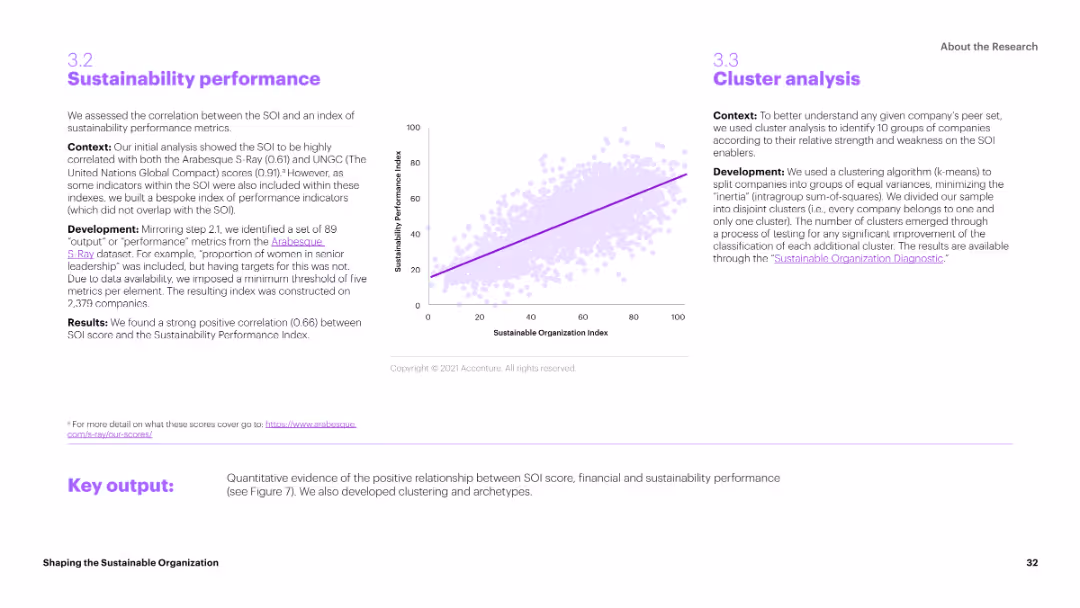
The slide includes a scatter plot correlating Sustainability Organization Index (SOI) scores with sustainability performance metrics. The layout is data-driven, with clear axis labels and a trend line indicating the correlation.
Performance Metrics and KPIs
Environmental Services & Sustainability
The slide assesses the correlation between the SOI and an index of sustainability performance metrics. It shows a strong positive correlation, suggesting that higher SOI scores are associated with better sustainability performance.
Sustainability, Performance, SOI, Metrics, Correlation
false
Performance Metrics and KPIs
Environmental Services & Sustainability
Mixed Chart
Accenture
Add to my slides
Remove from favorites
This slide features six column charts with face icons representing different focus areas of companies. The charts are color-coded in shades of blue.
Industry Overview
Environmental Services & Sustainability
The slide presents statistics on the current focus areas of companies for responsible production. It highlights the emphasis on sustainable materials and solutions within the supply chain.
Sustainability, Production, Focus Areas, Companies, Supply Chain
false
Industry Overview
Environmental Services & Sustainability
Single Chart
Deloitte
Add to my slides
Remove from favorites
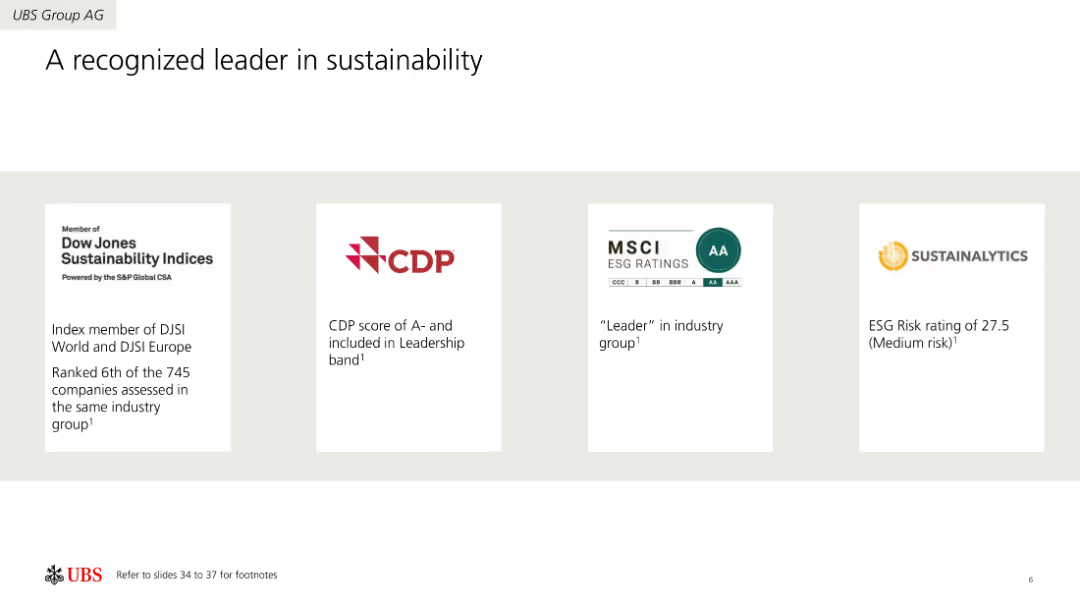
Four-column layout showcasing sustainability ratings and recognitions from different organizations like Dow Jones, CDP, MSCI, and Sustainalytics. Each column includes a logo and a brief description of the recognition.
Industry Overview
Environmental Services & Sustainability
Highlights UBS Group AG's achievements in sustainability, recognized by various rating agencies. Includes information on ratings, scores, and leadership positions in the sustainability sector.
Sustainability, Ratings, Recognition, Environment, Leadership, Achievements
false
Industry Overview
Environmental Services & Sustainability
Pillar
UBS
Add to my slides
Remove from favorites
Two-column layout with bullet points and graphical elements like a pie chart and stick figures carrying a target on the left.
Market Analysis and Trends
Environmental Services & Sustainability
Outlines the benefits and risks when engaging with sustainable consumption, primarily in the energy sector.
Sustainability, Risks, Leaders, Energy, Consumption, Climate Tech, Green Bonds, Commercialization, Decarbonization
false
Market Analysis and Trends
Environmental Services & Sustainability
Boxed
McKinsey
Add to my slides
Remove from favorites
This slide uses a timeline format to detail significant events in Tyson's sustainability efforts, marked by circular nodes. The visual arrangement is clear and orderly, using colors to differentiate dates and events, which enhances readability.
Regulatory and Compliance
Environmental Services & Sustainability
Outlines key milestones in Tyson's sustainability journey, including appointments, program rollouts, and strategic partnerships. This slide is likely aimed at stakeholders interested in corporate responsibility, providing a concise overview of Tyson's commitment to environmental and social initiatives.
Sustainability, Tyson, Corporate Responsibility, Milestones, Timeline
false
Regulatory and Compliance
Environmental Services & Sustainability
Linear Flow
Barclays
Add to my slides
Remove from favorites
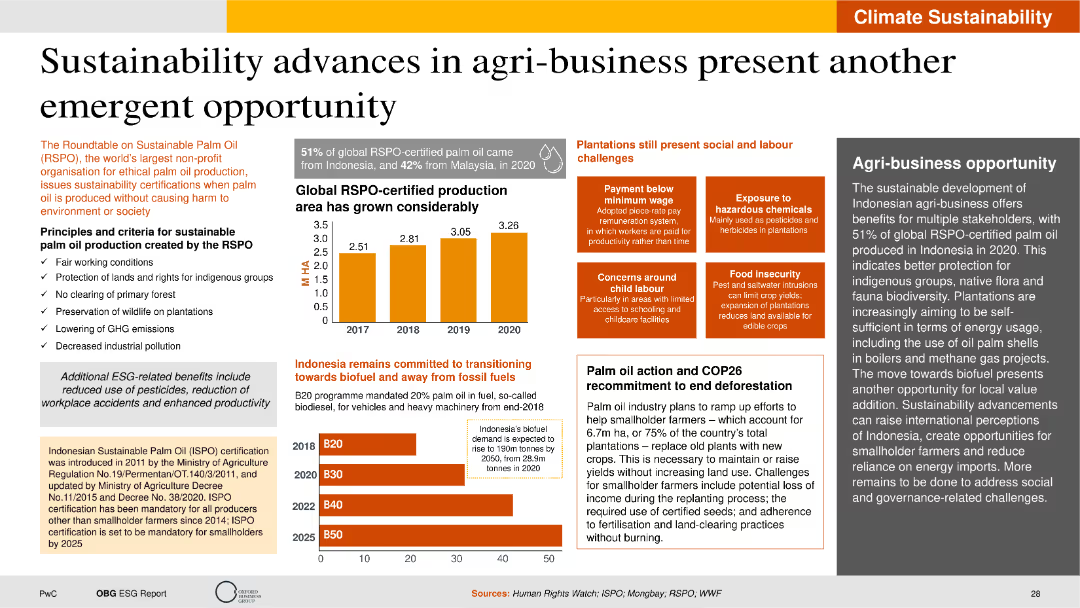
This slide includes column charts and text boxes with a clear and structured layout. Visual elements focus on RSPO-certified palm oil production growth and associated benefits and challenges.
Market Analysis and Trends
Agriculture & Food Production
The slide discusses the advancements in sustainability within Indonesia's agri-business sector, specifically focusing on the production of RSPO-certified palm oil. It provides data on production growth, the principles and criteria for sustainable palm oil production, and the benefits of ESG-related practices. The slide also highlights the challenges faced by plantations, such as payment below minimum wage and exposure to hazardous chemicals, along with future commitments towards biofuel.
Sustainability, agri-business, RSPO certification, palm oil, ESG practices
false
Market Analysis and Trends
Agriculture & Food Production
Multiple Chart
PwC/Strategy&
Add to my slides
Remove from favorites
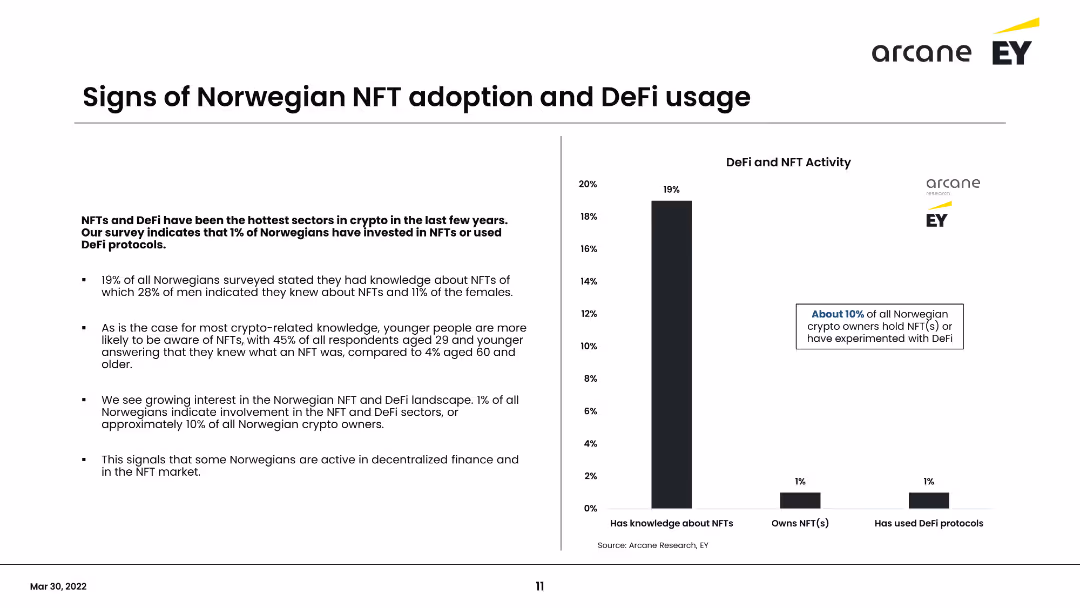
Column chart showing carbon emissions reduction goals; text on the left
Strategic Planning
Environmental Services & Sustainability
Discusses EY's sustainability goals and achievements, including carbon neutrality and net-zero targets
Sustainability, carbon, EY, goals, emissions
false
Strategic Planning
Environmental Services & Sustainability
Mixed Chart
EY
Add to my slides
Remove from favorites
Multiple percentages in sections detailing actions and adaptations by companies. Clean layout with green and blue colors.
Regulatory and Compliance
Environmental Services & Sustainability
Evaluates current sustainability efforts, the difficulty in implementing impactful actions, and the corporate focus on sustainability.
Sustainability, corporate efforts, impact, actions
false
Regulatory and Compliance
Environmental Services & Sustainability
Header Vertical
Deloitte
Add to my slides
Remove from favorites
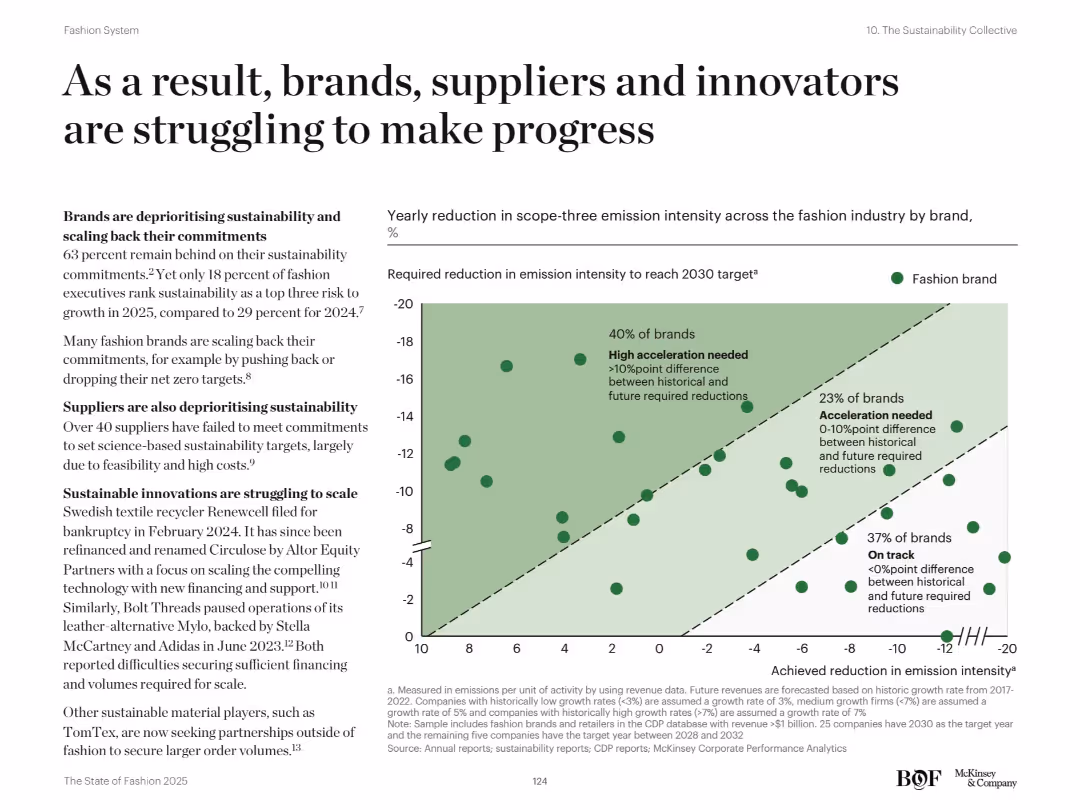
Left-aligned text and right-side scatterplot chart. Text outlines barriers to sustainability progress. The chart maps required vs. achieved emission intensity reductions.
Regulatory and Compliance
Retail & E-commerce
The slide emphasizes the fashion industry's lagging sustainability progress, with many brands deprioritizing climate goals. A scatterplot shows how most brands are far from achieving necessary reductions in emission intensity, revealing urgent gaps in alignment with 2030 targets.
Sustainability, emissions, supply chain, carbon targets, fashion brands, net zero, innovation, scope-three, ESG, green strategy
false
Regulatory and Compliance
Retail & E-commerce
Mixed Chart
McKinsey
Add to my slides
Remove from favorites
Contains multiple text boxes and a column chart displaying sustainable finance volumes. The design includes green highlights to emphasize sustainability.
Investment Analysis
Environmental Services & Sustainability
Highlights Deutsche Bank's Q3 achievements in sustainability, including finance volume and strategic partnerships, with future financial targets.
Sustainability, finance, Deutsche Bank, achievements, partnerships, targets, growth, strategy
false
Investment Analysis
Environmental Services & Sustainability
Mixed Chart
Deutsche Bank
Add to my slides
Remove from favorites
Contains two columns with descriptions and methodologies for Sustainable Finance and Environmental and Social Due Diligence, along with supporting text.
Regulatory and Compliance
Financial Services
The slide compares sustainable finance practices with environmental and social due diligence, highlighting Deutsche Bank's commitment to these standards and regular updates.
Sustainability, finance, due diligence, standards, methodology, banking, ESG, framework, compliance, regulation
false
Regulatory and Compliance
Financial Services
Table
Deutsche Bank
Add to my slides
Remove from favorites
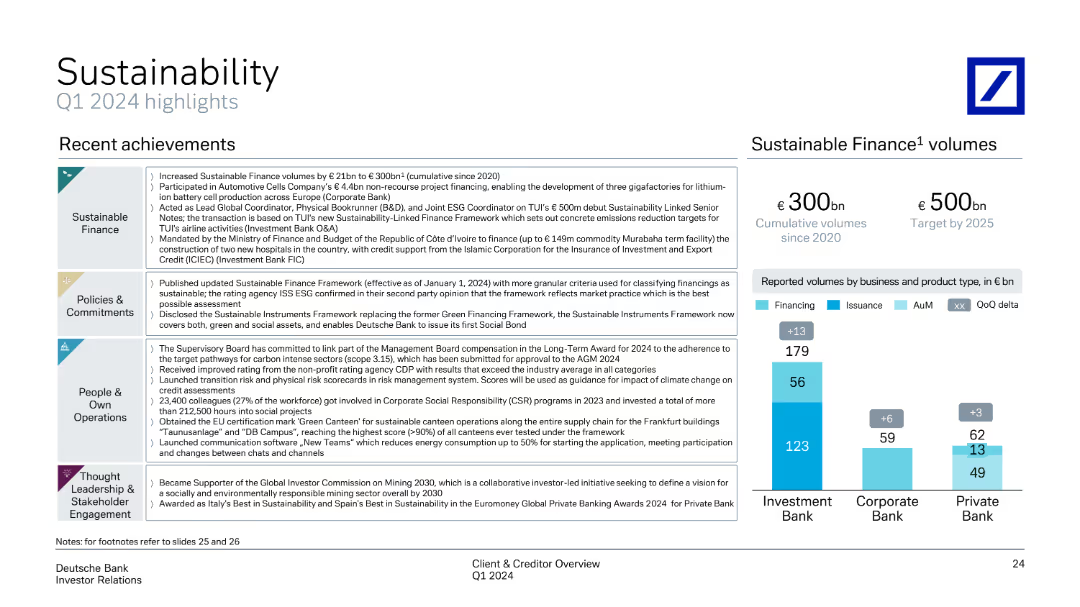
The slide features a clean layout with four sections, each marked with a distinct icon. The right side displays a column chart comparing sustainable finance volumes.
Operational Efficiency
Financial Services
The slide highlights Deutsche Bank's recent sustainability achievements, including increased sustainable finance volumes, updated policies, and social initiatives.
Sustainability, finance, policy, operations, engagement, Q1 2024, achievements, sustainable finance, corporate social responsibility, ESG
false
Operational Efficiency
Financial Services
Mixed Chart
Deutsche Bank
Add to my slides
Remove from favorites
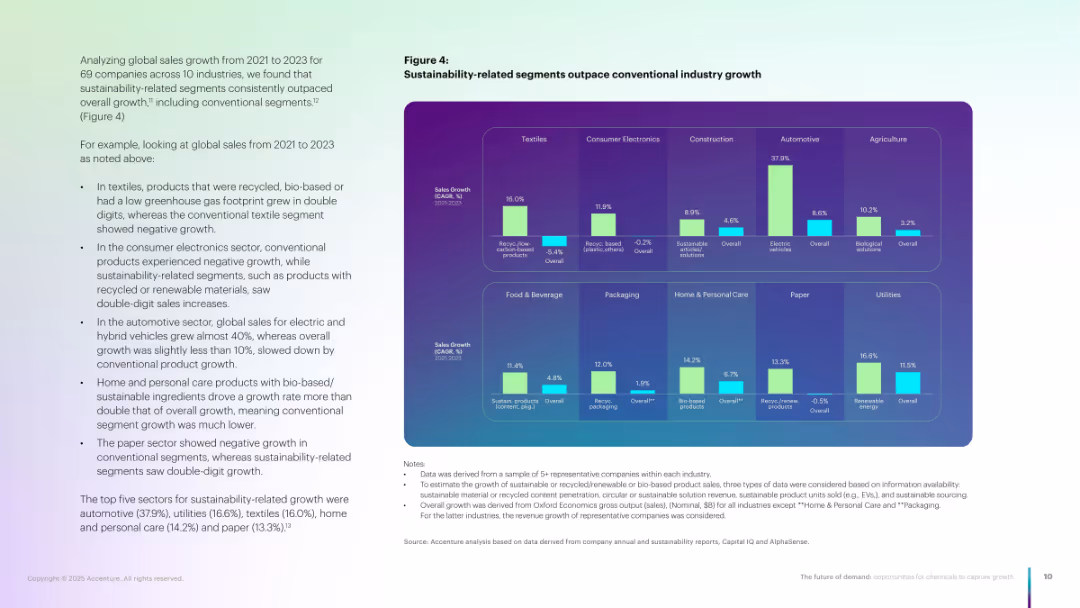
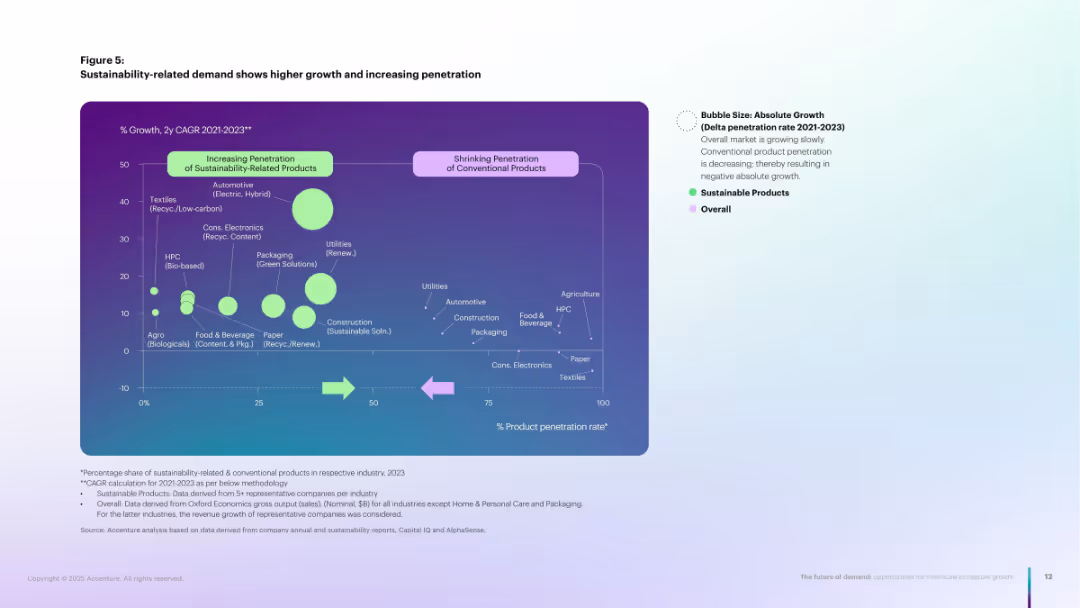
Grid-style chart with 10 industry segments; each has dual bars (sustainable vs. overall).
Market Analysis and Trends
Environmental Services & Sustainability
Compares growth of sustainable vs. conventional products across ten industries. Shows double-digit growth in sustainable segments in textiles, auto, HPC, etc., with overall demand lagging behind.
Sustainability, industry growth, recycled products, bio-based, segments
false
Market Analysis and Trends
Environmental Services & Sustainability
Multiple Chart
Accenture
Add to my slides
Remove from favorites
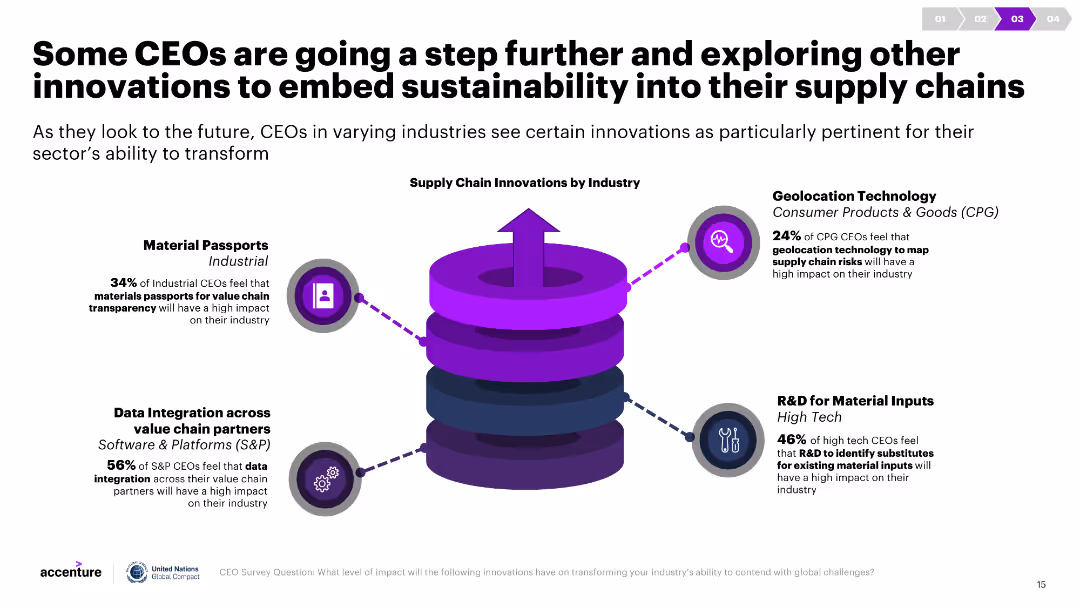
The slide has a central 3D diagram depicting a supply chain surrounded by icons and text descriptions of innovations by industry. It is visually engaging.
Technology and Digital Transformation
Environmental Services & Sustainability
This slide highlights innovations such as geolocation technology and material passports that CEOs are using to enhance sustainability in their supply chains.
Sustainability, innovation, supply chain, material passports, geolocation technology, R&D, data integration, industry, transformation, impact
false
Technology and Digital Transformation
Environmental Services & Sustainability
Diagram
Accenture
Add to my slides
Remove from favorites
The slide includes a circular diagram illustrating various aspects of sustainability outcomes. Text boxes on the right explain Gartner's focus on sustainability.
Strategic Planning
Professional Services
It discusses Gartner’s commitment to sustainability, covering strategies, leadership, and initiatives to support sustainable development goals.
Sustainability, leadership, strategy, innovation, growth, Gartner, initiatives
false
Strategic Planning
Professional Services
Diagram
Gartner
Add to my slides
Remove from favorites
Dark green background with white and green text, a comparative table with percentage values of different sustainability behaviors across age groups.
Regulatory and Compliance
Consumer Goods
The slide examines top behaviors for personal sustainability among different age groups, emphasizing the importance of recycling and the preference for refurbished or rental models.
Sustainability, recycling, consumer behavior, age groups, survey
false
Regulatory and Compliance
Consumer Goods
Single Chart
Oliver Wyman
Add to my slides
Remove from favorites
The slide presents an organizational structure chart of the Chief Sustainability Office, detailing its various divisions and responsibilities.
Strategic Planning
Financial Services
This slide outlines the components and functions of Deutsche Bank's Chief Sustainability Office, emphasizing their role in setting and maintaining sustainability standards.
Sustainability, structure, governance, transparency, policies, human rights, ESG, banking, strategy, organization
false
Strategic Planning
Financial Services
Diagram
Deutsche Bank
Add to my slides
Remove from favorites
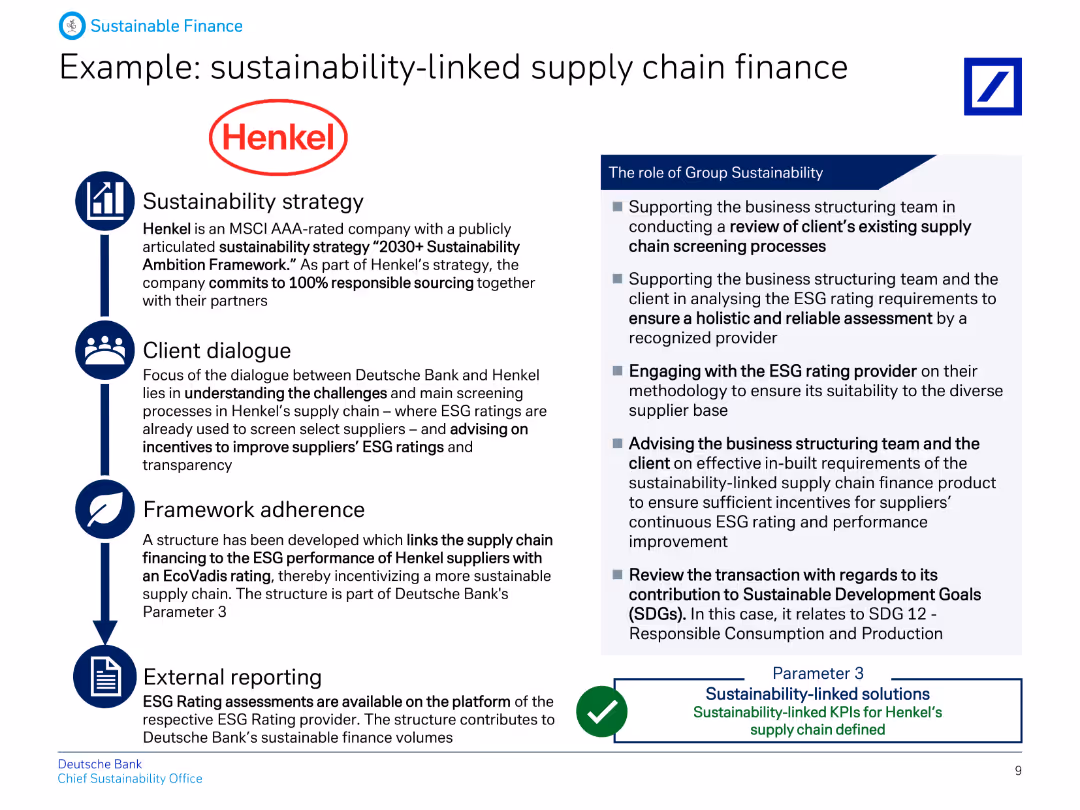
This slide presents a case study with Henkel, detailing their sustainability strategy, client dialogue, framework adherence, and external reporting, with relevant icons.
Client Case Studies
Financial Services
Provides an example of how Deutsche Bank supports Henkel in sustainability-linked supply chain finance, outlining the strategy, client dialogue, framework adherence, and reporting.
Sustainability, supply chain, finance, Henkel, strategy, client, framework, reporting, banking, ESG
false
Client Case Studies
Financial Services
Vertical Flow
Deutsche Bank
Add to my slides
Remove from favorites
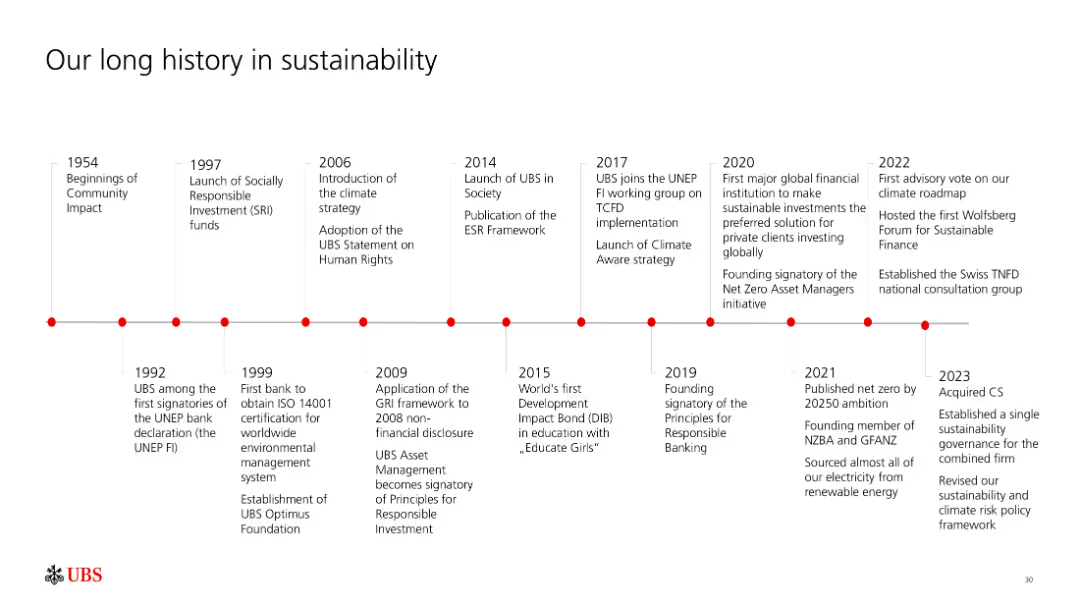
This slide features a timeline depicting UBS's milestones and achievements in sustainability, spanning from 1954 to 2023.
Strategic Planning
Financial Services
It highlights key moments in UBS's sustainability journey, including the launch of socially responsible investment funds, environmental certifications, and sustainability initiatives.
Sustainability, timeline, UBS, milestones, history
false
Strategic Planning
Financial Services
Linear Flow
UBS
Add to my slides
Remove from favorites
The slide includes an image of a person holding a green plant, with two columns of text and a trend assessment.
Operational Efficiency
Consumer Goods
Explains the concept of sustainable consumption, focusing on the importance of eco-friendly practices and consumer expectations.
Sustainable Consumption, Eco-friendly, Consumer Expectations, Greenwashing, Ethical Consumption, Sustainability
false
Operational Efficiency
Consumer Goods
Multiple Chart
Deloitte
Add to my slides
Remove from favorites
Contains a mixture of images and text, with highlighted numerical targets and progress indicators in bold fonts, set against a background image of solar panels, which implies a green investment focus.
Corporate Finance and Valuation
Financial Services
Highlights a financial firm’s goals and progress in sustainable and inclusive economic practices, ideal for investor relations or sustainability reporting.
Sustainable Development, Green Goals, Community, Racial Equity, Investment
false
Corporate Finance and Valuation
Financial Services
Mixed Chart
JP Morgan
Add to my slides
Remove from favorites
Displays stacked bar graphs comparing sustainable fuel demand by sector and feedstock type, with a clear legend and annotations.
Investment Analysis
Energy & Utilities
Highlights the demand for different types of sustainable fuel feedstocks, which is critical information for investors considering the bioenergy sector.
Sustainable Fuels, Bioenergy, Feedstock Demand, Investment Analysis, Sector Comparison, 2050 Trends
false
Investment Analysis
Energy & Utilities
Multiple Chart
McKinsey
Add to my slides
Remove from favorites
This slide contains three graphs with a legend. The left graph has a vertical axis representing percentages and a horizontal axis showing years. The middle and right graphs have similar axes but represent different metrics. All three use blue tones and lines of varying styles for distinction.
Market Analysis and Trends
Energy & Utilities
The slide projects the growth of sustainable fuels, hydrogen, and CCUS across different future scenarios. It emphasizes the significant increase after 2030 and shows comparisons in global hydrogen demand and global CCUS uptake by scenario.
Sustainable Fuels, Hydrogen, CCUS, Energy Transition, Global Demand, 2050, Scenarios, Decarbonization, Growth Projections
true
Market Analysis and Trends
Energy & Utilities
Multiple Chart
McKinsey
Add to my slides
Remove from favorites
The slide features pie charts showing improvements in self-confidence, presentation skills, and business networking skills for participants in the program.
Regulatory and Compliance
Environmental Services & Sustainability
The slide highlights the Sustainable Futures program, which supports young people in achieving DEI goals and understanding business sustainability practices.
Sustainable Futures, DEI, business sustainability, skills development
false
Regulatory and Compliance
Environmental Services & Sustainability
Multiple Chart
EY
Add to my slides
Remove from favorites
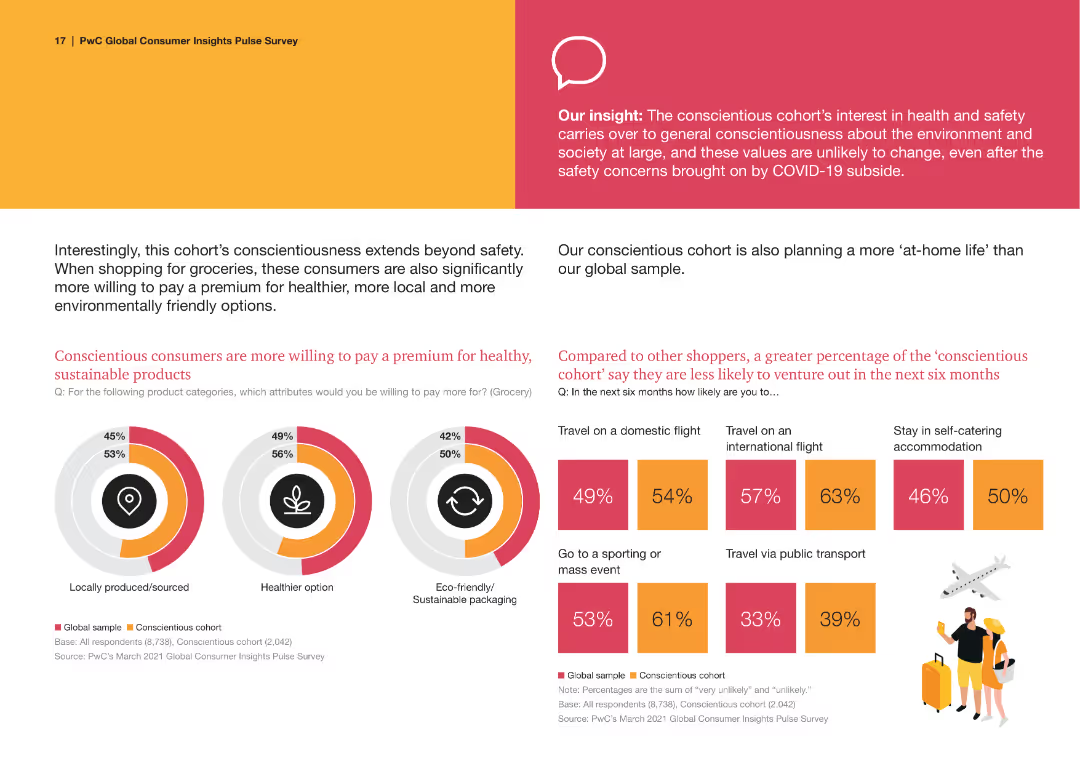
The slide has two circular charts comparing willingness to pay premiums for sustainable products. Text blocks provide additional context. Design is colorful and organized.
Market Analysis and Trends
Consumer Goods
It details how conscientious consumers are more willing to pay for health, local, and eco-friendly products, and their travel habits in the near future.
Sustainable Products, Consumer Preferences, Health, Local Products, Eco-friendly
false
Market Analysis and Trends
Consumer Goods
Multiple Chart
PwC/Strategy&
Add to my slides
Remove from favorites
Bubble chart comparing CAGR and product penetration for sustainable vs. conventional products.
Market Analysis and Trends
Environmental Services & Sustainability
Bubble chart illustrating how sustainable products are gaining higher market penetration and faster growth compared to conventional ones. Emphasizes accelerating demand for bio-based, recycled, or renewable offerings.
Sustainable demand, CAGR, penetration, bubble chart, green growth
false
Market Analysis and Trends
Environmental Services & Sustainability
Single Chart
Accenture
Add to my slides
Remove from favorites
Three content boxes with lists, checkmarks, and two column charts. Header and footer text are present. The slide is evenly spaced.
Strategic Planning
Financial Services
Discusses commitments to green financing, renewable energy, and sustainable development focus areas with financial goals.
Sustainable development, green financing, renewable energy, business practices
false
Strategic Planning
Financial Services
Diagram
JP Morgan
Add to my slides
Remove from favorites
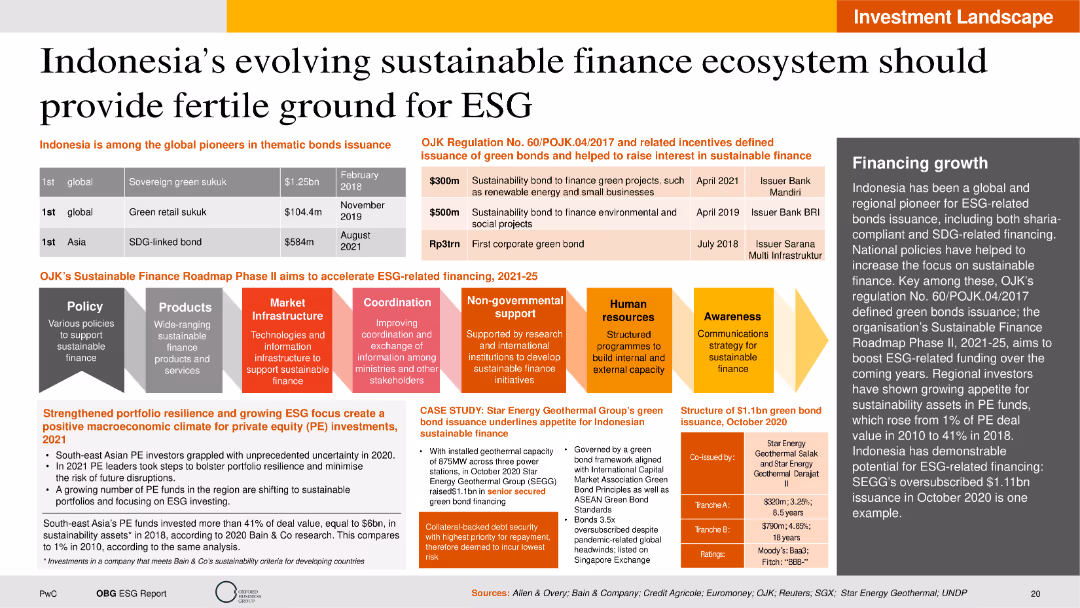
The slide is visually dense with a mix of tables, column charts, and process diagrams. It includes a structured presentation of statistics on thematic bonds issuance and a strategic roadmap for sustainable finance.
Strategic Planning
Financial Services
This slide covers the development of Indonesia’s sustainable finance ecosystem and its potential for fostering ESG investments. It details the issuance of thematic bonds, the implementation of regulatory frameworks, and the Sustainable Finance Roadmap Phase II. The slide also includes case studies and structural details of green bond issuance, emphasizing Indonesia's growth in ESG-related financing.
Sustainable finance, ESG, thematic bonds, regulatory framework, case study
false
Strategic Planning
Financial Services
Linear Flow
PwC/Strategy&
Add to my slides
Remove from favorites
The slide has two sections. The first discusses 'Earthshots' with a chart on capital shift, the second, 'Downround IPOs' with a scatter graph showing cost of capital and deal growth. There are links to additional reports.
Investment Analysis
Financial Services
Highlights sustainable investment opportunities termed 'Earthshots' and the trend of downround IPOs, offering strategic insights for investments in sustainability and the tech market landscape.
Sustainable investment, Earthshots, downround IPOs, capital growth, investment trends, technology market, strategic insights, capital shifts, deal growth, sustainability
false
Investment Analysis
Financial Services
Multiple Chart
Morgan Stanley
Add to my slides
Remove from favorites
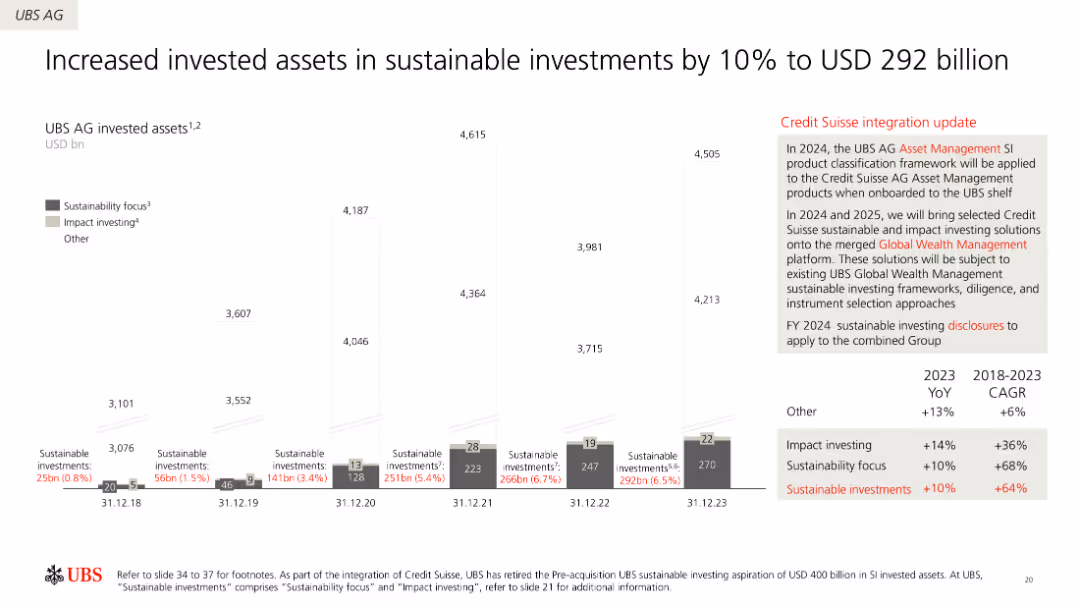
The slide features column charts illustrating the growth of UBS AG's sustainable investments over time, with annotations on impact investing and sustainability focus.
Investment Analysis
Financial Services
This slide highlights UBS AG's increased investments in sustainable assets, including a significant rise in sustainability-focused and impact investing from 2018 to 2023.
Sustainable investments, growth, UBS, impact investing, sustainability focus
false
Investment Analysis
Financial Services
Mixed Chart
UBS
Add to my slides
Remove from favorites
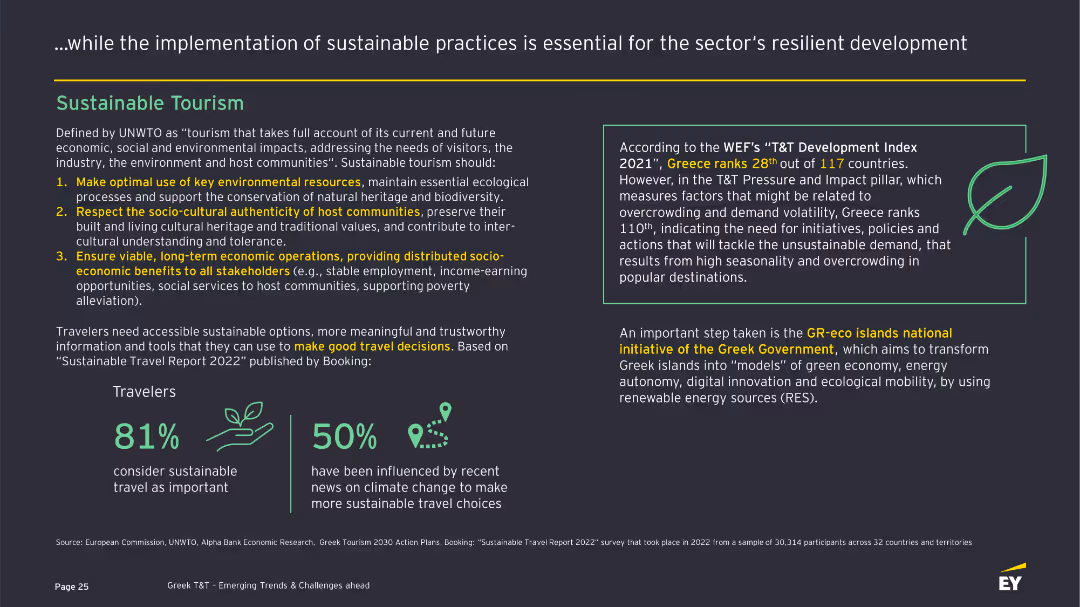
This slide defines sustainable tourism according to UNWTO guidelines, emphasizing economic, social, and environmental impacts. It includes key points on sustainable practices and a box with statistics on sustainable travel preferences among travelers.
Strategic Planning
Hospitality & Tourism
Outlines principles of sustainable tourism, emphasizing the importance of conserving resources, respecting local cultures, and providing socio-economic benefits. It includes data on traveler preferences for sustainable travel options and government initiatives.
Sustainable tourism, UNWTO, Environment, Travelers, Preferences
false
Strategic Planning
Hospitality & Tourism
Vertical Flow
EY
Add to my slides
Remove from favorites
This slide defines sustainable tourism according to UNWTO guidelines, emphasizing economic, social, and environmental impacts. It includes key points on sustainable practices and a box with statistics on sustainable travel preferences among travelers.
Strategic Planning
Hospitality & Tourism
Outlines principles of sustainable tourism, emphasizing the importance of conserving resources, respecting local cultures, and providing socio-economic benefits. It includes data on traveler preferences for sustainable travel options and government initiatives.
Sustainable tourism, UNWTO, Environment, Travelers, Preferences
false
Strategic Planning
Hospitality & Tourism
Mixed Chart
EY
Add to my slides
Remove from favorites
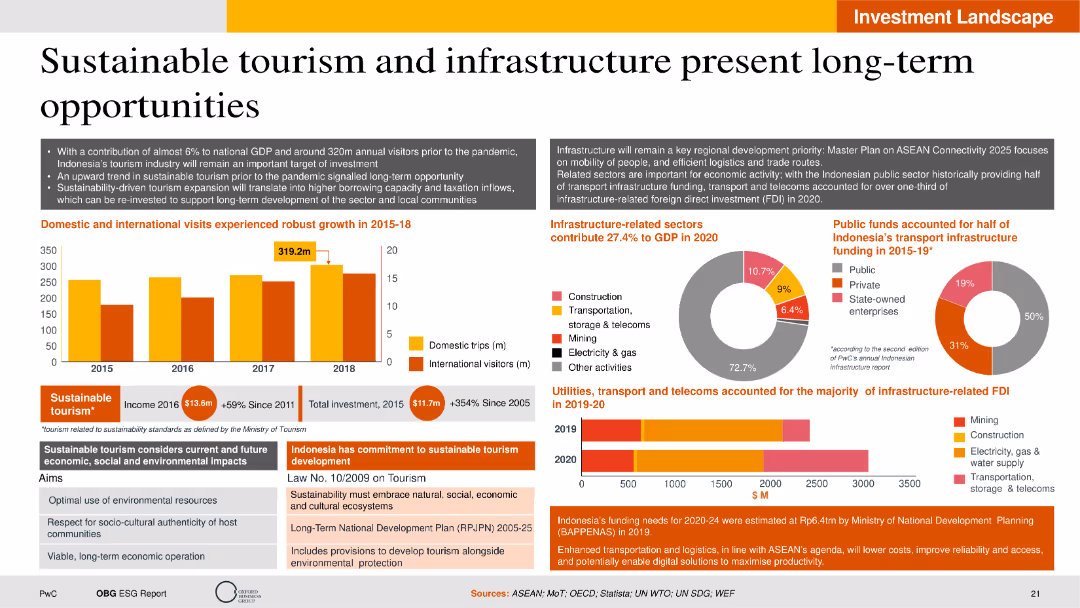
The slide features a combination of column charts, pie charts, and text boxes with a balanced layout. Visual elements highlight domestic and international tourism growth, sector contributions to GDP, and public funding distribution.
Strategic Planning
Hospitality & Tourism
The slide discusses the potential long-term opportunities in sustainable tourism and infrastructure in Indonesia. It presents data on tourism growth, contributions to GDP, and infrastructure-related FDI. The slide also covers Indonesia's commitment to sustainable tourism development, infrastructure-related sector performance, and future investment strategies.
Sustainable tourism, infrastructure, GDP contribution, FDI, development strategy
false
Strategic Planning
Hospitality & Tourism
Multiple Chart
PwC/Strategy&
Add to my slides
Remove from favorites
A central black board with sections radiating outwards details client priorities and sustainable finance offerings, alongside a narrative of client solutions on the right.
Client Case Studies
Financial Services
Highlights a case study on sustainable finance, showing client priorities and the firm’s sustainable offerings in various business sectors.
Sustainable, Finance, Investment, Asset, Wealth, Management, Solutions, Client
false
Client Case Studies
Financial Services
Table
Goldman Sachs
Add to my slides
Remove from favorites
Features images and captions related to sustainable rubber sourcing, statistical data, and information on projects in different regions to improve sustainability in the rubber supply chain.
Market Analysis and Trends
Industrial & Manufacturing
Presents information on Michelin's approach to sustainable natural rubber procurement and their efforts to drive sustainability across the tire industry, including supplier assessments and impact projects.
Sustainable, Natural Rubber, Michelin, Supply Chain, Sustainability, Agriculture, Smallholders, Global Impact, Supplier Assessment, Roadmap 2025
false
Market Analysis and Trends
Industrial & Manufacturing
Header Vertical
Morgan Stanley
Add to my slides
Remove from favorites
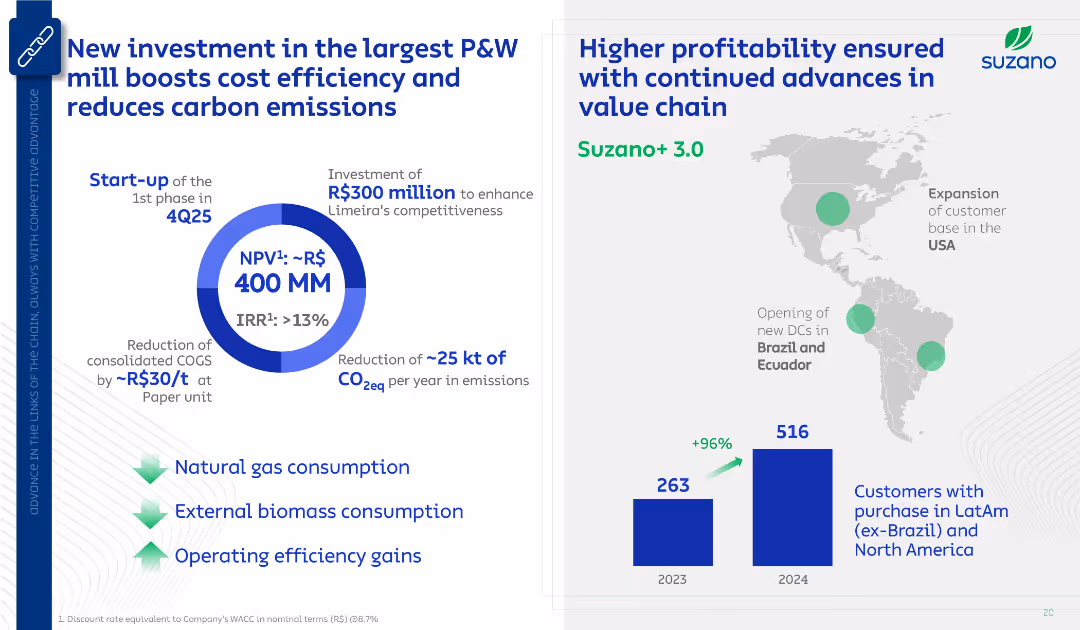
Two-part layout: Left shows investment highlights with a circular ROI visual; right shows geographic expansion map and customer base bar chart. Clean blue-and-white design with icons and arrows.
Strategic Planning
Industrial & Manufacturing
Communicates Suzano’s investment in a P&W mill to reduce cost and emissions. Also notes expansion in distribution centers and a doubling of customer base from 2023 to 2024, highlighting strategic and environmental benefits.
Suzano, investment, CO2 reduction, customer growth, ROI, P&W, logistics
false
Strategic Planning
Industrial & Manufacturing
Multiple Chart
Goldman Sachs
Add to my slides
Remove from favorites
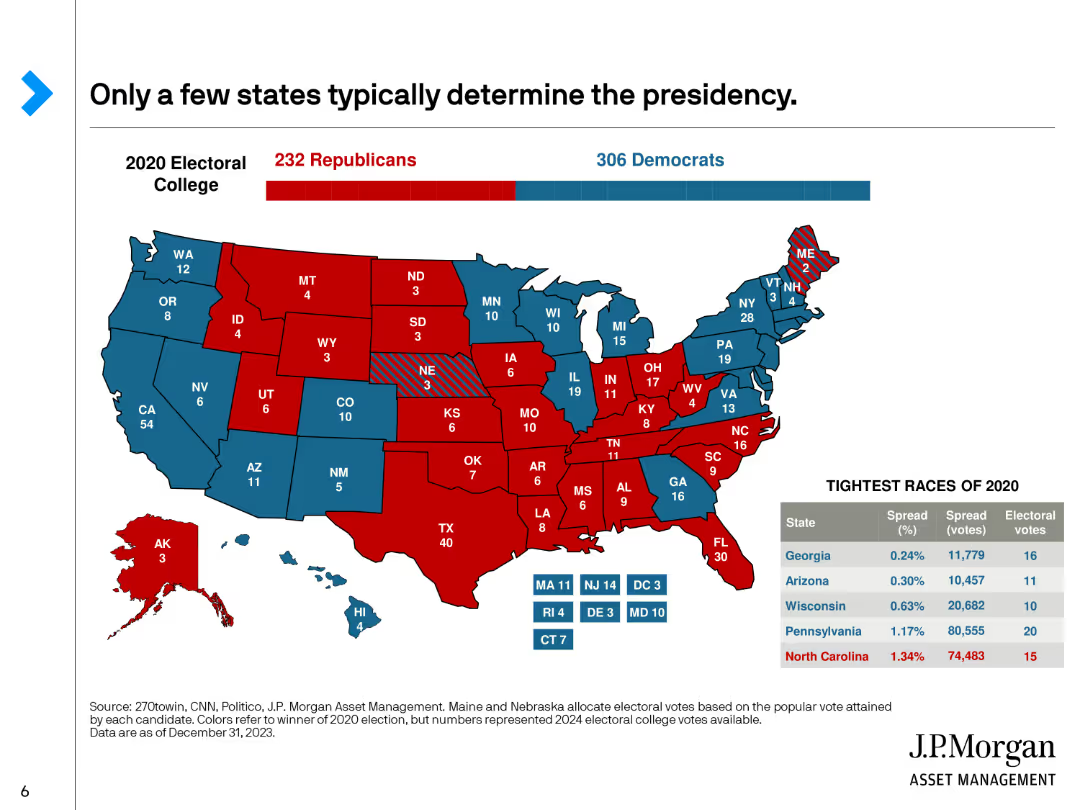
A U.S. map showing the 2020 Electoral College results by state with red and blue colors, along with a table listing the tightest races in key states.
Market Analysis and Trends
Government & Public Sector
Highlights the importance of swing states in determining the U.S. presidency, showing the electoral votes and margins in critical states from the 2020 election.
Swing States, Electoral College, Presidency, 2020, Key States
false
Market Analysis and Trends
Government & Public Sector
Graphic
JP Morgan
Add to my slides
Remove from favorites
A detailed text layout with three columns providing information on Swiss Bank, Share-Backed Lending, and IB Leveraged Finance portfolios. Text boxes highlight forward-looking risk management measures for each portfolio.
Risk Assessment and Management
Financial Services
Provides an in-depth look at selected portfolios, their investment grade ratings, exposure levels, and forward-looking risk management measures. It focuses on high-quality assets, conservative lending standards, and de-risking strategies.
Swiss Bank, Share-Backed Lending, IB Leveraged Finance, risk management, portfolios
false
Risk Assessment and Management
Financial Services
Table
Credit Suisse
Add to my slides
Remove from favorites
The slide features column charts showing adjusted net revenues, cost/income ratio, assets under management, and more for Swiss Bank.
Financial Performance
Financial Services
This slide provides financial performance metrics for the Swiss Bank sector, highlighting net revenues, cost/income ratio, and pre-tax income.
Swiss Bank, net revenues, cost/income ratio, assets under management, financial performance
false
Financial Performance
Financial Services
Multiple Chart
Credit Suisse
Add to my slides
Remove from favorites
Features a main column chart with several smaller charts, detailing the number of startups in various sectors of the Swiss FoodTech ecosystem.
Industry Overview
Agriculture & Food Production
Overview of the Swiss FoodTech ecosystem, showing trends and startup prevalence in sectors like AgTech and Food Waste. Useful for understanding innovation distribution and identifying significant startup activity areas.
Swiss FoodTech, Ecosystem, Startups, AgTech, Food Waste, Innovation Distribution
false
Industry Overview
Agriculture & Food Production
Mixed Chart
Accenture
Add to my slides
Remove from favorites
Detailed with multiple small bar charts for each trend category within the Swiss FoodTech ecosystem, showing startup numbers in specific areas.
Market Analysis and Trends
Agriculture & Food Production
Details niche areas within the Swiss FoodTech ecosystem like Nutricosmetics and Precision Agriculture, highlighting startup involvement and emerging trends. Valuable for stakeholders interested in niche investment or innovation opportunities.
Swiss FoodTech, Trend Categories, Startups, Nutricosmetics, Precision Agriculture
false
Market Analysis and Trends
Agriculture & Food Production
Multiple Chart
Accenture
Add to my slides
Remove from favorites
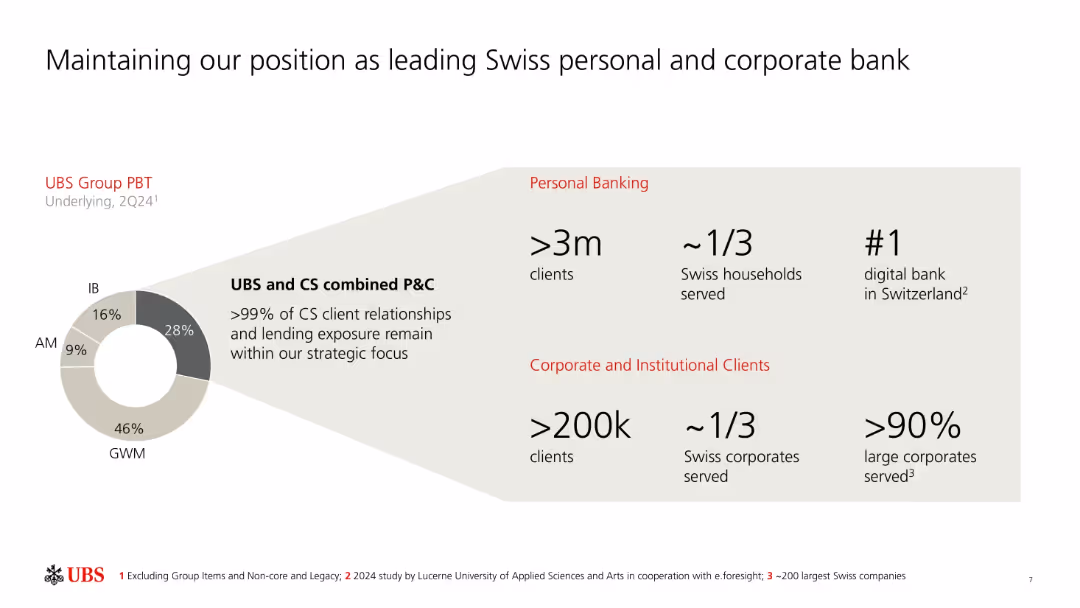
Donut chart and infographics on left and right; red-highlighted headers for key stats.
Strategic Planning
Financial Services
UBS emphasizes its dominant role in Swiss banking, serving over 3 million personal clients and 200k corporates. It shows client distribution and a donut chart of UBS Group PBT by division, highlighting its continued strategic alignment post-Credit Suisse acquisition.
Swiss banking, market share, PBT, UBS, personal banking, corporate banking, digital bank, CS integration
false
Strategic Planning
Financial Services
Mixed Chart
UBS
Add to my slides
Remove from favorites
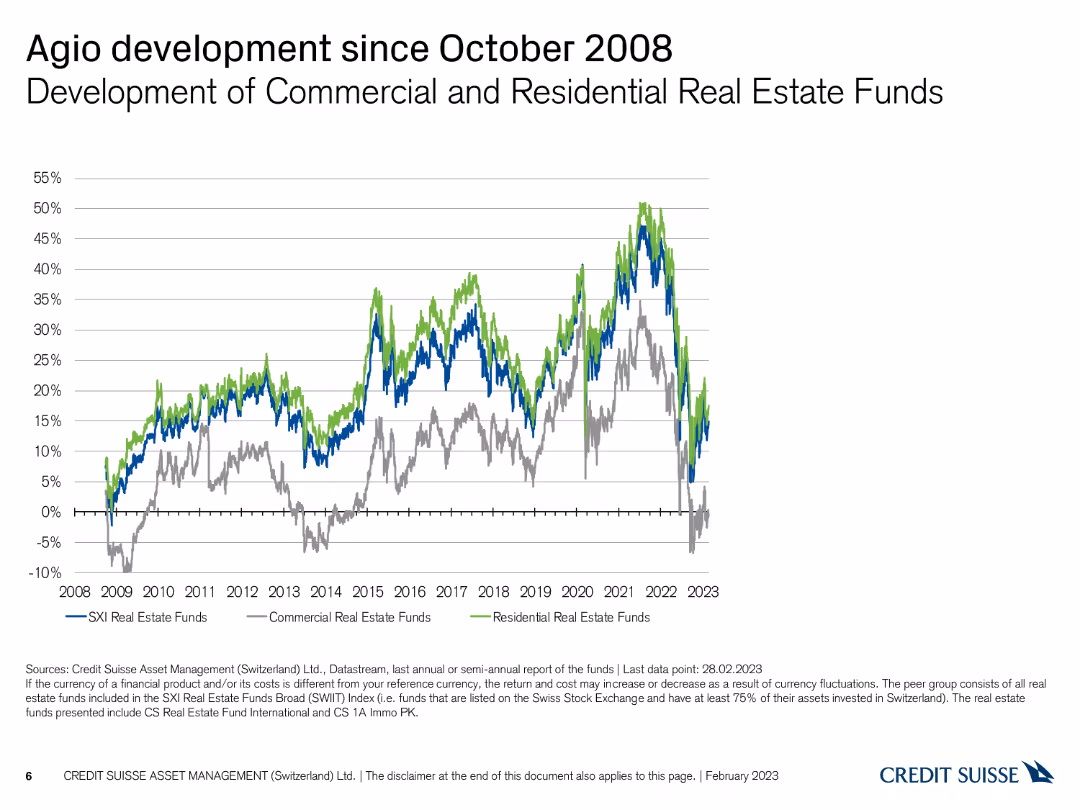
The slide features a line chart showing the development of commercial and residential real estate funds since 2008.
Financial Performance
Real Estate & Construction
This slide examines the agio development of Swiss commercial and residential real estate funds, highlighting trends since October 2008.
Swiss real estate, agio, commercial funds, residential funds, line chart
false
Financial Performance
Real Estate & Construction
Single Chart
Credit Suisse
Add to my slides
Remove from favorites
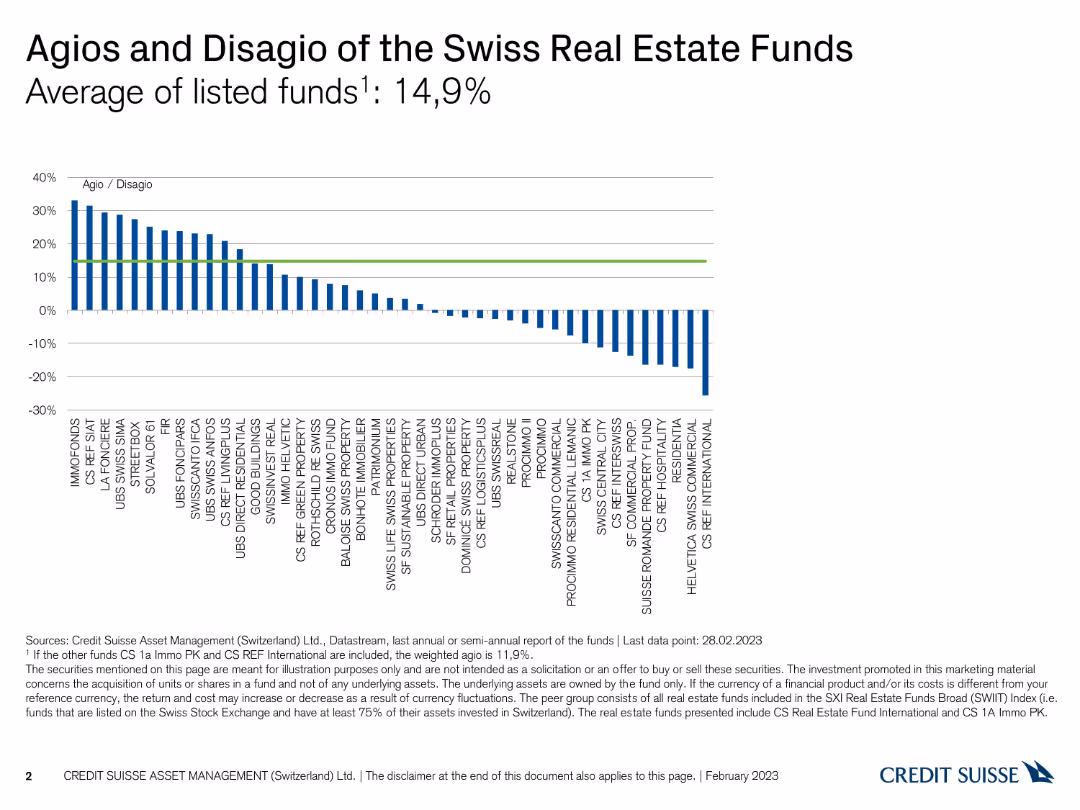
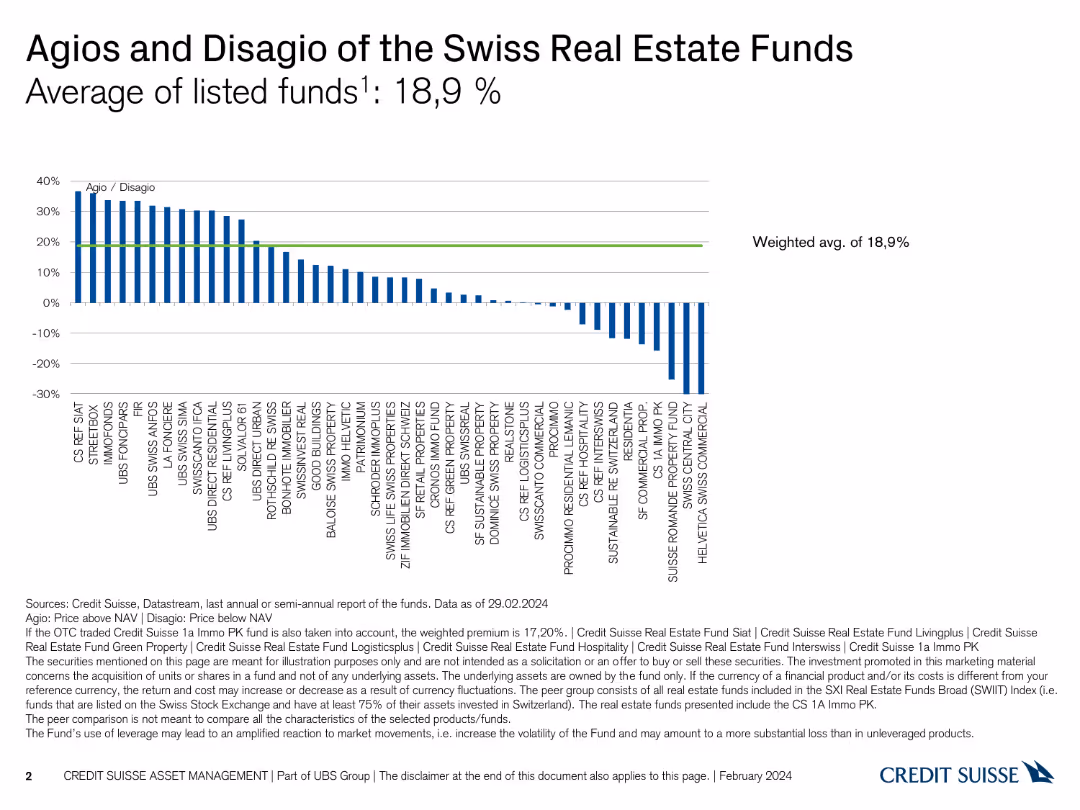
The slide presents a column chart showing the agios and disagio of various Swiss real estate funds, with performance percentages.
Financial Performance
Real Estate & Construction
This slide provides an overview of the agios (premiums) and disagio (discounts) of Swiss real estate funds, highlighting the average listed funds' performance.
Swiss real estate, agio, disagio, fund performance, column chart
false
Financial Performance
Real Estate & Construction
Single Chart
Credit Suisse
Add to my slides
Remove from favorites
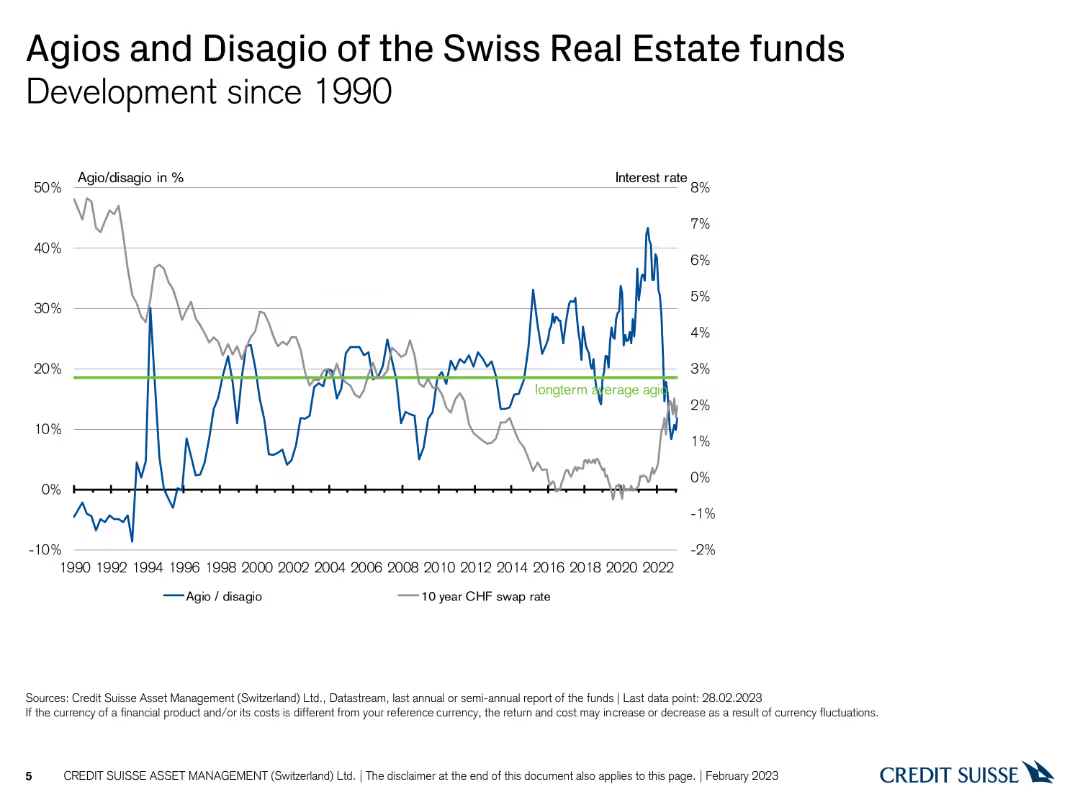
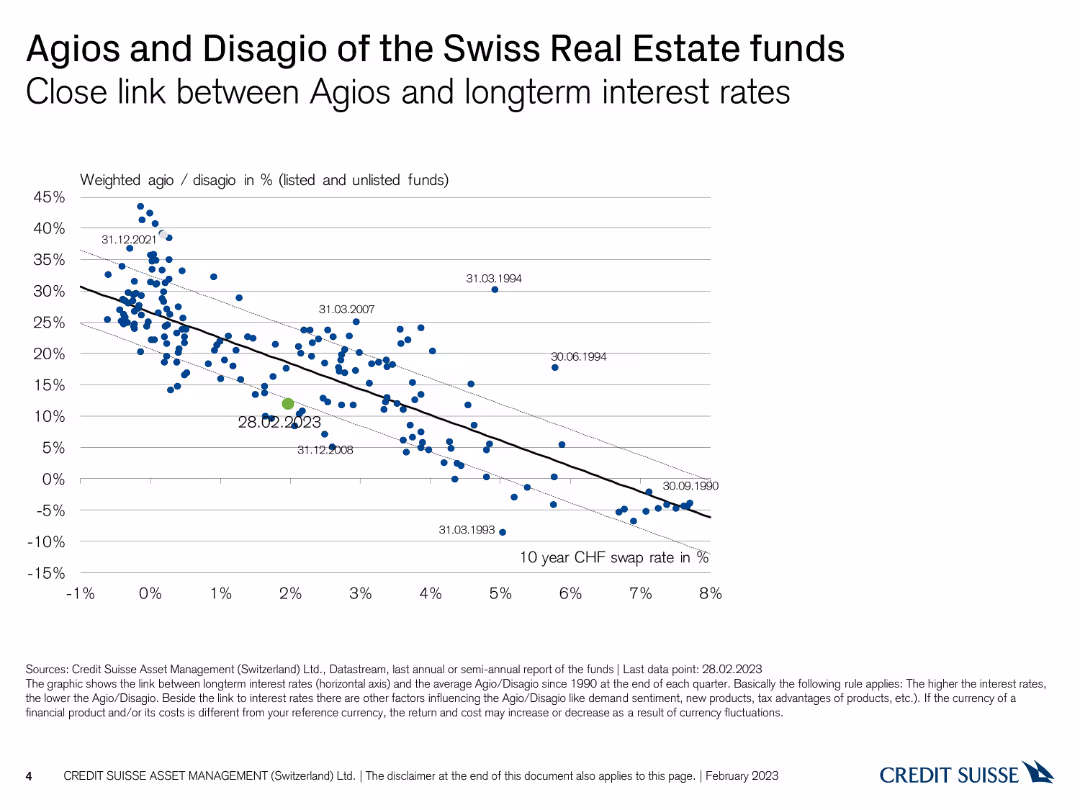
The slide presents a line chart depicting the development of agios/disagios and interest rates since 1990.
Financial Performance
Real Estate & Construction
This slide illustrates the historical development of agios/disagios and long-term interest rates for Swiss real estate funds since 1990.
Swiss real estate, agio, disagio, historical trends, line chart
false
Financial Performance
Real Estate & Construction
Single Chart
Credit Suisse
Add to my slides
Remove from favorites
The slide features a scatter plot linking agios/disagios with long-term interest rates, showing data points over time.
Financial Performance
Real Estate & Construction
This slide explores the relationship between agios/disagios of Swiss real estate funds and long-term interest rates, indicating trends over time.
Swiss real estate, agio, disagio, interest rates, scatter plot
false
Financial Performance
Real Estate & Construction
Single Chart
Credit Suisse
Add to my slides
Remove from favorites
Column chart showing agios and disagios of various Swiss real estate funds, including a weighted average.
Market Analysis and Trends
Real Estate & Construction
Compares the premium and discount (agio/disagio) across listed Swiss real estate funds, providing a weighted average analysis.
Swiss real estate, agio, disagio, market analysis, funds
false
Market Analysis and Trends
Real Estate & Construction
Single Chart
Credit Suisse
Add to my slides
Remove from favorites
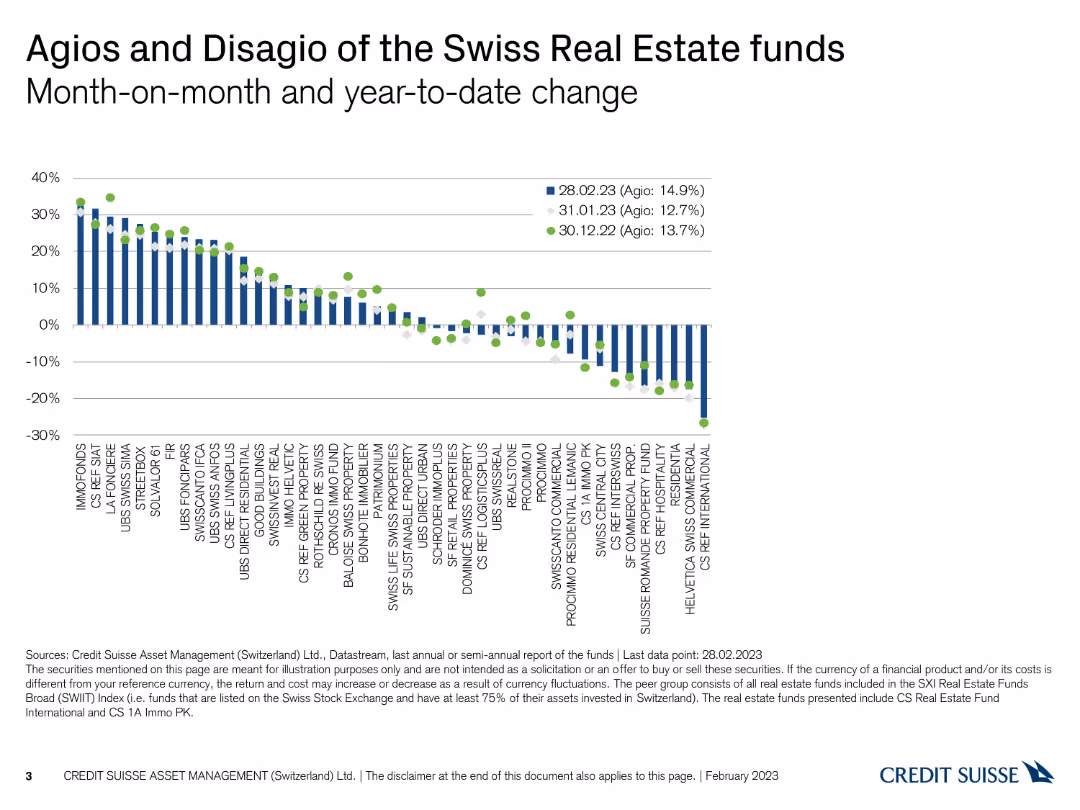
The slide displays a column chart with dots representing month-on-month and year-to-date changes in agios and disagios.
Financial Performance
Real Estate & Construction
This slide compares the monthly and year-to-date changes in agios and disagios of Swiss real estate funds, providing performance insights.
Swiss real estate, agio, disagio, performance, monthly change
false
Financial Performance
Real Estate & Construction
Single Chart
Credit Suisse
Add to my slides
Remove from favorites
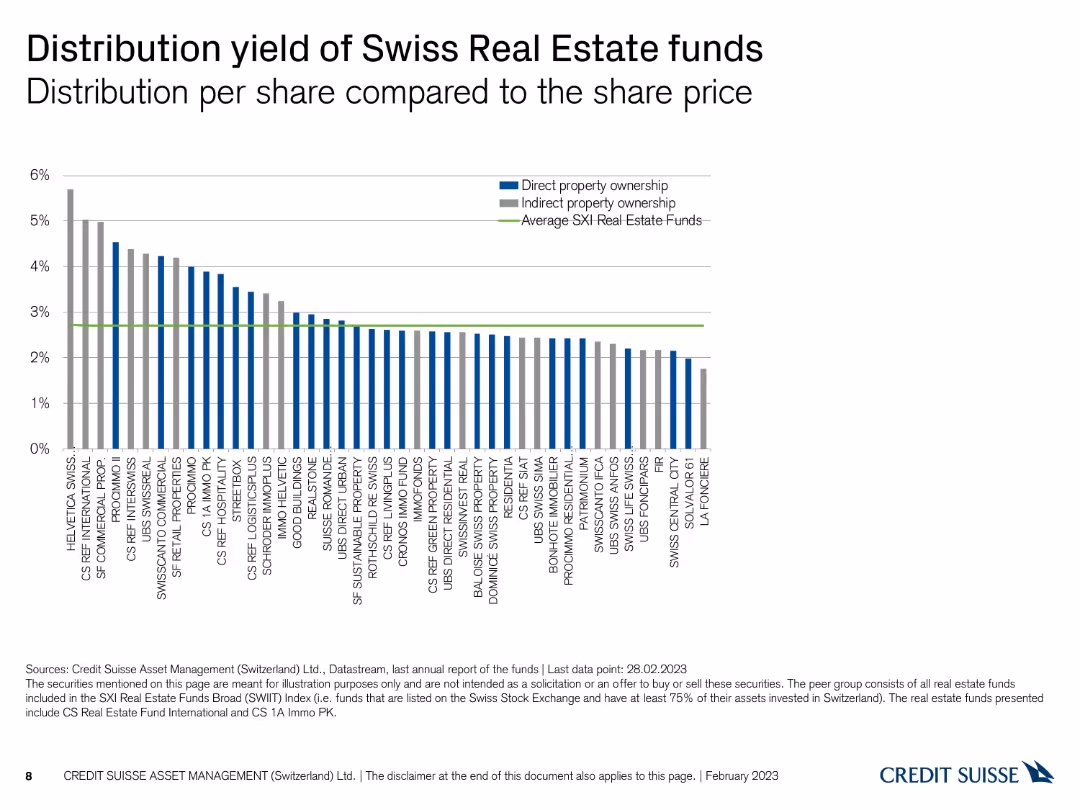
The slide presents a column chart comparing the distribution yield per share of Swiss real estate funds.
Financial Performance
Real Estate & Construction
This slide compares the distribution yield of Swiss real estate funds per share, highlighting differences among funds.
Swiss real estate, distribution yield, comparison, column chart, share price
false
Financial Performance
Real Estate & Construction
Single Chart
Credit Suisse
Add to my slides
Remove from favorites
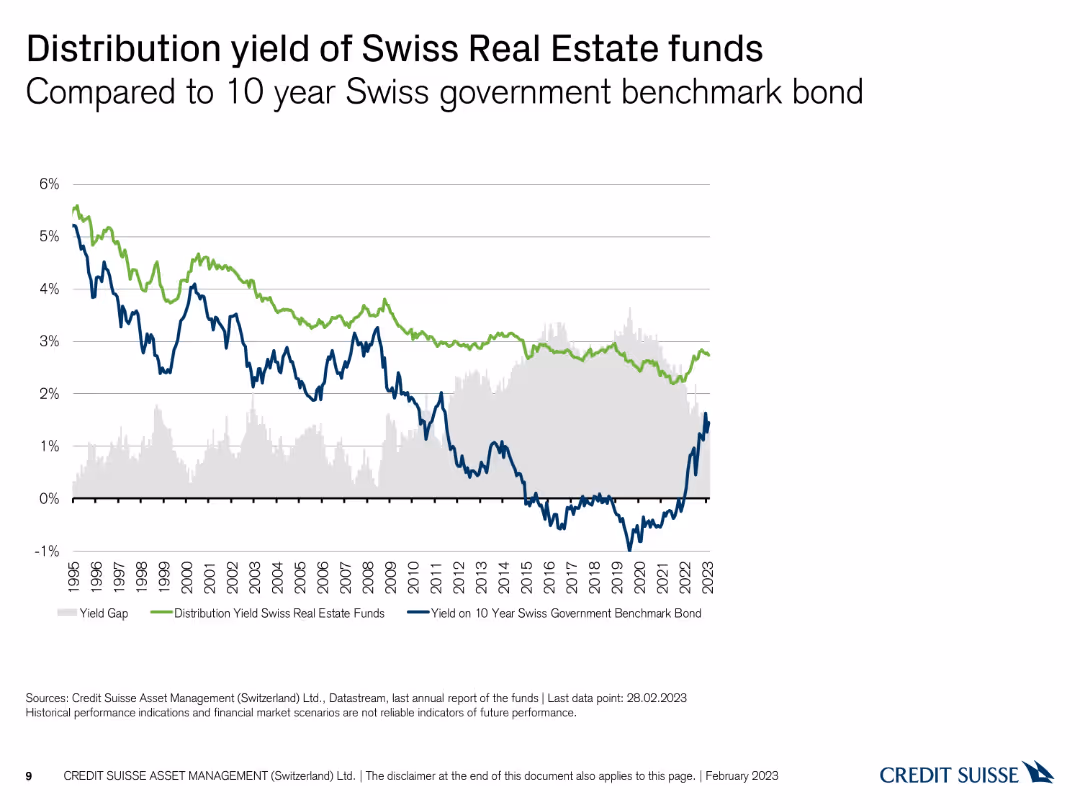
The slide features a line chart comparing the distribution yield of Swiss real estate funds to a 10-year Swiss government bond.
Financial Performance
Real Estate & Construction
This slide compares the distribution yield of Swiss real estate funds with the yield on a 10-year Swiss government benchmark bond, providing insights into performance.
Swiss real estate, distribution yield, government bond, comparison, line chart
false
Financial Performance
Real Estate & Construction
Single Chart
Credit Suisse
Add to my slides
Remove from favorites
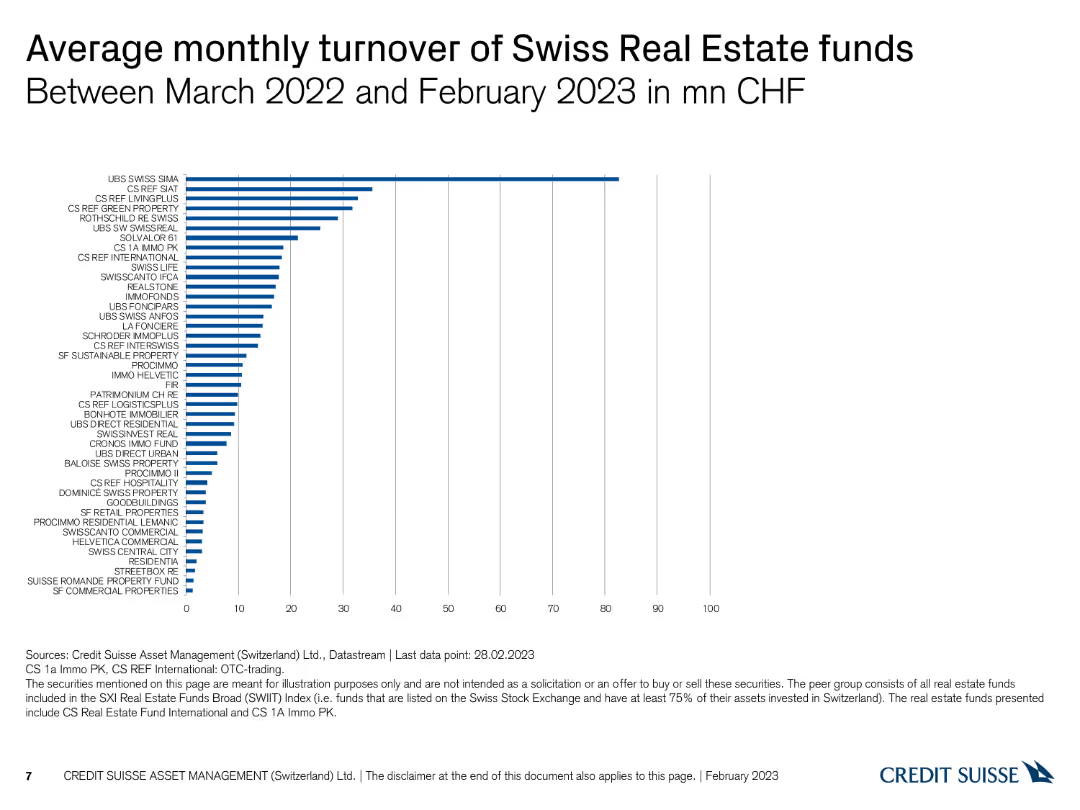
The slide includes a column chart displaying the average monthly turnover of Swiss real estate funds in million CHF.
Financial Performance
Real Estate & Construction
This slide reports the average monthly turnover of various Swiss real estate funds from March 2022 to February 2023, measured in million CHF.
Swiss real estate, turnover, monthly turnover, column chart, CHF
false
Financial Performance
Real Estate & Construction
Single Chart
Credit Suisse
Add to my slides
Remove from favorites
This slide presents a line chart showing the growth in the number of financing rounds of Swiss startups from 2012 to 2020, along with multiple bullet points detailing innovations and academic contributions to the startup environment.
Industry Overview
Professional Services
The slide focuses on the financial evolution of Swiss startups, showcasing a consistent increase in financing rounds over the years. It also discusses local innovation hubs and academic influences driving the startup landscape.
Swiss startups, financing rounds, innovation, academic influence, growth
false
Industry Overview
Professional Services
Mixed Chart
Accenture
Add to my slides
Remove from favorites
Detailed textual content with logos and a list of various organizational types supporting the FoodTech sector.
Market Analysis and Trends
Agriculture & Food Production
Describes the core entities that support and enable food innovation in Switzerland, including corporations and research centers.
Switzerland, FoodTech, support, innovation, ecosystem
false
Market Analysis and Trends
Agriculture & Food Production
Header Horizontal
Accenture
Add to my slides
Remove from favorites
Slide displays detailed text content with logos representing various support entities within the FoodTech ecosystem.
Investment Analysis
Agriculture & Food Production
Describes the core entities supporting food innovation in Switzerland, with a focus on their contributions and origins.
Switzerland, FoodTech, support, innovation, entities
false
Investment Analysis
Agriculture & Food Production
Header Vertical
Accenture
Add to my slides
Remove from favorites
Contains text blocks and images showcasing infrastructure and activities in Switzerland's food sector.
Market Analysis and Trends
Agriculture & Food Production
Highlights Switzerland's role as a leader in food and nutrition, focusing on corporate and academic contributions.
Switzerland, innovation, food, academia, corporates
false
Market Analysis and Trends
Agriculture & Food Production
Header Horizontal
Accenture
Add to my slides
Remove from favorites
The slide features pie charts showing total revenues and PBT breakdowns for 2H23, along with a list of medium-term priorities for clients, integration, and productivity. Text highlights ambitions for cost/income ratio and key achievements in client reach and service.
Financial Performance
Financial Services
The slide emphasizes UBS's leading position in Switzerland with strong returns and extensive client reach. It outlines medium-term priorities in client services, integration, and productivity improvements. This slide can be used to highlight market leadership and strategic priorities in the Swiss banking sector.
Switzerland, market leadership, client reach, productivity, integration
false
Financial Performance
Financial Services
Multiple Chart
UBS
Add to my slides
Remove from favorites
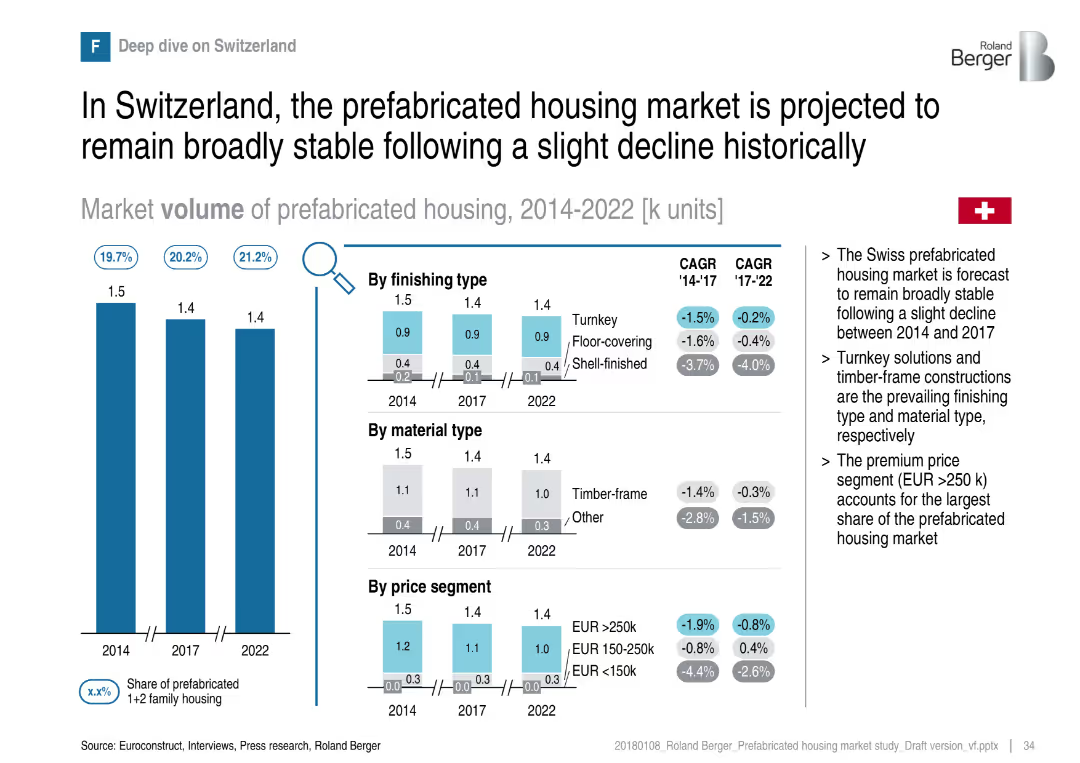
Bar chart and segments showing minor fluctuations; stable forecast emphasized
Market Analysis and Trends
Real Estate & Construction
Switzerland’s prefabricated housing market has declined slightly but is expected to stabilize. The market favors turnkey solutions and premium price segments, with timber-frame as the preferred material.
Switzerland, stability, prefabricated, turnkey, timber-frame, market trends
false
Market Analysis and Trends
Real Estate & Construction
Multiple Chart
Roland Berger
Add to my slides
Remove from favorites
This slide features a large map of Switzerland color-coded to display investment data by canton and sector for 2020. Several bar charts depict investment amounts in different sectors like Biotech, Medtech, ICT, etc. It also includes a detailed bullet point text explaining the startup ecosystem in Switzerland.
Industry Overview
Professional Services
The slide provides an overview of the Swiss startup ecosystem, emphasizing the investments in various sectors across cantons in 2020. It highlights Switzerland's ranking in European startup ecosystems and discusses the investment trends in detail.
Switzerland, startup, investment, ecosystem, biotech, medtech, ICT, 2020
false
Industry Overview
Professional Services
Graphic
Accenture
Add to my slides
Remove from favorites
Features a detailed flow diagram showing the various processes syngas can undergo based on its purity, including PSA purification and methanol synthesis.
Technology and Digital Transformation
Energy & Utilities
Describes the multiple processes that syngas can undergo to either extract hydrogen or convert into liquid fuels, depending on its purity and composition.
Syngas, hydrogen extraction, liquid fuels, PSA purification, methanol synthesis
false
Technology and Digital Transformation
Energy & Utilities
Diagram
Kearney
Add to my slides
Remove from favorites
Contains a comparative column chart showing the usual composition of syngas per production method, with key takeaways listed on the right.
Technology and Digital Transformation
Energy & Utilities
Explains the composition of syngas produced by different methods (SMR, ATR, gasification), emphasizing its uses and energy density relative to natural gas.
Syngas, hydrogen, SMR, ATR, gasification, production methods
false
Technology and Digital Transformation
Energy & Utilities
Mixed Chart
Kearney
Add to my slides
Remove from favorites
This slide features a table format discussing the impact on integrator industry over the last three years, industry drivers, and digitalization. It also includes quotes from industry leaders and logos of companies such as Schott, Edgewater Automation, Kuka, and Strama-MPS.
Competitive Landscape
Industrial & Manufacturing
The slide outlines key themes and challenges for system integrators, including market commentary on the impact of recent years on the integrator industry, industry drivers, and the importance of digitalization.
System Integrators, Industry Challenges, Market Commentary, CEO Interviews, Digitalization
false
Competitive Landscape
Industrial & Manufacturing
Table
LEK
Add to my slides
Remove from favorites
A slide featuring a several bar graphs detailing perceptions of systemic racism across various institutions.
Market Analysis and Trends
Professional Services
Highlights survey results on the perceptions of systemic racism within different societal institutions among Millennials and Gen Z.
Systemic Racism, Institutions, Survey, Millennials, Gen Z, Perceptions, Society, Workplace
false
Market Analysis and Trends
Professional Services
Mixed Chart
Deloitte
Add to my slides
Remove from favorites
This slide has a text-heavy format with five sections, each including a header, percentage, description, and associated icon, with a footnote at the bottom.
Market Analysis and Trends
Technology & Software
Details the systemic changes driving the growth of ecommerce in SEA, focusing on demographics, internet infrastructure, GDP growth, payment ecosystems, and retail infrastructure, indicating substantial opportunities for market expansion.
Systemic changes, ecommerce growth, SEA, demographics, internet infrastructure
false
Market Analysis and Trends
Technology & Software
Header Vertical
Bain
Add to my slides
Remove from favorites
A scatter plot showing the relationship between system strength and revenue growth during the pandemic. Accompanied by a strategy recommendation text.
Strategic Planning
Technology & Software
This slide provides strategic recommendations based on system strength and IT budget allocation, illustrated by a scatter plot showing revenue growth trends.
Systems Strength, Revenue Growth, Strategy, Pandemic, Recommendations
false
Strategic Planning
Technology & Software
Single Chart
Accenture
Add to my slides
Remove from favorites
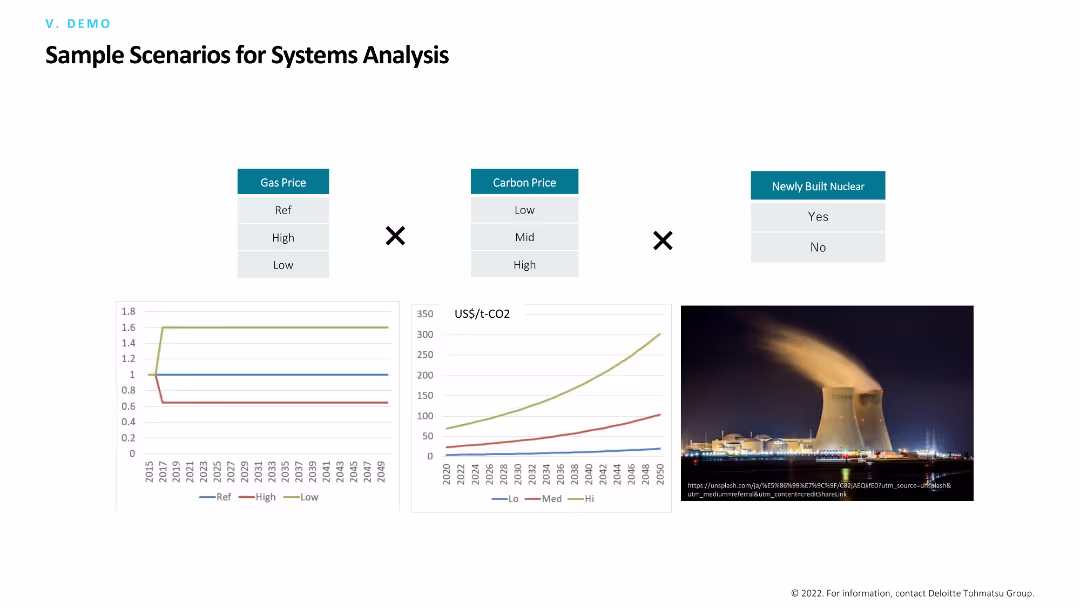
The slide compares various scenarios for systems analysis, including gas prices, carbon prices, and newly built nuclear. It features a mix of comparative tables, line charts, and an image of a nuclear power plant.
Risk Assessment and Management
Industrial & Manufacturing
The slide presents different scenarios for analyzing systems in the energy sector, focusing on how variables like gas and carbon prices, as well as nuclear infrastructure, impact overall performance and risks.
Systems analysis, scenarios, gas prices, carbon prices, nuclear
false
Risk Assessment and Management
Industrial & Manufacturing
Multiple Chart
Deloitte
Add to my slides
Remove from favorites
Column chart displaying Brazilian TAM for BVS's Product Offerings in three categories: Credit Bureau, Debt Renegotiation, E-Commerce Anti-fraud. Red bars, hierarchical values: $700M, $760M, $190M.
Market Analysis and Trends
Financial Services
Slide presents an estimated $2 billion addressable market for BVS's products segmented by type. Details enhancements to BVS products by EFX aiming at increased revenue and market competitiveness.
TAM, Credit Bureau, Debt Renegotiation, E-Commerce, Market Growth, Revenue Enhancement
false
Market Analysis and Trends
Financial Services
Mixed Chart
Barclays
Add to my slides
Remove from favorites
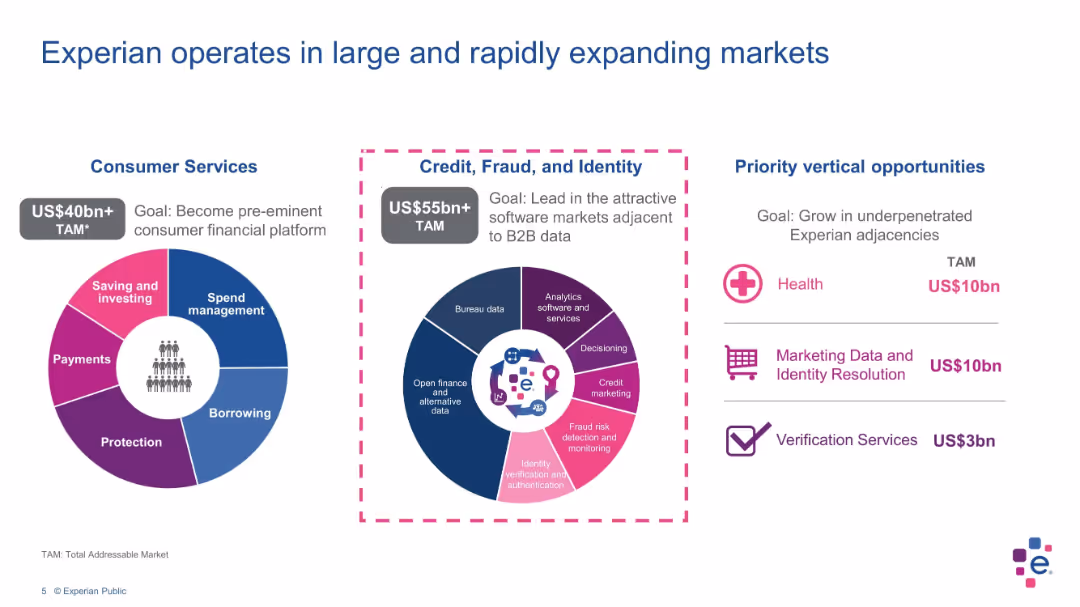
Three circular infographic panels showing market segmentation and TAM values in a colorful layout
Market Analysis and Trends
Technology & Software
This slide outlines Experian’s market opportunities across Consumer Services and Credit, Fraud, and Identity sectors, with total addressable market values and goals. Priority verticals like health and verification services are also highlighted.
TAM, Experian, consumer services, fraud, identity, verticals, strategy
false
Market Analysis and Trends
Technology & Software
Mixed Chart
Barclays
Add to my slides
Remove from favorites
The slide includes a large column chart and textual annotations explaining the potential expansion of the total addressable market (TAM) by Equifax in various segments, particularly in Brazil and other international markets.
Market Analysis and Trends
Technology & Software
Discusses Equifax's strategy to increase its market base and revenue through geographic and product expansion, with a focus on non-mortgage sectors to drive growth in a challenging market environment.
TAM, market expansion, revenue growth, Equifax
false
Market Analysis and Trends
Technology & Software
Mixed Chart
Barclays
Add to my slides
Remove from favorites
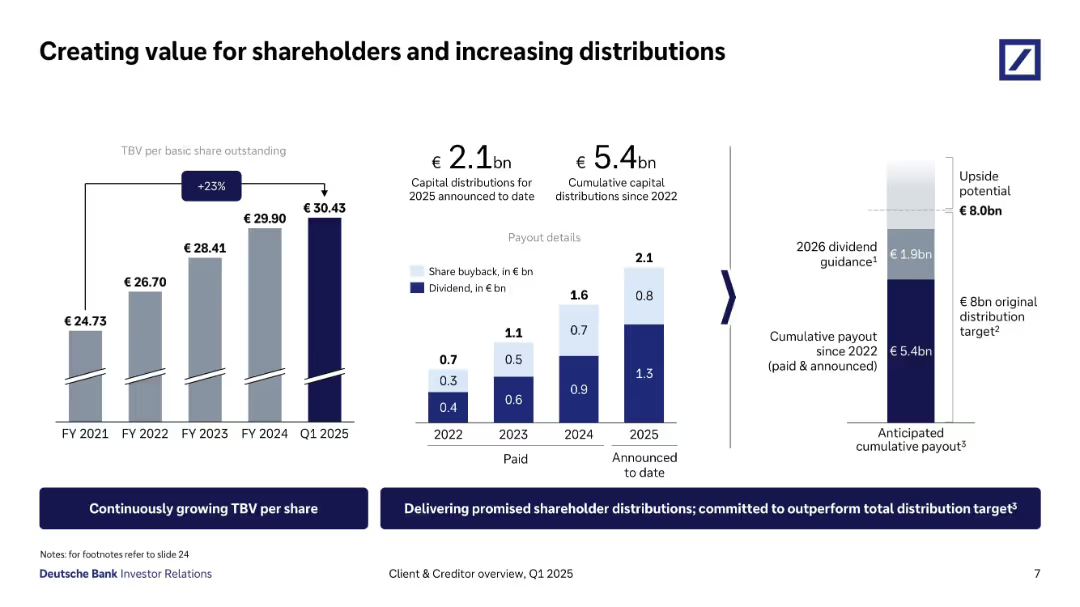
Dual-bar and column charts visualizing TBV/share growth, payout breakdown, and future distribution guidance.
Strategic Planning
Financial Services
This slide shows consistent tangible book value growth per share and cumulative shareholder payouts. It outlines dividend and buyback activity since 2022, reaching €5.4bn, and sets an €8bn distribution target by 2026.
TBV, shareholder returns, dividend, share buyback, capital distribution, 2026 guidance, payout strategy
false
Strategic Planning
Financial Services
Multiple Chart
Deutsche Bank
Add to my slides
Remove from favorites
The slide includes a waterfall chart depicting changes in tangible book value per share (TBVPS) from 3Q22 to 4Q22.
Financial Performance
Financial Services
This slide explains the impact of the rights issue and net loss on TBVPS, detailing various contributing factors like FX and own credit.
TBVPS, rights issue, net loss, tangible book value, financial impact
false
Financial Performance
Financial Services
Single Chart
Credit Suisse
Add to my slides
Remove from favorites
Features a column chart comparing quarterly TCE rates against a cash flow breakeven rate line, with additional annotations for fiscal benchmarks and estimates.
Financial Performance
Transportation & Logistics
Analyzes the company's freight earnings before interest, taxes, depreciation, and amortization over multiple quarters, highlighting efficiency and financial health.
TCE, financial health, cash flow, breakeven, fiscal performance
false
Financial Performance
Transportation & Logistics
Single Chart
Deutsche Bank
Add to my slides
Remove from favorites
Depicts a central graphic with concentric circles detailing governance, strategy, risk management, and targets, accompanied by side text and logos.
Regulatory and Compliance
Industrial & Manufacturing
Discusses how Michelin adheres to the Task Force on Climate-Related Financial Disclosures (TCFD) with a focus on governance, strategy, risk management, and targets related to climate initiatives.
TCFD, Michelin, Climate Change, Financial Disclosures, Risk Management, Strategy, Governance, Environmental Targets, Corporate Responsibility, Sustainability
false
Regulatory and Compliance
Industrial & Manufacturing
Framework
Morgan Stanley
Add to my slides
Remove from favorites
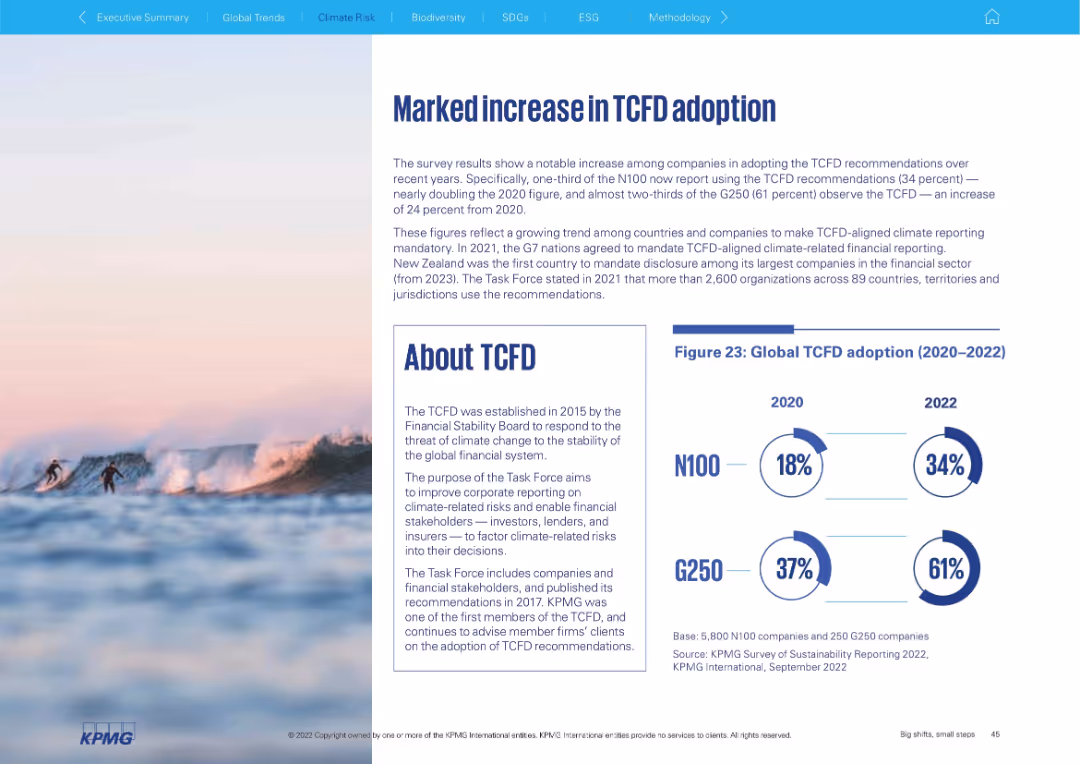
Left: narrative text and About TCFD box; Right: donut chart shows increase in TCFD adoption (2020–2022) for N100 and G250. Surf-themed background adds visual interest.
Regulatory and Compliance
Environmental Services & Sustainability
The slide shows rising corporate adoption of TCFD recommendations between 2020 and 2022. It underscores global efforts to make climate-related disclosures mandatory and presents key facts about TCFD's mission and purpose, with nearly two-thirds of G250 firms now aligned.
TCFD, climate disclosure, ESG, adoption, reporting, G250, N100
false
Regulatory and Compliance
Environmental Services & Sustainability
Mixed Chart
KPMG
Add to my slides
Remove from favorites
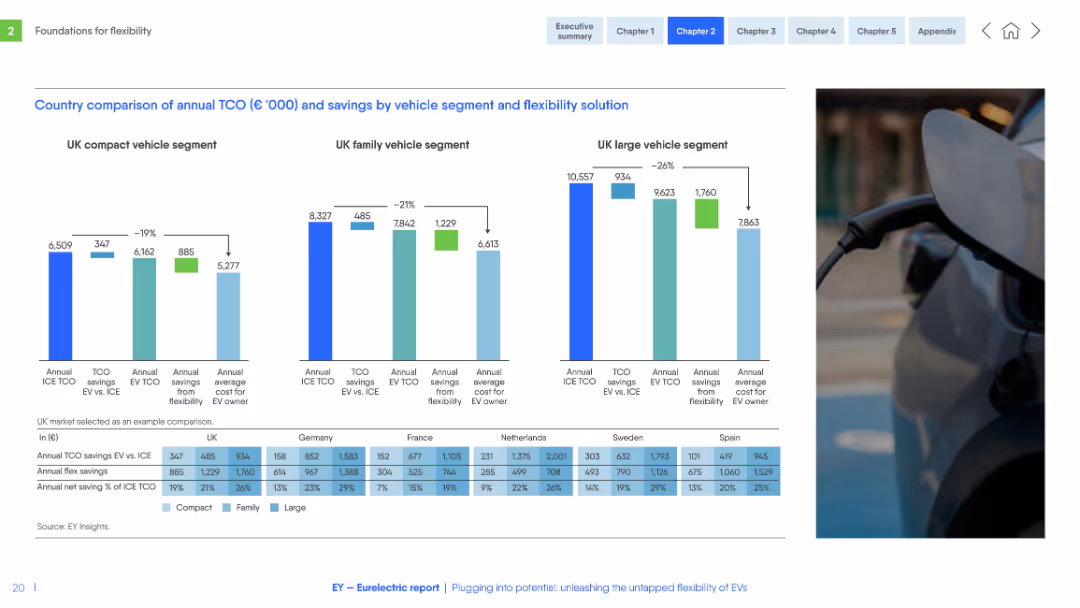
Three side-by-side bar charts for vehicle segments (compact, family, large), with data table below. Consistent color scheme and structured layout.
Financial Performance
Transportation & Logistics
Compares total cost of ownership (TCO) for EVs vs. ICE vehicles in several EU countries across vehicle segments. Shows cost savings from EV flexibility solutions and identifies where EVs are most financially advantageous.
TCO, EV vs ICE, flexibility savings, vehicle segment, Europe, cost analysis, compact, family, large
false
Financial Performance
Transportation & Logistics
Multiple Chart
EY
Add to my slides
Remove from favorites
The slide uses column charts to compare the total cost of ownership (TCO) for different car types (FCEV, BEV, ICE hybrid) in 2019 and long term.
Financial Performance
Energy & Utilities
The slide compares the total cost of ownership for fuel cell electric vehicles, battery electric vehicles, and internal combustion engine hybrids, noting the competitiveness of FCEVs.
TCO, FCEV, BEV, ICE, competitiveness, ownership
false
Financial Performance
Energy & Utilities
Mixed Chart
Kearney
Add to my slides
Remove from favorites
The slide uses column charts to compare the total cost of ownership (TCO) for trucks (FCEV, BEV, Diesel ICE) in 2019 and long term.
Market Analysis and Trends
Energy & Utilities
The slide compares the total cost of ownership for fuel cell electric trucks, battery electric trucks, and diesel internal combustion engine trucks, highlighting competitiveness.
TCO, FCEV, BEV, diesel, trucks, competitiveness
false
Market Analysis and Trends
Energy & Utilities
Mixed Chart
Kearney
Add to my slides
Remove from favorites
The slide is packed with visual elements like icons and small images, descriptions, and various colors to differentiate the tools. It’s well-organized despite the high information density, making use of grids and alignment to maintain clarity.
Technology and Digital Transformation
Professional Services
Introduces THRIVE, a platform with tools for cost management and digital transformation, aimed at improving operational efficiency. The slide outlines each tool’s features and intended use, enhancing understanding of how digital tools can drive business improvements.
THRIVE, digital transformation, cost management, operational efficiency, tools
false
Technology and Digital Transformation
Professional Services
Pillar
Deloitte
Add to my slides
Remove from favorites
Column charts displaying total TLAC, CET1 capital, and leverage ratios
Financial Performance
Financial Services
Shows capital and leverage ratios, including CET1 capital ratio guidance and leverage ratio guidance
TLAC, CET1, leverage, ratios, capital
false
Financial Performance
Financial Services
Multiple Chart
UBS
Add to my slides
Remove from favorites
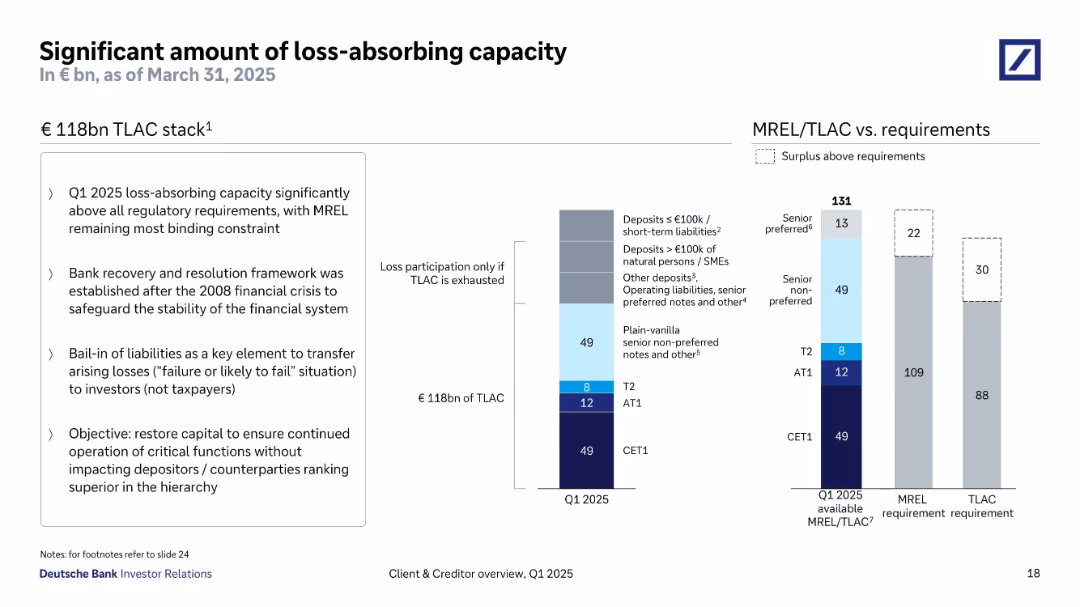
Split into three sections: left text box with bullet points, center TLAC breakdown bar chart, right MREL/TLAC requirement vs. actual chart. Clean and structured with consistent typography and muted color palette.
Risk Assessment and Management
Financial Services
Highlights Deutsche Bank’s €118bn TLAC stack as of Q1 2025, well above regulatory requirements. Emphasizes the importance of bail-in capital, regulatory compliance post-2008, and the preservation of senior claims in the capital hierarchy.
TLAC, MREL, bail-in, financial stability, capital stack, regulation
false
Risk Assessment and Management
Financial Services
Multiple Chart
Deutsche Bank
Add to my slides
Remove from favorites
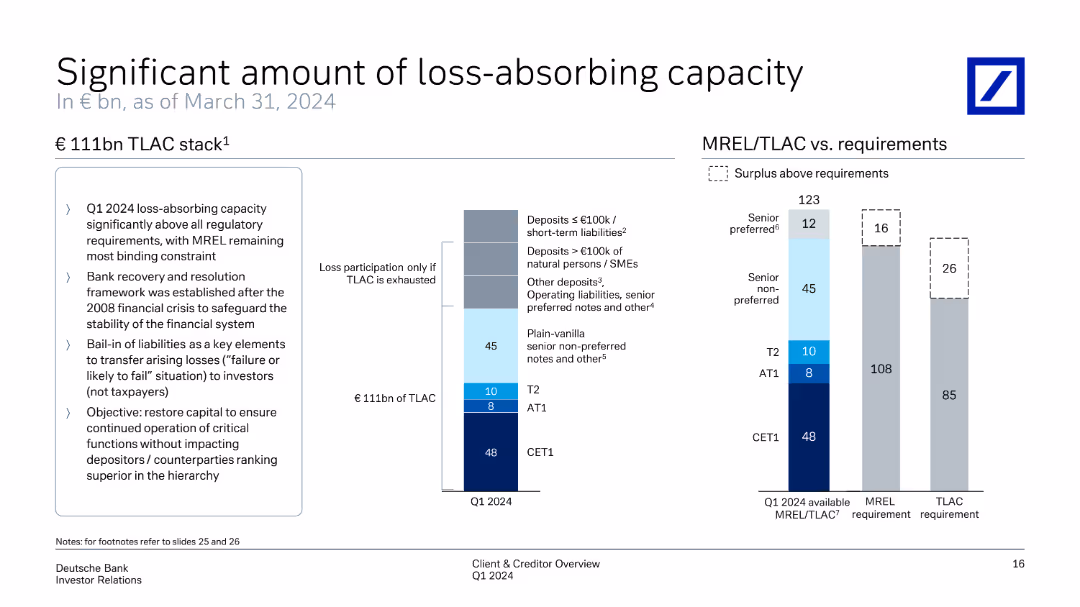
Features a column chart representing €111bn TLAC stack. It explains different tiers and their contributions. On the right, another chart compares MREL/TLAC requirements vs available capacity, highlighting surplus above requirements.
Risk Assessment and Management
Financial Services
Provides a comprehensive view of loss-absorbing capacity, showing how TLAC meets regulatory requirements and safeguards financial stability. It details the distribution of capital across different tiers and surplus management to ensure robust loss absorption.
TLAC, MREL, loss-absorbing capacity, regulatory requirements, financial stability
false
Risk Assessment and Management
Financial Services
Multiple Chart
Deutsche Bank
Add to my slides
Remove from favorites
Displays column charts tracking TLTRO outstanding amounts and impacts on financial ratios over time.
Regulatory and Compliance
Financial Services
Forecasts the trajectory of TLTRO repayments and its implications on liquidity and funding ratios in a regulatory context.
TLTRO, finance, forecast, regulation, compliance, liquidity
false
Regulatory and Compliance
Financial Services
Single Chart
Deutsche Bank
Add to my slides
Remove from favorites
Contains column chart in dark and light blue shades, depicting TLTRO transactions over time.
Financial Performance
Financial Services
Reviews TLTRO metrics and future projections, highlighting impacts on liquidity and financial stability.
TLTRO, financial forecast, liquidity, NSFR, LCR, banking, financial stability, projections
false
Financial Performance
Financial Services
Single Chart
Deutsche Bank
Add to my slides
Remove from favorites
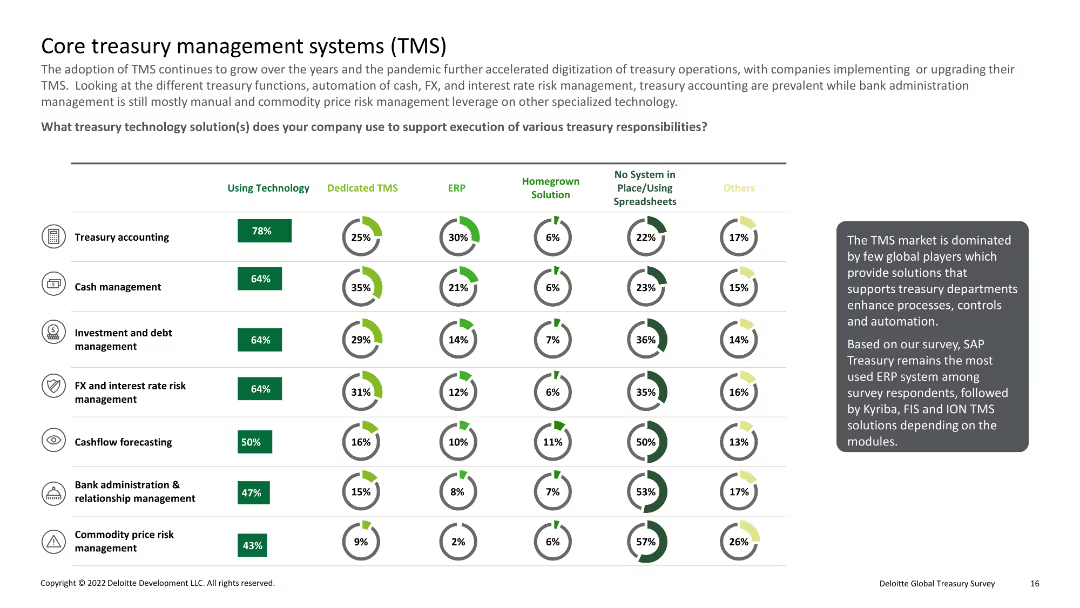
Column charts and pie charts showing usage of various treasury technology solutions such as TMS, ERP, and spreadsheets
Technology and Digital Transformation
Financial Services
Explains the adoption and use of treasury management systems (TMS) and other technologies in different treasury functions.
TMS, ERP, technology, treasury, solutions
false
Technology and Digital Transformation
Financial Services
Multiple Chart
Deloitte
Add to my slides
Remove from favorites
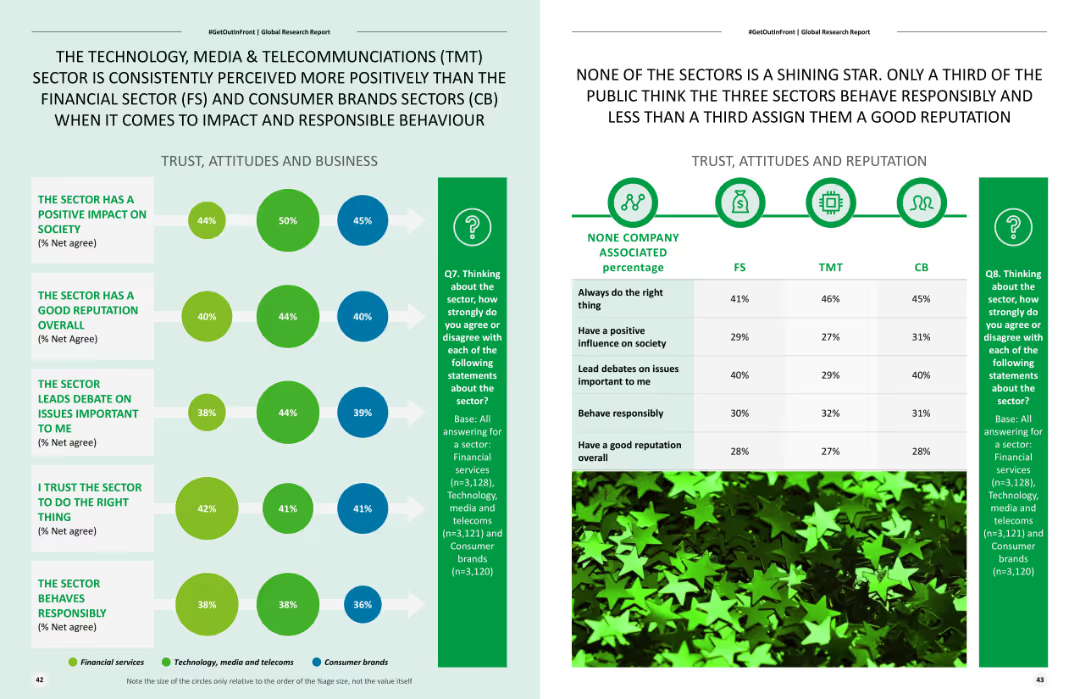
Features two column charts comparing public perceptions of different sectors, with visual elements indicating positive and negative impacts.
Competitive Landscape
Telecommunications
Analyzes public perceptions of the TMT sector compared to financial and consumer brands sectors, focusing on positive impact and responsible behavior.
TMT sector, public perception, positive impact, sector comparison, responsible behavior
false
Competitive Landscape
Telecommunications
Mixed Chart
Deloitte
Add to my slides
Remove from favorites
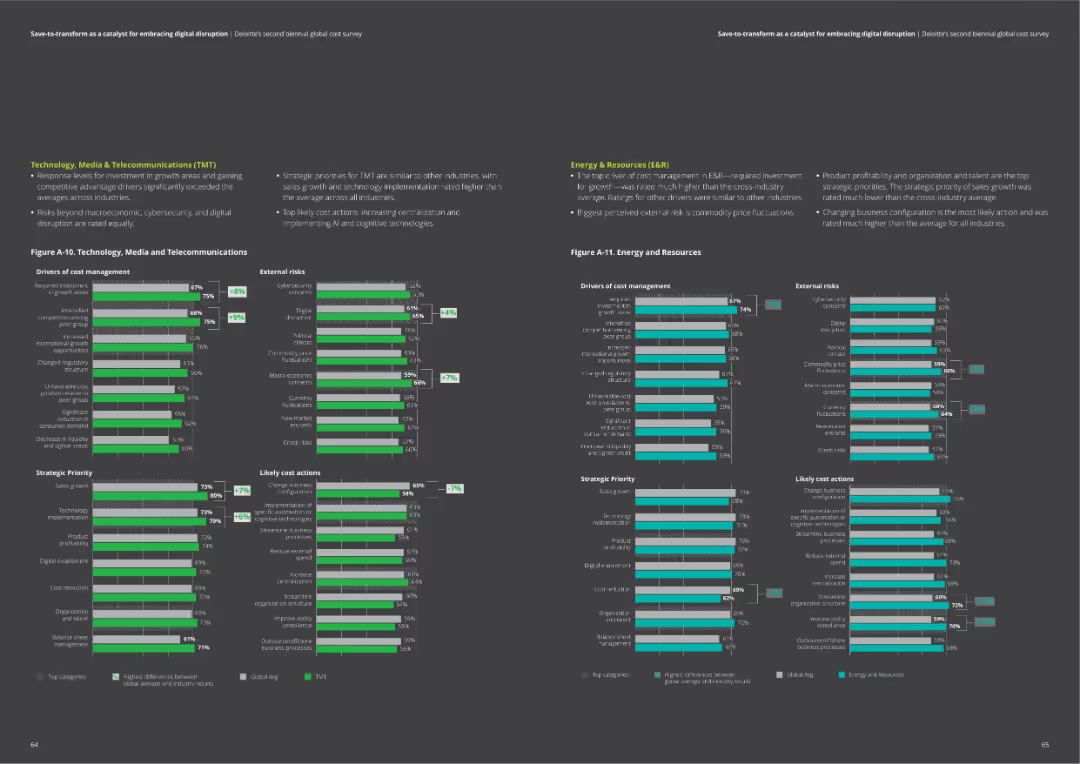
The slide includes two column charts comparing drivers of cost management, external risks, strategic priorities, and likely cost actions for Technology, Media & Telecommunications, and Energy & Resources.
Market Analysis and Trends
Professional Services
Provides detailed comparisons of cost management factors in TMT and Energy sectors. Useful for identifying key areas of focus and potential actions.
TMT, energy, cost drivers, risks, actions, priorities
false
Market Analysis and Trends
Professional Services
Multiple Chart
Deloitte
Add to my slides
Remove from favorites
The slide includes a quote from Ariane Le Port and a column chart showing organic Q1 growth in TMT vs. total Ipsos.
Client Case Studies
Telecommunications
It highlights Ipsos's success with advanced TMT firms, including a quote from Google’s Creative Effectiveness Lead and growth data for the TMT sector.
TMT, growth, clients, revenues, Ipsos
false
Client Case Studies
Telecommunications
Mixed Chart
IPSOS
Add to my slides
Remove from favorites
Bar chart displaying the percentage of "Yes" responses by sector on conducting TNA.
Human Resources and Talent Management
Education & Training
Examines the prevalence of Training Needs Analysis for identifying developmental needs in organizations.
TNA, training, needs, development, sectors
false
Human Resources and Talent Management
Education & Training
Multiple Chart
PwC/Strategy&
Add to my slides
Remove from favorites
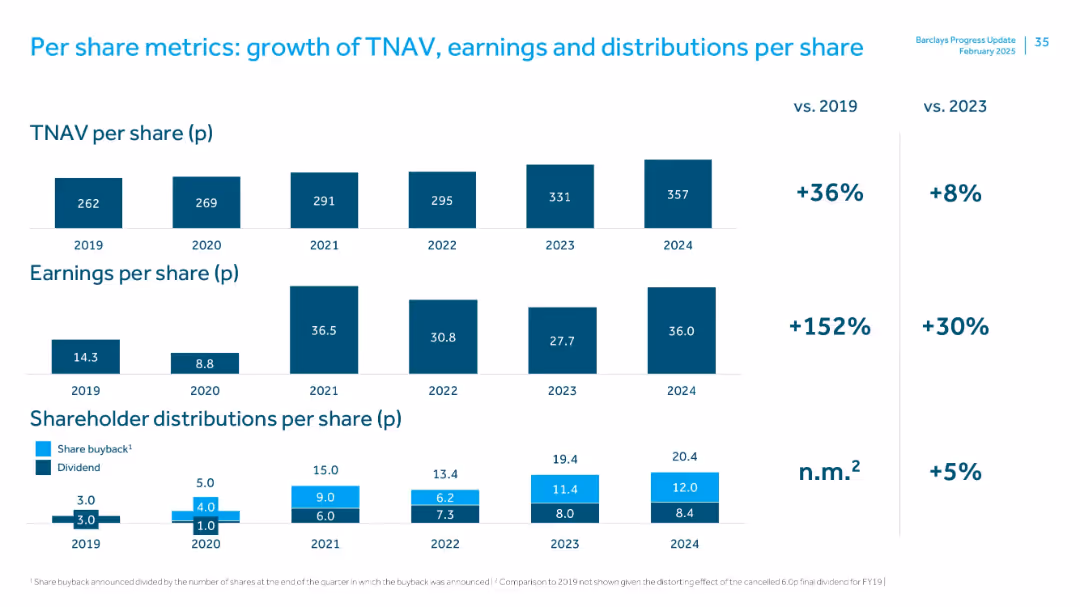
Three-panel stacked bar chart covering TNAV, earnings, and shareholder distributions per share from 2019–2024, with % change vs 2019 and 2023 shown on the right.
Financial Performance
Financial Services
The slide tracks 5-year per-share metrics. TNAV rose 36% vs. 2019; EPS grew 152%, and distributions also increased. A focus on long-term value creation through sustained earnings and return to shareholders.
TNAV, earnings per share, shareholder value, dividend, buyback, 5-year trend
false
Financial Performance
Financial Services
Multiple Chart
Barclays
Add to my slides
Remove from favorites
The slide features two column charts showing TNAV movements per share. The first chart details quarter-on-quarter movements, while the second shows year-to-date movements with various financial components like dividends, share buyback, and others illustrated.
Financial Performance
Financial Services
This slide presents the TNAV per share movements with breakdowns of different contributing factors over quarterly and yearly timelines, providing insights into the financial stability and shareholder value adjustments over time.
TNAV, financial stability, dividends, share buyback
false
Financial Performance
Financial Services
Multiple Chart
Barclays
Add to my slides
Remove from favorites
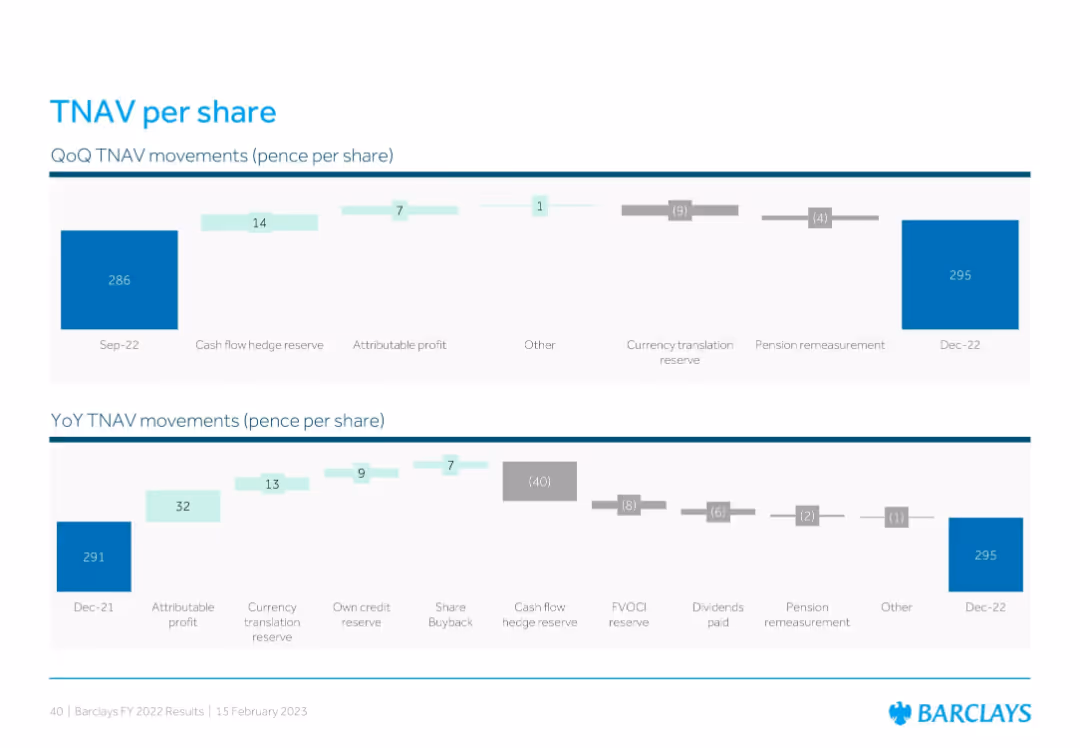
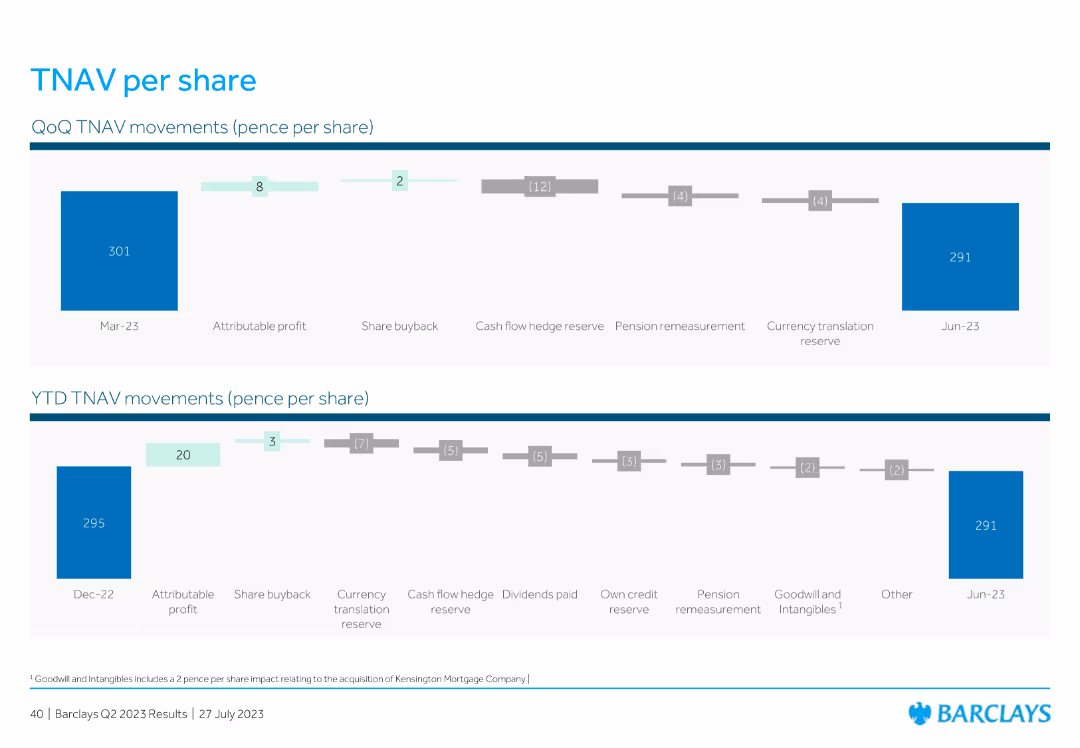
Two waterfall charts showing quarter-over-quarter and year-over-year tangible net asset value (TNAV) per share movements, with annotated drivers like profit, reserves, dividends, and pensions.
Financial Performance
Financial Services
This slide displays changes in Barclays’ tangible net asset value (TNAV) per share for Q4 and FY22. It highlights contributing factors such as attributable profit, cash flow hedge reserve, FX effects, and pension remeasurements, ending with a final TNAV of 295p in Dec-22.
TNAV, profit, reserves, share buyback, dividends, FX impact
false
Financial Performance
Financial Services
Multiple Chart
Barclays
Add to my slides
Remove from favorites
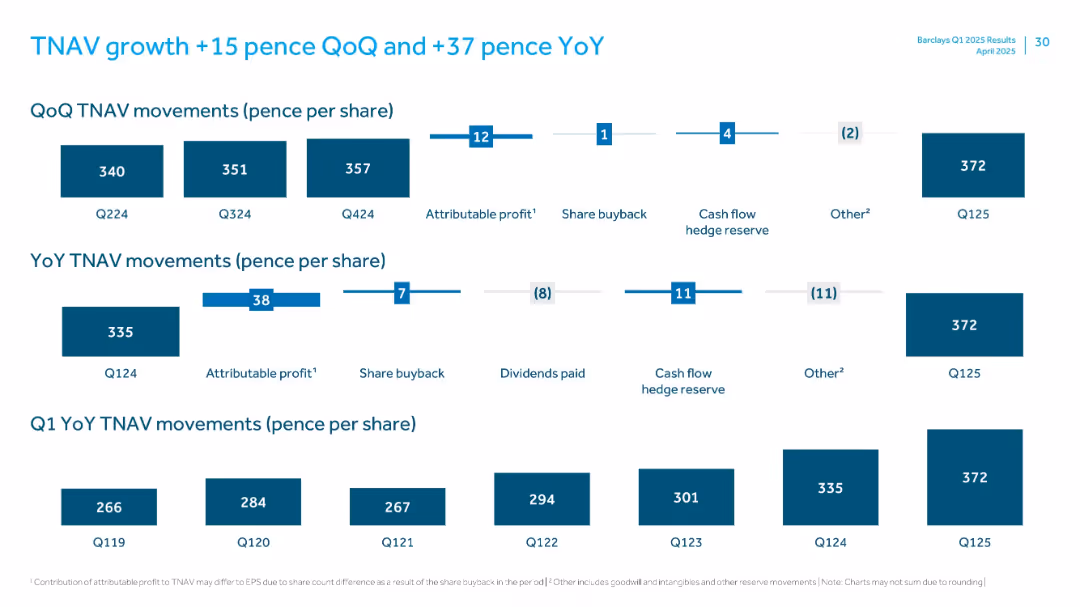
Multi-panel layout with bar charts showing TNAV changes quarterly and yearly per share
Financial Performance
Financial Services
Analyzes tangible net asset value (TNAV) per share movement quarter-over-quarter and year-over-year, attributing changes to profit, buybacks, hedge reserves, and other factors, ending at 372p in Q125.
TNAV, profit, share buyback, hedge reserve, earnings
false
Financial Performance
Financial Services
Multiple Chart
Barclays
Add to my slides
Remove from favorites
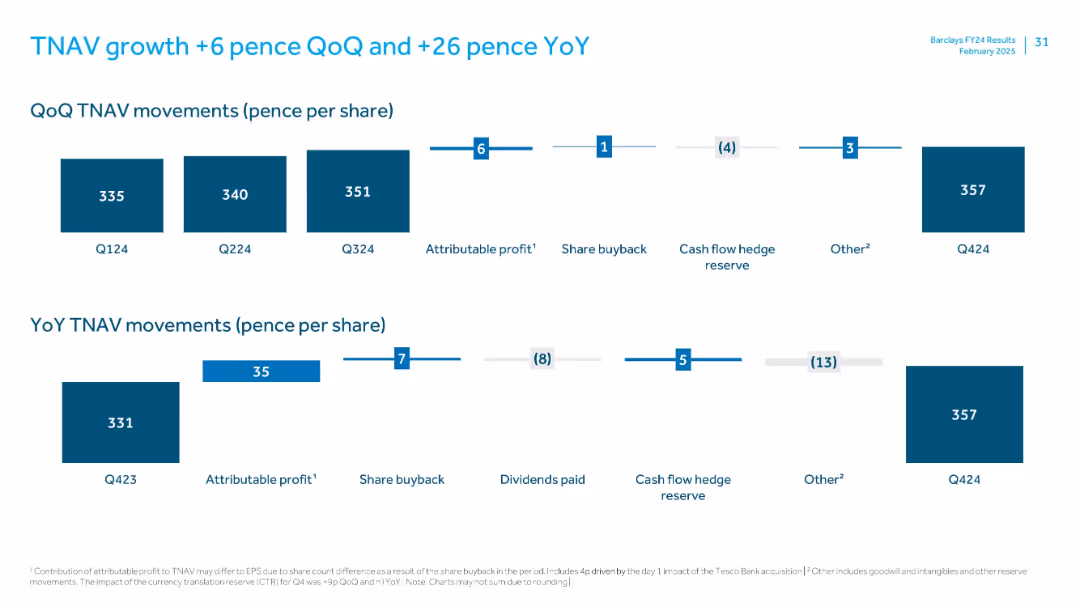
Two horizontal waterfall charts (QoQ and YoY TNAV per share movement) with contributing factors (e.g., profit, buybacks, hedge reserves).
Financial Performance
Financial Services
This slide illustrates tangible net asset value (TNAV) growth per share, with quarterly movement from 351p to 357p and YoY from 331p to 357p. Contributions include profit, share buybacks, and reserve changes.
TNAV, share buyback, profit, Q4 2024, pence per share, dividends
false
Financial Performance
Financial Services
Single Chart
Barclays
Add to my slides
Remove from favorites
This slide features two horizontal charts: one for QoQ TNAV (Tangible Net Asset Value) movements and another for YTD TNAV movements, showing various contributing factors such as profit, share buyback, reserves, and translation reserves.
Financial Performance
Financial Services
The slide details the TNAV per share movements for the quarter and year-to-date, highlighting factors like profit, buybacks, reserves, and other elements impacting the TNAV value.
TNAV, share movements, profit, buyback, reserves
false
Financial Performance
Financial Services
Multiple Chart
Barclays
Add to my slides
Remove from favorites
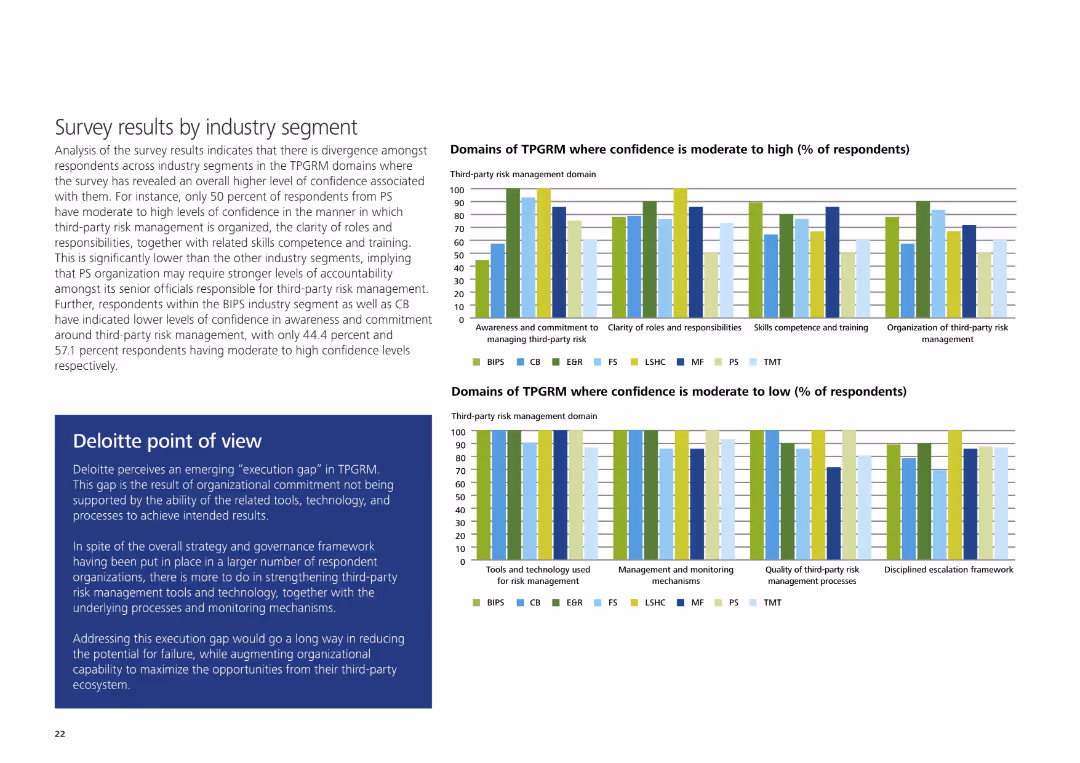
The slide contains two sets of column charts comparing domains of TPGRM with moderate to high and moderate to low confidence levels, alongside Deloitte's POV.
Risk Assessment and Management
Professional Services
It shows survey results indicating confidence levels in various TPGRM domains across industries and includes Deloitte's perspective on closing the execution gap in third-party risk management.
TPGRM, confidence levels, third-party risk management, execution gap, Deloitte, survey
false
Risk Assessment and Management
Professional Services
Multiple Chart
Deloitte
Add to my slides
Remove from favorites
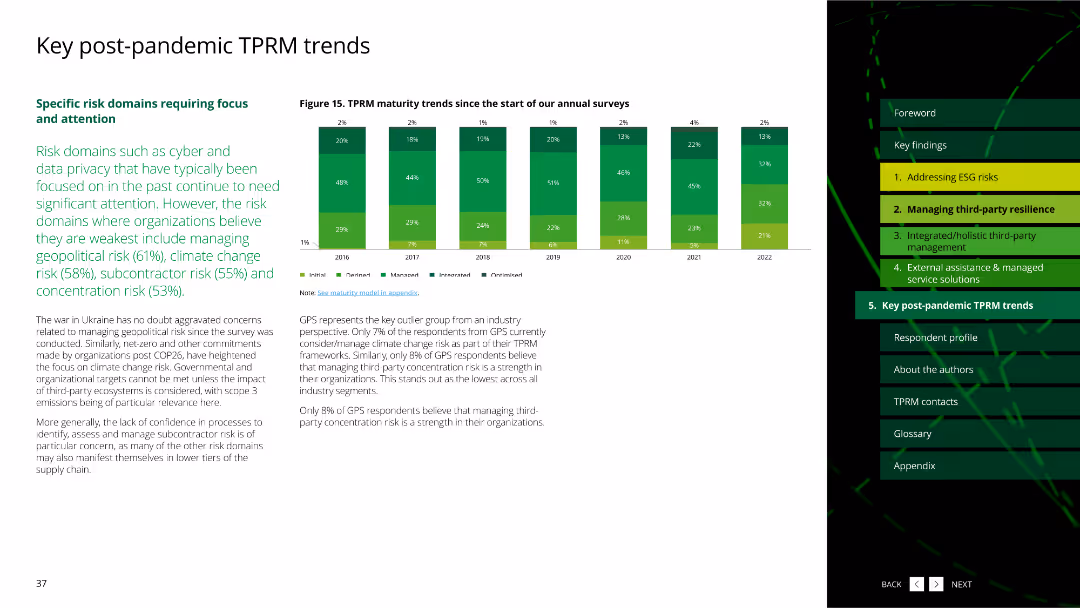
The slide features a column chart, tracking TPRM maturity trends since the start of annual surveys, with bars representing different maturity levels over the years.
Market Analysis and Trends
Professional Services
It presents trends in TPRM maturity, analyzing how organizations have progressed or regressed in their maturity levels from 2016 to 2022.
TPRM maturity trends, annual surveys, column chart, maturity levels, progression, professional services
false
Market Analysis and Trends
Professional Services
Mixed Chart
Deloitte
Add to my slides
Remove from favorites
Previous
Next
You don't have any favorites yet.
Please wait loading your favorites slides...
Create a FREE account to continue browsing
Receive Instant Access to 1,000+ slides from companies like McKinsey, Google, and Goldman Sachs
First Name
Last Name
Email
Password
I agree to all
Terms & Privacy Policy
Thank you! Your submission has been received!
Oops! Something went wrong while submitting the form.
Have an account?
Sign in
Upgrade to PRO to Save slides
Advanced Search and Filters
Access to 15,000+ slides
Access to Category Pages
Save/Bookmark Slides
PowerPoint Template Library
Pick a Plan
MONTHLY
$12/month
Billed every month, Cancel anytime.
YEARLY
$9/year
Billed $108 annually, Cancel anytime.
Checkout for $12/month
Checkout for $108/yr
Secured by Stripe | AES-256 bit encryption