My Account
My Slides
Search by Category
Pricing
Templates
View All Templates
Download Template Slides
✦ AI Search
Feedback
Login
Logout
Get Started
Browse all Slides
Browse all Slides
Create a FREE Account
Instant access to 1,000+ real slides from top companies like McKinsey, BCG, Goldman Sachs, Google and many more!
First Name
Last Name
Email
Password
I agree to all
Terms & Privacy Policy
Thank you! Your submission has been received!
Oops! Something went wrong while submitting the form.
Have an account?
Sign in
Saved Slides
Total No. of slides saved
0
↻ Refresh
✖ Clear all
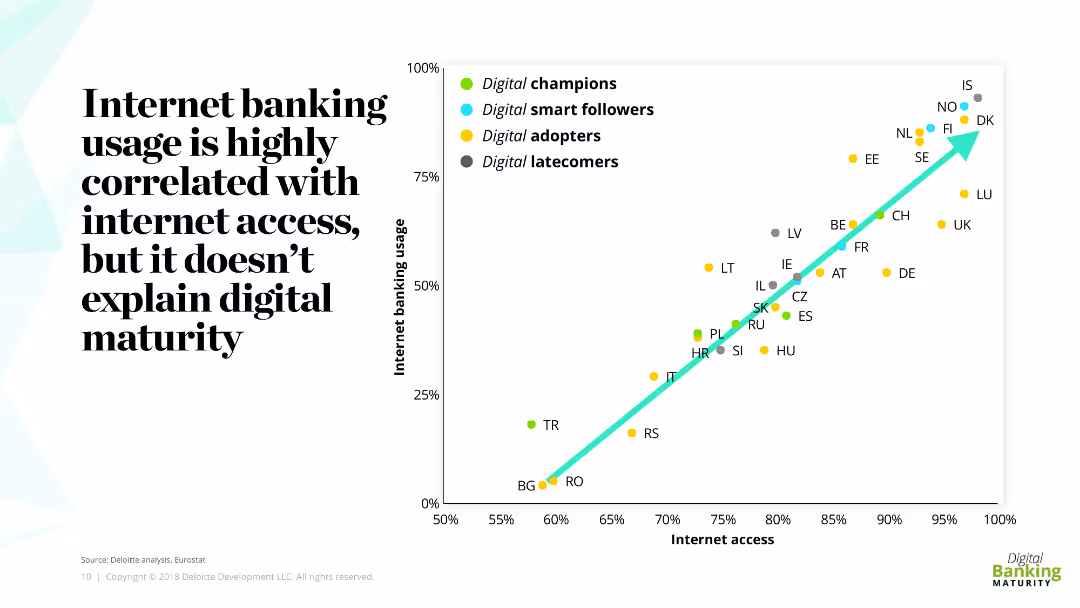
Scatter plot showing correlation between internet banking usage and internet access across various countries, highlighting digital maturity levels.
Market Analysis and Trends
Financial Services
Highlights the correlation between internet banking usage and internet access, indicating that internet access does not fully explain digital maturity levels.
internet banking, usage, internet access, digital maturity, scatter plot
false
Market Analysis and Trends
Financial Services
Mixed Chart
Deloitte
Add to my slides
Remove from favorites
Includes bar graphs and pie charts analyzing the internet coverage and connectivity needs across Indonesian districts, focusing on school connectivity.
Strategic Planning
Telecommunications
Discusses potential strategies for improving internet coverage and network quality in Indonesian schools, essential for enhancing educational outcomes.
internet coverage, network quality, Indonesia, schools, connectivity improvement, educational outcomes
false
Strategic Planning
Telecommunications
Multiple Chart
BCG
Add to my slides
Remove from favorites
A graphically dense slide with statistics on internet downloads, preferences for network reliability, and illustrations that emphasize user engagement with the nbn™ network.
Technology and Digital Transformation
Telecommunications
Highlights the preferred status of the nbn™ network in Australia, its value to users, and the significant amount of internet traffic it handles.
Internet, Downloads, nbn, Connectivity, User Preference, Traffic
false
Technology and Digital Transformation
Telecommunications
Pillar
Accenture
Add to my slides
Remove from favorites
The slide employs a clean layout with a large bar chart that communicates the internet economy's growth in Singapore, along with annotations for future projections.
Financial Performance
Technology & Software
Summarizes the reach of the internet economy in Singapore, considering the challenges faced due to lockdowns, and forecasts growth, highlighting digital transformation and economic resilience.
Internet economy, Economic resilience, Lockdown challenges, Growth projection
false
Financial Performance
Technology & Software
Single Chart
Bain
Add to my slides
Remove from favorites
The slide is minimalistic with a single bar chart depicting the growth of the internet economy in the Philippines. The projected growth is also indicated.
Financial Performance
Technology & Software
Highlights the doubling of the Philippines' internet economy in 2021 and its expected future value, emphasizing the impact of the pandemic and government initiatives.
Internet economy, Growth forecast, Government initiatives, Pandemic impact
false
Financial Performance
Technology & Software
Single Chart
Bain
Add to my slides
Remove from favorites
A single column chart shows the resilient growth of Malaysia's internet economy GMV from 2015 to projected 2025.
Market Analysis and Trends
Technology & Software
Shows Malaysia's internet economy's resilient growth, reaching US $11B with future projections and growth rate.
Internet economy, Malaysia, GMV, Resilience, Growth, Projections, 2015, 2025
false
Market Analysis and Trends
Technology & Software
Single Chart
Bain
Add to my slides
Remove from favorites
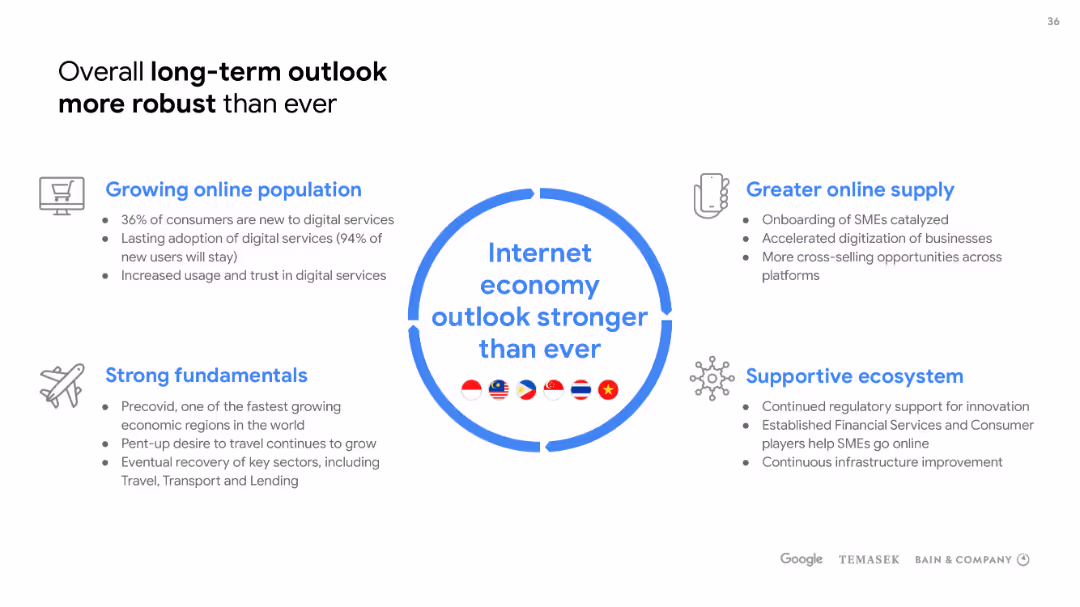
Dominated by a large circular infographic in the center, with descriptive bullet points around it, the slide uses a balance of icons, text, and graphics on a white background.
Strategic Planning
Technology & Software
Focuses on the long-term positive outlook of the internet economy, citing growing online population, strong fundamentals, greater online supply, and a supportive ecosystem. Useful for strategic planning discussions.
Internet economy, outlook, online population, fundamentals, ecosystem
false
Strategic Planning
Technology & Software
Header Vertical
Bain
Add to my slides
Remove from favorites
Contains a stacked column chart showing market size by segment and a bulleted list on the left, with annotations and a footnote.
Industry Overview
Technology & Software
Summarizes the internet economy's expected growth in Southeast Asia by 2025, breaking down the market into ecommerce, travel, and online media segments with a focus on the significant share of ecommerce and travel in online retail spend.
Internet economy, SEA, market size, ecommerce, travel, online media
false
Industry Overview
Technology & Software
Single Chart
Bain
Add to my slides
Remove from favorites
Slide features bar graphs comparing GMV of Thailand’s internet economy from 2019 to 2025, highlighted by growth rates. Sparse text.
Industry Overview
Technology & Software
Predicts the growth of Thailand’s internet economy despite challenges, with an estimated value reaching $57B by 2025.
Internet Economy, Thailand, Growth, Projection, Pandemic, Political, GMV, 2025
false
Industry Overview
Technology & Software
Single Chart
Bain
Add to my slides
Remove from favorites
Bar graph showing growth in internet economy GMV from 2019 to 2025, with a forecast. The layout is clean with a central graph and annotations for CAGR percentages. The color scheme is blue and gray, adhering to a professional look.
Financial Performance
Technology & Software
The slide presents the growth of Vietnam's internet economy, reaching $21 billion. It provides a positive outlook on the government and economy's resilience, with projections up to 2025.
Internet Economy, Vietnam, GMV, Resilience, Government, Growth, Forecast, CAGR
false
Financial Performance
Technology & Software
Single Chart
Bain
Add to my slides
Remove from favorites
The slide features a single, prominent column chart showing growth from 2015 to 2020 with future projections to 2025 for Vietnam's Internet economy, including percentage growth rates.
Market Analysis and Trends
Financial Services
It illustrates the growth of Vietnam's Internet e-Conomy Gross Merchandise Value (GMV), highlighting past performance and future expectations with a Compound Annual Growth Rate (CAGR) analysis.
Internet Economy, Vietnam, Growth, Projections, GMV
false
Market Analysis and Trends
Financial Services
Single Chart
Bain
Add to my slides
Remove from favorites
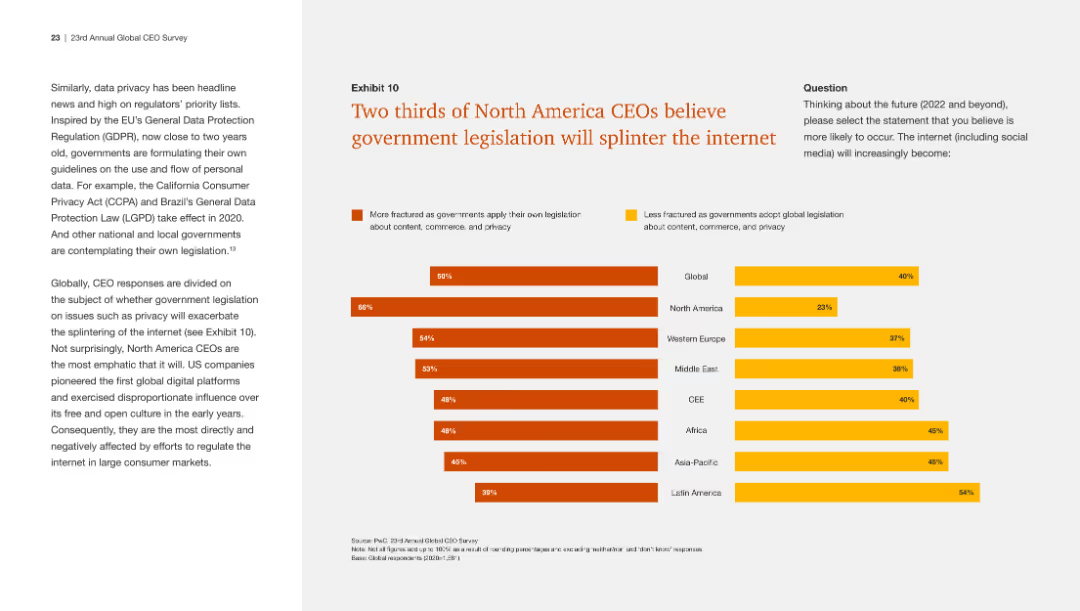
Utilizes bar charts to display CEO opinions on the potential fragmentation of the internet due to government legislation across various regions. The slide is cleanly organized with a consistent color scheme to denote different responses.
Regulatory and Compliance
Financial Services
Reveals the perspectives of North American CEOs on government legislation and its impact on the internet's integrity, serving as a discussion point for internet regulation and corporate strategy implications.
Internet fragmentation, CEO beliefs, Government legislation, Regional impact, Corporate strategy
false
Regulatory and Compliance
Financial Services
Multiple Chart
PwC/Strategy&
Add to my slides
Remove from favorites
This slide features a bar chart showing regional differences in CEO opinions on whether government legislation will fracture the internet. It is detailed and visually organized.
Regulatory and Compliance
Technology & Software
The slide indicates that a significant portion of North American CEOs believe government legislation will lead to a fragmented internet, compared to other regions.
Internet, legislation, North America, CEO opinions, government
false
Regulatory and Compliance
Technology & Software
Multiple Chart
PwC/Strategy&
Add to my slides
Remove from favorites
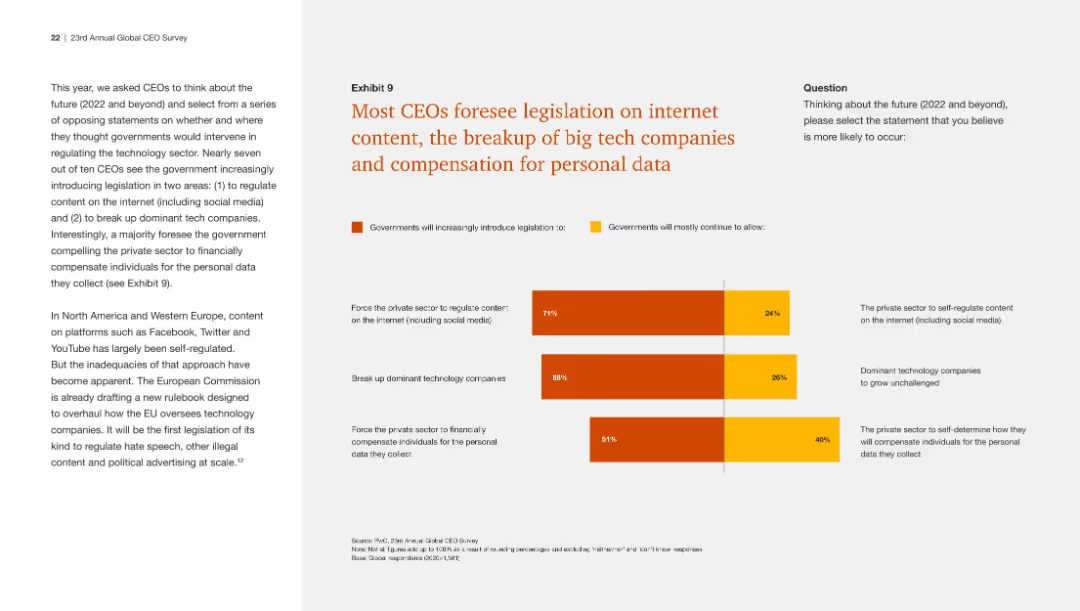
This slide includes a bar chart showing CEOs' predictions about future legislation on internet content, tech company breakups, and personal data compensation. The design is clear.
Regulatory and Compliance
Technology & Software
The slide presents survey results indicating that most CEOs believe there will be increased government regulation in internet content, tech company breakups, and data compensation.
Internet legislation, tech companies, personal data, CEO predictions, regulation
false
Regulatory and Compliance
Technology & Software
Mixed Chart
PwC/Strategy&
Add to my slides
Remove from favorites
Features bar charts contrasting the expected government actions as foreseen by CEOs. The data is arranged to facilitate comparison between interventions and maintains the color-coding for visual clarity.
Regulatory and Compliance
Financial Services
The slide presents CEO predictions on government interventions in tech regulation, big tech breakup, and personal data compensation. It serves as an insight into future regulatory expectations and is relevant for discussions on privacy, data management, and corporate governance.
Internet legislation, Tech regulation, CEO forecasts, Data privacy, Government intervention, Big tech
false
Regulatory and Compliance
Financial Services
Mixed Chart
PwC/Strategy&
Add to my slides
Remove from favorites
A slide featuring comparative bar charts to showcase internet penetration rates in ASEAN vs. the EU and US from 2016 to 2021. A clean layout with contrasting colors aids the viewer in data comparison.
Market Analysis and Trends
Technology & Software
This slide compares internet penetration rates between ASEAN, the EU, and the US, illustrating ASEAN's growth. It likely serves to highlight the potential for digital talent demand in ASEAN due to this increased connectivity.
internet penetration, ASEAN, EU, US, comparison
false
Market Analysis and Trends
Technology & Software
Mixed Chart
Kearney
Add to my slides
Remove from favorites
Stacked bar charts for different activities and a side note explaining data preference for nbn™ network, presented on a purple and white theme.
Product and Service Analysis
Technology & Software
Compares preferences for nbn™ network versus mobile data for entertainment activities, showcasing a strong preference for fixed-line broadband.
internet preferences, nbn network, mobile data, entertainment, streaming, gaming, social media, usage comparison
false
Product and Service Analysis
Technology & Software
Multiple Chart
Accenture
Add to my slides
Remove from favorites
Bubble chart showing the projected revenue growth from 2018 to 2023 in different media sectors, with size indicating magnitude.
Market Analysis and Trends
Media & Entertainment
Analyzes the future revenue growth in internet access and advertising compared to other media sectors, projecting significant growth for internet sectors.
Internet, Revenue Growth, Media, 2018-2023, Advertising, Access
false
Market Analysis and Trends
Media & Entertainment
Multiple Chart
PwC/Strategy&
Add to my slides
Remove from favorites
Slide with number 2, a bar chart illustrating average internet download speeds in SEA countries compared to global averages, complemented by a text box with key insights.
Market Analysis and Trends
Telecommunications
This slide compares internet speeds in SEA to the global average, emphasizing the disparity and focusing on infrastructure challenges. It is useful for discussions on digital growth potential and strategic planning in telecommunications across the region.
internet speed, SEA, global comparison, infrastructure, telecommunications, Singapore
false
Market Analysis and Trends
Telecommunications
Single Chart
Bain
Add to my slides
Remove from favorites
A pie chart and bar graphs with percentages in shades of purple. The slide focuses on Australian users' preferences for the nbn™ network over mobile data for internet connection.
Market Analysis and Trends
Telecommunications
It shows a consumer survey's findings on preferences for internet access at home, with a majority favoring the nbn™ network over mobile data for its reliability, affordability, and speed.
Internet, Survey, Preferences, Home Connection, nbn™, Mobile Data, Reliability, Affordability, Speed, Australia
false
Market Analysis and Trends
Telecommunications
Multiple Chart
Accenture
Add to my slides
Remove from favorites
The slide shows a vertical bar chart comparing the percentage of people agreeing with the statement about the importance of the internet across various countries.
Market Analysis and Trends
Technology & Software
The slide highlights global survey results indicating a widespread recognition of the importance of the internet in people's lives.
Internet, technology, global survey, public opinion, internet importance
false
Market Analysis and Trends
Technology & Software
Multiple Chart
IPSOS
Add to my slides
Remove from favorites
A bar chart with gray and blue bars indicating different frequencies of internet usage, labeled for various times.
Market Analysis and Trends
Technology & Software
Highlights the change in internet usage frequency before, during, and after lockdowns, demonstrating a shift in consumer behavior.
internet usage, frequency, lockdown, consumer behavior, shift
false
Market Analysis and Trends
Technology & Software
Single Chart
Bain
Add to my slides
Remove from favorites
The slide presents a series of column charts comparing the average hours spent online per day for personal use in six Southeast Asian countries, across three time phases labeled before, during, and after.
Market Analysis and Trends
Technology & Software
This slide shows the trends in internet usage in Southeast Asia, highlighting an increase with the Philippines showing the most significant rise. It's useful for analyzing digital engagement and behavior changes.
internet usage, Southeast Asia, Philippines, column chart, before, during, after, personal use, trend
false
Market Analysis and Trends
Technology & Software
Single Chart
Bain
Add to my slides
Remove from favorites
Horizontal bar chart showing the growth of internet users aged 18+ and digitally active users from 2020 to 2030 with CAGR rates.
Market Analysis and Trends
Media & Entertainment
This slide highlights the expected growth of digitally active users in India, projecting that 85% of internet users will be digitally active by 2030.
internet, users, growth, digital, CAGR
false
Market Analysis and Trends
Media & Entertainment
Multiple Chart
BCG
Add to my slides
Remove from favorites
Slide with a timeline showing the growth in internet users over three years. Each year is represented by a different size and colored circle, with numbers indicating user growth.
Market Analysis and Trends
Technology & Software
Provides a visual representation of internet user growth in Southeast Asia, showing the year-over-year increase. Used for discussing trends in digital adoption and the expanding internet user base.
Internet Users, Growth, SEA
false
Market Analysis and Trends
Technology & Software
Single Chart
Bain
Add to my slides
Remove from favorites
The slide features a large title at the top with three proportional circle diagrams beneath, showing the increasing number of internet users from 2019 to 2022. It includes percentages and numerical data, labeled clearly to show growth over the years. The colors range from light to dark blue.
Industry Overview
Technology & Software
This slide visually demonstrates the growth in the number of internet users over a three-year span, highlighting the impact of the pandemic on digital adoption. It's useful for illustrating market growth in technology use and for identifying digital expansion trends in Southeast Asia.
internet users, SEA, pandemic, market growth, technology adoption, digital expansion, 2019-2022, circle diagrams
false
Industry Overview
Technology & Software
Multiple Chart
Bain
Add to my slides
Remove from favorites
Slide showcases three circles growing in size from left to right with labels for 2015, 2019, and 2020, indicating the increasing number of internet users in SEA.
Market Analysis and Trends
Technology & Software
Illustrates the explosive growth of the internet user base in Southeast Asia from 2015 to 2020, emphasizing the rapid digital adoption in the region.
Internet users, Southeast Asia, growth, digital adoption, comparative analysis, 2020, 2015, 2019
false
Market Analysis and Trends
Technology & Software
Multiple Chart
Bain
Add to my slides
Remove from favorites
Contains a circular diagram with three sections labeled "Composable Tech," "Cloud," and "Collaboration," each with relevant icons and descriptions in purple. The background is light with minimal distractions.
Operational Efficiency
Technology & Software
Provides best practices for improving interoperability. It emphasizes leveraging cloud technology, using composable tech, and fostering collaboration to compress transformation and improve efficiency.
interoperability, best practices, cloud, collaboration, tech
false
Operational Efficiency
Technology & Software
Framework
Accenture
Add to my slides
Remove from favorites
Contains graphical representations and icons discussing the cloud, composable tech, and collaboration. Utilizes a purple color scheme and is designed to be visually engaging with clear separations between sections.
Technology and Digital Transformation
Technology & Software
Provides strategies for enhancing interoperability in business environments, focusing on the use of cloud technology and collaborative efforts. Ideal for workshops on technology optimization and strategic IT planning.
interoperability, cloud technology, collaboration, strategic planning, IT optimization
false
Technology and Digital Transformation
Technology & Software
Vertical Flow
Accenture
Add to my slides
Remove from favorites
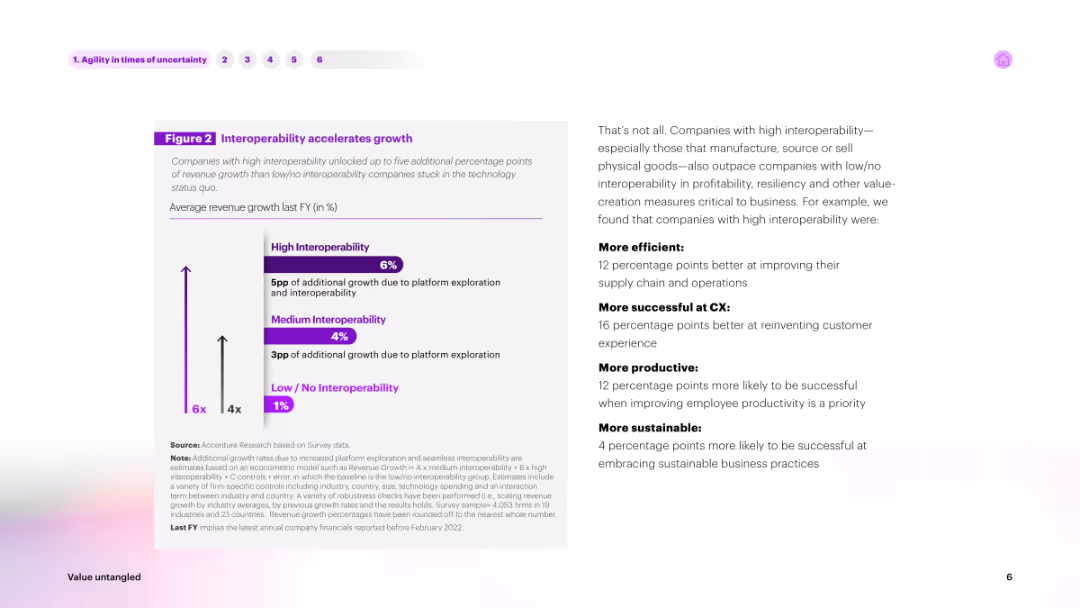
Contains text on the left and a column chart on the right. The chart shows percentages of revenue growth based on interoperability levels, with columns for High, Medium, and Low/No Interoperability in shades of purple.
Technology and Digital Transformation
Technology & Software
Explains how high interoperability accelerates growth. It presents survey data showing companies with high interoperability achieving higher revenue growth compared to those with low interoperability, emphasizing the benefits of platform exploration and integration.
interoperability, growth, technology, revenue, survey
false
Technology and Digital Transformation
Technology & Software
Mixed Chart
Accenture
Add to my slides
Remove from favorites
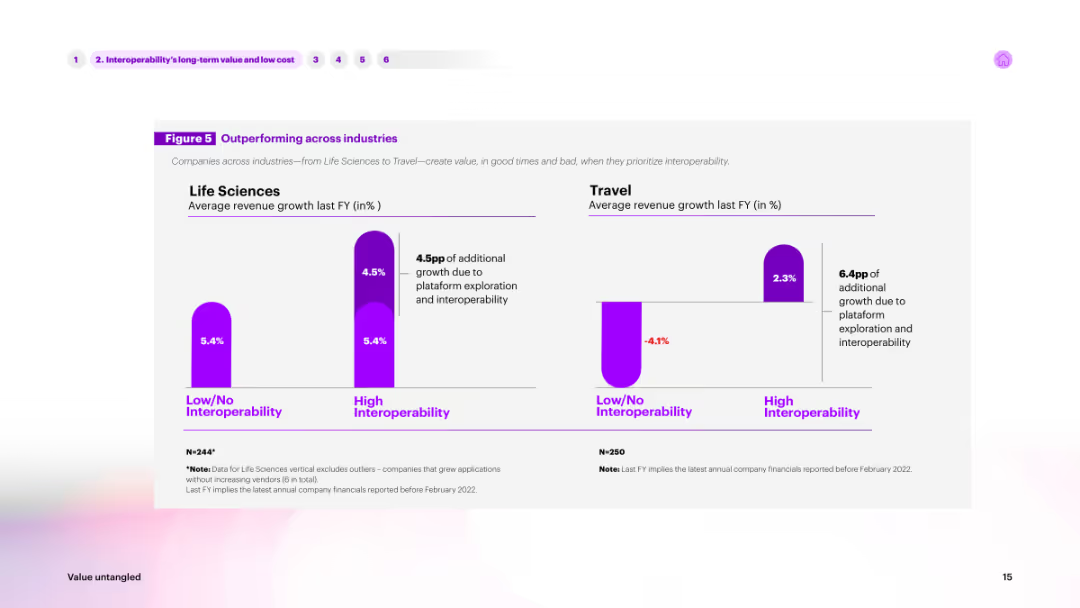
The slide features a column chart comparing average revenue growth across industries (Life Sciences, Travel) based on interoperability. High interoperability is shown in purple, while low/no interoperability is shown in a lighter shade.
Market Analysis and Trends
Technology & Software
Highlights how interoperability impacts revenue growth in different industries. The chart compares life sciences and travel sectors, showing significant growth advantages for companies with high interoperability.
interoperability, industry comparison, revenue, growth, life sciences
false
Market Analysis and Trends
Technology & Software
Multiple Chart
Accenture
Add to my slides
Remove from favorites
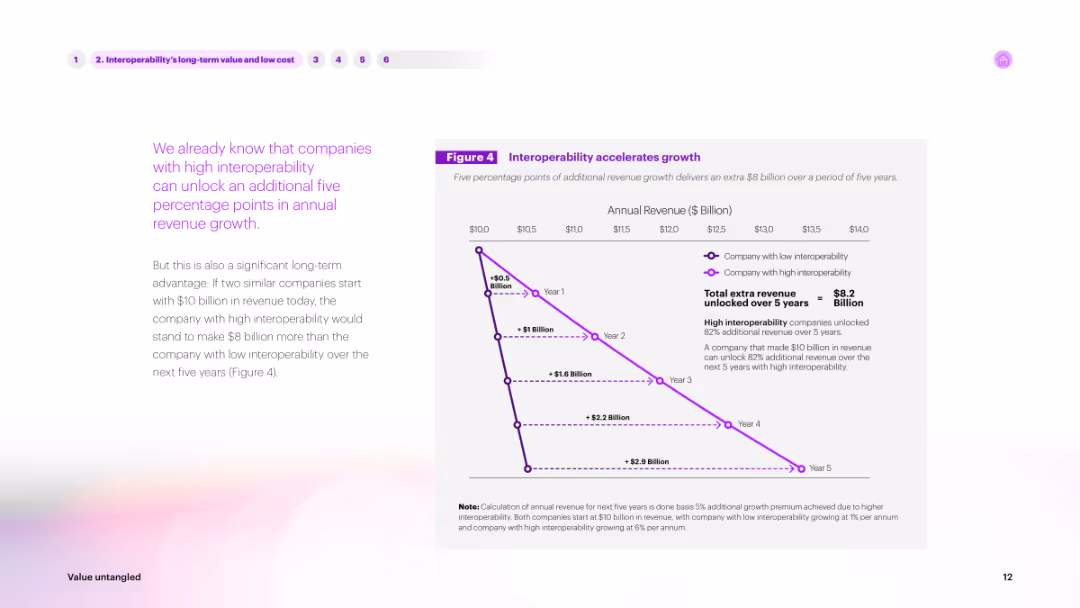
The slide features text on the left and a line graph on the right. The graph shows annual revenue growth over five years for companies with high vs. low interoperability, with a purple line indicating high interoperability advantages.
Market Analysis and Trends
Technology & Software
Describes the long-term value of interoperability. The line graph illustrates how companies with high interoperability can unlock significant revenue growth over five years, making a compelling case for investing in interoperable solutions.
interoperability, long-term value, revenue, growth, trends
false
Market Analysis and Trends
Technology & Software
Mixed Chart
Accenture
Add to my slides
Remove from favorites
Features a bar chart comparing growth rates based on interoperability levels across different regions, set against a gradient purple background. Includes detailed descriptions and key statistical highlights.
Technology and Digital Transformation
Technology & Software
Analyzes the correlation between high interoperability and increased revenue growth in Growth Markets, suggesting strategies for technology integration and business transformation. Useful for IT and business strategy meetings.
interoperability, revenue growth, Growth Markets, technology integration, business transformation
false
Technology and Digital Transformation
Technology & Software
Mixed Chart
Accenture
Add to my slides
Remove from favorites
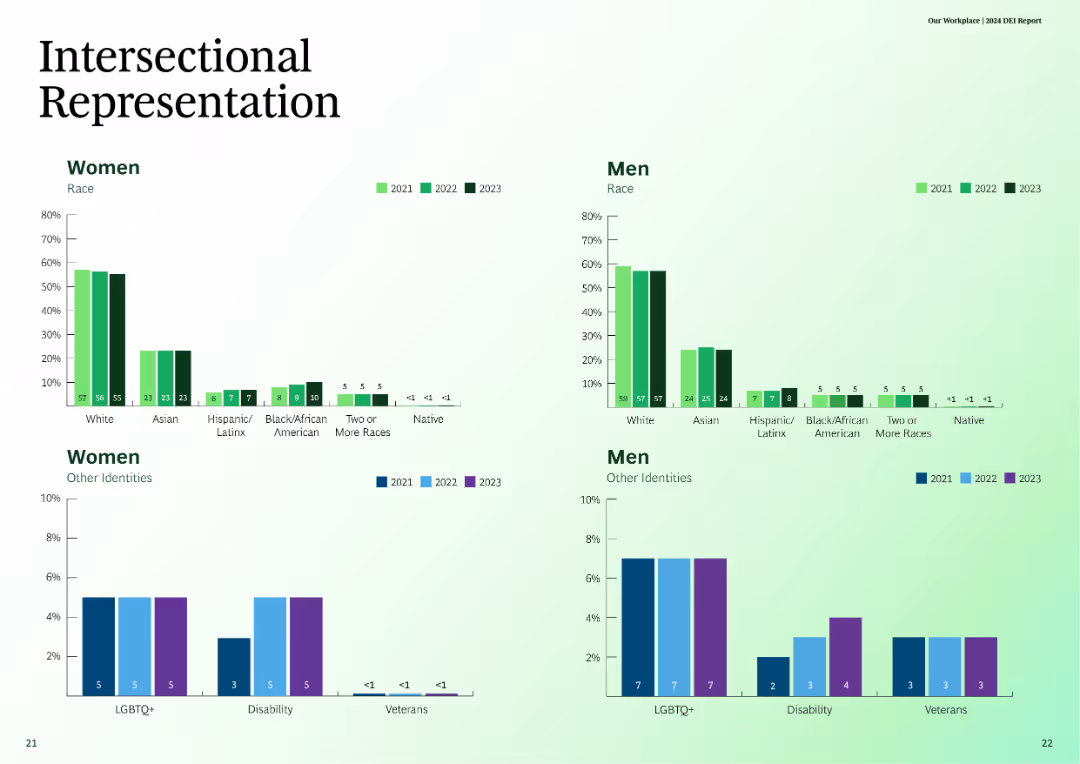
This slide uses column charts to show intersectional representation of different races and identities among men and women over three years.
Customer and Market Segmentation
Professional Services
The slide provides data on intersectional representation in terms of race and other identities among men and women in the years 2021, 2022, and 2023.
intersectional, representation, race, gender, identity
false
Customer and Market Segmentation
Professional Services
Multiple Chart
BCG
Add to my slides
Remove from favorites
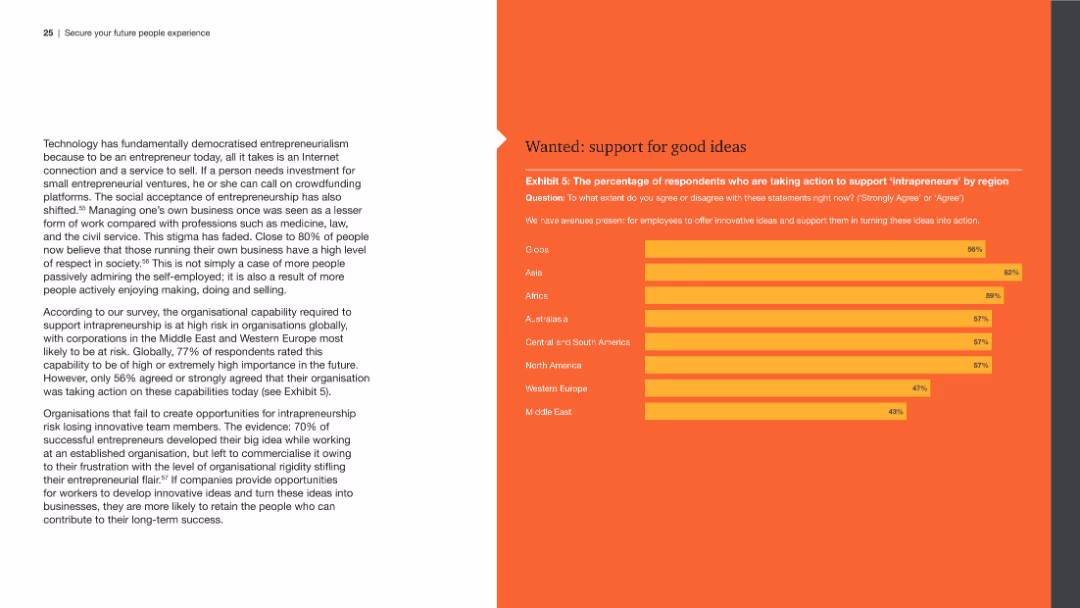
The slide consists of a left panel with text discussing entrepreneurial support and a right panel with a horizontal bar chart showing regional differences in support for intrapreneurs.
Human Resources and Talent Management
Professional Services
This slide addresses the organizational support needed for intrapreneurship, presenting survey data on regional variations in providing avenues for innovative ideas and their implementation.
Intrapreneurship, entrepreneurial support, innovation, regional differences, survey data
false
Human Resources and Talent Management
Professional Services
Mixed Chart
PwC/Strategy&
Add to my slides
Remove from favorites
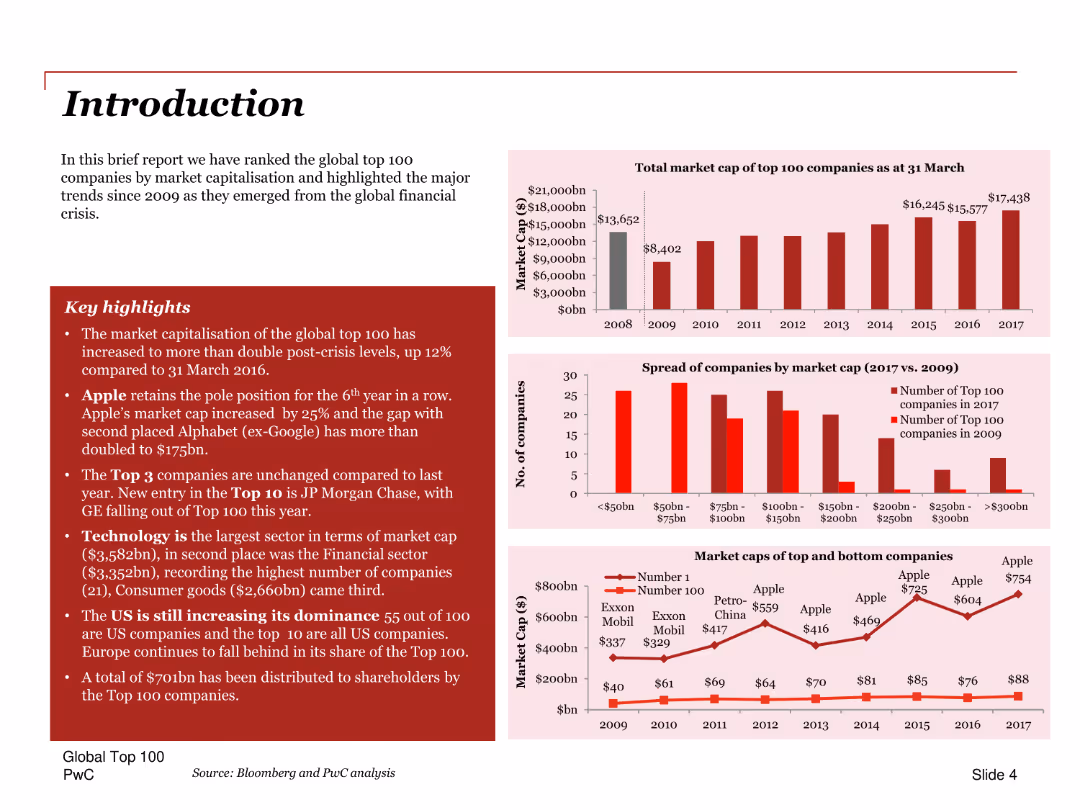
A title slide with an introduction to a report, featuring key highlights and column charts showing market capitalization trends.
Industry Overview
Technology & Software
Introduces the report on the global top 100 companies by market capitalization, highlighting key trends and changes since 2009. Includes insights on technology sector dominance.
Introduction, market capitalization, trends, global top 100, key highlights, technology, financial crisis, market trends
false
Industry Overview
Technology & Software
Multiple Chart
PwC/Strategy&
Add to my slides
Remove from favorites
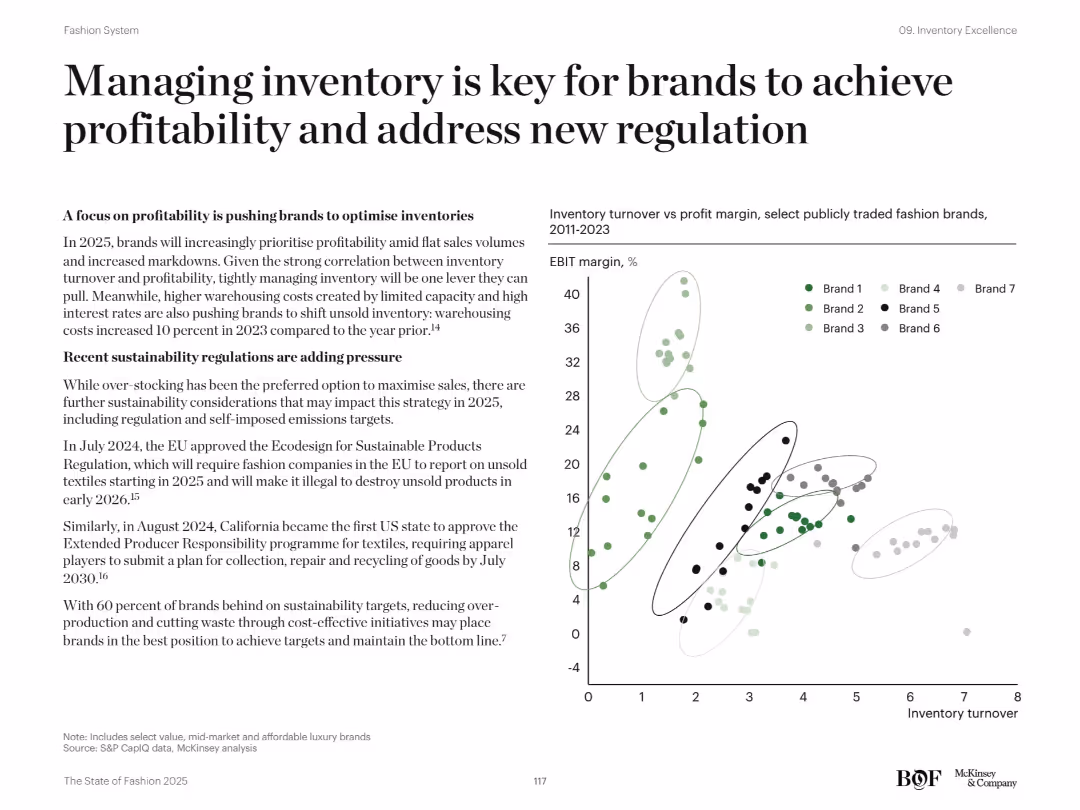
Left side text on profitability and regulation; right-hand scatter plot of inventory turnover vs profit margin
Risk Assessment and Management
Retail & E-commerce
The slide emphasizes how managing inventory effectively supports profitability and compliance with new sustainability regulations. It discusses EU and California policies on unsold textiles and highlights cost pressures. A scatter plot shows the relationship between EBIT margin and inventory turnover across various fashion brands.
inventory management, profitability, regulation, EU, EBIT, turnover, fashion, sustainability
false
Risk Assessment and Management
Retail & E-commerce
Mixed Chart
McKinsey
Add to my slides
Remove from favorites
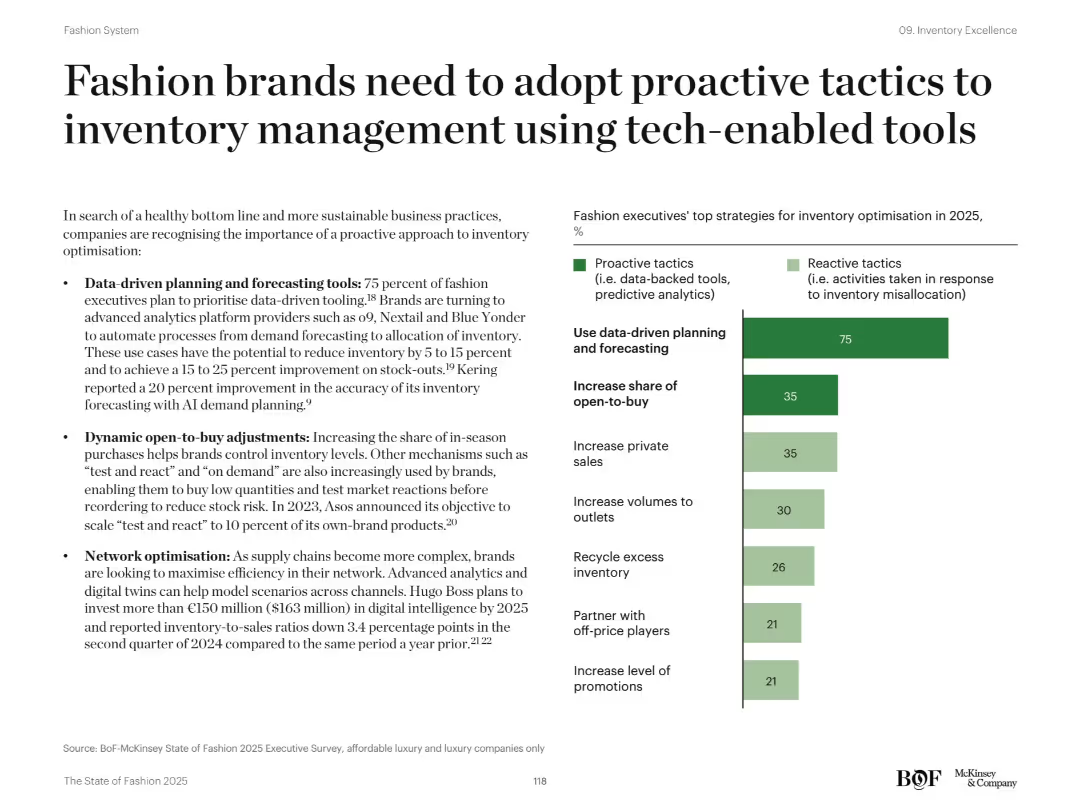
Split layout: left side contains bullet-point text with insights on data-driven forecasting, open-to-buy adjustments, and network optimization. Right side features a horizontal bar chart comparing proactive vs. reactive inventory tactics.
Operational Efficiency
Retail & E-commerce
This slide advocates for proactive, tech-enabled inventory management practices in the fashion industry. It highlights strategies such as AI-powered demand forecasting, dynamic inventory control, and supply chain optimization to reduce costs and improve stock accuracy. A chart shows 75% of executives favoring data-driven forecasting by 2025.
Inventory optimization, AI forecasting, open-to-buy, dynamic planning, retail strategy, network optimization, supply chain, fashion brands, analytics, inventory misallocation
false
Operational Efficiency
Retail & E-commerce
Mixed Chart
McKinsey
Add to my slides
Remove from favorites
Scatter plot graph correlating inventory turns with gross margin, accompanied by analyst commentary.
Investment Analysis
Financial Services
Illustrates the relationship between inventory management and profitability in distribution.
Inventory, Profitability, Distribution, Correlation, Gross Margin, Analysis
false
Investment Analysis
Financial Services
Single Chart
EY
Add to my slides
Remove from favorites
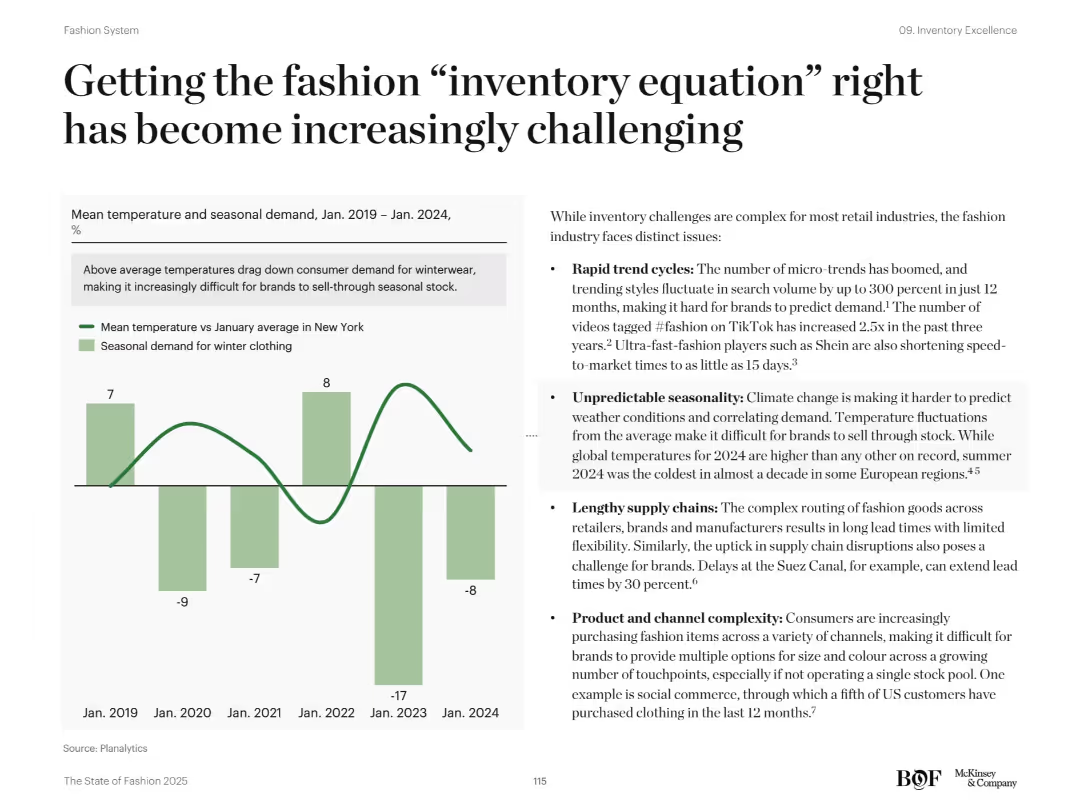
Split design with a line-bar combo chart (left) and bullet list (right); shows climate and demand correlation
Operational Efficiency
Retail & E-commerce
This slide outlines how unpredictable seasonality, rapid trend cycles, and complex supply chains are making inventory management difficult in fashion. The chart correlates winter clothing demand with temperature anomalies from 2019–2024. Additional points include fast-changing TikTok trends, lead times, and consumer expectations around choice and availability.
inventory, seasonality, trends, TikTok, fashion, demand, supply chain, winterwear
false
Operational Efficiency
Retail & E-commerce
Mixed Chart
McKinsey
Add to my slides
Remove from favorites
Bar charts showing the breakdown of invested assets by class and currency for Global Wealth Management and Asset Management.
Financial Performance
Financial Services
Analyzes the distribution of invested assets across different classes and currencies, comparing Global Wealth Management and Asset Management.
Invested assets, asset class, currency, UBS, Global Wealth Management, Asset Management, financial performance, 3Q22
false
Financial Performance
Financial Services
Multiple Chart
UBS
Add to my slides
Remove from favorites
The slide shows two bar charts comparing invested assets composition by type and by currency for 31.12.19 and 31.3.20.
Financial Performance
Financial Services
This slide details the composition of invested assets in terms of asset types and currencies, comparing end of 2019 and end of March 2020.
invested assets, asset types, currency composition, wealth management
false
Financial Performance
Financial Services
Multiple Chart
UBS
Add to my slides
Remove from favorites
The slide includes a column chart showing the progression of invested assets from 2.8 trillion in 2022 to over 5 trillion in 2028. Text on the right specifies ambitions for NNA per annum and cost/income ratio targets. The timeline highlights key phases from 2023 to 2028 for achieving growth.
Strategic Planning
Financial Services
The slide presents an ambitious goal to surpass 5 trillion in invested assets by 2028. It outlines key phases and targets for net new assets (NNA) and cost/income ratio improvements. This slide can be used to communicate long-term growth ambitions and strategic milestones to investors and stakeholders.
invested assets, growth, ambition, long-term, strategic planning
false
Strategic Planning
Financial Services
Mixed Chart
UBS
Add to my slides
Remove from favorites
A column chart showing invested assets from 2022 to 2028 with annotations on strategy and growth ambitions.
Strategic Planning
Financial Services
It details the goal to exceed 5 trillion in invested assets by 2028, highlighting strategic initiatives and expected growth.
invested assets, growth, strategic planning, GWM, ambitions
false
Strategic Planning
Financial Services
Mixed Chart
UBS
Add to my slides
Remove from favorites
Organized text sections with headers, describing phases of investigation.
Client Case Studies
Professional Services
Explains the comprehensive approach to investigations, detailing each phase from information gathering to reporting findings, emphasizing efficiency and targeted analysis to protect and enhance business operations.
investigations, efficiency, reporting, analysis, business protection
false
Client Case Studies
Professional Services
Table
Alvarez & Marsal
Add to my slides
Remove from favorites
Features a column chart and a breakdown of expenses, with a clean and professional design.
Operational Efficiency
Financial Services
Analyzes JPMorgan's adjusted expenses in various sectors, using bar graphs to indicate investment focuses and outlook for 2023, aiming to present a narrative of prudent and focused investment strategies.
investing, expenses, bar graphs, JPMorgan, operational efficiency
false
Operational Efficiency
Financial Services
Single Chart
JP Morgan
Add to my slides
Remove from favorites
The slide uses a combination of icons and bullet points to explore the personal motivations behind investing, categorized into heart, mind, and wallet sections.
Strategic Planning
Financial Services
It encourages viewers to consider their personal motivations for investing, categorizing questions into heart (goals), mind (financial importance), and wallet (financial planning).
Investing, motivations, UBS, personal goals, financial planning
false
Strategic Planning
Financial Services
Header Vertical
UBS
Add to my slides
Remove from favorites
A horizontal line chart illustrating shifts in investment practices among investors, focusing on factors like cost of capital and valuation approaches. Labeled with percentages for clarity.
Operational Efficiency
Financial Services
Explores changes in investor behavior in response to a recessionary environment, noting a more conservative approach in valuing investments and managing capital.
investing practices, recession, conservative strategies
false
Operational Efficiency
Financial Services
Single Chart
BCG
Add to my slides
Remove from favorites
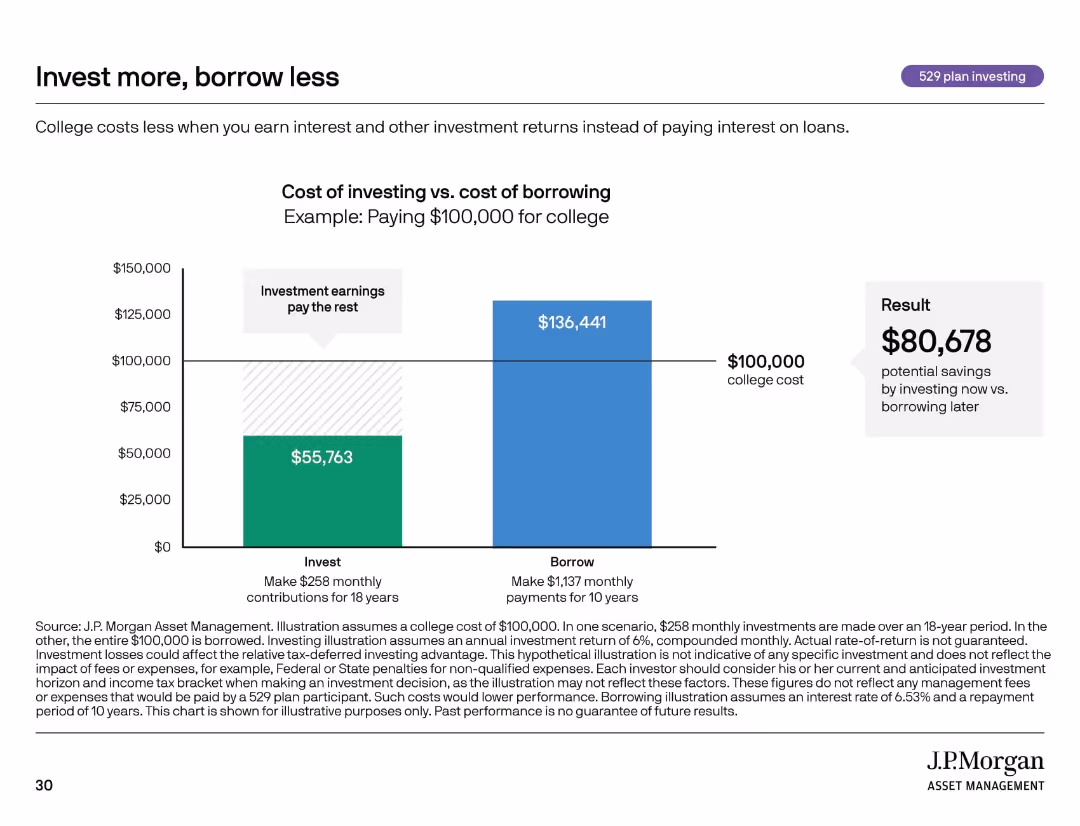
Side-by-side bar chart comparing cost of investing vs. cost of borrowing. Bold numbers and clean layout.
Strategic Planning
Financial Services
Illustrates how investing early for college can result in substantial savings compared to borrowing. Assumes different scenarios for a $100,000 college cost and highlights a potential $80,678 savings from investing instead of taking loans.
investing vs borrowing, savings, cost comparison, education planning
false
Strategic Planning
Financial Services
Mixed Chart
JP Morgan
Add to my slides
Remove from favorites
The slide features a bar chart showing percentages of respondents' management of their primary investment accounts. Each bar represents a different management method.
Investment Analysis
Financial Services
The slide presents survey data on how respondents manage their primary investment accounts, including using advisors, self-directed investment, and online advisors.
investment, advisor, portfolio, self-directed, online
false
Investment Analysis
Financial Services
Single Chart
IPSOS
Add to my slides
Remove from favorites
The slide contains a table with percentages of investment product ownership across different age groups and a bar chart showing ownership by gender and social class.
Customer and Market Segmentation
Financial Services
The slide compares investment product ownership by age, gender, and social class, highlighting demographic differences in investment behaviors.
investment, age, gender, social class, comparison
false
Customer and Market Segmentation
Financial Services
Mixed Chart
IPSOS
Add to my slides
Remove from favorites
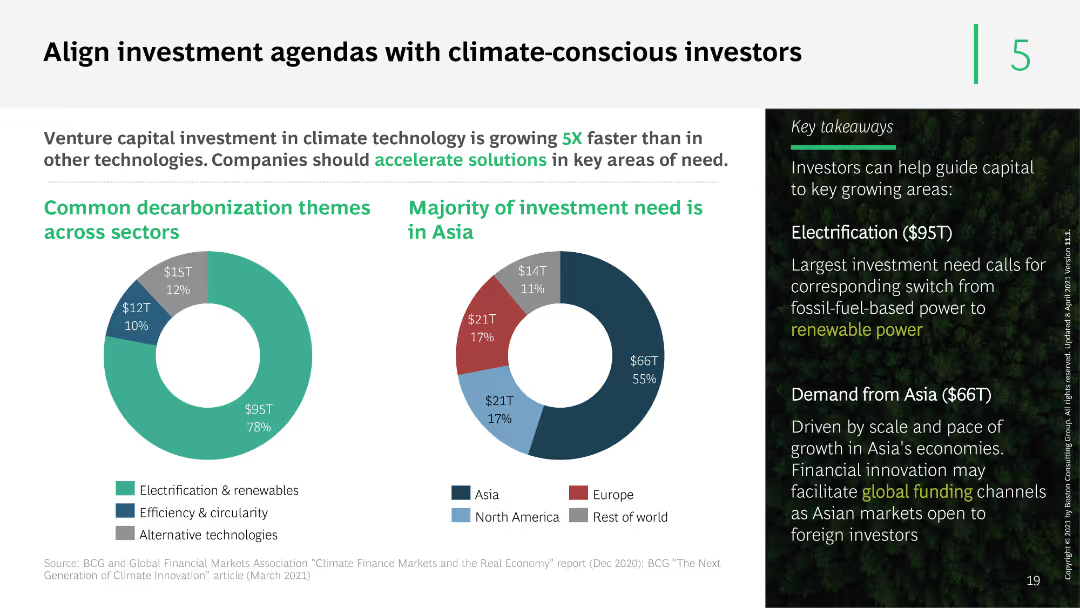
The slide includes two pie charts showing common decarbonization themes and the geographical distribution of investment needs. It uses distinct color segments and a side panel with key takeaways to enhance understanding.
Investment Analysis
Financial Services
The slide advises aligning investment agendas with climate-conscious investors, showing that a significant portion of investment needs is in Asia. It highlights common decarbonization themes and emphasizes the growth in venture capital for climate tech.
investment agendas, climate-conscious, decarbonization, venture capital, Asia
false
Investment Analysis
Financial Services
Multiple Chart
BCG
Add to my slides
Remove from favorites
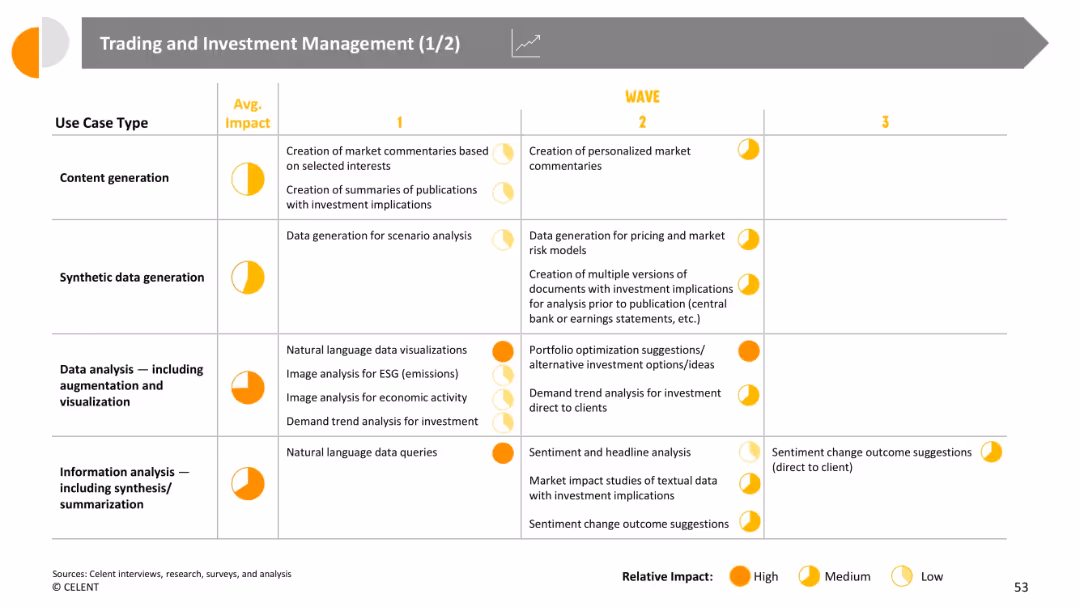
Tabular structure with use case types as rows and wave phases as columns; includes average impact icons
Technology and Digital Transformation
Financial Services
Lists use cases for GenAI in trading and investment across three waves. Covers data visualization, synthetic data, investment analysis, and summarization techniques with a focus on trend analysis and personalized content.
investment analysis, market trends, data generation, AI content, GenAI wave analysis
false
Technology and Digital Transformation
Financial Services
Single Chart
Oliver Wyman
Add to my slides
Remove from favorites
This slide features pie charts and bar graphs showcasing various investment assets within the firm. The color scheme differentiates between consumer & wealth management, with clear labeling for each section.
Financial Performance
Financial Services
The slide provides an overview of the firm's and clients' investment assets, detailing the division between institutional and wealth management, as well as the specific values in loans and deposits.
investment, assets, wealth management, loans, deposits
false
Financial Performance
Financial Services
Multiple Chart
Goldman Sachs
Add to my slides
Remove from favorites
A bar chart showing the distribution of self-assessed attitudes towards investment decisions among Canadians in 2023, compared with data from 2022.
Strategic Planning
Financial Services
This slide presents Canadian investors' attitudes towards risk in their investment decisions, comparing data between 2023 and 2022.
Investment, attitude, risk, decisions, Canadians, 2023, 2022
false
Strategic Planning
Financial Services
Mixed Chart
IPSOS
Add to my slides
Remove from favorites
The slide features a stacked column chart showing different attitudes towards investment decisions, ranging from very conservative to very aggressive. The layout is moderately complex.
Strategic Planning
Financial Services
This slide examines the self-assessed attitudes of Canadians towards investment decisions, revealing that most consider themselves conservative. It aims to understand risk tolerance in investment behavior.
investment, attitude, risk tolerance, decisions, Canadians
false
Strategic Planning
Financial Services
Single Chart
IPSOS
Add to my slides
Remove from favorites
The slide features a bar chart showing respondents' understanding of investment risks, fees, taxes, and performance monitoring, segmented by those who agree or disagree.
Customer and Market Segmentation
Financial Services
The slide presents data on respondents' attitudes towards investing, including understanding of risks and fees, and how closely they monitor their investment performance.
investment, attitudes, risks, fees, performance
false
Customer and Market Segmentation
Financial Services
Mixed Chart
IPSOS
Add to my slides
Remove from favorites
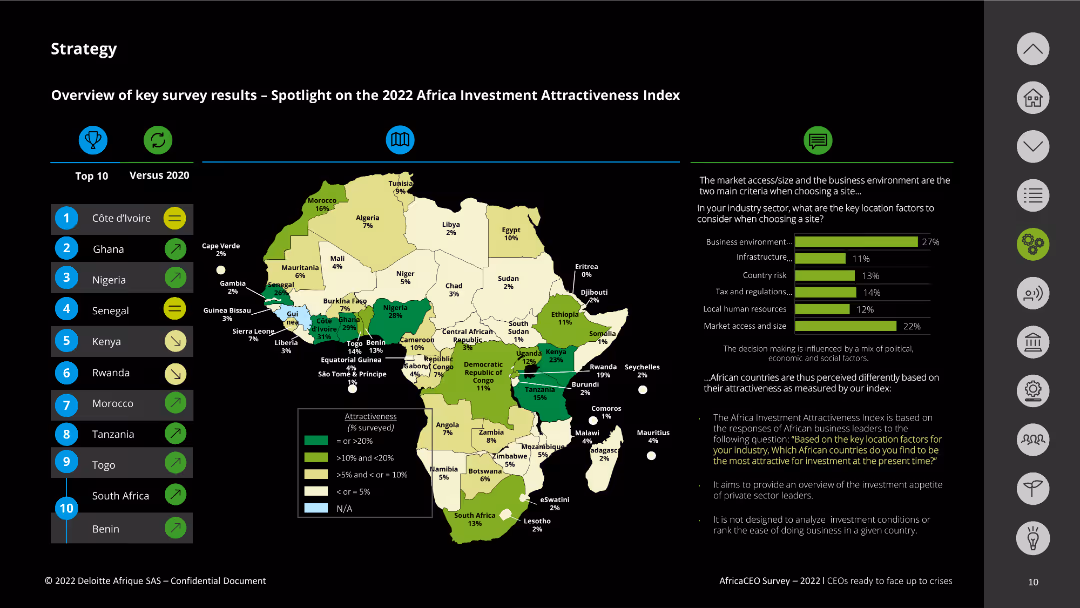
The slide displays a map of Africa with different countries highlighted based on their investment attractiveness. The slide also includes a bar chart showing key location factors for business decisions, with accompanying text explanations.
Market Analysis and Trends
Real Estate & Construction
This slide highlights the 2022 Africa Investment Attractiveness Index, showcasing countries with the most favorable business environments. It also details key location factors such as business environment, infrastructure, and market access/size.
investment, attractiveness, Africa, location factors, business environment
false
Market Analysis and Trends
Real Estate & Construction
Mixed Chart
Deloitte
Add to my slides
Remove from favorites
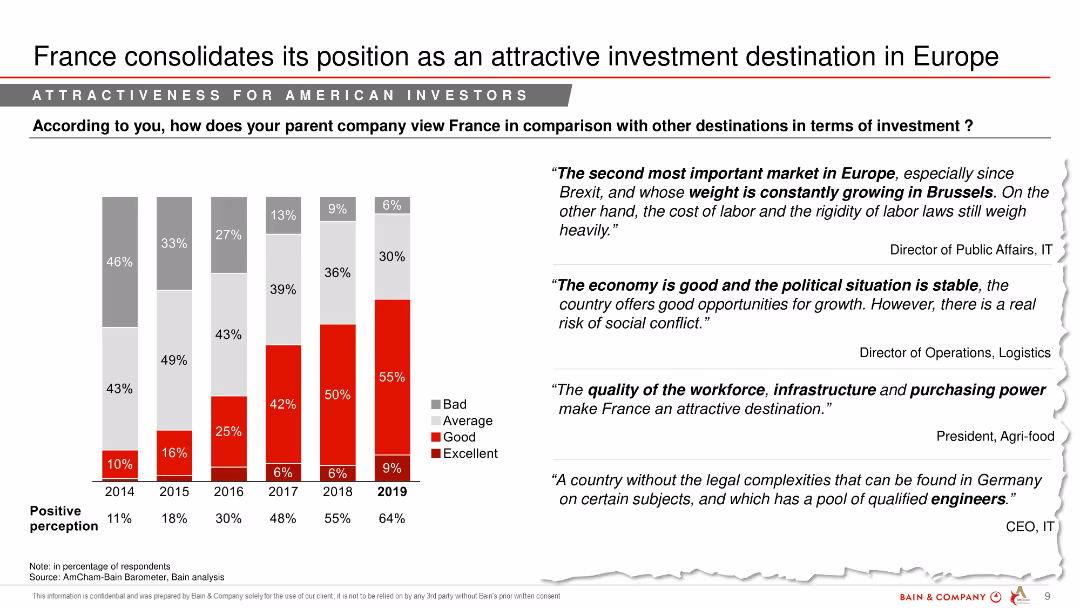
A column chart comparing perceptions of France's investment attractiveness over several years, with text quotes from industry leaders.
Market Analysis and Trends
Financial Services
The slide analyzes how France's attractiveness as an investment destination has evolved, particularly for American investors.
investment attractiveness, France, financial services, market analysis, yearly comparison, perceptions
false
Market Analysis and Trends
Financial Services
Mixed Chart
Bain
Add to my slides
Remove from favorites
The slide contains a sequence of circular graphs showing the percentage change of the investment bank's assets within the overall group from 2023 to 2026.
Investment Analysis
Financial Services
This slide presents the strategic scaling of the investment bank's assets as a percentage of total group assets, with projections leading up to 2026. It highlights the dynamic allocation strategies and scaling efforts within the financial group, crucial for investment stakeholders.
Investment Bank, Assets, Growth, Strategy
false
Investment Analysis
Financial Services
Multiple Chart
Barclays
Add to my slides
Remove from favorites
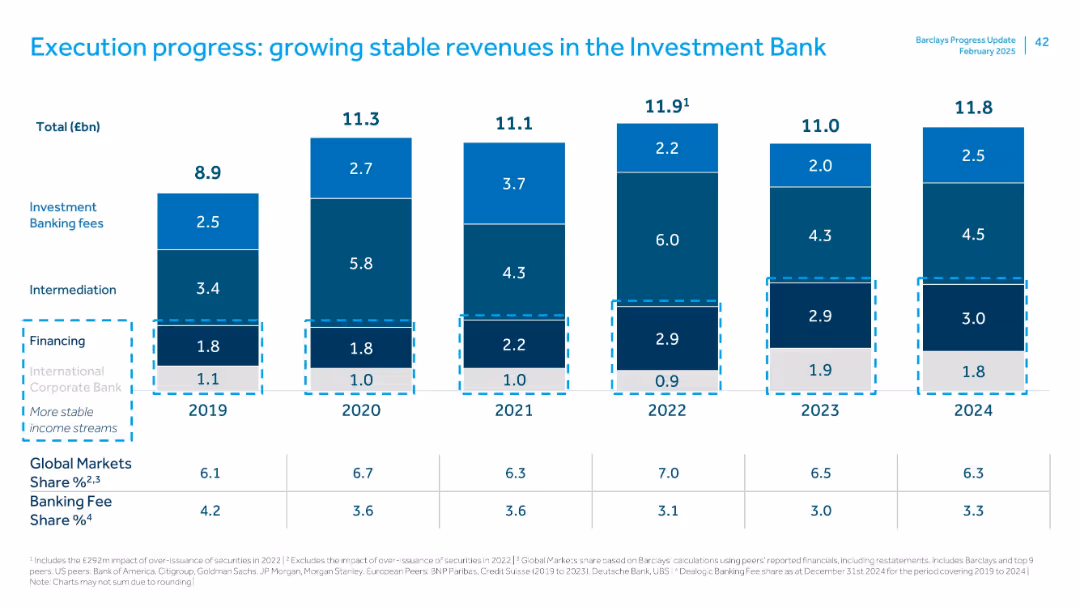
Stacked bar chart with segments labeled by revenue sources from 2019–2024. Color-coded by segment.
Financial Performance
Financial Services
Demonstrates stable investment bank revenue sources (fees, intermediation, financing) across 6 years. Shows relative share of Global Markets and Banking Fees across peer groups. Highlights consistent revenue contributions and peer comparisons.
investment bank, fees, financing, intermediation, peer comparison, revenue stability
false
Financial Performance
Financial Services
Single Chart
Barclays
Add to my slides
Remove from favorites
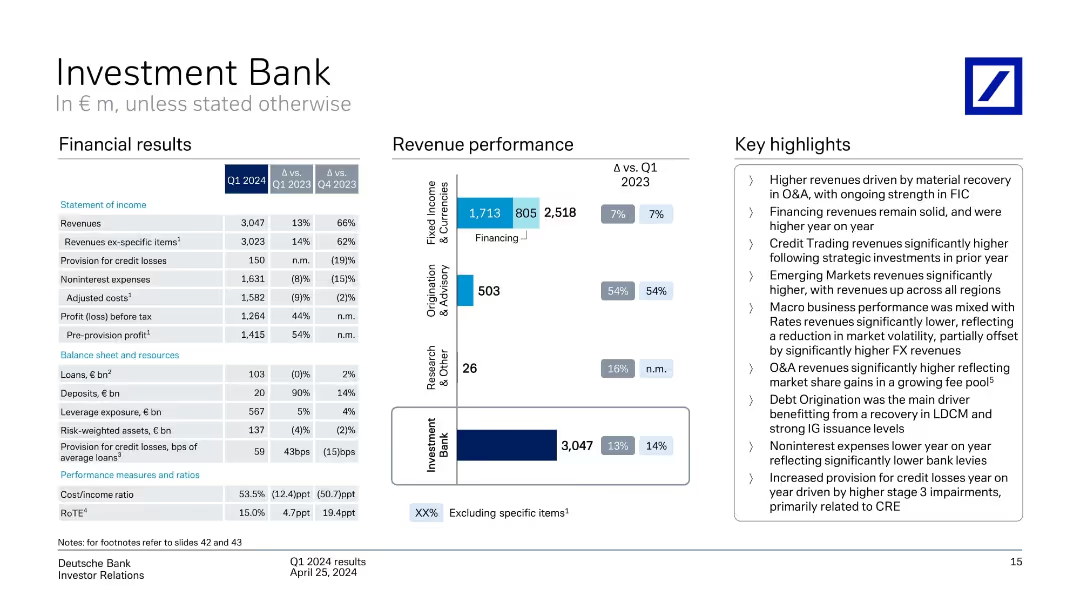
Income table on left, revenue bar chart in middle, highlights on right
Financial Performance
Financial Services
Financial breakdown of the Investment Bank for Q1 2024, with notable YoY growth in Origination & Advisory. Revenues increased due to strong FX and Credit Trading, despite macro volatility. Stage 3 impairments impacted credit losses.
investment bank, FIC, O&A, FX trading, credit losses, revenue
false
Financial Performance
Financial Services
Mixed Chart
Deutsche Bank
Add to my slides
Remove from favorites
Similar layout as 18398; includes financials, segment revenue bars, and highlight bullet points.
Financial Performance
Financial Services
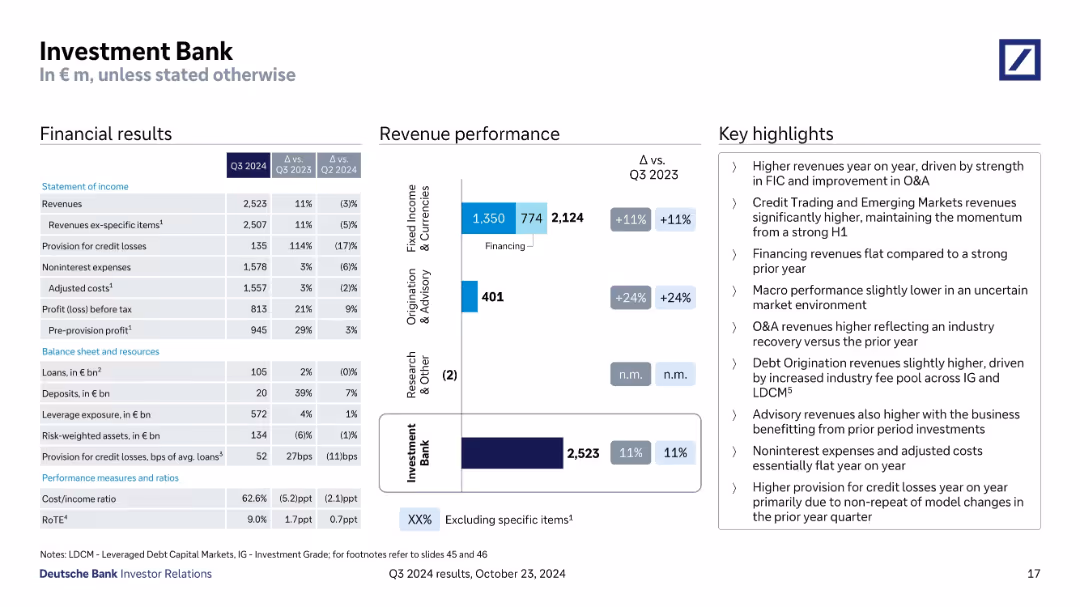
Highlights strong revenue growth in Investment Bank, driven by Fixed Income and Origination & Advisory. Costs remained flat. Increased provisions due to model effects from prior year. Reflects a strong YoY rebound and stable financing performance.
Investment Bank, FIC, O&A, revenue growth, credit losses, RoTE
false
Financial Performance
Financial Services
Mixed Chart
Deutsche Bank
Add to my slides
Remove from favorites
Contains a series of tables and bar graphs comparing quarterly financial data and sector performance.
Financial Performance
Financial Services
Reviews financial metrics and sector-specific performance of an investment bank in Q4 2023, key for financial analysts and stakeholders.
investment bank, financial analysis, Q4, sector performance, metrics
false
Financial Performance
Financial Services
Mixed Chart
Deutsche Bank
Add to my slides
Remove from favorites
Similar layout as 18341: financials, revenue bar charts by segments, and key highlights.
Financial Performance
Financial Services
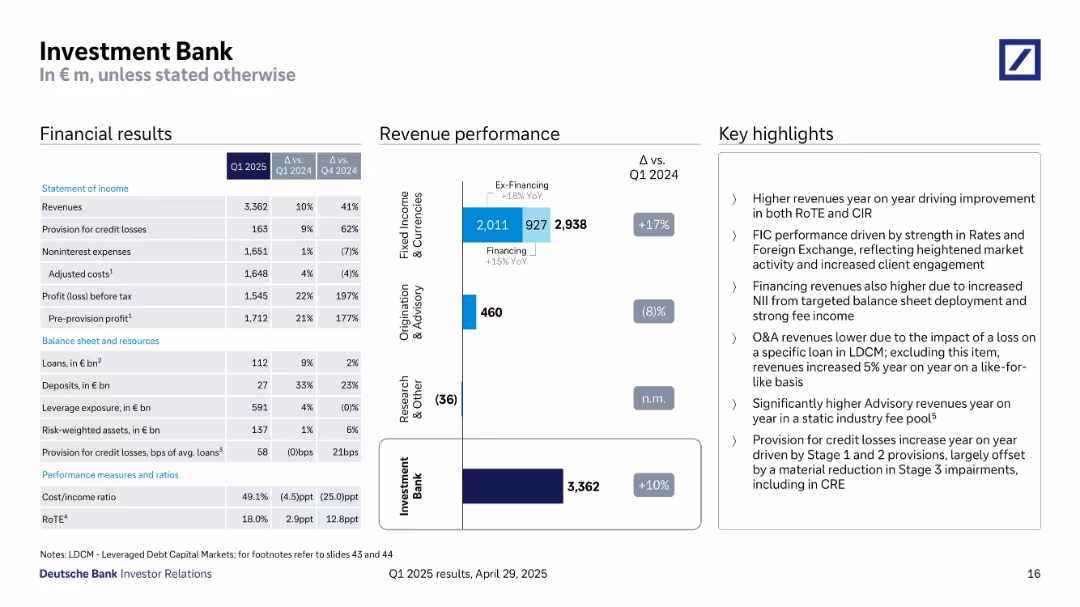
Q1 2025 financials for the Investment Bank show strong year-on-year revenue growth (+10%), improved RoTE (18%), and higher profit before tax (€1.55B). Key growth in Fixed Income & Currencies segment, while Origination & Advisory declined.
investment bank, fixed income, advisory, revenue growth, RoTE, credit loss, Q1 2025, client engagement
false
Financial Performance
Financial Services
Mixed Chart
Deutsche Bank
Add to my slides
Remove from favorites
Includes multiple column charts displaying net revenues for Fixed Income & Currencies: Financing and Ex-Financing, along with detailed business highlights and trends.
Market Analysis and Trends
Financial Services
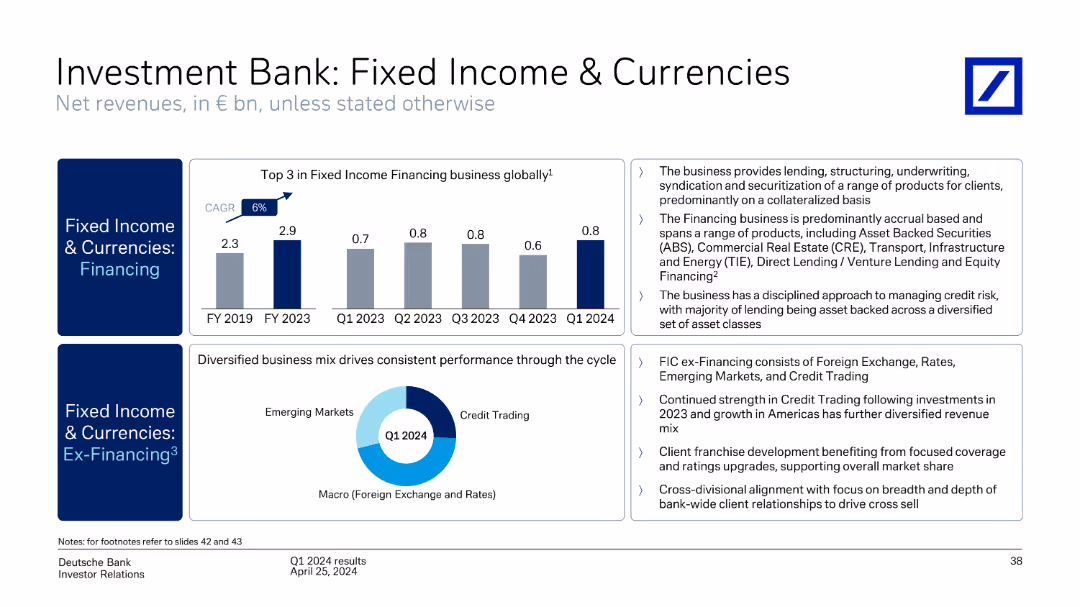
Reviews the fixed income and currencies net revenues, highlighting growth in financing business, market performance, and emerging market trends.
investment bank, fixed income, currencies, net revenues, market trends, financing, emerging markets
false
Market Analysis and Trends
Financial Services
Multiple Chart
Deutsche Bank
Add to my slides
Remove from favorites
Slide includes table, a column chart, and textual analysis for financial results.
Investment Analysis
Financial Services
Covers financial advisory, equity and debt underwriting, and corporate lending with a net revenue breakdown.
Investment, Banking, Advisory, Equity, Debt, Underwriting, Corporate, Lending, Bar Chart, Revenue, Analysis
false
Investment Analysis
Financial Services
Mixed Chart
Goldman Sachs
Add to my slides
Remove from favorites
The slide displays column charts representing debt underwriting league table rankings and net revenues, accompanied by textual analysis and bullet points. The layout is structured and information-dense.
Strategic Planning
Financial Services
Outlines the advancement in client coverage in investment banking, highlighting league table rankings, net revenue, and client engagement strategies.
Investment Banking, Client Coverage, League Table, Net Revenue, Engineering, Client Engagement, Debt Underwriting, Strategy
false
Strategic Planning
Financial Services
Multiple Chart
Goldman Sachs
Add to my slides
Remove from favorites
Presents a column chart showing the growth in commercial banking gross investment banking revenue over five years, with annotations and icons indicating key growth areas.
Financial Performance
Financial Services
Explains JPMC's success in delivering top-tier investment banking services to commercial banking clients, highlighting consistent revenue growth and strategic expansion in targeted sectors.
investment banking, commercial banking, revenue growth, JPMC, strategic expansion, middle market, private capital
false
Financial Performance
Financial Services
Mixed Chart
JP Morgan
Add to my slides
Remove from favorites
The slide includes a title, a column chart with net revenues, a table detailing financial results, and bullet points summarizing the highlights. The slide is well-organized with moderate visual complexity.
Financial Performance
Financial Services
Aimed at displaying detailed financial results for the global banking and markets sector of a company. It includes revenue from various services like investment banking and equities. The data is probably used to analyze market positions and inform strategy meetings or investor updates.
Investment Banking, Equities, Net Revenues, Financial Results
false
Financial Performance
Financial Services
Mixed Chart
Goldman Sachs
Add to my slides
Remove from favorites
Features line charts and column charts detailing investment banking fees and market share from 2017 to 2021, including global and regional data.
Market Analysis and Trends
Financial Services
This slide reviews JP Morgan's investment banking division's performance, showing record fee collection and consistent market share leadership globally and in specific regions over five years. It highlights their dominance in the Americas and strong positions in EMEA and APAC, reflecting effective market penetration and financial strategies.
investment banking, fees, market share
false
Market Analysis and Trends
Financial Services
Multiple Chart
JP Morgan
Add to my slides
Remove from favorites
Features detailed tables and column charts comparing financial advisory, underwriting, and lending data. Layout is dense, utilizing a blue, gray, and white color palette.
Market Analysis and Trends
Financial Services
The slide details investment banking financial results with YoY comparisons and highlights, used for analyzing market trends and banking performance.
Investment, Banking, Financial, Results, Analysis, Market, Trends, Performance, Comparison, Advisory
false
Market Analysis and Trends
Financial Services
Mixed Chart
Goldman Sachs
Add to my slides
Remove from favorites
This slide presents various financial metrics through horizontal column chart and tables, with a color scheme of blues, whites, and grays, detailing the bank's investment banking performance, including M&A and equity rankings.
Financial Performance
Financial Services
Covers the financial results of investment banking, detailing net revenues, underwriting, lending, and league table rankings, with a comparison of quarterly and annual data.
investment banking, financial results, M&A, underwriting, lending, league rankings
false
Financial Performance
Financial Services
Mixed Chart
Goldman Sachs
Add to my slides
Remove from favorites
Features a collection of bar and tables that display financial results and revenue streams, accompanied by dense numerical data and textual summaries of key fiscal details for Deutsche Bank's Investment Bank.
Financial Performance
Financial Services
This slide reviews the Q2 2023 financial outcomes for Deutsche Bank's Investment Bank, focusing on revenue streams and major fiscal indicators like adjusted costs and profit before tax.
Investment banking, financial results, revenue analysis, fiscal indicators, Deutsche Bank, Q2 2023
false
Financial Performance
Financial Services
Mixed Chart
Deutsche Bank
Add to my slides
Remove from favorites
Includes a mix of tables and bar charts comparing financial performance metrics across divisions, focusing on revenues and costs.
Financial Performance
Financial Services
Analyzes the financial outcomes for Deutsche Bank's Investment Banking division, highlighting key changes in revenue streams and cost management strategies.
investment banking, financial results, revenue, costs, performance analysis
false
Financial Performance
Financial Services
Mixed Chart
Deutsche Bank
Add to my slides
Remove from favorites
This slide has two main sections, with column and line charts showing Global Investment Banking wallet and market share, as well as a global map indicating growth across regions. Additional charts show M&A, DCM, and ECM market share trends.
Financial Performance
Financial Services
Aimed at investors or corporate executives, it examines the growth in Global Investment Banking, highlighting regional performance and the company's market share within key financial sectors like M&A and ECM, emphasizing financial strength and market dominance.
investment banking, global growth, market share, regional performance, M&A, ECM, DCM
false
Financial Performance
Financial Services
Multiple Chart
JP Morgan
Add to my slides
Remove from favorites
Displays a central circular graphic, a dotted outline around certain segments, and a textbox with highlighted key figures. The slide's design is simple with a clear focus on the synergistic elements.
Strategic Planning
Financial Services
This slide outlines how the integration of investment banking and global markets contributes to Goldman Sachs’ ROE improvement. It is tailored for discussions on strategy and synergy in business services.
investment banking, global markets, ROE, synergy, Goldman Sachs
false
Strategic Planning
Financial Services
Diagram
Goldman Sachs
Add to my slides
Remove from favorites
This slide features a column chart and a table that depicts the global wallet evolution by product, the other by region, accompanied by a sidebar listing key market drivers with directional arrows.
Market Analysis and Trends
Financial Services
Reflecting on the investment banking industry's financial metrics, it shows the distribution of wallet size by product and region, with attention to various economic and geopolitical drivers influencing the industry.
Investment Banking, Global Wallet, Drivers
false
Market Analysis and Trends
Financial Services
Mixed Chart
JP Morgan
Add to my slides
Remove from favorites
It has a column chart demonstrating growth over years and a text box detailing forward catalysts. The color palette is limited, enhancing readability.
Market Analysis and Trends
Financial Services
This slide demonstrates the growth of Goldman Sachs' investment banking division, detailing the increase in client coverage and wallet share gains. It is designed for presentations on market expansion and strategic growth opportunities.
investment banking, growth, market size, Goldman Sachs, strategy, wallet share, technology, healthcare
false
Market Analysis and Trends
Financial Services
Mixed Chart
Goldman Sachs
Add to my slides
Remove from favorites
Table ranking banks by revenue and market share, column charts showing wallet share, and notable transactions.
Competitive Landscape
Financial Services
Showcases Credit Suisse’s leading position in investment banking, detailing market share, revenue, and notable transactions in 2019.
Investment banking, market-leading, Credit Suisse, revenue, transactions
false
Competitive Landscape
Financial Services
Mixed Chart
Credit Suisse
Add to my slides
Remove from favorites
Features a combination of column and line charts for GIB, M&A, DCM, and ECM. The slide includes a legend, market share trend lines, and key takeaways at the bottom.
Financial Performance
Financial Services
Displays market share growth in global investment banking sectors, emphasizing leadership and deal participation over five years.
Investment Banking, Market Share, M&A, DCM, ECM
false
Financial Performance
Financial Services
Multiple Chart
JP Morgan
Add to my slides
Remove from favorites
This slide features a column chart with a timeline from 2010 to 2019, depicting market share and investment banking rank. The chart is annotated with percentage figures and gaps between the ranks.
Market Analysis and Trends
Financial Services
The slide illustrates the #1 rank in Global Investment Banking fees and a 9.0% market share in 2019, highlighting the company's leadership over the decade.
Investment Banking, Market Share, Rank, Column Chart, Decade, Leadership, Percentage, Global, Finance
false
Market Analysis and Trends
Financial Services
Single Chart
JP Morgan
Add to my slides
Remove from favorites
Features a structured overview with financial figures and strategic pillars, supplemented by infographics for visual emphasis.
Market Analysis and Trends
Financial Services
Outlines the performance and strategy of the Corporate & Investment Bank, detailing market share, revenue, and key strategic pillars.
investment banking, market share, revenue, strategic pillars, corporate bank, diversification
false
Market Analysis and Trends
Financial Services
Pillar
JP Morgan
Add to my slides
Remove from favorites
This slide is divided into two parts: on the left, a blue box lists strategic priorities, and on the right, a green checkmark list presents market dynamics. The slide has a blue header and footer with the page number at the bottom right.
Strategic Planning
Financial Services
Aimed at the financial sector, this slide details the strategic priorities and market dynamics that drive share gains and client footprint expansion for the presenter's investment banking division. Useful for strategic planning meetings or financial sector analyses, it communicates the company's market share growth and strategic business expansion, making it relevant for internal strategy discussions and investment banking market analysis.
Investment Banking, Market Share, Strategy, Growth, Client Base, Financing, Market Dynamics
false
Strategic Planning
Financial Services
Header Horizontal
Goldman Sachs
Add to my slides
Remove from favorites
Displays a line chart of the combined wallet size from 2019 to 2026 alongside column charts of investment banking fees and market income, indicating trends and recovery.
Investment Analysis
Financial Services
This slide offers a detailed review of investment banking growth based on realistic market assumptions, showing past income trends and future projections. It is crucial for understanding the financial landscape and planning investment strategies, providing insights into market recovery and stability expectations.
Investment Banking, Market Trends, Growth
false
Investment Analysis
Financial Services
Multiple Chart
Barclays
Add to my slides
Remove from favorites
Slide with column chart comparing investment banking net revenues, alongside a table detailing financial metrics such as net revenues, earnings, and equity. The graphs use blue and white bars, and the layout is clean and data-focused.
Investment Analysis
Financial Services
Summarizes the financial results and highlights of investment banking activities, suitable for investor briefings or financial strategy meetings. It provides insights into areas like equity, debt underwriting, and financial advisory services.
Investment Banking, Net Revenue, Financial Advisory
false
Investment Analysis
Financial Services
Mixed Chart
Goldman Sachs
Add to my slides
Remove from favorites
Blue-themed slide with a column chart displaying the growth of investment banking revenue over time, with a line marking the compound annual growth rate (CAGR).
Financial Performance
Financial Services
Presents JPMorgan Chase & Co.'s commercial banking investment banking revenue growth, emphasizing their market share and targets.
Investment banking, revenue growth, CAGR, JPMorgan Chase, commercial banking, market share, financial services, long-term target, performance
false
Financial Performance
Financial Services
Single Chart
JP Morgan
Add to my slides
Remove from favorites
Bar and line charts with annotations showing revenue, cost, and efficiency metrics (CIR). Balanced white space and grid layout.
Performance Metrics and KPIs
Financial Services
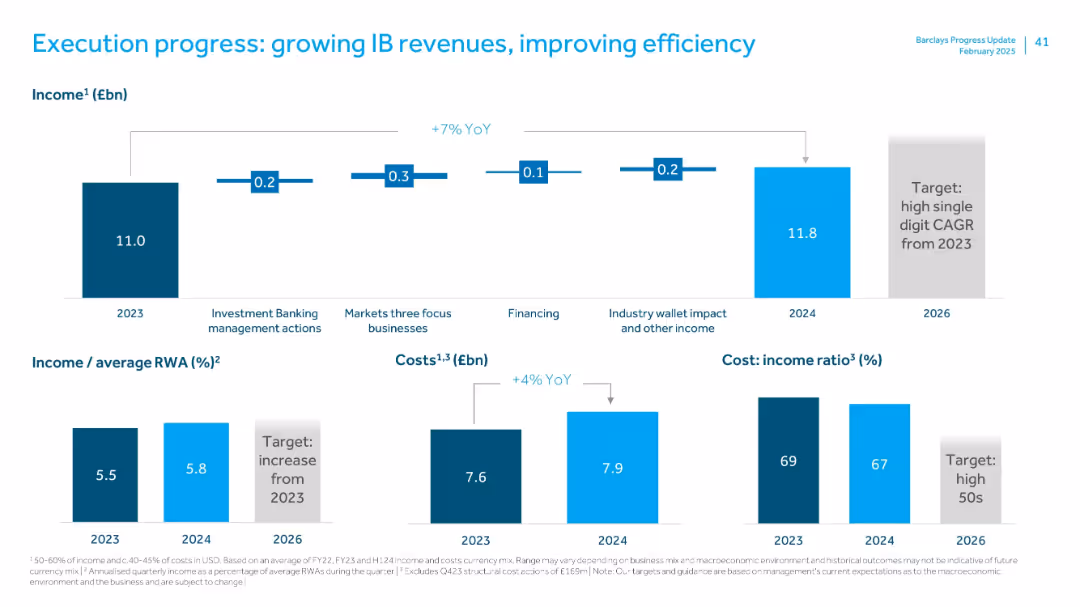
Summarizes year-on-year improvements in Investment Bank income (+7%), cost increases (+4%), and cost:income ratio decrease from 69% to 67%. Highlights 2024 performance (£11.8bn income) and targets for 2026.
investment banking, revenue growth, CIR, cost efficiency, CAGR, YoY, income
false
Performance Metrics and KPIs
Financial Services
Multiple Chart
Barclays
Add to my slides
Remove from favorites
The slide shows a progressive blue column chart indicating growth in investment banking revenue over years, accompanied by a small pie chart and annotations. It's well-organized and visually straightforward.
Financial Performance
Financial Services
Details the growth in commercial banking investment banking revenue, emphasizing the bank's commitment to delivering quality services. Useful in financial reviews and investor presentations, highlighting performance and goals.
investment banking, revenue growth, commercial banking, financial review, performance
false
Financial Performance
Financial Services
Single Chart
JP Morgan
Add to my slides
Remove from favorites
A prominent column chart displays a rising trend in investment banking revenue, complemented by bullet points on the right. There's a good balance between graphical data and text information.
Financial Performance
Financial Services
This slide provides information on investment banking revenue growth, with strategic goals for expanding market share and targeting specific growth areas. It illustrates a compound annual growth rate and future targets, highlighting areas of strategic growth such as the Middle Market and Green Economy.
Investment banking, revenue growth, strategic growth, market share
false
Financial Performance
Financial Services
Mixed Chart
JP Morgan
Add to my slides
Remove from favorites
The slide contains a bubble chart and various company logos with financial data. It is divided into two main sections, showing local execution platform and cooperation details.
Market Analysis and Trends
Financial Services
The slide highlights Credit Suisse's position in Investment Banking in Switzerland, showing execution platform details and cooperation with other divisions.
Investment Banking, Switzerland, market analysis, execution platform, cooperation
false
Market Analysis and Trends
Financial Services
Mixed Chart
Credit Suisse
Add to my slides
Remove from favorites
The slide is divided into two sections: one with text bullet points and the other with a graphical representation of metrics, using a cohesive blue and white theme.
Financial Performance
Financial Services
Provides an analysis of the investment banking sector, with metrics such as wallet share, client footprint, and market rankings. It measures the company's progress and success in investment banking.
investment banking, wallet share, client footprint, market ranking, metrics
false
Financial Performance
Financial Services
Text Only
Goldman Sachs
Add to my slides
Remove from favorites
Contains bar and tables comparing revenue streams and financial metrics across quarters, with emphasis on different banking activities.
Financial Performance
Financial Services
Analyzes the Investment Bank's financial results, focusing on revenue variations and strategic adjustments in response to market dynamics.
Investment Bank, revenue, market dynamics
false
Financial Performance
Financial Services
Mixed Chart
Deutsche Bank
Add to my slides
Remove from favorites
A column chart showing revenue performance across different segments, a table of financial results, and key highlights. The slide is moderately dense with a mix of text and visual elements.
Financial Performance
Financial Services
The slide highlights the Investment Bank's Q1 2024 financial performance, detailing revenue, profit, and other key metrics, and comparing performance across various business segments.
Investment Bank, revenue performance, financial results, Q1 2024, business segments
false
Financial Performance
Financial Services
Mixed Chart
Deutsche Bank
Add to my slides
Remove from favorites
Column charts showing revenues, profit before tax, and various financial metrics for the investment bank segment.
Financial Performance
Financial Services
Illustrates the performance of the investment bank division, covering revenues, profit, and cost/income ratios.
Investment bank, revenues, profit, financial performance, UBS, 3Q22, cost/income ratio, derivatives and solutions
false
Financial Performance
Financial Services
Multiple Chart
UBS
Add to my slides
Remove from favorites
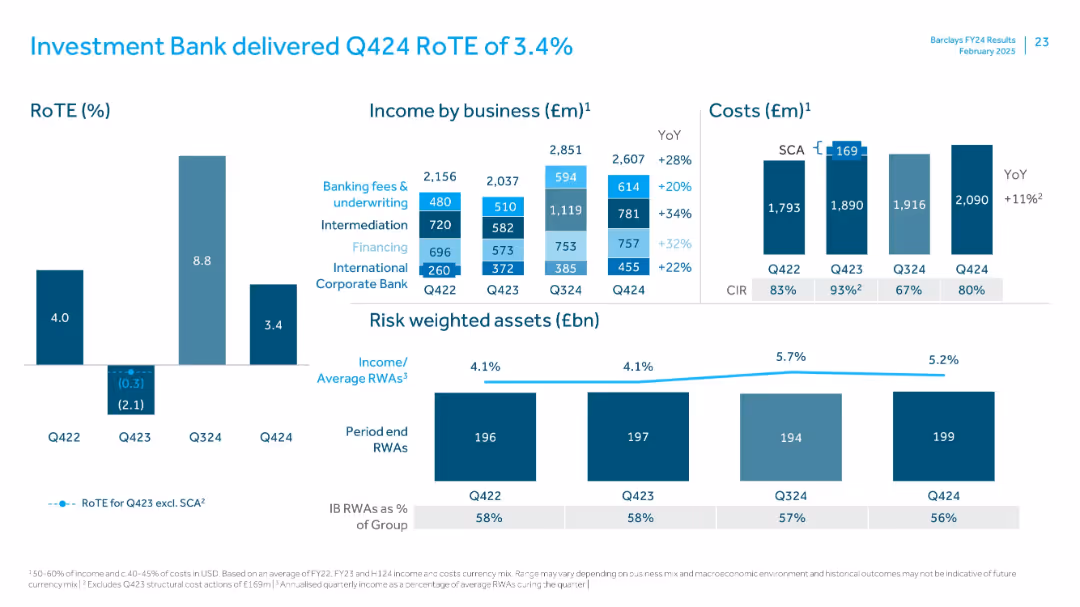
Panel layout with income by business and type; cost bar charts and risk-weighted assets at bottom
Financial Performance
Financial Services
Breaks down Investment Bank’s income across key services—fees, intermediation, financing. RoTE is relatively low. Expenses and risk-weighted assets are charted, with commentary on CIR improvement and business mix effects.
Investment Bank, RoTE, income breakdown, risk-weighted assets, CIR, financing, underwriting
false
Financial Performance
Financial Services
Multiple Chart
Barclays
Add to my slides
Remove from favorites
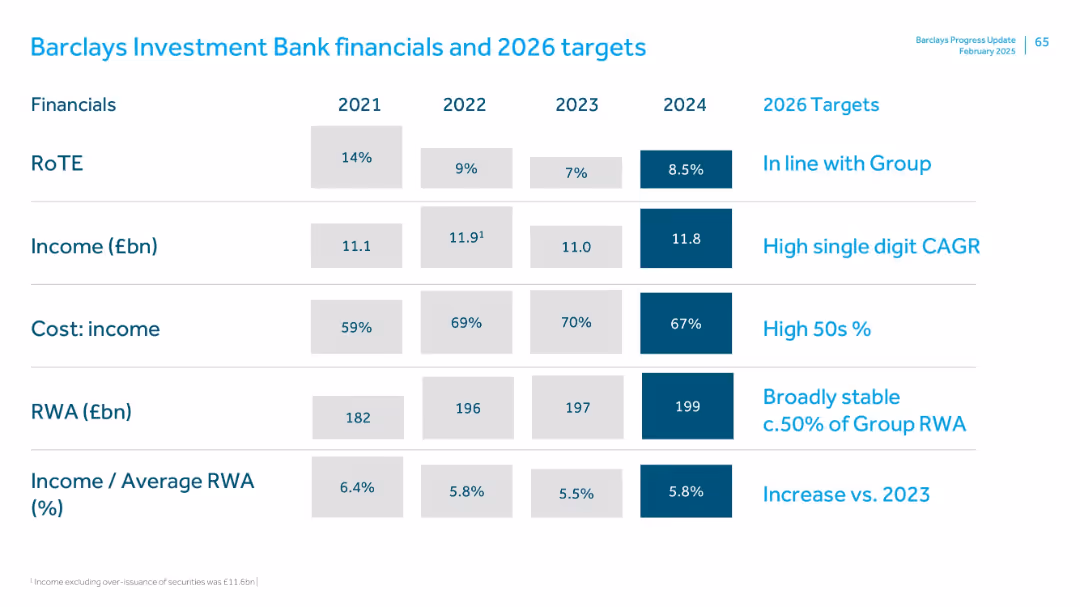
Table with 2021–2024 values and 2026 goals; clearly segmented rows with dark blue for latest values and target goals
Financial Performance
Financial Services
The Investment Bank’s financial overview includes RoTE, income, cost-income ratio, RWA, and income/RWA ratio. Targets for 2026 align with group averages and aim for stable risk-weighted assets and income growth. High 50s cost-income ratio and increased income efficiency are key goals.
Investment bank, RoTE, income, RWA, cost-income ratio, financial goals
false
Financial Performance
Financial Services
Single Chart
Barclays
Add to my slides
Remove from favorites
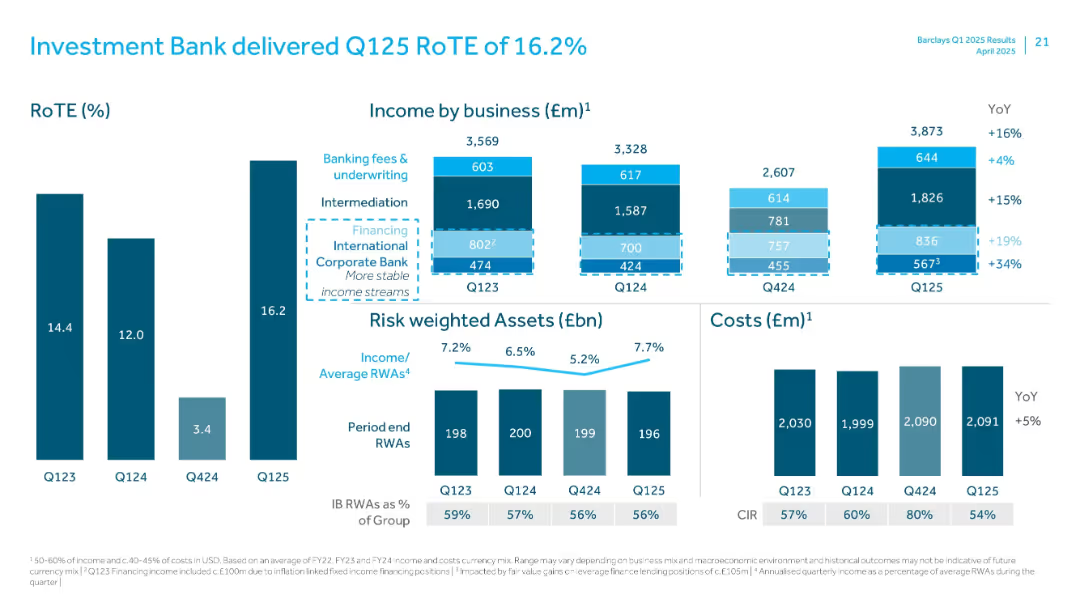
Clustered vertical bar charts for RoTE, income by business, risk weighted assets, and cost overview.
Financial Performance
Financial Services
Summarizes Investment Bank’s Q125 performance. RoTE reached 16.2%, with 16% YoY income growth. Shows income split across various business lines and notes RWA and cost trends. Highlights stable financing income and improved CIR.
Investment Bank, RoTE, Income, RWA, Financing, CIR, Q125, Intermediation, Fees
false
Financial Performance
Financial Services
Multiple Chart
Barclays
Add to my slides
Remove from favorites
Diagrams and flowcharts display the structure and financial divisions within Barclays Investment Bank.
Organizational Structure and Change
Financial Services
Provides an overview of the financial performance and structural organization of Barclays Investment Bank in 2023.
investment bank, structure, 2023, financial, Barclays
false
Organizational Structure and Change
Financial Services
Diagram
Barclays
Add to my slides
Remove from favorites
Contains three separate sections each with a header and associated text blocks, describing different types of disconnects in the investment process. Visual elements include icons and muted background images of forests.
Market Analysis and Trends
Environmental Services & Sustainability
Describes three major barriers to green investment in Southeast Asia: insufficient incentives for rapid decarbonization, bias towards new rather than proven low-risk solutions, and a lack of clarity on system costs for energy transitions.
investment barriers, decarbonization, SEA, energy transition
false
Market Analysis and Trends
Environmental Services & Sustainability
Header Horizontal
Bain
Add to my slides
Remove from favorites
Previous
Next
You don't have any favorites yet.
Please wait loading your favorites slides...
Create a FREE account to continue browsing
Receive Instant Access to 1,000+ slides from companies like McKinsey, Google, and Goldman Sachs
First Name
Last Name
Email
Password
I agree to all
Terms & Privacy Policy
Thank you! Your submission has been received!
Oops! Something went wrong while submitting the form.
Have an account?
Sign in
Upgrade to PRO to Save slides
Advanced Search and Filters
Access to 15,000+ slides
Access to Category Pages
Save/Bookmark Slides
PowerPoint Template Library
Pick a Plan
MONTHLY
$12/month
Billed every month, Cancel anytime.
YEARLY
$9/year
Billed $108 annually, Cancel anytime.
Checkout for $12/month
Checkout for $108/yr
Secured by Stripe | AES-256 bit encryption