My Account
My Slides
Search by Category
Pricing
Templates
View All Templates
Download Template Slides
✦ AI Search
Feedback
Login
Logout
Get Started
Browse all Slides
Browse all Slides
Create a FREE Account
Instant access to 1,000+ real slides from top companies like McKinsey, BCG, Goldman Sachs, Google and many more!
First Name
Last Name
Email
Password
I agree to all
Terms & Privacy Policy
Thank you! Your submission has been received!
Oops! Something went wrong while submitting the form.
Have an account?
Sign in
Saved Slides
Total No. of slides saved
0
↻ Refresh
✖ Clear all
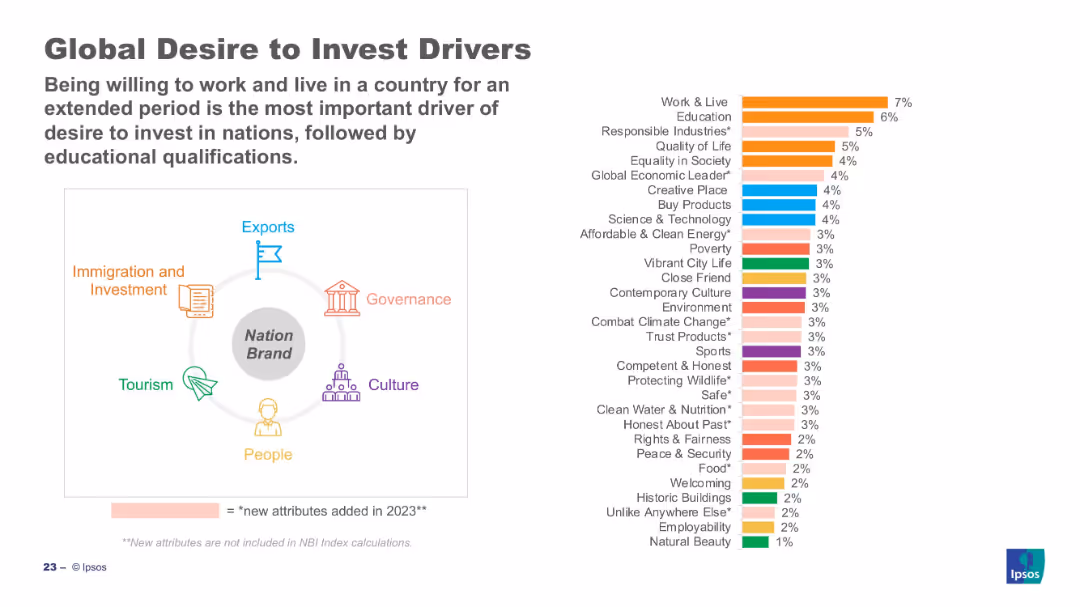
Bar chart (right) ranks top investment drivers; left visual maps drivers to nation brand sectors.
Customer and Market Segmentation
Professional Services
Work & live, education, and responsible industries are top investment drivers globally. The visual shows these drivers categorized under broader nation brand domains such as governance and economy. Many of the attributes were newly added in 2023.
investment, business drivers, Ipsos, perception, work, education, 2023, attributes, sustainability
false
Customer and Market Segmentation
Professional Services
Mixed Chart
IPSOS
Add to my slides
Remove from favorites
Contains a column chart comparing the corporate perception of France over the years with key quotes from executives.
Investment Analysis
Professional Services
Evaluates the perception of France as an investment destination among top business executives, reflecting on its strengths and weaknesses.
Investment, Business Environment, Executive Opinions, Corporate Headquarters
false
Investment Analysis
Professional Services
Mixed Chart
Bain
Add to my slides
Remove from favorites
The slide features four column charts with future projections, icons for ESG and China market focus, using a professional color scheme of blue and gray tones.
Strategic Planning
Financial Services
This slide discusses investments in front office, technology, and ESG, as well as the strategic move to engage in the Chinese market, outlining future investment areas.
Investment, Business, Front Office, Technology, ESG, China, Market Engagement, Financial Services, Strategy
false
Strategic Planning
Financial Services
Multiple Chart
JP Morgan
Add to my slides
Remove from favorites
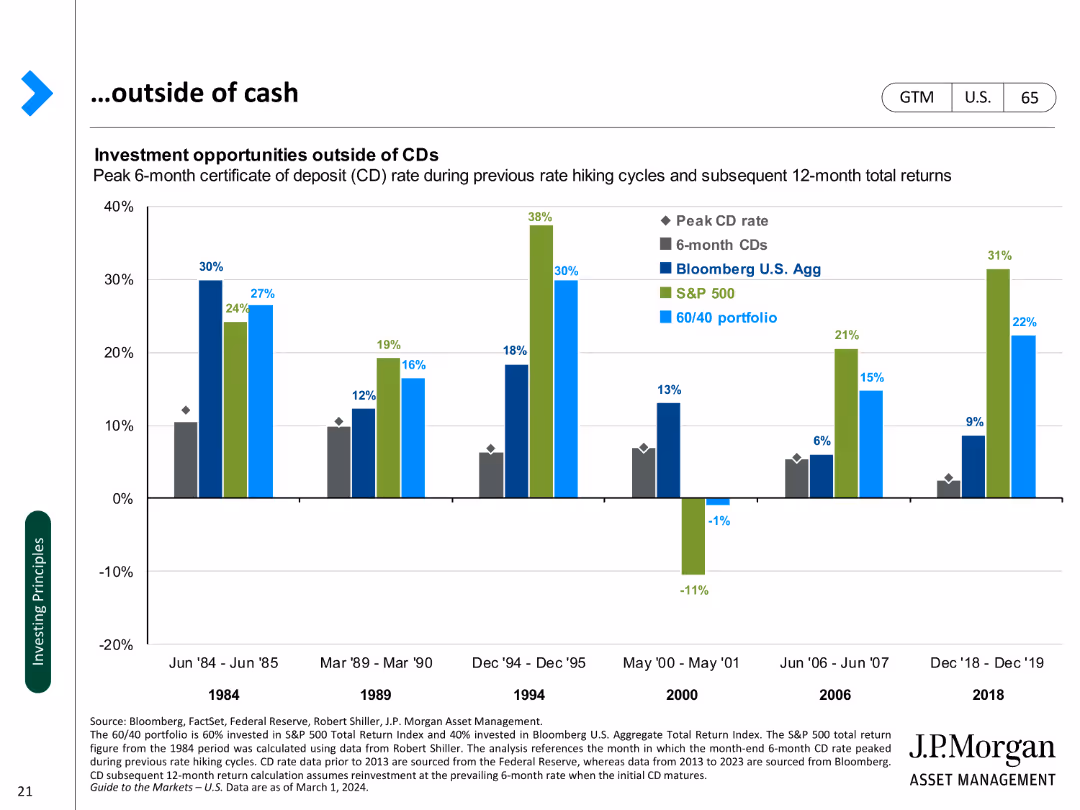
A column chart comparing investment returns of CDs, bonds, and portfolios during past rate hiking cycles.
Investment Analysis
Financial Services
Analyzes investment opportunities beyond cash, focusing on CDs, bonds, and portfolio performance during rate hikes.
Investment, CDs, bonds, portfolios, rate hikes, performance, analysis, opportunities, returns
false
Investment Analysis
Financial Services
Single Chart
JP Morgan
Add to my slides
Remove from favorites
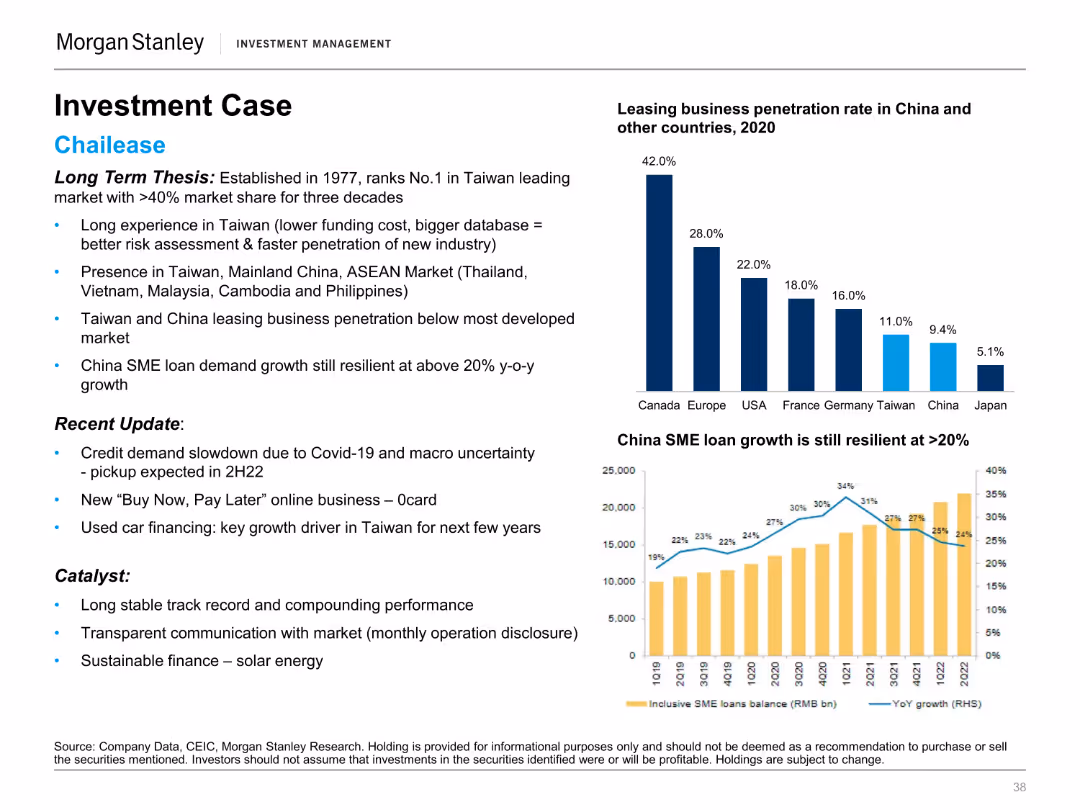
Contains text detailing Chailease's investment case, recent updates, and catalysts. Includes bar and column charts showing business penetration rates and SME loan growth.
Client Case Studies
Financial Services
This slide highlights the investment potential of Chailease, covering its market position, recent performance, and future growth drivers.
Investment, Chailease, Financial Services, Client Case, Performance, Updates, Catalysts, Market, Growth, Penetration
false
Client Case Studies
Financial Services
Multiple Chart
Morgan Stanley
Add to my slides
Remove from favorites
The slide includes a bar chart showing changes in the number of investment products owned over the past five years, segmented by age group.
Market Analysis and Trends
Financial Services
The slide shows survey results on whether the number of investment products owned by respondents has increased, remained the same, or decreased over five years.
investment, change, products, years, increase
false
Market Analysis and Trends
Financial Services
Mixed Chart
IPSOS
Add to my slides
Remove from favorites
This slide has a dual-column format with bullet points. The left column lists customer and client experiences improvements under different bank divisions, while the right column highlights product and platform development initiatives. Each section includes relevant icons and a succinct description.
Strategic Planning
Technology & Software
This slide discusses a $4.1B investment across various business segments, aimed at enhancing customer experiences and driving returns through product development.
Investment, Client Experience, Product Development, Financial Services, Strategy, Banking Sectors, Innovation, Returns
false
Strategic Planning
Technology & Software
Table
JP Morgan
Add to my slides
Remove from favorites
Slide includes a column chart comparing the attractiveness of France to American investors from 2013-2018, alongside quotes from business professionals.
Investment Analysis
Professional Services
Assesses France's attractiveness to American investors over time, noting improvements and challenges influenced by political and economic factors.
investment climate, France, American investors, business environment, European market
false
Investment Analysis
Professional Services
Mixed Chart
Bain
Add to my slides
Remove from favorites
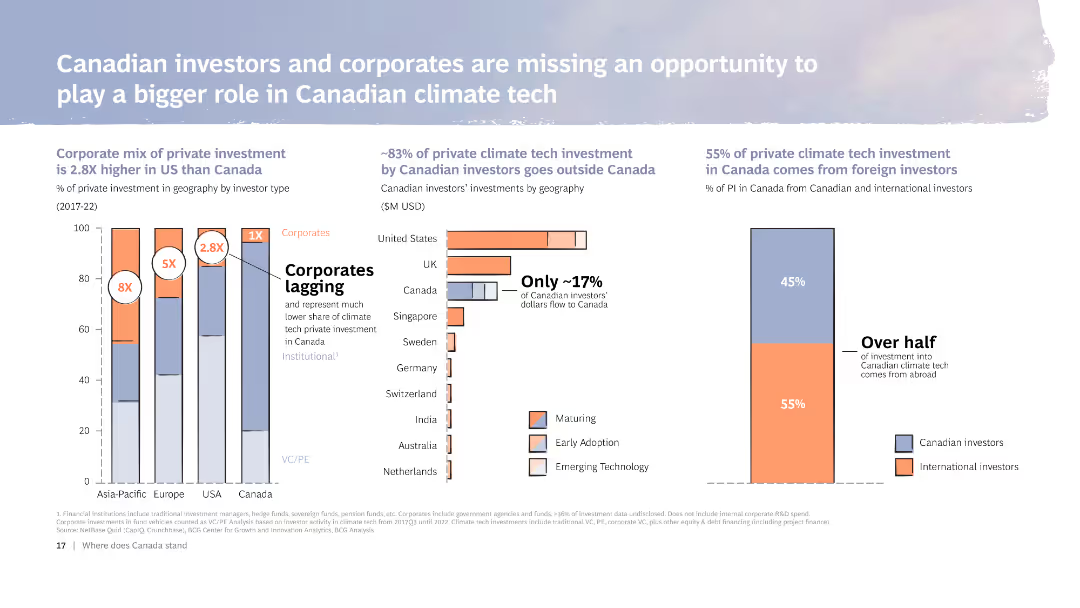
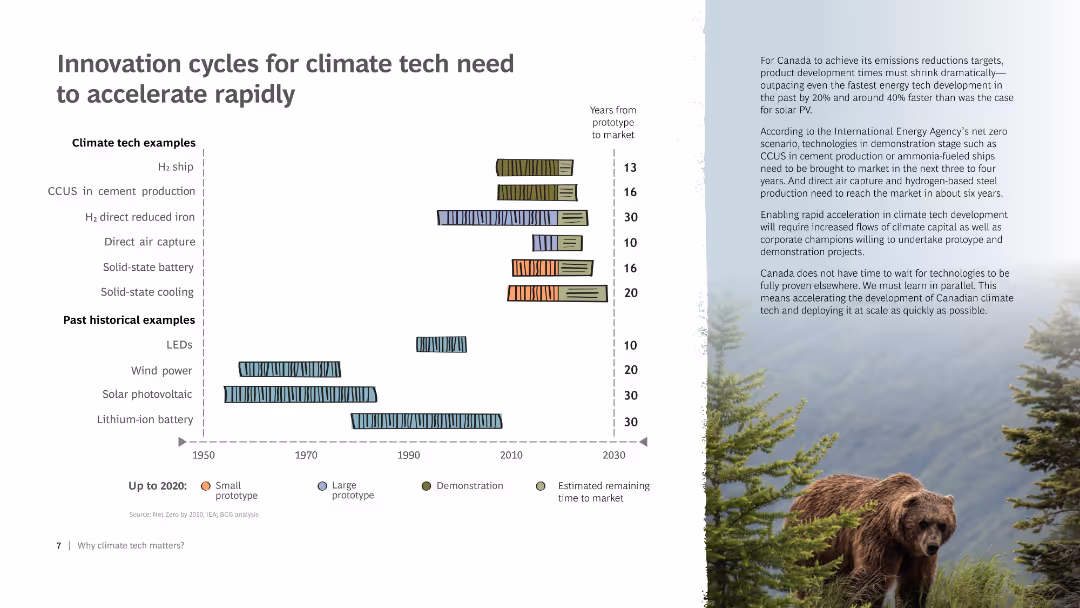
The slide includes multiple column charts and bar charts comparing private climate tech investment in Canada with other regions. It also features text discussing the investment landscape, highlighting areas where Canadian investors and corporates lag.
Investment Analysis
Financial Services
Analyzes the role of Canadian investors and corporates in climate tech investment, comparing with other regions. Highlights missed opportunities and the need for increased domestic investment.
Investment, Climate tech, Canada, Corporates, Chart
false
Investment Analysis
Financial Services
Multiple Chart
BCG
Add to my slides
Remove from favorites
Column chart showing investment trends in Canadian climate tech from 2017 to 2022, with segments for emerging tech, early adoption, and maturing technologies.
Investment Analysis
Environmental Services & Sustainability
Tracks private investment in Canadian climate tech over several years, highlighting trends in funding and the growth of emerging technologies.
Investment, climate tech, Canada, trends, funding
false
Investment Analysis
Environmental Services & Sustainability
Mixed Chart
BCG
Add to my slides
Remove from favorites
This slide presents a three-part narrative structure with bullet points, icons, and a circular diagram showing different business areas in a cycle. It’s mostly text with accentuating colors for different sections.
Investment Analysis
Financial Services
Describes Northern Trust's strategic investment directions supporting growth. It explains the objectives like enhancing client solutions and cloud migration and lists initiatives across various business units. Aimed at conveying how investments will propel business areas and initiatives.
Investment, Cloud, Risk Management, Technologies, Growth Initiatives
false
Investment Analysis
Financial Services
Linear Flow
Morgan Stanley
Add to my slides
Remove from favorites
This slide contains a column chart showing gross cost reductions (~13bn) by year-end 2026, with additional columns for reinvestment in infrastructure, growth, and net cost reduction. To the right, there are boxes listing investment priorities: improving client experience and investing in infrastructure, each with further details.
Financial Performance
Financial Services
The slide shows a plan to achieve a cost/income ratio below 70% by the end of 2026 through cost reductions and reinvestments. It highlights investment priorities in client experience and infrastructure. This slide can be used to present cost management strategies and investment plans to stakeholders.
investment, cost reduction, client experience, infrastructure, priorities
false
Financial Performance
Financial Services
Mixed Chart
UBS
Add to my slides
Remove from favorites
Two line charts depicting Eurozone real investment and investment confidence on the left, and Eurozone credit conditions on the right. Key indicators include non-residential investment, lending standards tightening, and more.
Investment Analysis
Financial Services
This slide compares Eurozone real investment growth and investment confidence with Eurozone credit conditions, showing trends over time and their impact on businesses and consumers.
investment, credit conditions, Eurozone, lending standards, business confidence
false
Investment Analysis
Financial Services
Multiple Chart
JP Morgan
Add to my slides
Remove from favorites
Concludes the series with a tabular view of the top three considerations for investors when making decisions, marking the significance of changes.
Investment Analysis
Financial Services
Caps off the series with an investor focus on investment decision criteria, key for investment strategy and portfolio management.
Investment Criteria, Decision Making, Growth Outlook, Margin Potential, Cash Flow, Returns on Capital, Valuation Levels, ESG Considerations, Governance Policies, Market Opportunities
false
Investment Analysis
Financial Services
Table
BCG
Add to my slides
Remove from favorites
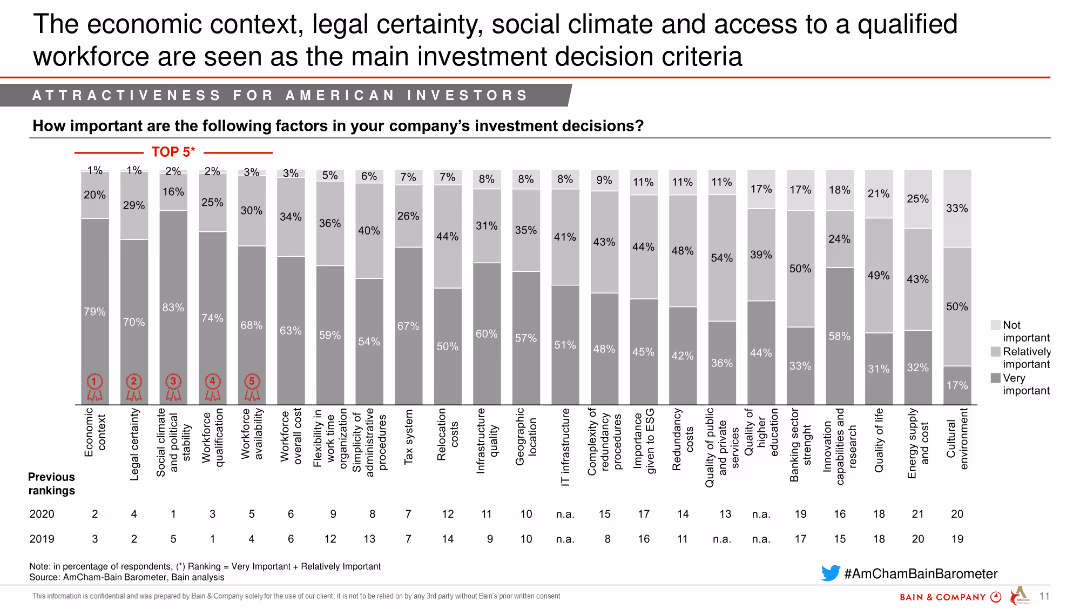
Slide displays a complex, multi-column chart assessing various factors influencing investment decisions, like economic context, workforce quality, and infrastructure, ranked by importance. Gray scales indicate varying levels of importance across factors.
Market Analysis and Trends
Financial Services
Summarizes key factors considered in investment decisions by companies, presenting the importance ranking of each factor such as economic stability and workforce qualifications in decision-making processes.
investment criteria, decision-making, workforce, economic stability, factors
false
Market Analysis and Trends
Financial Services
Single Chart
Bain
Add to my slides
Remove from favorites
The slide contains a column chart highlighting the importance of various factors in investment decisions, such as economic context, legal certainty, and social climate, with rankings from 2019 to 2021.
Market Analysis and Trends
Media & Entertainment
This slide presents the key factors influencing investment decisions in France, with economic context and legal certainty being top priorities.
Investment criteria, Economic context, Legal certainty, Social climate, Workforce
false
Market Analysis and Trends
Media & Entertainment
Single Chart
Bain
Add to my slides
Remove from favorites
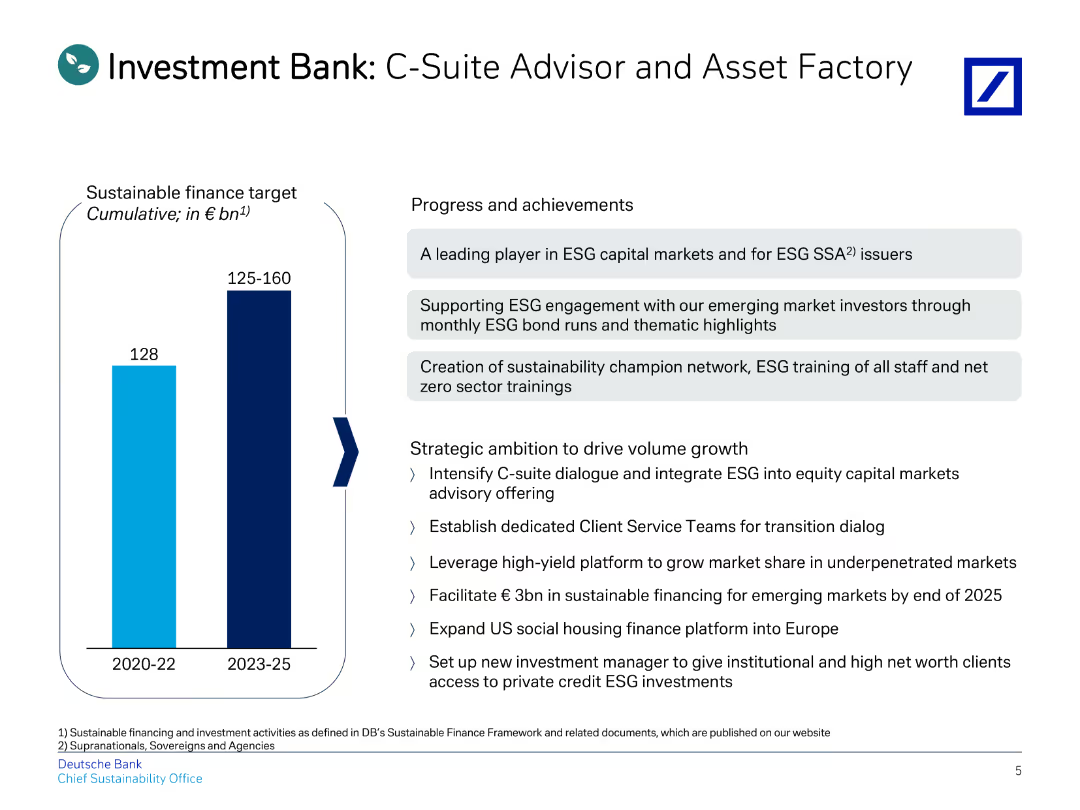
This slide features a title, a vertical bar chart on the left, and bullet points on the right detailing progress and strategic goals.
Investment Analysis
Financial Services
Outlines the roles and achievements of the Investment Bank, focusing on sustainable finance targets and strategic ambitions.
investment, C-suite, advisor, asset, finance
false
Investment Analysis
Financial Services
Mixed Chart
Deutsche Bank
Add to my slides
Remove from favorites
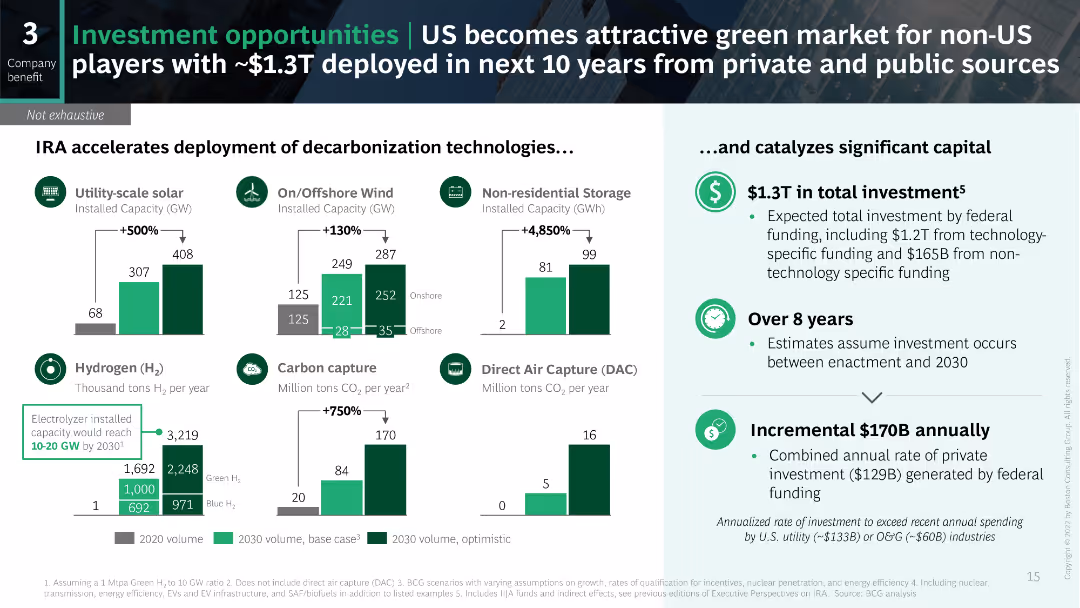
The slide features a variety of visual data elements including bar charts and icons to illustrate the deployment of decarbonization technologies and the associated financial investments. The layout is dense with detailed data and projections.
Investment Analysis
Financial Services
This slide highlights the investment opportunities in the US for decarbonization technologies driven by the IRA, projecting significant private and public investment over the next 10 years and detailing specific areas like solar and wind energy.
investment, decarbonization, IRA, solar, wind
false
Investment Analysis
Financial Services
Multiple Chart
BCG
Add to my slides
Remove from favorites
Features column charts using grayscale and red color schemes to highlight different investment needs and areas like energy and waste management.
Investment Analysis
Environmental Services & Sustainability
Analyzes the financial requirements for Southeast Asia to close the emissions gap by 2030, focusing on energy, industry, and infrastructure investments.
investment, decarbonization, SEA, 2030, energy, infrastructure, waste management
false
Investment Analysis
Environmental Services & Sustainability
Multiple Chart
Bain
Add to my slides
Remove from favorites
Includes a column chart displaying changes in visibility for investment decisions.
Investment Analysis
Financial Services
Discusses how C-suite executives' visibility into making investment decisions has improved from 2023 to 2024, driven by various factors including capital availability and regulatory changes.
investment decisions, C-suite, visibility, factors
false
Investment Analysis
Financial Services
Multiple Chart
BCG
Add to my slides
Remove from favorites
This slide includes multiple column charts comparing various factors influencing investment decisions, marked with changes from a previous survey and indicators for significant trends.
Investment Analysis
Financial Services
Analyzes priority factors for investors when making recommendations, focusing on long-term growth, FCF generation, and business strategy, useful in investor relations and strategic planning.
investment decisions, growth, FCF generation, business strategy, long-term focus
false
Investment Analysis
Financial Services
Multiple Chart
BCG
Add to my slides
Remove from favorites
Incorporates a column chart displaying factors important for investment decisions, labeled with rankings and percentage importance.
Strategic Planning
Professional Services
Explores the key factors influencing corporate investment decisions, highlighting the significance of workforce cost and economic stability.
Investment Decisions, Workforce Cost, Economic Stability, Strategic Factors
false
Strategic Planning
Professional Services
Single Chart
Bain
Add to my slides
Remove from favorites
Bar chart depicting investment priorities in digital strategies and man-machine collaboration among Automotive-OES respondents.
Investment Analysis
Transportation & Logistics
Outlines investment trends in strategic digital alignment and collaboration, focusing on the automotive sector's shift towards digital technologies.
investment, digital, collaboration, automotive, technology, strategies, priorities, alignment
false
Investment Analysis
Transportation & Logistics
Single Chart
Accenture
Add to my slides
Remove from favorites
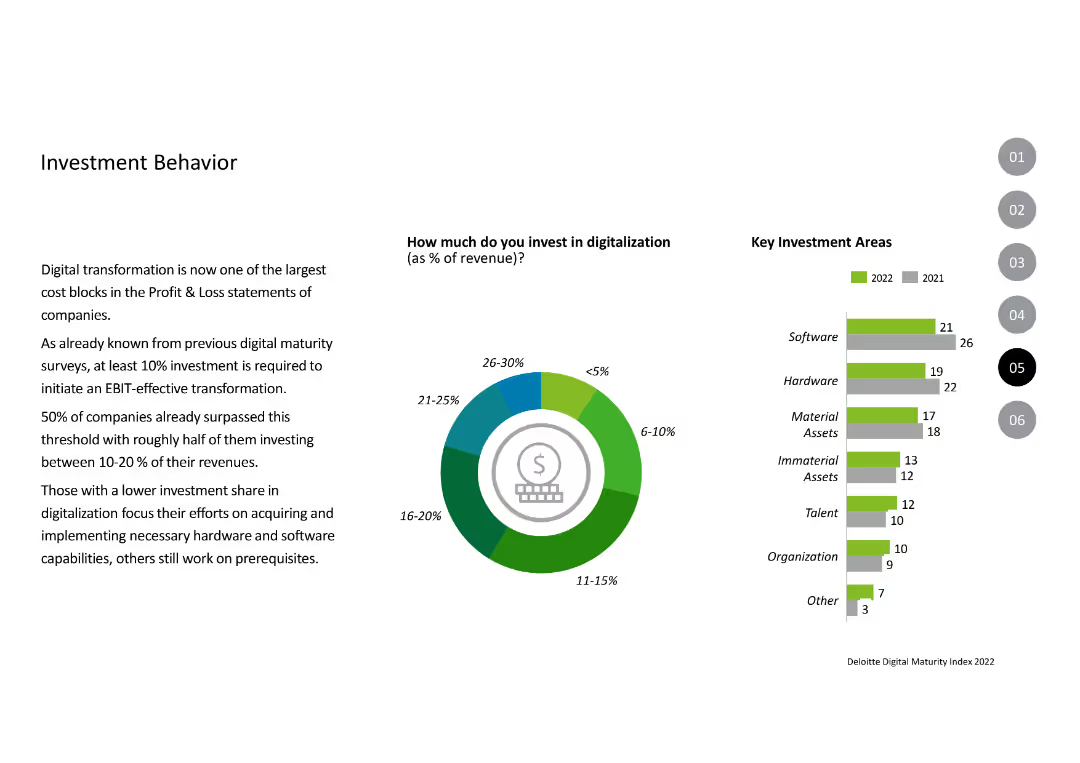
The slide features a donut chart representing investment percentages in digitalization and a column chart showing key investment areas. Visual elements include a mix of green, blue, and gray hues, with concise labels for each section. Text on the left explains the importance of investment in digital transformation.
Investment Analysis
Financial Services
Discusses the growing investment in digitalization among companies, emphasizing a minimum of 10% revenue allocation for EBIT-effective transformation. Highlights different investment levels and key areas, such as software and hardware, with respective percentages for 2022 and 2021.
Investment, Digitalization, Revenue, Software, Hardware
false
Investment Analysis
Financial Services
Multiple Chart
Deloitte
Add to my slides
Remove from favorites
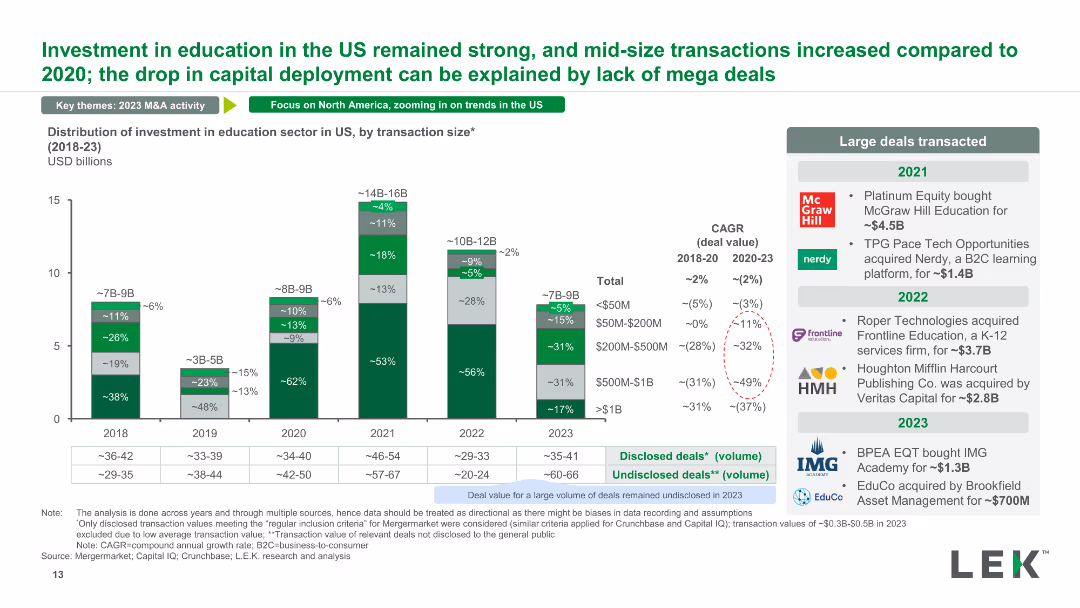
A stacked column chart detailing the distribution of investment in the US education sector by transaction size from 2018 to 2023. It highlights large deals and their impact on overall investment patterns.
Market Analysis and Trends
Education & Training
The slide presents the distribution of investments in the US education sector, focusing on transaction sizes and their influence on the market. It also lists major transactions within the time frame.
investment distribution, US education, transaction size, major deals, investment patterns
false
Market Analysis and Trends
Education & Training
Mixed Chart
LEK
Add to my slides
Remove from favorites
Two pie charts dominate the slide, comparing the distribution of traditional and alternative investments. The slide uses a clean design with a dark and light blue color palette.
Financial Performance
Financial Services
The slide details a strategic plan for investment diversification, breaking down traditional and alternative investment types by percentage to support broad-based growth.
Investment, Diversification, Strategy, Growth, Plan
false
Financial Performance
Financial Services
Multiple Chart
Goldman Sachs
Add to my slides
Remove from favorites
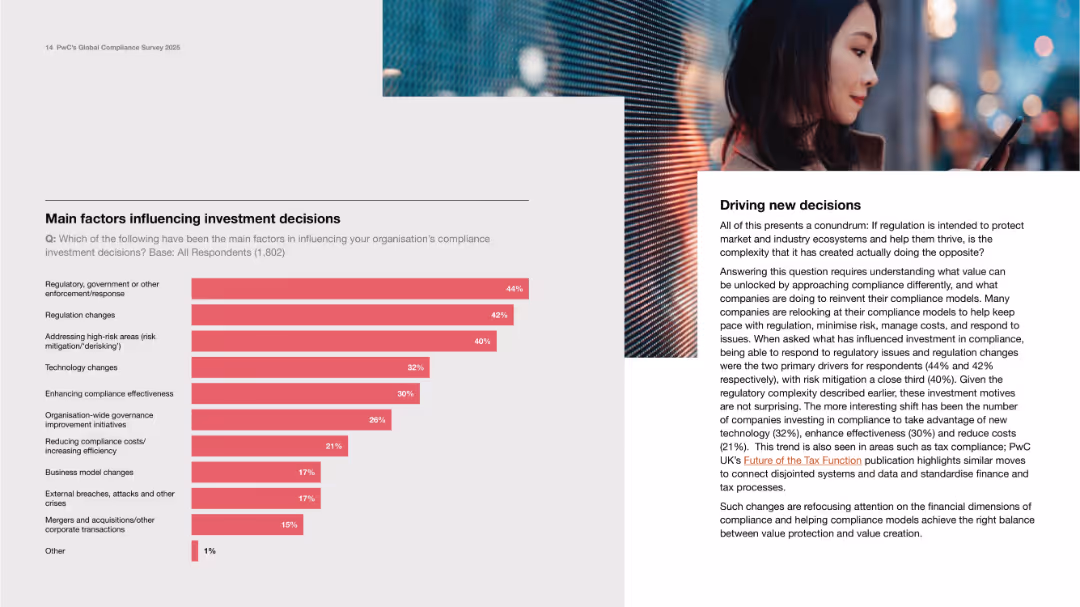
Horizontal bar chart on left; narrative text on right with contextual explanation.
Investment Analysis
Financial Services
Details top influences on compliance investment decisions such as regulatory enforcement, high-risk areas, and tech changes. The text discusses the tension between compliance cost and value creation.
investment drivers, regulation, risk, technology, compliance spending
false
Investment Analysis
Financial Services
Mixed Chart
PwC/Strategy&
Add to my slides
Remove from favorites
The slide features a bar chart showing the percentage of total investment value in Indonesia from 2012 to August 2017, with categories such as E-commerce, Transport, Finance, Classified/Directory, Payment, and Others.
Market Analysis and Trends
Retail & E-commerce
This slide highlights that E-commerce and transport sectors heavily dominate investments in Indonesia, accounting for 58% and 38% respectively, followed by minimal investments in other categories.
investment, E-commerce, transport, Indonesia, 2012-2017, finance, directory, payment, top categories
false
Market Analysis and Trends
Retail & E-commerce
Mixed Chart
Kearney
Add to my slides
Remove from favorites
The slide features a column chart illustrating the number of disclosed education deals in Africa from 2004-2018. The chart shows significant growth, with detailed annotations about the largest deals and their values. The right side lists major transactions, including target companies and bidders.
Investment Analysis
Education & Training
This slide examines investment activity in the African education sector, highlighting a 24X growth in disclosed deals from 2004-2018. It provides a detailed look at the largest transactions, showcasing major bidders and their target companies, indicating significant investment interest in education.
investment, education, Africa, deals, growth
false
Investment Analysis
Education & Training
Mixed Chart
LEK
Add to my slides
Remove from favorites
The slide features a column chart showing the total size of disclosed education deals by region in Africa from 2014-2018. It includes annotations and highlights of capital deployment, with specific details about investments in Southern, Northern, Eastern, and Western Africa.
Investment Analysis
Education & Training
This slide provides a regional breakdown of investment activity in the African education sector, detailing the total disclosed capital and the number of deals from 2014-2018. It highlights significant investments in Southern and Northern Africa, underscoring regional differences in investment levels.
investment, education, Africa, regional, capital
false
Investment Analysis
Education & Training
Mixed Chart
LEK
Add to my slides
Remove from favorites
The slide features a column chart with annual turnover figures for select education companies, indicating presence in Asia with different colored bars. The chart is set against a clear backdrop with the title above and the company names below.
Investment Analysis
Education & Training
This presents the annual turnover of selected companies within the education sector, comparing their revenue performance and highlighting those with a presence in Asia. It’s aimed at illustrating the potential for return on investment through scaling businesses in education.
Investment, Education Platforms, Scale, Revenue, Turnover, Companies, Asia
false
Investment Analysis
Education & Training
Single Chart
EY
Add to my slides
Remove from favorites
A bar chart showing the percentage of companies planning to expand or establish operations in Europe, with an explanatory text box providing additional insights.
Strategic Planning
Financial Services
The slide discusses the priority of Europe for companies, indicating plans to establish or expand operations, and highlights the sectors with the highest expansion intentions.
investment, Europe, company plans, expansion
false
Strategic Planning
Financial Services
Mixed Chart
EY
Add to my slides
Remove from favorites
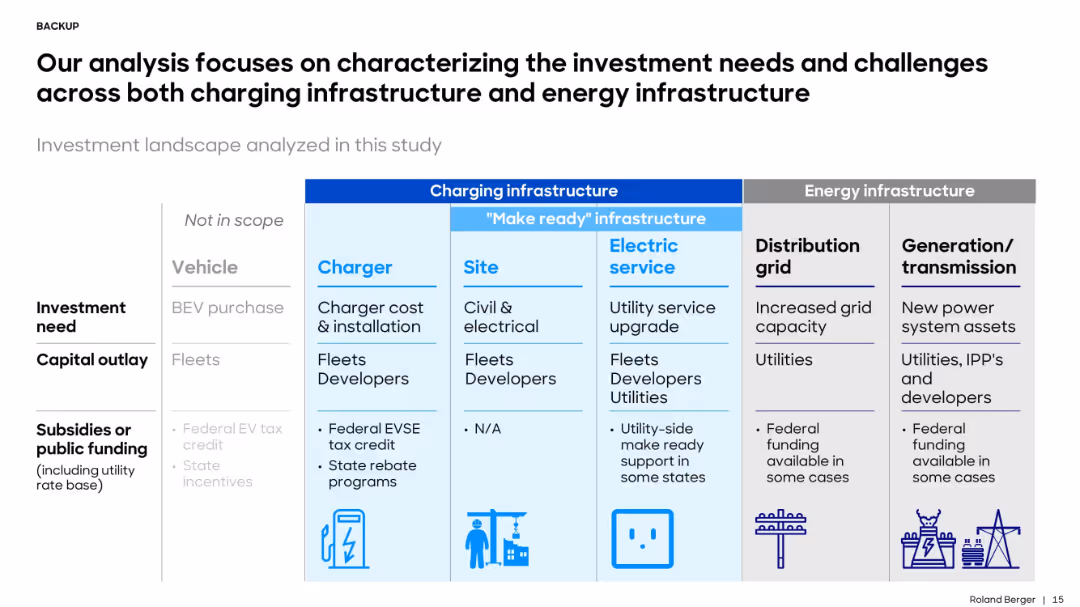
Matrix layout with colored columns for Charging Infrastructure and Energy Infrastructure; uses icons and bullets to outline capital needs and funding roles.
Investment Analysis
Energy & Utilities
The slide outlines the required investments in EV charging and energy infrastructure, distinguishing between charging hardware, site prep, utility upgrades, and grid expansion, with notes on funding sources and stakeholders.
investment, EV charging, grid, infrastructure, utilities, developers, capital, subsidies
false
Investment Analysis
Energy & Utilities
Table
Roland Berger
Add to my slides
Remove from favorites
Matrix layout displaying market size, margins, and recent investments by segment; use of logos and icons; clean typography
Investment Analysis
Financial Services
Presents investment opportunities across EV value chain segments, particularly upstream (raw materials, battery components). Highlights market size, profit margins, and notable investments in SEA-6, especially Indonesia and Vietnam.
investment, EV value chain, battery materials, upstream, margins, SEA-6
false
Investment Analysis
Financial Services
Table
Bain
Add to my slides
Remove from favorites
A column chart shows various company-specific factors influencing investment decisions with percentage changes from a previous survey. Color coding differentiates factors with significant changes.
Investment Analysis
Financial Services
Analyzes key company-specific factors that influence investment decisions and highlights changes in their importance over time. Useful for investors to prioritize aspects such as growth, margins, and cash flow in their decision-making process.
investment, factors, company, decisions, analysis
false
Investment Analysis
Financial Services
Multiple Chart
BCG
Add to my slides
Remove from favorites
Ranked list with icon indicators and trend arrows; text-heavy layout with bullets and numbering; dark blue background
Regulatory and Compliance
Government & Public Sector
The slide ranks key enablers of increased German investment, including talent regulation, innovation procurement, and competitive energy pricing, based on CxO survey data.
Investment factors, Germany, talent, innovation, energy, ranking, CxO, 2025
false
Regulatory and Compliance
Government & Public Sector
Header Vertical
McKinsey
Add to my slides
Remove from favorites
Composed of multiple vertical bar graphs, this slide indicates the factors investors consider when making investment decisions. It uses a teal color scheme with variations in bar height to represent percentages, making it data-rich and informative.
Investment Analysis
Financial Services
The slide conveys investors' focus on various company-specific factors for investment consideration, such as long-term growth and valuation, suitable for analyzing investment criteria.
Investment Factors, Market Share, Valuation, Cash Flow, Balance Sheet, Organic Growth, Capital Improvement, Long-term Outlook, Strategic Investment, Company Evaluation
false
Investment Analysis
Financial Services
Mixed Chart
BCG
Add to my slides
Remove from favorites
Slide with a vertical column chart showing financial investment breakdown for FY 2023, accompanied by bullet points outlining areas like operational efficiency and business growth. Graphics include icons for visual emphasis.
Investment Analysis
Financial Services
Discusses the bank's investment strategies for FY 2023, highlighting areas of spending such as operational efficiency and business growth initiatives. It outlines strategies to adapt to future challenges and maximize efficiency.
investment, financial planning, operational efficiency, FY 2023, business growth
false
Investment Analysis
Financial Services
Mixed Chart
Deutsche Bank
Add to my slides
Remove from favorites
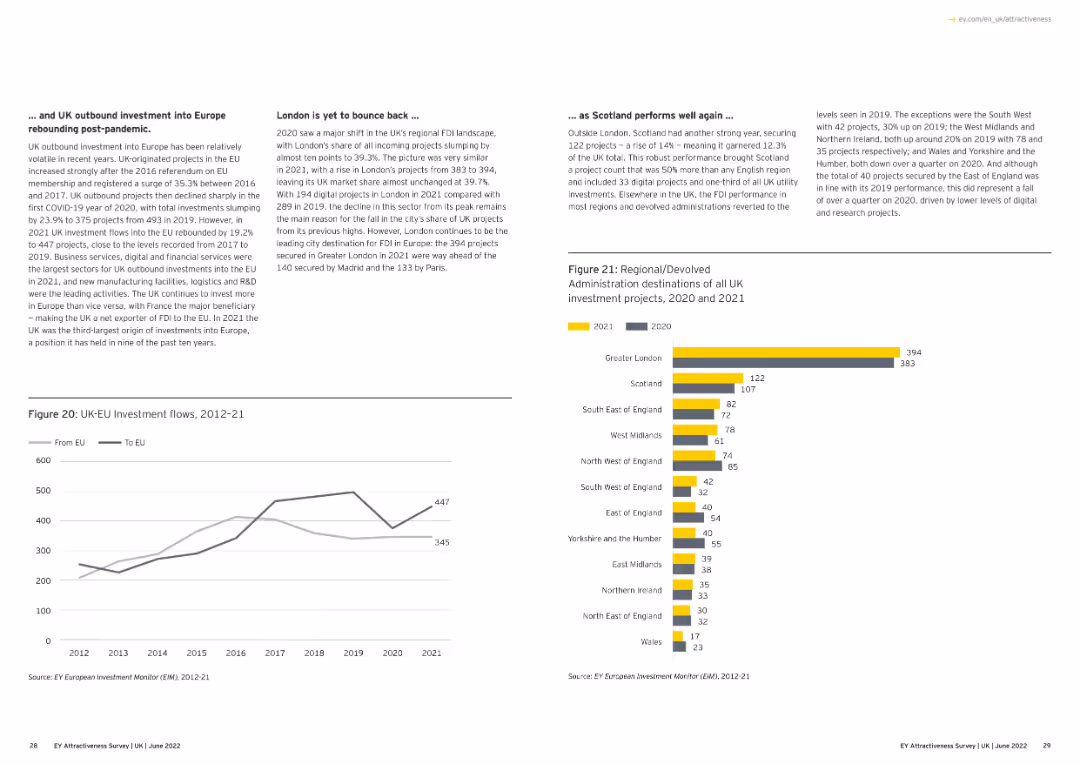
The slide includes a line chart comparing UK-EU investment flows from 2012 to 2021, showing investments to and from the EU.
Market Analysis and Trends
Financial Services
It examines the flow of investments between the UK and EU over the years, showing trends in cross-border investments and economic relationships.
investment flows, UK, EU, 2012-21, line chart
false
Market Analysis and Trends
Financial Services
Mixed Chart
EY
Add to my slides
Remove from favorites
Uses a pie chart and a bar graph to show investment deal values in SEA, with a focus image of a woman using a smartphone.
Investment Analysis
Technology & Software
Presents data on regional investment dominance with a focus on Singapore and Indonesia, and the growth in fintech investments.
Investment Focus, Fintech, Southeast Asia, Singapore, Indonesia, Market Share, Growth Analysis
false
Investment Analysis
Technology & Software
Multiple Chart
Bain
Add to my slides
Remove from favorites
Slide includes a combination of imagery and column icons, presenting investment data and trends.
Investment Analysis
Agriculture & Food Production
Analyzes recent investment trends in the FoodTech sector, discussing shifts in focus and investment distribution.
Investment, FoodTech, trends, growth, sustainability
false
Investment Analysis
Agriculture & Food Production
Header Vertical
Accenture
Add to my slides
Remove from favorites
Dual-box layout describing framework components; includes simple quadrant chart showing priority area based on two axes.
Investment Analysis
Environmental Services & Sustainability
This slide introduces the framework used to assess and prioritize investment ideas. Abatement potential and deployability are the key axes—factors like emissions scope, reduction potential, and financial benefits determine scoring. A visual matrix emphasizes high-priority ideas at the top right.
investment framework, deployability, emissions reduction, abatement, priority scoring, environmental impact
false
Investment Analysis
Environmental Services & Sustainability
Mixed Chart
Bain
Add to my slides
Remove from favorites
Text-heavy slide with bullet points and a two-column table. It includes terms like 'Initiative Type' and 'Financial Evaluation'.
Investment Analysis
Financial Services
Describes a framework for evaluating investments, outlining types of initiatives and financial considerations, likely used in strategic investment planning sessions.
Investment Framework, Evaluation, Strategy, Initiatives, Planning, Financial Analysis
false
Investment Analysis
Financial Services
Table
Goldman Sachs
Add to my slides
Remove from favorites
The slide contains multiple column charts, each with three groups (Detractors, Passives, Promoters) depicting percentages from 2014 to 2018, reflecting reluctance or recommendation for US businesses expanding in France. Red highlights and quotes complement the data.
Market Analysis and Trends
Professional Services
This slide provides a yearly breakdown of American investor sentiments towards business expansion in France, using Net Promoter Scores to highlight varying levels of enthusiasm or reluctance over five years.
investment, France, business expansion, NPS, American investors
false
Market Analysis and Trends
Professional Services
Mixed Chart
Bain
Add to my slides
Remove from favorites
Bar chart showing investment breakdown by sector and year; legend for types of investment (solar, wind, etc.)
Financial Performance
Environmental Services & Sustainability
Displays Indonesia's private green investment by type from 2023 to 2024. Investments dropped by ~22%, with fewer deals and significant drop in waste management and fuel substitution.
Investment, fuel substitution
false
Financial Performance
Environmental Services & Sustainability
Single Chart
Bain
Add to my slides
Remove from favorites
Column chart showing the market value of crypto investment funds held, with categories ranging from less than $1,000 to over $1,000,000.
Market Analysis and Trends
Financial Services
Shows the market value distribution of crypto investment funds held by owners, highlighting the various ranges of investment amounts.
investment funds, crypto market, value distribution, financial analysis, investment trends
false
Market Analysis and Trends
Financial Services
Single Chart
IPSOS
Add to my slides
Remove from favorites
World map background with color-coded bars representing different countries. Bars show investment as a percentage of GDP, comparing several nations.
Investment Analysis
Financial Services
The slide presents investment challenges by showing different GDP investment percentages across countries like the USA, Germany, and China, pointing to the economic demands of transitioning to greener practices.
investment, GDP, global, economic, challenge
false
Investment Analysis
Financial Services
Graphic
BCG
Add to my slides
Remove from favorites
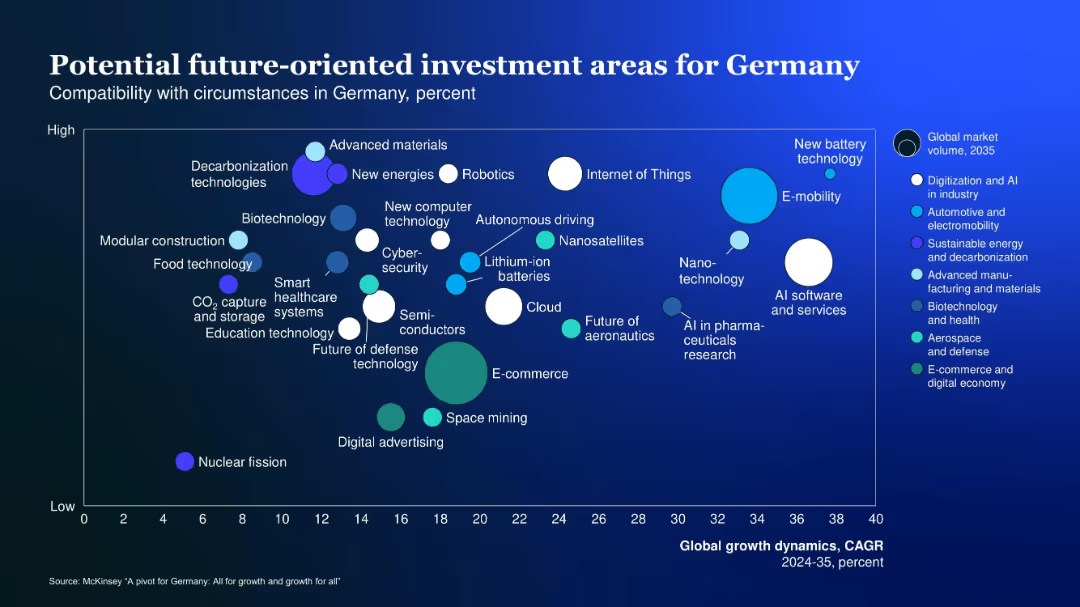
Scatter plot with x-axis as global growth CAGR and y-axis as compatibility with Germany; multiple color-coded bubbles by sector
Investment Analysis
Industrial & Manufacturing
A bubble chart mapping future investment areas by growth potential and compatibility with Germany; highlights include AI, e-mobility, decarbonization, and advanced materials.
Investment, Germany, future-oriented, AI, compatibility, growth, 2035, scatter plot
false
Investment Analysis
Industrial & Manufacturing
Single Chart
McKinsey
Add to my slides
Remove from favorites
This slide displays various financial sectors with corresponding assets and rankings, using blue-toned boxes and clear text hierarchy.
Investment Analysis
Financial Services
It provides a comprehensive view of a firm's investment platform across different financial sectors, showcasing global scale and diversity.
Investment, Global Scale, Financial Sectors, Assets, Rankings, Liquidity, Equity, Alternatives, Brokerage
false
Investment Analysis
Financial Services
Table
Goldman Sachs
Add to my slides
Remove from favorites
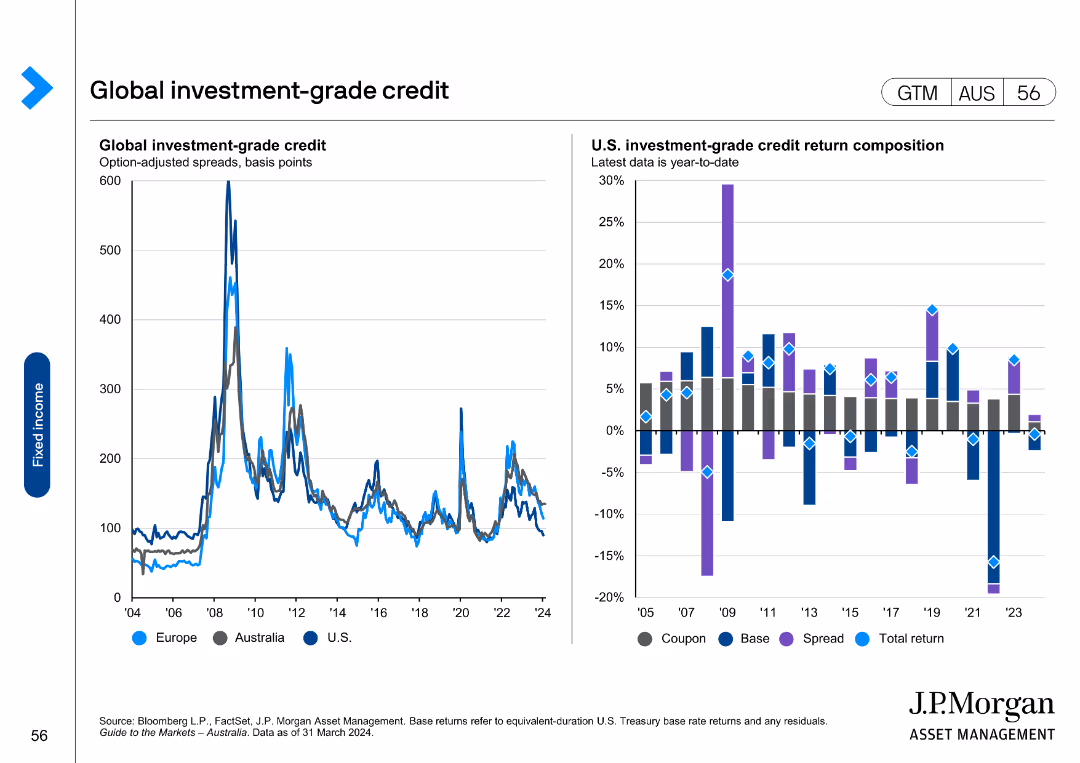
The slide features two charts: a line chart on the left showing option-adjusted spreads for Europe, Australia, and U.S., and a column chart on the right displaying U.S. investment-grade credit return composition.
Market Analysis and Trends
Financial Services
It provides data on global investment-grade credit spreads and U.S. investment-grade credit returns, useful for understanding trends in investment-grade credit markets.
investment-grade, credit, spreads, returns, U.S.
false
Market Analysis and Trends
Financial Services
Multiple Chart
JP Morgan
Add to my slides
Remove from favorites
This slide has two parts: the left side shows pie charts depicting investment intentions for Greece, while the right side lists economic risks in a vertical bar chart.
Risk Assessment and Management
Financial Services
This slide presents survey data on investors' perceptions regarding investment opportunities and economic risks in Greece, highlighting key factors influencing decisions.
investment, Greece, perceptions, risks, survey
false
Risk Assessment and Management
Financial Services
Graphic
EY
Add to my slides
Remove from favorites
The left side has text with subheadings and bullet points. The right side features circular graphs showing the percentage of companies planning to establish or expand in Greece.
Market Analysis and Trends
Financial Services
This slide provides an analysis of the growing appetite for investment in Greece, including the intentions of companies to establish or expand operations in the country.
investment, Greece, trends, market analysis, growth
false
Market Analysis and Trends
Financial Services
Mixed Chart
EY
Add to my slides
Remove from favorites
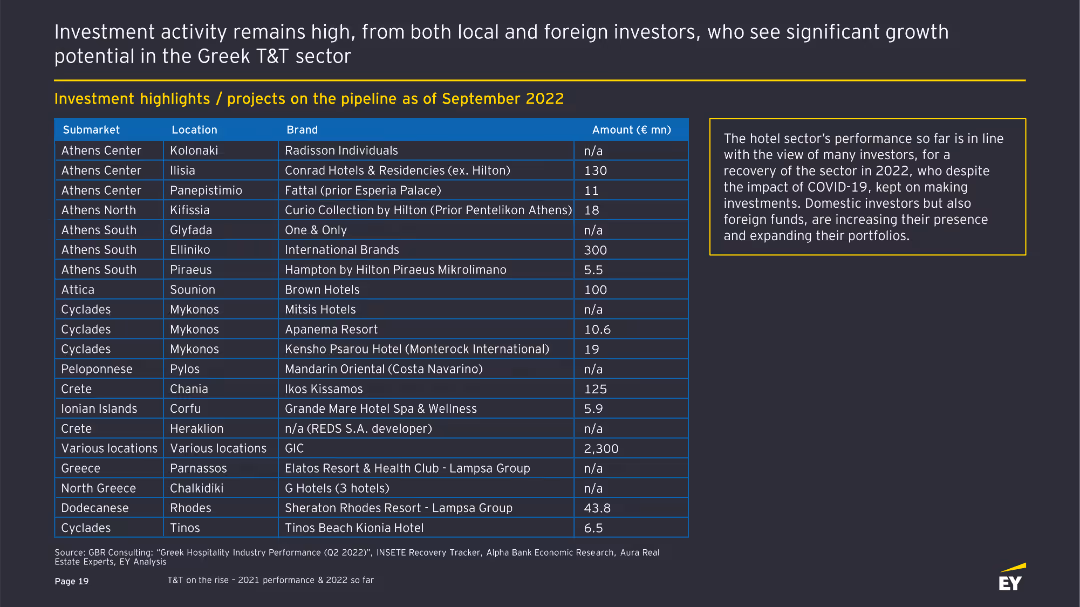
The slide contains a table listing various investment projects in the Greek T&T sector, detailing submarkets, locations, brands, and investment amounts. There is a text box on the right summarizing the hotel sector's performance.
Investment Analysis
Hospitality & Tourism
Highlights investment projects in the Greek T&T sector as of September 2022. It shows submarkets, locations, brands, and investment amounts. The text box explains the positive outlook for the hotel sector despite the impact of COVID-19.
Investment, Greek T&T, Projects, Hotels, COVID-19
false
Investment Analysis
Hospitality & Tourism
Table
EY
Add to my slides
Remove from favorites
The slide contains a table listing various investment projects in the Greek T&T sector, detailing submarkets, locations, brands, and investment amounts. There is a text box on the right summarizing the hotel sector's performance.
Investment Analysis
Hospitality & Tourism
Highlights investment projects in the Greek T&T sector as of September 2022. It shows submarkets, locations, brands, and investment amounts. The text box explains the positive outlook for the hotel sector despite the impact of COVID-19.
Investment, Greek T&T, Projects, Hotels, COVID-19
false
Investment Analysis
Hospitality & Tourism
Mixed Chart
EY
Add to my slides
Remove from favorites
Slide features tables comparing capital deployment across corporates, PE/VC, infrastructure funds, and others. Uses color coding and icons.
Market Analysis and Trends
Environmental Services & Sustainability
Analyzes investment in the green economy by different investor types, focusing on sectors like solar/wind and mobility.
investment, green economy, solar energy, capital flow, market analysis
false
Market Analysis and Trends
Environmental Services & Sustainability
Table
Bain
Add to my slides
Remove from favorites
Column charts showing cost breakdown over years and future investment impacts.
Investment Analysis
Financial Services
Illustrates cost management and the impact of investments on future growth.
investment, growth, cost management, future
false
Investment Analysis
Financial Services
Multiple Chart
Barclays
Add to my slides
Remove from favorites
A bar graph and timeline are depicted, contrasting the private funding value across different halves of the years. The visual elements are in shades of blue, offering a stark visual against the white background. The data points are clear, and there is a dotted line indicating a forecasted trend.
Investment Analysis
Financial Services
The slide outlines the growth in deal value in Singapore, making it a preferred investment destination in the region. It provides historical and current data on private funding values, useful for assessing the investment climate and predicting future trends in regional investment activities.
investment, growth, deal value, Singapore, private funding
false
Investment Analysis
Financial Services
Single Chart
Bain
Add to my slides
Remove from favorites
Contains three sections with icons, bullet points, and financial charts, emphasizing investment justifications.
Investment Analysis
Financial Services
The slide provides reasons for investment, using a combination of text and charts to display financial growth and market position, appealing to potential investors.
Investment, Growth, Market Position, Financial Returns, Strategy
false
Investment Analysis
Financial Services
Pillar
Booz Allen Hamilton
Add to my slides
Remove from favorites
A single column chart dominates the slide, showing dramatic growth in queries for Robo-Advisors and Online Wealth Management, with the country comparison. There's a clear visual hierarchy with data emphasis.
Market Analysis and Trends
Financial Services
The slide presents the rise of online investment platforms like Robo-Advisors, signaling a growing comfort in managing wealth online among consumers, highlighting the potential for industry expansion.
investment, growth, Robo-Advisors, wealth
false
Market Analysis and Trends
Financial Services
Mixed Chart
Bain
Add to my slides
Remove from favorites
Features a line chart showing investment projections over 20 years under low and high growth scenarios, with key projects listed. Visuals include icons and highlighted text boxes.
Investment Analysis
Energy & Utilities
Examines potential economic impacts of proposed oil and gas investments, detailing low and high growth scenarios and listing key projects in development.
Investment, Growth Scenarios, Economic Impact, Oil and Gas, Western Australia, Key Projects, Future Capacity
false
Investment Analysis
Energy & Utilities
Mixed Chart
EY
Add to my slides
Remove from favorites
This slide contains a complex column chart with annotations.
Investment Analysis
Financial Services
This slide visualizes factors that investors prioritize in making investment decisions, highlighting growth, FCF generation, and business strategy as top factors.
investment, growth, strategy, FCF, business
false
Investment Analysis
Financial Services
Multiple Chart
BCG
Add to my slides
Remove from favorites
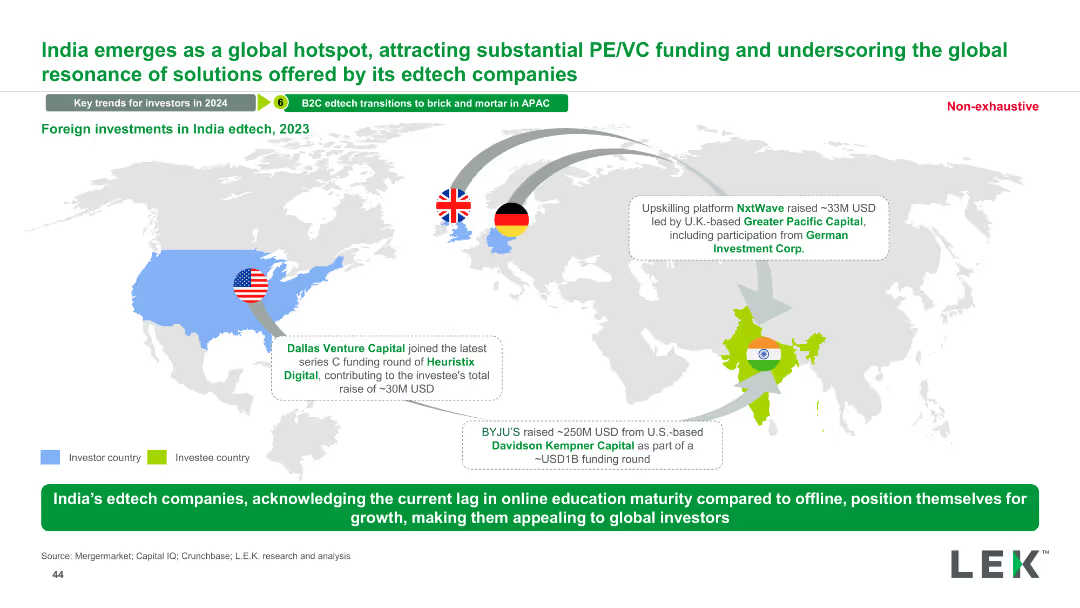
World map with highlighted regions (USA, UK, Germany, India). Arrows connect these regions to investment details. Contains logos and funding amounts.
Investment Analysis
Education & Training
Highlights significant PE/VC funding in India's edtech sector, showing major investments from global investors in companies like Heuristix Digital and NxtWave.
investment, India, edtech, PE/VC funding, global investors, 2023
false
Investment Analysis
Education & Training
Graphic
LEK
Add to my slides
Remove from favorites
A pie chart representing investment sentiment in Indonesia paired with key insights from interviews, all set against a neutral background.
Investment Analysis
Technology & Software
Discusses the positive investment outlook in Indonesia despite the pandemic, with insights on factors influencing investments.
Investment, Indonesia, pandemic, market outlook, insights, factors
false
Investment Analysis
Technology & Software
Single Chart
Kearney
Add to my slides
Remove from favorites
The slide features a bar chart of sources of investment information and a text box with insights on the preferred sources based on age groups.
Risk Assessment and Management
Financial Services
The slide presents data on the preferred sources of information for investments, including advisors, friends, brokers, and online sources, segmented by age.
investment, information, sources, age, preference
false
Risk Assessment and Management
Financial Services
Mixed Chart
IPSOS
Add to my slides
Remove from favorites
Map of North America highlighting Enbridge's infrastructure with a pie chart and list of attributes about business stability and growth potential.
Investment Analysis
Energy & Utilities
Positions Enbridge as a key investment due to its stable cash flow and diversified infrastructure, critical for investor briefings and strategic investment decisions.
Investment, Infrastructure, Stability, Cash Flow, Growth Potential
false
Investment Analysis
Energy & Utilities
Multiple Chart
Barclays
Add to my slides
Remove from favorites
The slide features a pie chart of investment intentions and a bar chart of planned investments, with a text box summarizing the key insights.
Market Analysis and Trends
Financial Services
The slide presents data on respondents' intentions to invest in new financial products over the next year and the types of investments they plan to make.
investment, intentions, financial, products, planned
false
Market Analysis and Trends
Financial Services
Multiple Chart
IPSOS
Add to my slides
Remove from favorites
Slide displays a column chart with the number of deals and deal value in the internet sector of the Philippines from 2016 to H1 2020, with a clear title, and legends for the chart.
Investment Analysis
Technology & Software
This slide evaluates investments in the Philippines' internet sector, showing deal counts and values, intended for stakeholders analyzing investment trends and opportunities.
Investment, Internet, Philippines, Deals, Value
false
Investment Analysis
Technology & Software
Single Chart
Bain
Add to my slides
Remove from favorites
Column chart displays the investment deal values in Indonesia's internet sector over time, including the number of deals.
Investment Analysis
Technology & Software
The slide highlights investment trends in Indonesia's internet sector, with data on deal values and the number of deals from 2016 to H1 2020.
Investment, Internet sector, Indonesia, Deal value, Trends, 2016, 2020, Number of deals
false
Investment Analysis
Technology & Software
Single Chart
Bain
Add to my slides
Remove from favorites
Column charts depict the investment deal values in Malaysia's internet sector, including deal count.
Investment Analysis
Technology & Software
Focuses on investment trends within Malaysia's internet sector, with data on deal values and counts from 2016 to H1 2020.
Investment, Internet sector, Malaysia, Deal values, Trends, 2016, 2020, Deal count
false
Investment Analysis
Technology & Software
Single Chart
Bain
Add to my slides
Remove from favorites
Slide showing a timeline with a series of column charts depicting the number of deals and their value in the Vietnamese internet sector, annotated with year labels.
Investment Analysis
Technology & Software
Offers an investment overview of Vietnam's internet sector, detailing the number of deals and their values over time. It serves to analyze investment trends and assess the sector's growth, valuable for stakeholders and investors considering the Vietnamese market.
investment, internet sector, Vietnam, deals, growth trend, market analysis
false
Investment Analysis
Technology & Software
Single Chart
Bain
Add to my slides
Remove from favorites
The slide has a column chart showing the number of deals and deal value in the internet sector in Singapore from 2016 to H1 2020, with a title and legends for the chart elements.
Investment Analysis
Technology & Software
Analyzes the investment landscape in Singapore's internet sector, depicting deal flow and capital investment trends, useful for investors and analysts monitoring the digital economy's health.
Investment, Internet, Singapore, Trends, Capital
false
Investment Analysis
Technology & Software
Single Chart
Bain
Add to my slides
Remove from favorites
Three columns comparing investment offering, structured lending capability, and cross-divisional collaboration.
Competitive Landscape
Financial Services
Describes Credit Suisse's unique capabilities that set it apart in the market, focusing on investments and lending solutions.
investment, lending, collaboration, competitive advantage, client value
false
Competitive Landscape
Financial Services
Pillar
Credit Suisse
Add to my slides
Remove from favorites
Slide contains multiple structured lists categorizing various services like Diligence, Performance Improvement, Exit Support. Clear headings and subheadings organize the services within each category.
Investment Analysis
Professional Services
This slide presents Alvarez & Marsal's diverse service offerings across the investment lifecycle, categorized into stages such as Diligence, Performance Improvement, and Exit Support, detailing specific services under each category.
Investment, Lifecycle, Diligence, Performance, Exit
false
Investment Analysis
Professional Services
Table
Alvarez & Marsal
Add to my slides
Remove from favorites
The slide has a central circular diagram surrounded by text. The diagram shows the investment lifecycle stages with icons. To the right, there is a pie chart showing the alternatives portfolio distribution. The design is clean with a white background.
Strategic Planning
Financial Services
This slide outlines the investment approach and portfolio diversity of the firm, demonstrating how value is added through different stages of the investment lifecycle. It provides a visual and textual overview of strategic activities and portfolio allocations in various sectors.
investment, lifecycle, value, portfolio, alternatives, strategy, diagram, pie chart
false
Strategic Planning
Financial Services
Mixed Chart
Morgan Stanley
Add to my slides
Remove from favorites
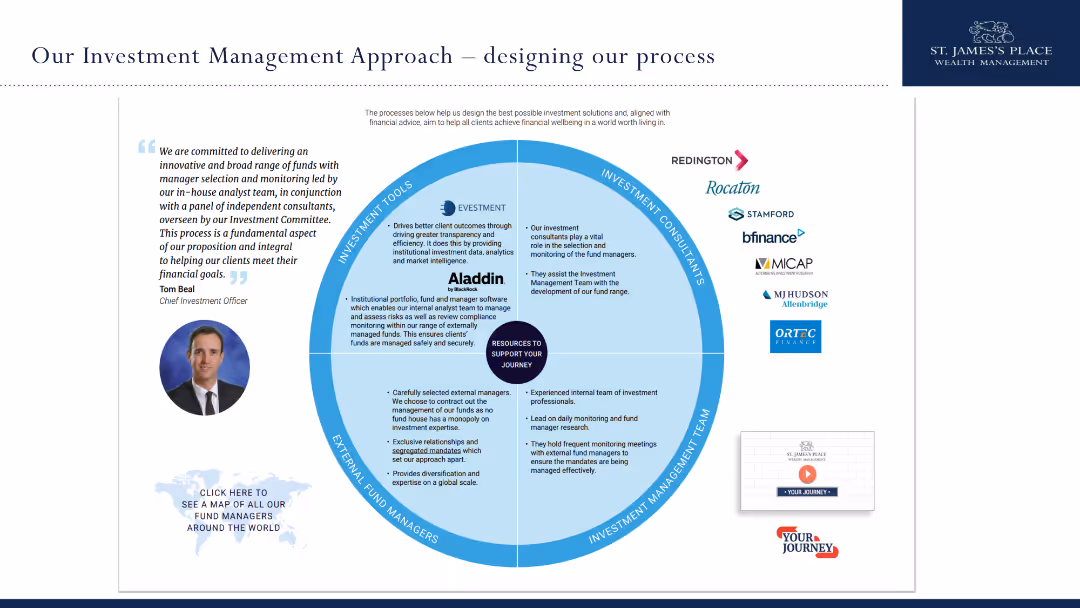
The slide has a circular diagram showing the different components of the investment management approach at St. James's Place.
Strategic Planning
Financial Services
It details the investment management process at St. James's Place, including tools, consultants, teams, and managers that contribute to delivering client financial goals.
investment, management, approach, St. James's Place, process
false
Strategic Planning
Financial Services
Diagram
Deloitte
Add to my slides
Remove from favorites
This slide consists of column charts showing assets under supervision over a five-year period, and long-term fee-based net inflows. The graphics are complemented by bullet points outlining key figures and statements.
Financial Performance
Financial Services
It shows the growth of assets under supervision and long-term fee-based net inflows, indicating a strategic focus on balancing growth through various investment management divisions.
Investment Management, Assets, Growth, Fee-Based, Net Inflows, GSAM, PWM, Ayco, Balanced Growth, Client Coverage
false
Financial Performance
Financial Services
Multiple Chart
Goldman Sachs
Add to my slides
Remove from favorites
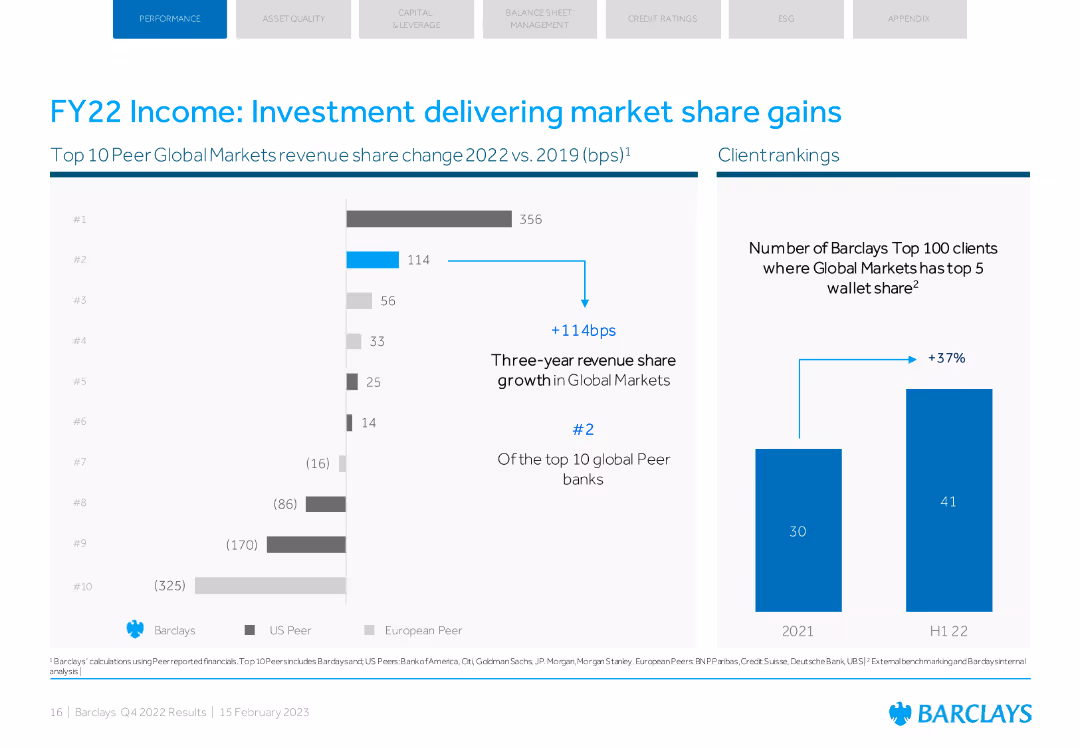
Column chart and bar chart showing market share changes and client rankings in Global Markets.
Market Analysis and Trends
Financial Services
This slide highlights Barclays' market share gains and client rankings in Global Markets for FY22.
investment, market share, gains, Global Markets, client rankings
false
Market Analysis and Trends
Financial Services
Multiple Chart
Barclays
Add to my slides
Remove from favorites
The slide consists of headings with icons and a mix of column and dot ranking charts. It communicates the company's initiatives in infrastructure, workflow automation, organization agility, and market structure. The color scheme is a professional blue and white.
Technology and Digital Transformation
Financial Services
JPMorgan Chase's slide communicates investments in infrastructure, automation, agility, and market structure to lead in new market developments, with an emphasis on technology in trading. Suitable for discussions on technology strategy, market innovation, and future investment directions in electronic trading platforms and protocols.
Investment, Market Structure, Electronic Trading, Infrastructure, Automation, Agility, FICC Platform, Equities Revenue, Innovation
false
Technology and Digital Transformation
Financial Services
Multiple Chart
JP Morgan
Add to my slides
Remove from favorites
The slide contains text with bullet points outlining the investment case, recent updates, and catalysts for MercadoLibre, along with a table and line chart.
Client Case Studies
Retail & E-commerce
This slide presents a detailed investment case for MercadoLibre, including long-term thesis, recent performance updates, and growth catalysts.
Investment, MercadoLibre, E-commerce, Client Case, Performance, Updates, Catalysts, Financials, Market, Growth
false
Client Case Studies
Retail & E-commerce
Mixed Chart
Morgan Stanley
Add to my slides
Remove from favorites
The slide contains a bar chart showing various methods of making investments, such as in person, online through a bank, and online trading platforms.
Strategic Planning
Financial Services
This slide presents data on the methods used by respondents to make investments, highlighting differences in preferred channels across age groups.
investment, methods, channels, age, preferences
false
Strategic Planning
Financial Services
Mixed Chart
IPSOS
Add to my slides
Remove from favorites
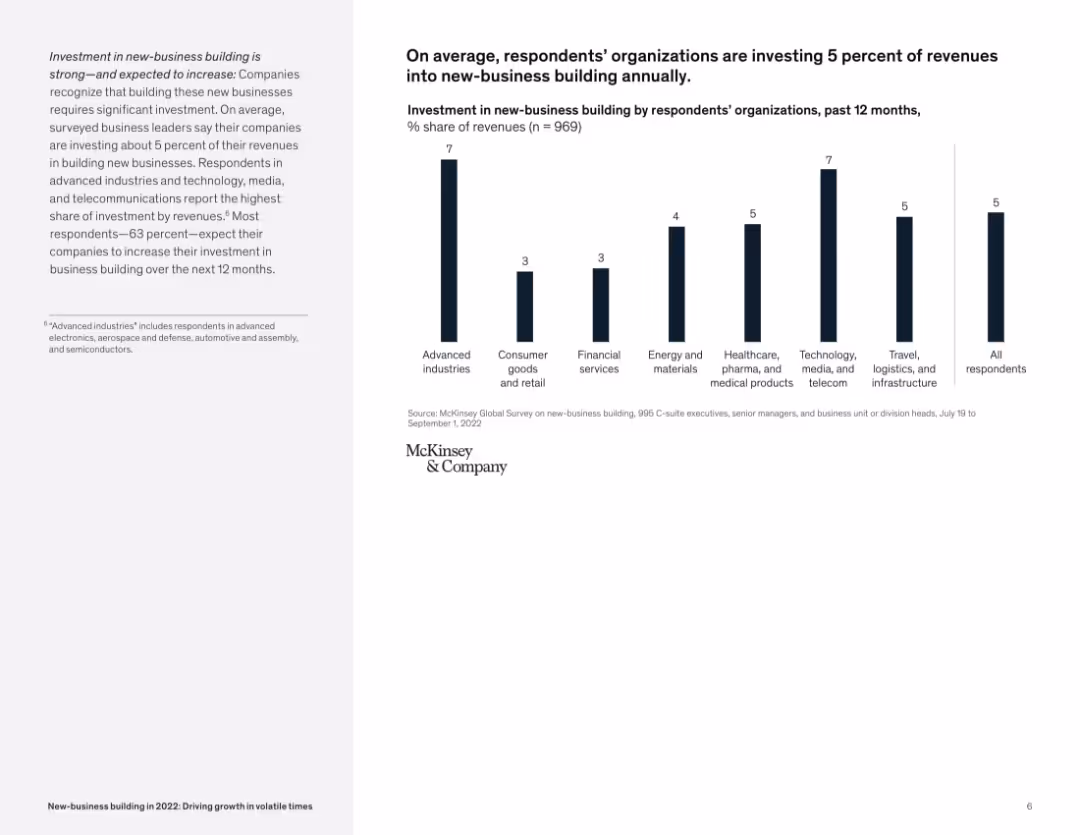
Clean bar chart showing % of revenue invested by industry; left-side summary text contextualizes findings.
Investment Analysis
Professional Services
The slide summarizes survey findings that companies are investing 5% of their revenues into new-business building, with advanced industries and technology sectors investing the most. Most companies also expect to increase investments.
investment, new-business, revenue allocation, survey, industry trends, business building
false
Investment Analysis
Professional Services
Mixed Chart
McKinsey
Add to my slides
Remove from favorites
Features a column chart presenting the Net Promoter Score (NPS) for France as an investment location, with commentary from executives.
Investment Analysis
Professional Services
This slide assesses the willingness of American investors to recommend France as an investment destination, including insights from corporate leaders.
Investment, NPS, Business Climate, Regulatory Challenges, CSR
false
Investment Analysis
Professional Services
Mixed Chart
Bain
Add to my slides
Remove from favorites
Features three distinct sections with icons and images corresponding to the content, using a clean and structured layout for clear communication.
Strategic Planning
Environmental Services & Sustainability
Continues the executive summary by detailing significant investment opportunities in forest conservation, the built environment, and sustainable farming in SEA.
Investment opportunities, forest conservation, built environment, sustainable farming, SEA
false
Strategic Planning
Environmental Services & Sustainability
Text Only
Bain
Add to my slides
Remove from favorites
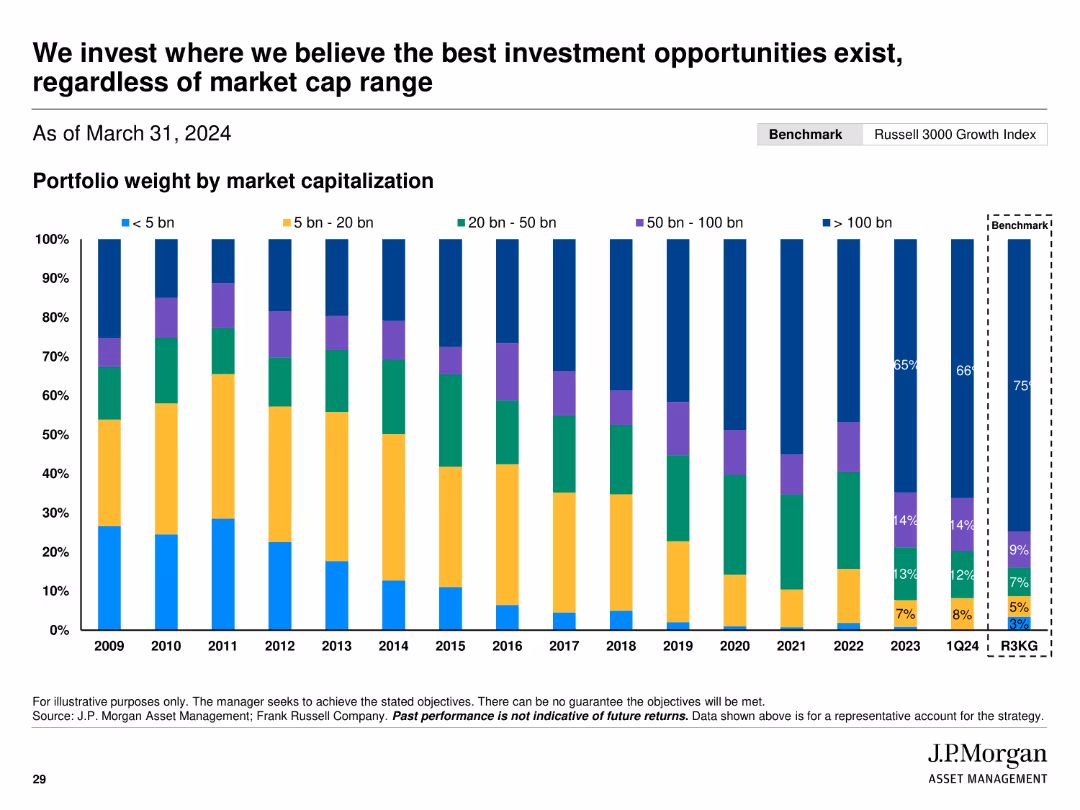
Shows a stacked bar chart depicting portfolio weight by market capitalization over time, compared to the benchmark.
Investment Analysis
Financial Services
Displays J.P. Morgan’s investment strategy focusing on market cap agnostic opportunities, illustrating portfolio weight distribution across different market cap ranges.
investment, opportunities, market cap, portfolio, weight, bar chart, benchmark
false
Investment Analysis
Financial Services
Single Chart
JP Morgan
Add to my slides
Remove from favorites
This slide features a structured overview with icons and brief descriptions of various investment themes across sectors like renewables, built environment, and electric mobility.
Investment Analysis
Financial Services
Provides insights into accessible thematic investment opportunities within sectors like forest conservation, sustainable farming, and renewables, highlighting the potential for early and mature capital investments.
investment opportunities, renewables, thematic sectors, capital investment
false
Investment Analysis
Financial Services
Header Horizontal
Bain
Add to my slides
Remove from favorites
The slide showcases a series of images representing different sectors like forestry, sustainable farming, and renewable energy, each associated with specific pages for detailed discussion. It's designed to visually segment and highlight diverse investment areas.
Market Analysis and Trends
Environmental Services & Sustainability
Focuses on detailing specific investment opportunities within prioritized sectors like forest conservation, sustainable agriculture, and renewable energy, providing a gateway to more in-depth analysis and discussions on how to achieve full potential in these areas.
investment opportunities, sectors, sustainability, detailed analysis
false
Market Analysis and Trends
Environmental Services & Sustainability
Agenda
Bain
Add to my slides
Remove from favorites
Features a pie chart showing the origin of all investment projects into Europe in 2021, with slices representing different countries' contributions.
Market Analysis and Trends
Financial Services
This slide illustrates the contribution of various countries to investment projects in Europe in 2021, showing the geographical distribution of investments.
investment origin, Europe, 2021, pie chart, countries
false
Market Analysis and Trends
Financial Services
Multiple Chart
EY
Add to my slides
Remove from favorites
Displays a pie chart representing the origin of investment projects into the UK in 2021, with segments for different contributing countries.
Market Analysis and Trends
Financial Services
This slide highlights the countries contributing to investment projects in the UK in 2021, providing insight into international investment sources.
investment origin, UK, 2021, pie chart, countries
false
Market Analysis and Trends
Financial Services
Mixed Chart
EY
Add to my slides
Remove from favorites
The slide includes a line chart depicting the trend in capital importation from 2015 to Q3 2023, with separate lines for capital importation, FPI, and FDI. Below the chart are key insights and outlooks regarding the cautious investment outlook for 2024.
Investment Analysis
Financial Services
The slide discusses the cautious investment outlook for 2024, emphasizing the impact of ongoing fiscal and monetary reforms. It provides a historical perspective on capital importation trends and forecasts future investment scenarios.
investment outlook, capital importation, fiscal reforms, monetary reforms, investment trends
false
Investment Analysis
Financial Services
Mixed Chart
PwC/Strategy&
Add to my slides
Remove from favorites
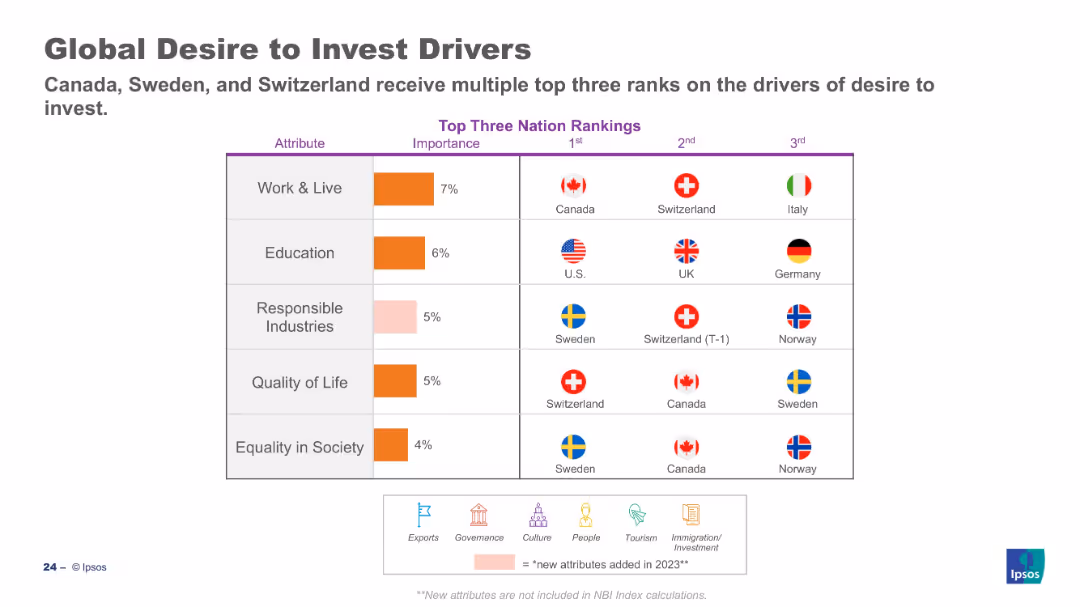
Table ranks top countries for each investment driver; importance column on left.
Customer and Market Segmentation
Professional Services
This slide showcases which countries are perceived most favorably for investment attributes like work & live, education, and quality of life. Canada, Sweden, and Switzerland rank highly across multiple categories, highlighting their strong international appeal.
investment, perception, countries, Ipsos, drivers, ranking, global sentiment, attributes
false
Customer and Market Segmentation
Professional Services
Mixed Chart
IPSOS
Add to my slides
Remove from favorites
A bar chart showing the perception of Europe’s attractiveness over three years, with different colors representing varying degrees of increase or decrease.
Market Analysis and Trends
Financial Services
The slide presents survey results on the perceived attractiveness of Europe for investment over a three-year period, indicating overall stability despite challenges.
investment, perception, Europe, survey, stability
false
Market Analysis and Trends
Financial Services
Single Chart
EY
Add to my slides
Remove from favorites
This slide features pie charts and a growth opportunity column chart. It has green arrows for performance indicators and growth projections, utilizing blue and teal colors for the design elements.
Market Analysis and Trends
Financial Services
The slide discusses investment performance with a focus on equity, fixed income, and multi-asset solutions, outlining growth potential and market share opportunities in asset management.
Investment Performance, Growth Opportunity, Equity, Fixed Income, Multi-Asset, Asset Management, Market Share, Scaling
false
Market Analysis and Trends
Financial Services
Multiple Chart
JP Morgan
Add to my slides
Remove from favorites
A series of pie charts represent the percentage of JPMAM mutual fund AUM over peers across different time frames. The slide has a blue and gold color theme and a reference note at the bottom.
Financial Performance
Financial Services
The slide compares JPMAM’s mutual fund performance against peers over different durations, highlighting the company's strong investment performance over time.
investment performance, mutual funds, AUM, JPMAM, pie charts, long-term, financial comparison
false
Financial Performance
Financial Services
Multiple Chart
JP Morgan
Add to my slides
Remove from favorites
This slide contains three vertical column charts comparing investment performance, new talent, new clients, and asset flows over time, marked by increases and records. Notably, each chart is color-coded to represent different data points with annotations highlighting significant metrics.
Financial Performance
Financial Services
Demonstrates JPMC's growth formula through improved investment performance, doubling new talent, increased new clients, and significant asset flows, indicating a strategic focus on performance and market expansion.
investment performance, talent acquisition, client growth, asset flows, JPMC, financial analysis, market growth, strategy
false
Financial Performance
Financial Services
Multiple Chart
JP Morgan
Add to my slides
Remove from favorites
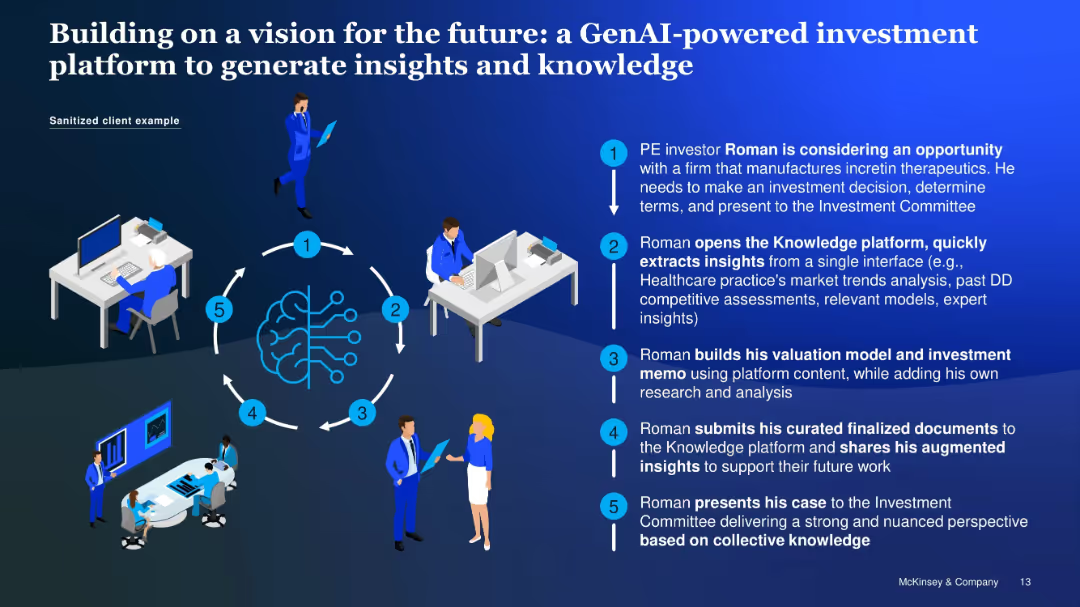
Stepwise process illustration with numbered callouts and stylized office figures
Technology and Digital Transformation
Financial Services
Demonstrates how a private equity investor uses a GenAI platform to extract insights, generate investment models, and collaborate with the investment committee for a data-driven, knowledge-backed decision-making process.
investment platform, GenAI workflow, private equity, insights, modeling
false
Technology and Digital Transformation
Financial Services
Vertical Flow
McKinsey
Add to my slides
Remove from favorites
A world map pinpointing locations with a legend indicating a $100bn alternatives net inflows target.
Investment Analysis
Financial Services
Outlines Goldman Sachs' aim to scale its alternative investment platform, with a global long-term target of $100 billion in net inflows.
Investment Platform, Global Targets, Net Inflows, Alternative Investments, Goldman Sachs
false
Investment Analysis
Financial Services
Graphic
Goldman Sachs
Add to my slides
Remove from favorites
An advanced layout featuring a large pie chart illustrating the investment portfolio composition, with detailed textual information to the right. The slide utilizes shades of blue and gray for the chart, with distinct sections indicating types of investments, such as Agency CMBS and Non-agency CMBS.
Financial Performance
Financial Services
The slide showcases the company's investment portfolio composition, highlighting the robustness and ratings of its CMBS portfolio. It is geared toward investors or stakeholders interested in understanding the company's investment strategies and risk management approaches.
Investment Portfolio, CMBS, AAA-Rated, Asset Management, Risk Management, Financial Assets, Agency, Non-Agency
false
Financial Performance
Financial Services
Mixed Chart
Morgan Stanley
Add to my slides
Remove from favorites
A simple yet informative matrix layout presents the investment positioning with icons indicating trends. Current views on asset classes are provided on the right, adding depth to the analysis.
Risk Assessment and Management
Financial Services
The slide showcases the credit team's current investment positions and outlook, useful for informing strategic asset allocation. It includes a matrix for comparative analysis of different investment classes, intended to guide portfolio adjustments.
Investment, Positioning, Credit, Risk
false
Risk Assessment and Management
Financial Services
Table
Morgan Stanley
Add to my slides
Remove from favorites
Presents a column chart tracking investor priorities for financially healthy companies over time, shown in a green gradient, highlighting shifts in investor focus during the COVID-19 pandemic.
Investment Analysis
Financial Services
Details the changing investment priorities among investors, particularly the balance between long-term growth and short-term performance expectations in response to global economic shifts.
investment priorities, COVID-19, long-term growth, short-term performance
false
Investment Analysis
Financial Services
Multiple Chart
BCG
Add to my slides
Remove from favorites
This slide features a column chart showing the priority areas for investment in the financial services industry, such as customer experiences, cybersecurity, and core technology transformation. A brief text description is included.
Customer and Market Segmentation
Professional Services
The slide highlights investment priorities for CEOs in the financial services industry, emphasizing the shift from customer experiences to outcomes, and identifying key areas for future growth.
Investment priorities, financial services, customer experiences, cybersecurity, technology transformation
false
Customer and Market Segmentation
Professional Services
Mixed Chart
PwC/Strategy&
Add to my slides
Remove from favorites
Previous
Next
You don't have any favorites yet.
Please wait loading your favorites slides...
Create a FREE account to continue browsing
Receive Instant Access to 1,000+ slides from companies like McKinsey, Google, and Goldman Sachs
First Name
Last Name
Email
Password
I agree to all
Terms & Privacy Policy
Thank you! Your submission has been received!
Oops! Something went wrong while submitting the form.
Have an account?
Sign in
Upgrade to PRO to Save slides
Advanced Search and Filters
Access to 15,000+ slides
Access to Category Pages
Save/Bookmark Slides
PowerPoint Template Library
Pick a Plan
MONTHLY
$12/month
Billed every month, Cancel anytime.
YEARLY
$9/year
Billed $108 annually, Cancel anytime.
Checkout for $12/month
Checkout for $108/yr
Secured by Stripe | AES-256 bit encryption