My Account
My Slides
Search by Category
Templates
Leave Feedback
Login
Logout
Get Started
Browse all Slides
Browse all Slides
Create a FREE Account
Instant access to 1,000+ real slides from top companies like McKinsey, BCG, Goldman Sachs, Google and many more!
First Name
Last Name
Email
Password
I agree to all
Terms & Privacy Policy
Thank you! Your submission has been received!
Oops! Something went wrong while submitting the form.
Have an account?
Sign in
📢 Ready to start building slides? Check out our new template library
VIEW TEMPLATES
Welcome,
Welcome
PRO
Show Featured Only
Checkbox 8
Companies
Mckinsey
Bain
BCG
EY
Deloitte
Accenture
PwC/Strategy&
JP Morgan
Goldman Sachs
Morgan Stanley
Citigroup
Deutsche Bank
Barclays
LEK
KPMG
Kearney
Oliver Wyman
Booz Allen Hamilton
Gartner
IPSOS
Nielsen
Slide type
Text Only
Linear Flow
Vertical Flow
Single Chart
Header Horizontal
Mixed Chart
Header Vertical
Pillar
Multiple Chart
Graphic
Agenda
Title
Table
Framework
Industry
Technology & Software
Artificial Intelligence
Financial Services
Retail & E-commerce
Consumer Goods
Industrial & Manufacturing
Transportation & Logistics
Telecommunications
Real Estate & Construction
Hospitality & Tourism
Professional Services
Education & Training
Media & Entertainment
Agriculture & Food Production
Healthcare & Pharmaceuticals
Environmental Services & Sustainability
Government & Public Sector
Use Case
Mergers and Acquisitions
Performance Metrics and KPIs
Client Case Studies
Competitive Landscape
Corporate Finance and Valuation
Product and Service Analysis
Customer and Market Segmentation
Organizational Structure and Change
Industry Overview
Regulatory and Compliance
Risk Assessment and Management
Investment Analysis
Organizational Structure and Change
Human Resources and Talent Management
Financial Performance
Market Analysis and Trends
Sales and Business Development
Human Resources and Talent Management
Clear all
Thank you! Your submission has been received!
Oops! Something went wrong while submitting the form.
Tag
View slide
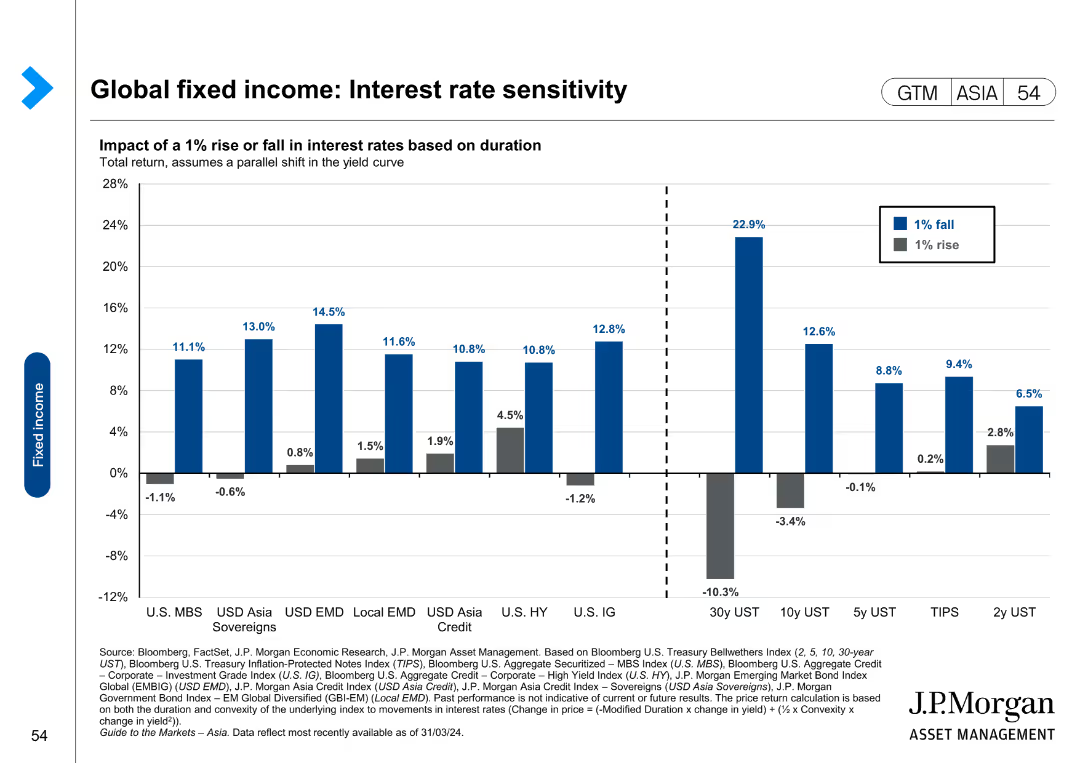
The slide features a bar chart showing the impact of a 1% rise or fall in interest rates on total return across various fixed income categories.
Risk Assessment and Management
Financial Services
This slide analyzes interest rate sensitivity for global fixed income investments, illustrating the impact of interest rate changes on total returns. It is used for risk assessment and management.
Global fixed income, interest rate sensitivity, total return, risk assessment, management
false
Risk Assessment and Management
Financial Services financial-services
Single Chart
JP Morgan
View slide
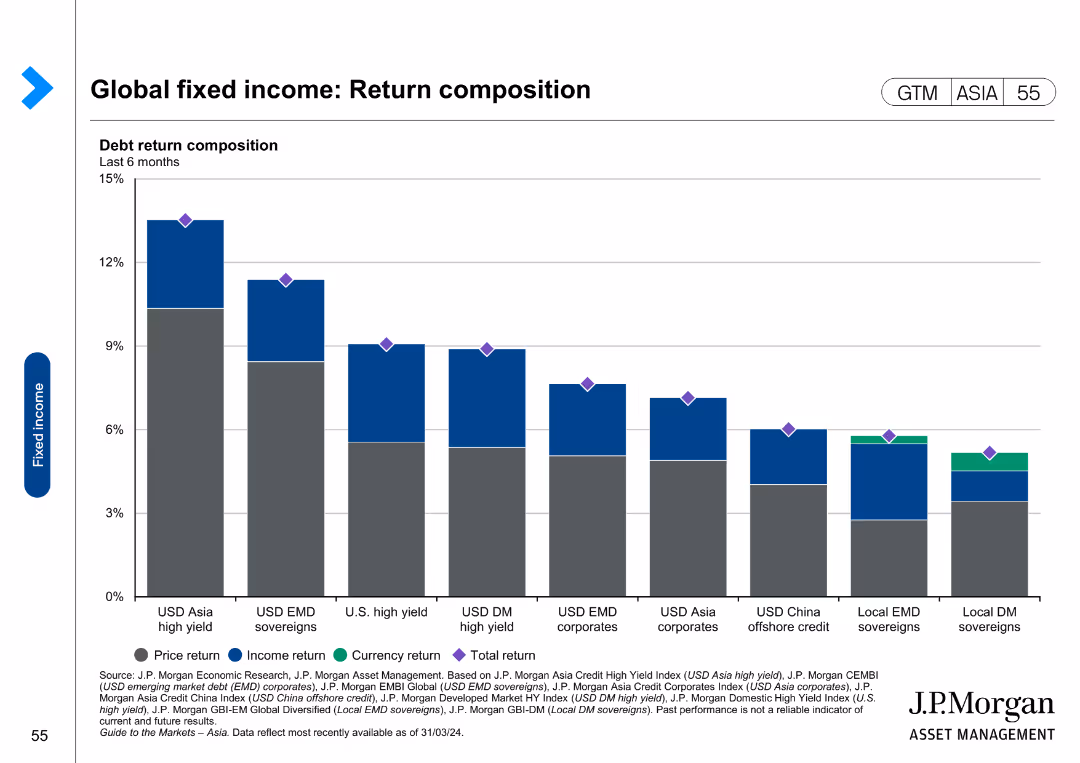
The slide contains a bar chart showing debt return composition for different fixed income categories, divided into price return, income return, and currency return.
Financial Performance
Financial Services
This slide evaluates return composition for global fixed income investments, breaking down returns into price, income, and currency components. It is used for financial performance analysis and investment strategy development.
Global fixed income, return composition, price return, income return, currency return, investment strategy
false
Financial Performance
Financial Services financial-services
Single Chart
JP Morgan
View slide
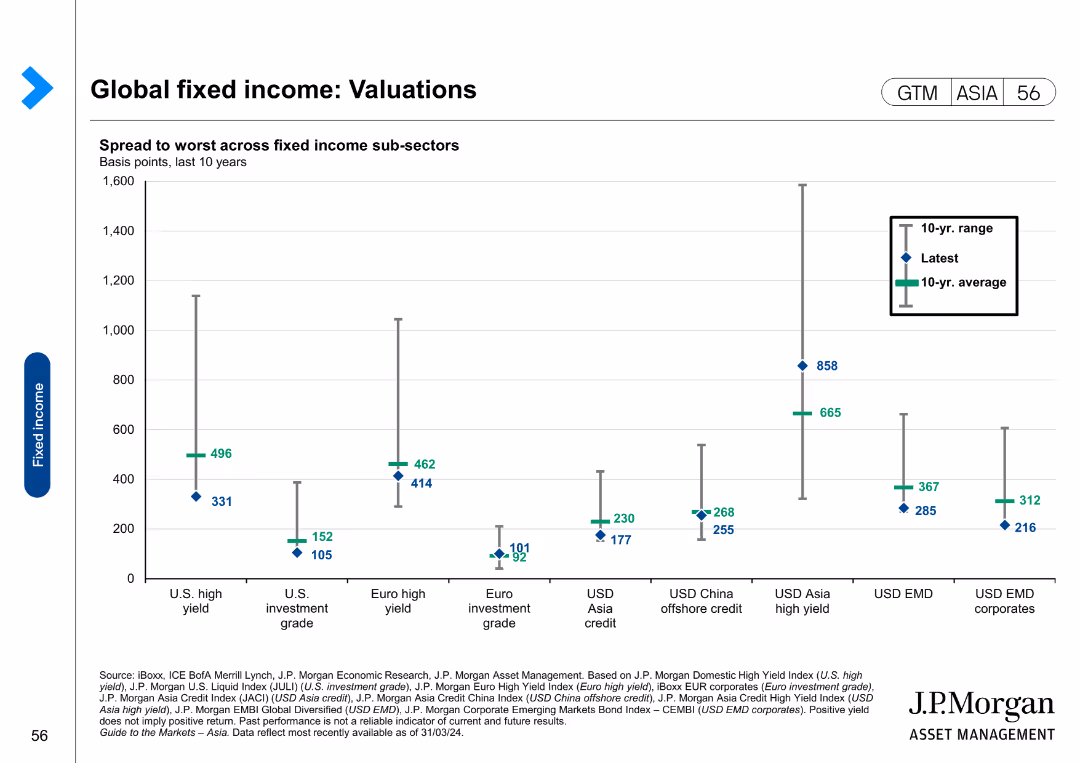
The slide features a scatter plot showing the spread to worst across fixed income sub-sectors over the last 10 years.
Market Analysis and Trends
Financial Services
The slide analyzes valuations in global fixed income markets, focusing on spreads across various sub-sectors. It is used for market analysis and investment decision-making.
Global fixed income, valuations, spreads, sub-sectors, market analysis, investment
false
Market Analysis and Trends
Financial Services financial-services
Single Chart
JP Morgan
View slide
The slide contains a bar chart showing fixed income yields to maturity for different bond categories, divided into developed market government bonds, investment-grade bonds, high yield bonds, and Asia & emerging market bonds.
Financial Performance
Financial Services
This slide provides an overview of global fixed income yields and duration, highlighting yields to maturity for various bond categories. It is used for financial performance evaluation and fixed income strategy planning.
Global fixed income, yields, duration, bonds, investment-grade, high yield, emerging markets
false
Financial Performance
Financial Services financial-services
Multiple Chart
JP Morgan
View slide
The slide features a circular diagram representing global forces with different areas like 'business fragmentation' and 'individualism'. Each segment has brief descriptors and the design is color-coded for clarity.
Strategic Planning
Professional Services
This appendix slide offers a conceptual framework for understanding the forces influencing global business and people management. It associates various global trends with potential impacts on business structures and decision-making, providing a reference point for considering future scenarios in a corporate context.
Global forces, business trends, people management, conceptual framework
false
Strategic Planning
Professional Services professional-services
Framework
PwC/Strategy&
View slide
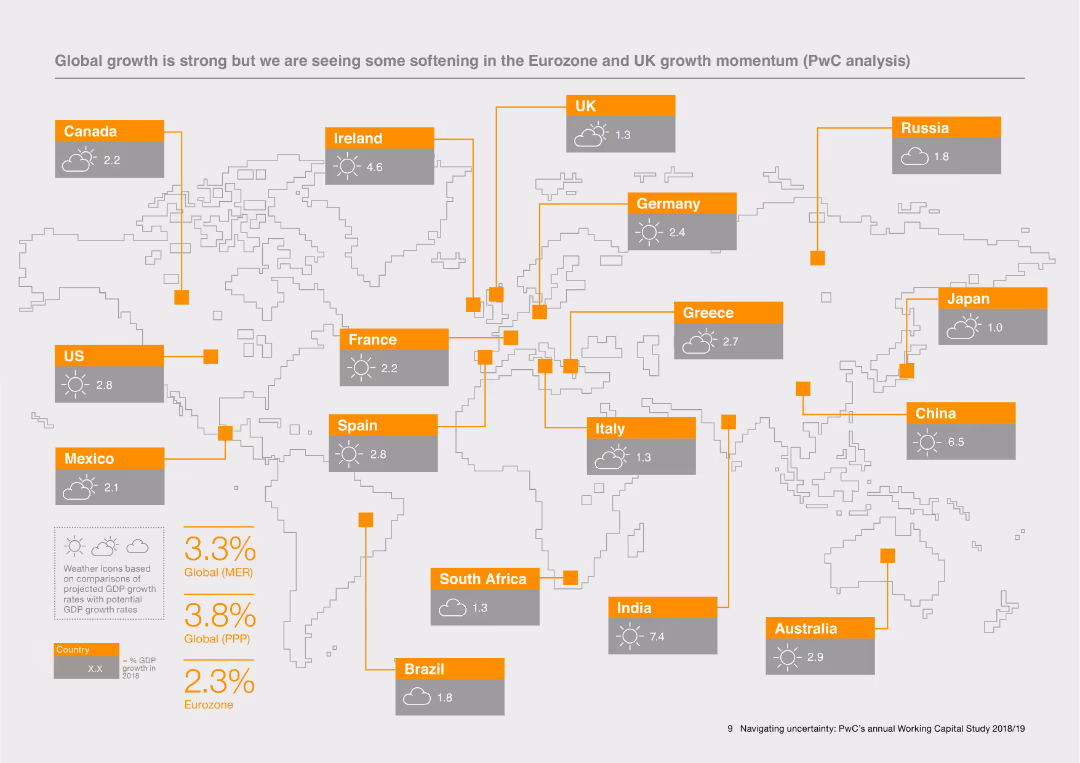
The slide presents a world map with highlighted countries, each showing projected GDP growth rates for 2018. The countries are marked with weather icons indicating economic conditions. An orange color scheme is used for labels and icons, and growth rates are displayed in percentage.
Market Analysis and Trends
Financial Services
This slide provides a visual overview of global GDP growth rates with a focus on the Eurozone and UK. The weather icons indicate economic conditions, while the map and data points highlight the projected growth rates for various countries in 2018.
Global growth, GDP rates, economic conditions, Eurozone, UK, PwC analysis, world map
false
Market Analysis and Trends
Financial Services financial-services
Graphic
PwC/Strategy&
View slide
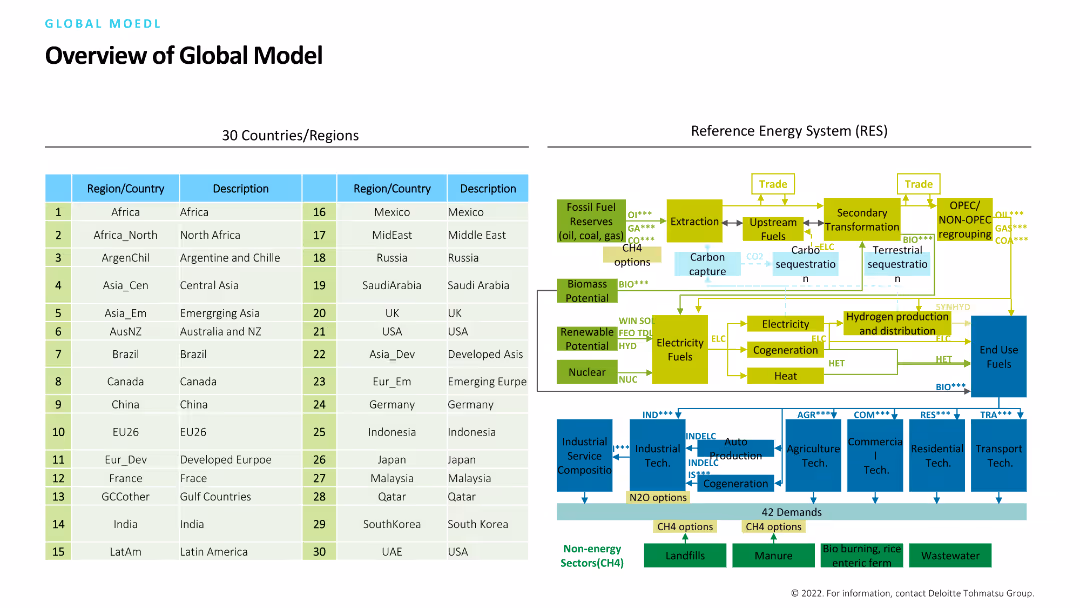
The slide is divided into two sections: a table listing 30 countries/regions with descriptions, and a complex flow diagram illustrating the reference energy system (RES), including fossil fuel reserves, renewable potential, and more.
Strategic Planning
Industrial & Manufacturing
The slide provides a comprehensive overview of a global model, detailing regions and their energy systems. It's intended for strategic planning in the energy and manufacturing sectors, showing resource and energy flows.
Global model, energy system, regions, strategic planning, reference energy system
false
Strategic Planning
Industrial & Manufacturing industrial-and-manufacturing
Header Horizontal
Deloitte
View slide
The slide illustrates global reach with a world map marking the number of bankers and offices, alongside text detailing rankings and service areas in the Americas, EMEA, and APAC regions with a professional and straightforward layout.
Operational Efficiency
Financial Services
This slide underlines the global footprint of Goldman Sachs and its leading position in various banking services, likely used in corporate presentations to showcase operational scale and efficiency to stakeholders or potential partners.
Global presence, banking, M&A, leadership, Goldman Sachs
false
Operational Efficiency
Financial Services financial-services
Graphic
Goldman Sachs
View slide
An updated world map from slide 2933, now indicating growth with more markers and comparative data from 1990 to 2019. Same minimal design but with more data points.
Industry Overview
Financial Services
Showcases significant growth in international presence over 29 years with data on revenues, headcount, and offices to depict expansion success.
Global presence, development, business growth, headcount
false
Industry Overview
Financial Services financial-services
Graphic
Goldman Sachs
View slide
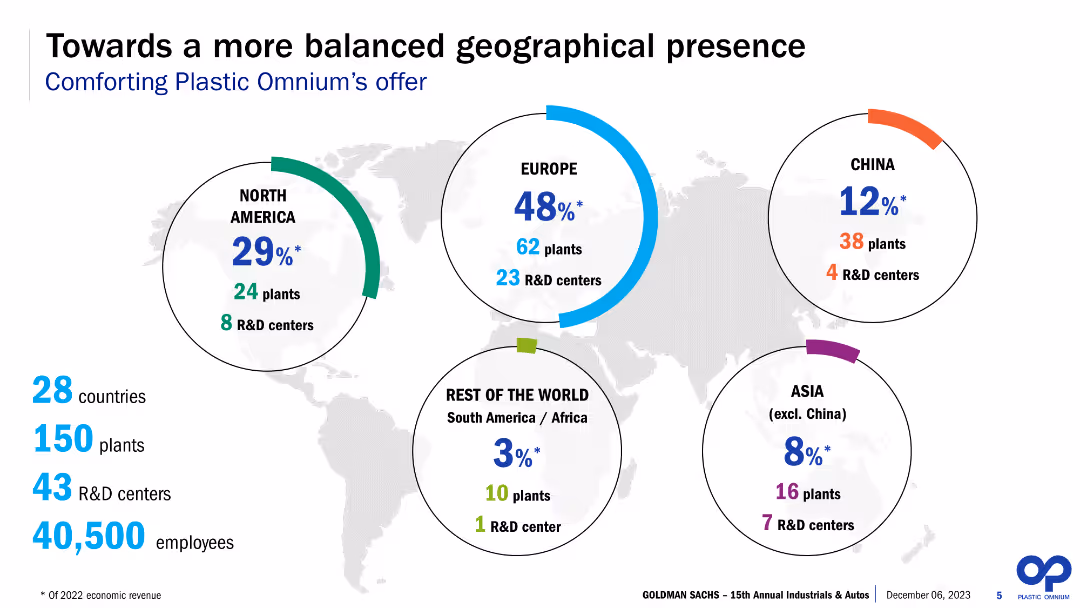
The slide features a world map with circular infographics representing various regions. It includes percentages, numbers of plants, and R&D centers across North America, Europe, China, Asia (excluding China), and the rest of the world. Text and numerical data are prominently displayed.
Strategic Planning
Industrial & Manufacturing
The slide presents Plastic Omnium’s geographical presence with detailed breakdowns of plants and R&D centers across different regions. It highlights the percentage of economic revenue each region represents, aiming to demonstrate the company’s balanced global footprint.
Global presence, plants, R&D centers, revenue, geographical distribution, Plastic Omnium, strategic planning, manufacturing, regional analysis, balanced presence
false
Strategic Planning
Industrial & Manufacturing industrial-and-manufacturing
Multiple Chart
Goldman Sachs
View slide
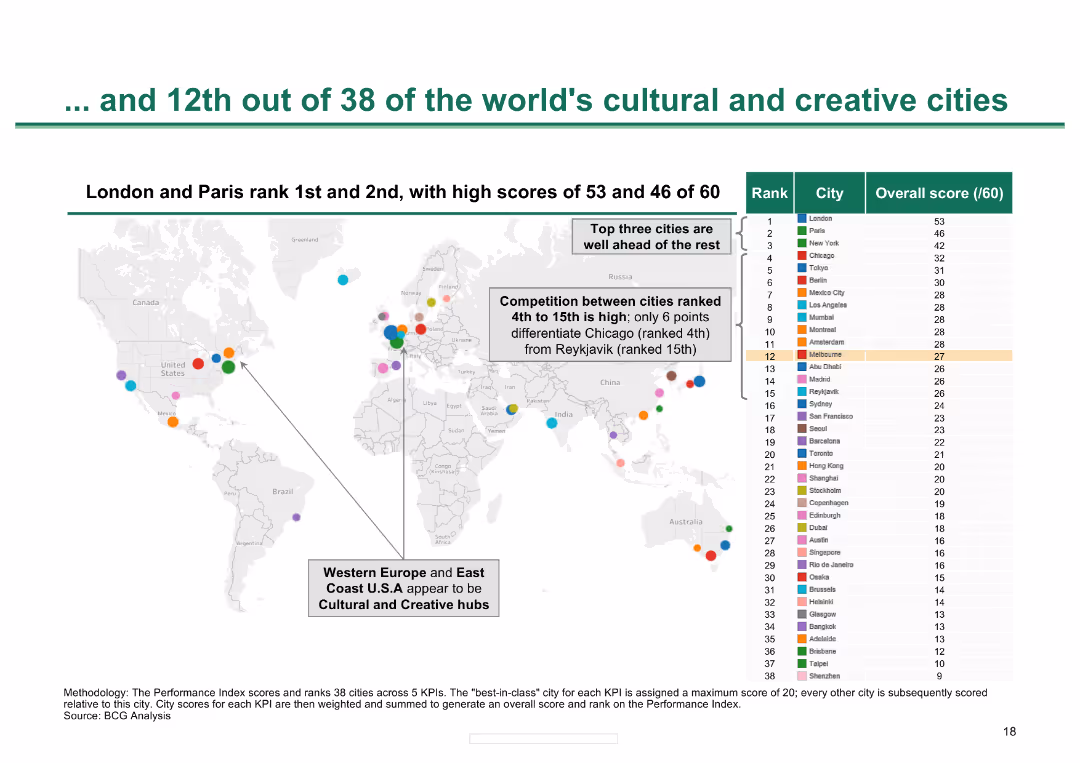
World map with various cities marked, ranking chart on the right; vibrant colors
Market Analysis and Trends
Hospitality & Tourism
Highlights the global ranking of Melbourne among cultural cities, with a focus on competition and scores
Global ranking, cultural cities, competition, world map, performance index
false
Market Analysis and Trends
Hospitality & Tourism hospitality-and-tourism
Graphic
BCG
View slide
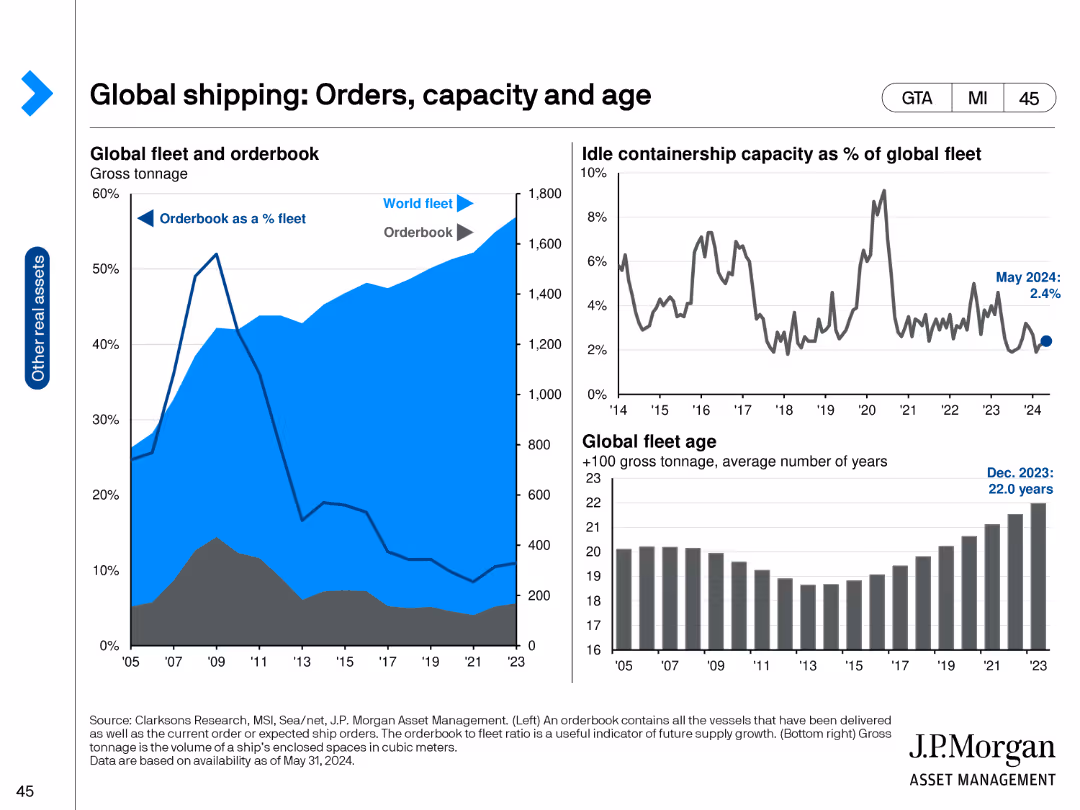
The slide contains three charts: a line chart on the left showing the orderbook as a percentage of the global fleet from 2005 to 2023, a line chart in the middle depicting the idle containership capacity as a percentage of the global fleet from 2014 to 2024, and a bar chart on the right showing the global fleet age from 2005 to 2023.
Market Analysis and Trends
Transportation & Logistics
This slide provides a comprehensive overview of the global shipping industry, focusing on orderbooks, idle capacity, and fleet age. It is intended to highlight the current state and future trends in shipping capacity and fleet management.
Global shipping, orderbook, fleet capacity, containerships, fleet age, shipping trends, maritime industry
false
Market Analysis and Trends
Transportation & Logistics transportation-and-logistics
Multiple Chart
JP Morgan
View slide
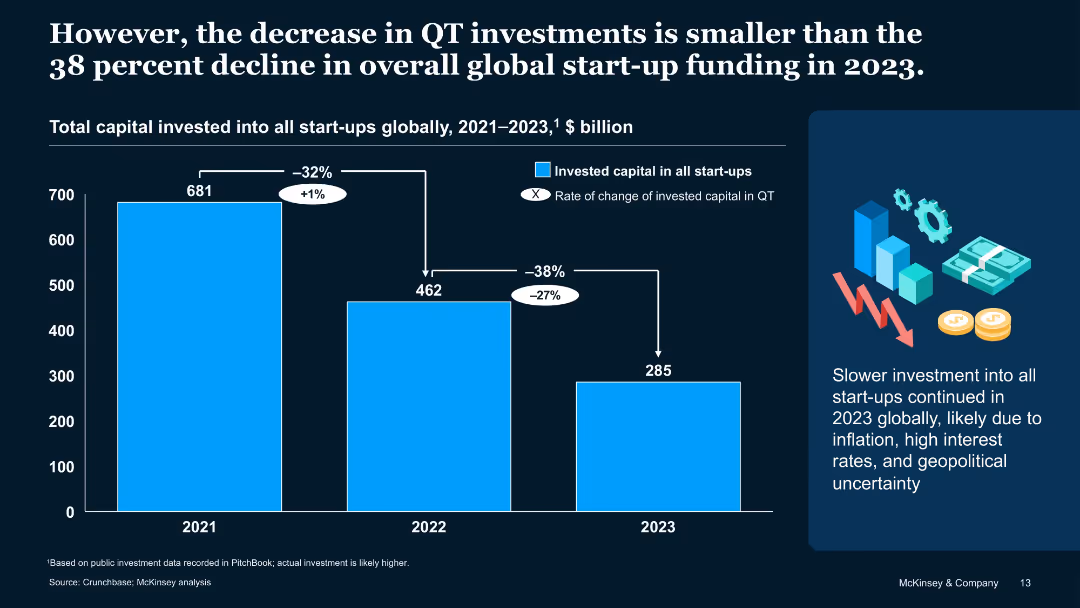
Bar chart comparison with annotation arrows and descriptive sidebar
Investment Analysis
Artificial Intelligence
Compares QT funding decline to broader startup ecosystem, showing QT's 27% drop is lower than the global 38% drop. Discusses macroeconomic reasons for slowdowns like inflation and geopolitical instability.
Global startup trends, QT comparison, 2023 investments, funding decline
false
Investment Analysis
Artificial Intelligence artificial-intelligence
Mixed Chart
McKinsey
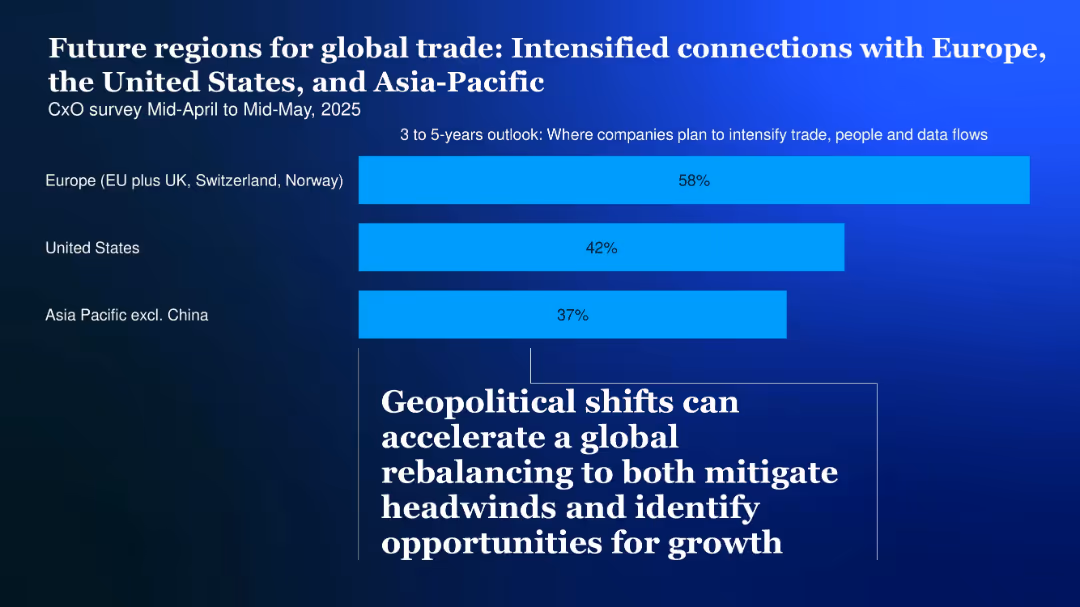
View slide
Bar chart with horizontal bars for three regions on a blue background, with supporting headline and subheadline text
Market Analysis and Trends
Transportation & Logistics
Companies plan to intensify trade, data, and personnel flows in Europe, the US, and Asia Pacific (excl. China), reflecting shifting global trade preferences.
Global trade, CxO, regions, Europe, US, Asia-Pacific, flows, 2025, intensification
false
Market Analysis and Trends
Transportation & Logistics transportation-and-logistics
Single Chart
McKinsey
View slide
A column chart illustrating exports, imports, and FDIs as a share of GDP/domestic investment for various countries. The chart uses different colors to represent exports, imports, and FDIs. Accompanied by bullet points discussing the alignment with China's digital strategy.
Strategic Planning
Technology & Software
Discusses China's influence on global trade and investment through technology standards, highlighting the impact on exports, imports, and foreign direct investments (FDIs).
Global trade, investment, technology standards, China, exports, imports, FDIs, digital strategy, McKinsey report
false
Strategic Planning
Technology & Software technology-and-software
Mixed Chart
EY
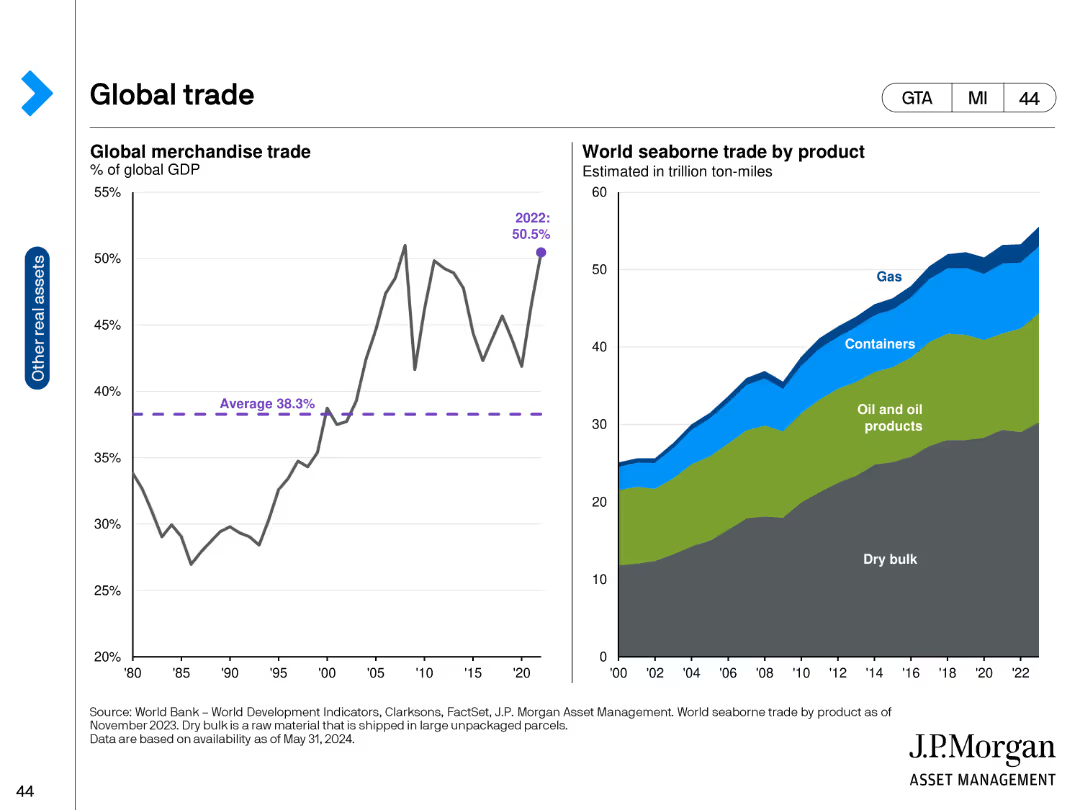
View slide
The slide features two line charts. The left chart shows the global merchandise trade as a percentage of global GDP from 1980 to 2022. The right chart presents the world seaborne trade by product from 2000 to 2022, with different product types represented by distinct colors. The line charts provide a clear visual of trade trends over time.
Market Analysis and Trends
Transportation & Logistics
This slide analyzes global trade trends, showing the percentage of global GDP accounted for by merchandise trade and the distribution of seaborne trade by product type. It is useful for understanding global trade dynamics and the relative importance of different goods in international trade.
Global trade, merchandise trade, seaborne trade, GDP, trade trends, international trade, product distribution
false
Market Analysis and Trends
Transportation & Logistics transportation-and-logistics
Multiple Chart
JP Morgan
View slide
This slide has two columns with text on the left and a table on the right. The table uses shades of gray and purple to highlight different temperatures' impacts.
Market Analysis and Trends
Environmental Services & Sustainability
Discusses the key consequences of +1.5°C and +2.0°C global warming by 2100 on various factors such as sea level rise, biodiversity losses, and coral reef decline.
Global warming, ecosystems, biodiversity, sea level, temperature
false
Market Analysis and Trends
Environmental Services & Sustainability environmental-services-and-sustainability
Table
Kearney
View slide
The slide contains a column chart showing the global temperature anomaly from 1900 to 2023 on the left, and a pie chart on the right depicting global greenhouse gas emissions by source in 2019. The column chart has vertical bars representing temperature changes, while the pie chart is color-coded to show different emission sources. Overall layout is balanced with equal emphasis on both charts.
Market Analysis and Trends
Environmental Services & Sustainability
This slide analyzes the historical global temperature anomaly and the distribution of global greenhouse gas emissions by various sources in 2019. It is intended to illustrate the impact of different sectors on climate change and highlight the increasing trend in global temperatures over the years.
Global warming, greenhouse gases, temperature anomaly, emissions, climate change, data visualization, environmental impact
false
Market Analysis and Trends
Environmental Services & Sustainability environmental-services-and-sustainability
Multiple Chart
JP Morgan
View slide
Features a world map background with key details on global presence and expertise areas in transaction advisory highlighted alongside.
Investment Analysis
Professional Services
Highlights the global reach and expertise of Alvarez & Marsal’s Transaction Advisory Group, focusing on financial and tax diligence and industry specialization.
Global, Advisory, Transaction, Financial, Tax
false
Investment Analysis
Professional Services professional-services
Linear Flow
Alvarez & Marsal
View slide
A world map colored in shades of blue indicating the percentage of activities that can be automated in different regions, accompanied by a pie chart showing economic figures for key regions.
Market Analysis and Trends
Industrial & Manufacturing
Analyzes the potential impact of automation globally, presenting the percentage of activities that can be automated by region and the economic impact in terms of total full-time equivalents (FTEs) and dollars.
Global, Automation, Economy, Impact, Regions
false
Market Analysis and Trends
Industrial & Manufacturing industrial-and-manufacturing
Multiple Chart
McKinsey
View slide
The slide presents a world map with circular diagrams illustrating the geographical distribution of company assets, alongside statistical information in bullet points and percentage figures. The map uses different colors to represent various regions. Text boxes with additional information about the company's global presence are strategically placed around the map.
Market Analysis and Trends
Industrial & Manufacturing
The slide provides an overview of the company's global presence and balance in geographical distribution, with a focus on Europe, North America, China, and other regions. Key statistics such as the number of plants and R&D centers, along with the percentage of economic revenue per region, are shared. It may serve as an analysis tool for discussing market presence or expansion strategies.
Global, Distribution, Plants, R&D, Geography, Percentages, Map, Industrial, Revenue, Strategy
false
Market Analysis and Trends
Industrial & Manufacturing industrial-and-manufacturing
Multiple Chart
Goldman Sachs
View slide
Text-dominant layout with a column chart showing international revenue growth in blue bars and grey projection bar.
Financial Performance
Financial Services
Highlights JPMorgan Chase & Co.'s approach to serving multinational clients, with a focus on international expansion and the firm's revenue growth from it.
Global, Expertise, Revenue Growth, Multinational, Clients
false
Financial Performance
Financial Services financial-services
Mixed Chart
JP Morgan
View slide
World map with colored countries indicating different growth rates in entertainment and media expenditures from 2019 to 2023.
Market Analysis and Trends
Media & Entertainment
Predicts the growth rates in entertainment and media expenditures globally, with a focus on BRIC and mature markets.
Global, Growth Rate, Entertainment, Media, Expenditures, 2019-2023, BRIC, Mature Markets
false
Market Analysis and Trends
Media & Entertainment media-and-entertainment
Graphic
PwC/Strategy&
View slide
Comprises column chart and textual content for financial data presentation.
Financial Performance
Financial Services
Detailed financial results of FICC and equities, along with net revenues, expenses, and earnings.
Global, Markets, FICC, Equities, Financial, Revenue, Bar Charts, Operating, Earnings, Equity, Analysis
false
Financial Performance
Financial Services financial-services
Mixed Chart
Goldman Sachs
View slide
Contains multiple column charts, a dense table, and textual analysis. The design is consistent with corporate branding, using shades of blue and gray.
Financial Performance
Financial Services
Shows the financial results and market performance for global markets, with a focus on FICC and equities, suitable for financial analysis and market review.
Global, Markets, Financial, Performance, FICC, Equities, Analysis, Review, Results, Market
false
Financial Performance
Financial Services financial-services
Mixed Chart
Goldman Sachs
View slide
A world map highlights key locations with markers. An inset magnifies the Singapore region, showing more detail with labeled yard locations.
Strategic Planning
Energy & Utilities
The slide demonstrates Seatruim's global presence, highlighting its worldwide yards and the strategic position of Singapore in the company's operations. It could be used to emphasize the company's expansive global operations and strategic locations.
Global, Operations, Reach, Yards, Singapore
false
Strategic Planning
Energy & Utilities energy-and-utilities
Graphic
Morgan Stanley
View slide
Color-coded mekko chart representing global spend on various services like professional, financial, and construction. Each service type is highlighted with its spend in trillions, some sections marked for requiring more active governance.
Market Analysis and Trends
Professional Services
Explores global expenditure on different services, emphasizing areas like professional and financial services with significant spending, and noting sectors needing active governance like construction.
Global, Services, Spend, Analysis, Governance
false
Market Analysis and Trends
Professional Services professional-services
Single Chart
Kearney
View slide
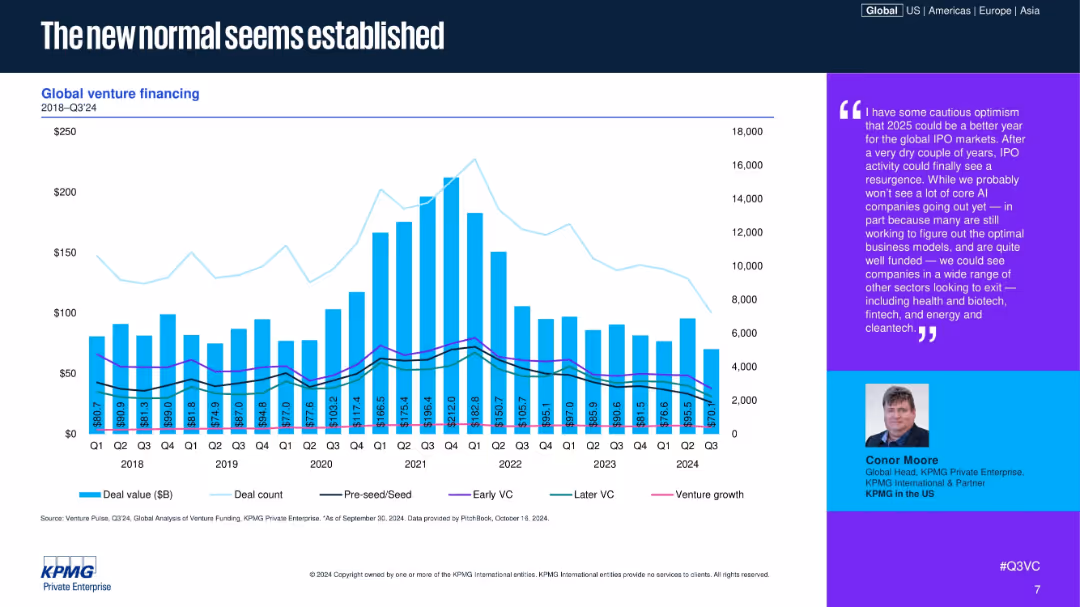
A single global bar and line chart tracking deal value, count, and deal stages in venture funding.
Market Analysis and Trends
Financial Services
The chart covers global venture funding from 2018 to Q3 2024, showing a peak around 2021 followed by normalization. The breakdown includes Pre-seed to Venture Growth, indicating stabilizing patterns in deal count and investment level.
Global, Venture, VC, Funding, Trends, Normalization, Pre-seed
false
Market Analysis and Trends
Financial Services financial-services
Mixed Chart
KPMG
View slide
The slide includes a world map highlighting key locations, regional split percentages, and a summary table with the number of partners, consultants, experts, and hubs.
Human Resources and Talent Management
Industrial & Manufacturing
This slide outlines the global presence of a community of metals experts, detailing the regional distribution of expertise and key core locations.
Global, metals experts, regional, distribution, organizational, community, presence, expertise, locations
false
Human Resources and Talent Management
Industrial & Manufacturing industrial-and-manufacturing
Multiple Chart
BCG
View slide
The slide has two sections: the left side contains a detailed text block about the global consumer goods industry with a circular infographic. The right side discusses emerging consumer markets with an image of people working on a project. Trend assessment and impact on industry bars are included.
Industry Overview
Consumer Goods
Provides an overview of the global consumer goods industry, discussing the impact of globalization, supply chains, and economic factors. Highlights emerging consumer markets and the opportunities and challenges they present for businesses.
Globalization, Markets, Consumer Goods, Trends, Industry
false
Industry Overview
Consumer Goods consumer-goods
Mixed Chart
Deloitte
Previous
Loading...
Hold On!
We are searching in our database
If nothing, comes up, please try different filters!
Column Chart
Heatmap
Chevron
Org Chart
Infographic
Callouts
Timeline
List
Graphic
Picture
Process Flow
Diagram
Paragraph
Map
Table
Framework
Subtitle
Takeaway Box
Icon
Other Chart
Radar Chart
Waterfall Chart
Mekko Chart
Pie Chart
Scatter Plot
Line Chart
Bar chart
Bullet points
Create a FREE account to continue browsing
Receive Instant Access to 1,000+ slides from companies like McKinsey, Google, and Goldman Sachs
First Name
Last Name
Email
Password
I agree to all
Terms & Privacy Policy
Thank you! Your submission has been received!
Oops! Something went wrong while submitting the form.
Have an account?
Sign in
Upgrade to PRO to Save slides
Advanced Search and Filters
Access to 15,000+ slides
Access to Category Pages
Save/Bookmark Slides
PowerPoint Template Library
Pick a Plan
MONTHLY
$12/month
Billed every month, Cancel anytime.
YEARLY
$9/year
Billed $108 annually, Cancel anytime.
Checkout for $12/month
Checkout for $108/yr
Secured by Stripe | AES-256 bit encryption