My Account
My Slides
Search by Category
Templates
Leave Feedback
Login
Logout
Get Started
Browse all Slides
Browse all Slides
Create a FREE Account
Instant access to 1,000+ real slides from top companies like McKinsey, BCG, Goldman Sachs, Google and many more!
First Name
Last Name
Email
Password
I agree to all
Terms & Privacy Policy
Thank you! Your submission has been received!
Oops! Something went wrong while submitting the form.
Have an account?
Sign in
📢 Ready to start building slides? Check out our new template library
VIEW TEMPLATES
Welcome,
Welcome
PRO
Show Featured Only
Checkbox 8
Companies
Mckinsey
Bain
BCG
EY
Deloitte
Accenture
PwC/Strategy&
JP Morgan
Goldman Sachs
Morgan Stanley
Citigroup
Deutsche Bank
Barclays
LEK
KPMG
Kearney
Oliver Wyman
Booz Allen Hamilton
Gartner
IPSOS
Nielsen
Slide type
Text Only
Linear Flow
Vertical Flow
Single Chart
Header Horizontal
Mixed Chart
Header Vertical
Pillar
Multiple Chart
Graphic
Agenda
Title
Table
Framework
Industry
Technology & Software
Artificial Intelligence
Financial Services
Retail & E-commerce
Consumer Goods
Industrial & Manufacturing
Transportation & Logistics
Telecommunications
Real Estate & Construction
Hospitality & Tourism
Professional Services
Education & Training
Media & Entertainment
Agriculture & Food Production
Healthcare & Pharmaceuticals
Environmental Services & Sustainability
Government & Public Sector
Use Case
Mergers and Acquisitions
Performance Metrics and KPIs
Client Case Studies
Competitive Landscape
Corporate Finance and Valuation
Product and Service Analysis
Customer and Market Segmentation
Organizational Structure and Change
Industry Overview
Regulatory and Compliance
Risk Assessment and Management
Investment Analysis
Organizational Structure and Change
Human Resources and Talent Management
Financial Performance
Market Analysis and Trends
Sales and Business Development
Human Resources and Talent Management
Clear all
Thank you! Your submission has been received!
Oops! Something went wrong while submitting the form.
Tag
View slide
Two scatter plots: one comparing Trade Openness Index to years until 25% adoption in the US, and the other relating GII to internet adoption rates. Text discusses the influence of globalization on adoption rates.
Technology and Digital Transformation
Technology & Software
The slide examines the relationship between globalization, network effects, and technology adoption. It highlights how higher trade openness and innovation indices correlate with faster technology adoption, emphasizing the role of global interactions and network effects in accelerating the diffusion of innovations.
Globalization, Network Effects, Adoption, Trade Openness Index
false
Technology and Digital Transformation
Technology & Software technology-and-software
Multiple Chart
Roland Berger
View slide
Includes a world map with trade corridors and a list of cross-border needs with accompanying icons. Blue and grey color scheme.
Financial Performance
Financial Services
Analyzes the globalization of financial services, showing trade corridors and cross-border market opportunities along with services like payments and foreign exchange.
Globalization, Trade, Financial Services, Market Opportunities, Cross-Border
false
Financial Performance
Financial Services financial-services
Diagram
JP Morgan
View slide
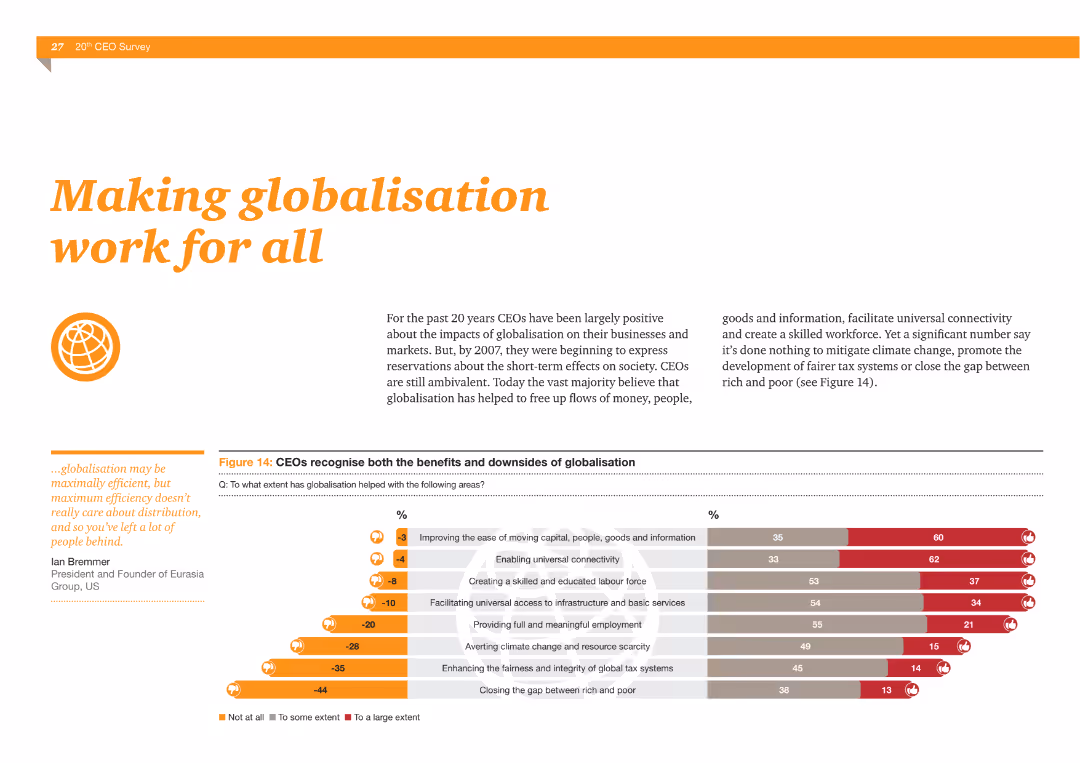
The slide features a column chart showing CEOs' views on the benefits and downsides of globalization, such as improving connectivity and creating a skilled workforce versus failing to address climate change and tax fairness.
Market Analysis and Trends
Financial Services
This slide illustrates CEOs' perspectives on globalization, highlighting both positive impacts like improved connectivity and negative aspects such as failing to address climate change and creating fair tax systems.
Globalization, benefits, downsides, connectivity, skilled workforce, climate change, tax fairness
false
Market Analysis and Trends
Financial Services financial-services
Multiple Chart
PwC/Strategy&
View slide
The slide shows a horizontal bar chart with survey results on globalization and global citizenship feelings across different countries.
Market Analysis and Trends
Technology & Software
The slide highlights global survey results indicating people's positive attitudes towards globalization and global citizenship.
Globalization, global citizenship, survey, public opinion, international trends
false
Market Analysis and Trends
Technology & Software technology-and-software
Mixed Chart
IPSOS
View slide
The slide presents a vertical bar chart showing the percentage of people who agree that globalization is good for their country across various markets.
Market Analysis and Trends
Technology & Software
The slide displays survey data reflecting global opinions on the benefits of globalization in most markets.
Globalization, global opinion, survey, public opinion, market analysis
false
Market Analysis and Trends
Technology & Software technology-and-software
Multiple Chart
IPSOS
View slide
The slide features text, survey results in bar charts, and an image depicting the integration of local and global communication strategies.
Strategic Planning
Professional Services
Explores the balance between global messaging and local execution, emphasizing the importance of local commitment and the autonomy of communication teams.
Glocal strategy, local communication, global strategy, survey results, balance
false
Strategic Planning
Professional Services professional-services
Multiple Chart
IPSOS
View slide
The slide is divided into three sections with headers 'Strategy alignment', 'Personal development', and 'Shared purpose'. Each section has its own icon and a brief explanatory text.
Strategic Planning
Professional Services
The slide details a 3-pronged approach to goal setting within an organization, including the alignment of strategy, personal development, and a shared purpose. It is likely used in the context of human resources and organizational strategy sessions.
Goal Setting, Strategy, Personal Development, Organizational
false
Strategic Planning
Professional Services professional-services
Diagram
Kearney
View slide
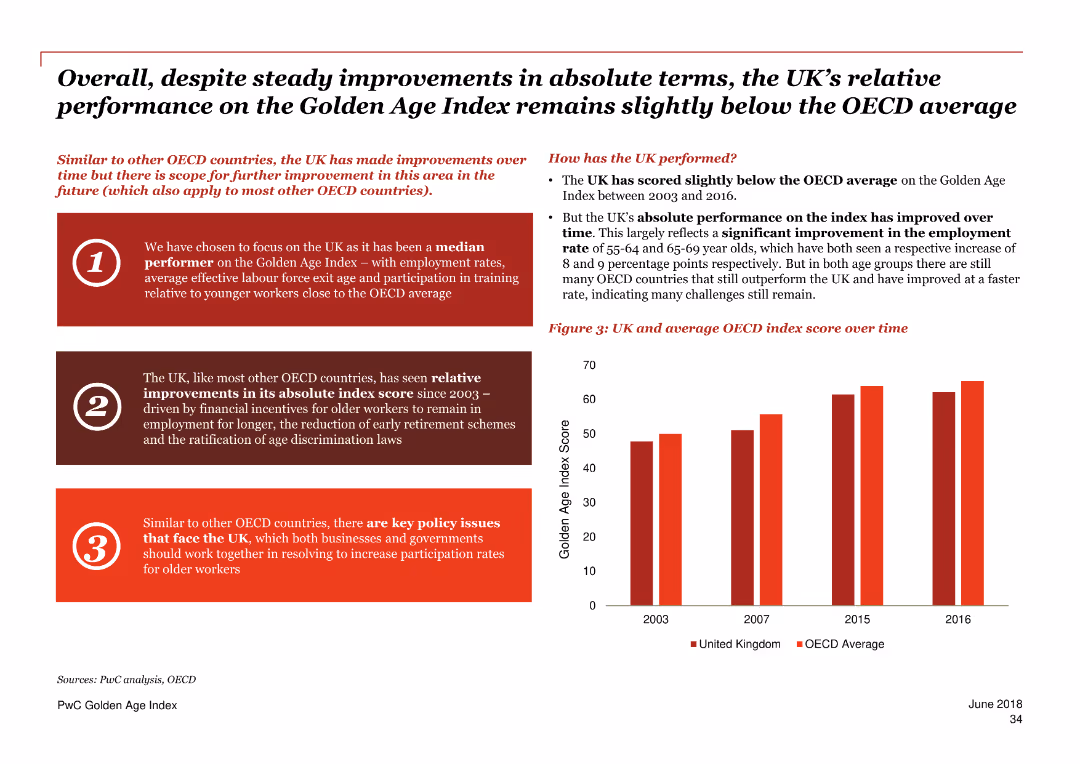
This slide includes a column chart comparing the UK’s Golden Age Index score over time to the OECD average. Text sections highlight the UK’s relative performance and key policy issues.
Performance Metrics and KPIs
Government & Public Sector
The slide reviews the UK’s performance on the Golden Age Index, showing steady improvements but remaining below the OECD average. It discusses factors driving these trends and key policy issues to enhance participation rates for older workers.
Golden Age Index, UK performance, OECD, employment, older workers, policy issues, index score, trends
false
Performance Metrics and KPIs
Government & Public Sector government-and-public-sector
Mixed Chart
PwC/Strategy&
View slide
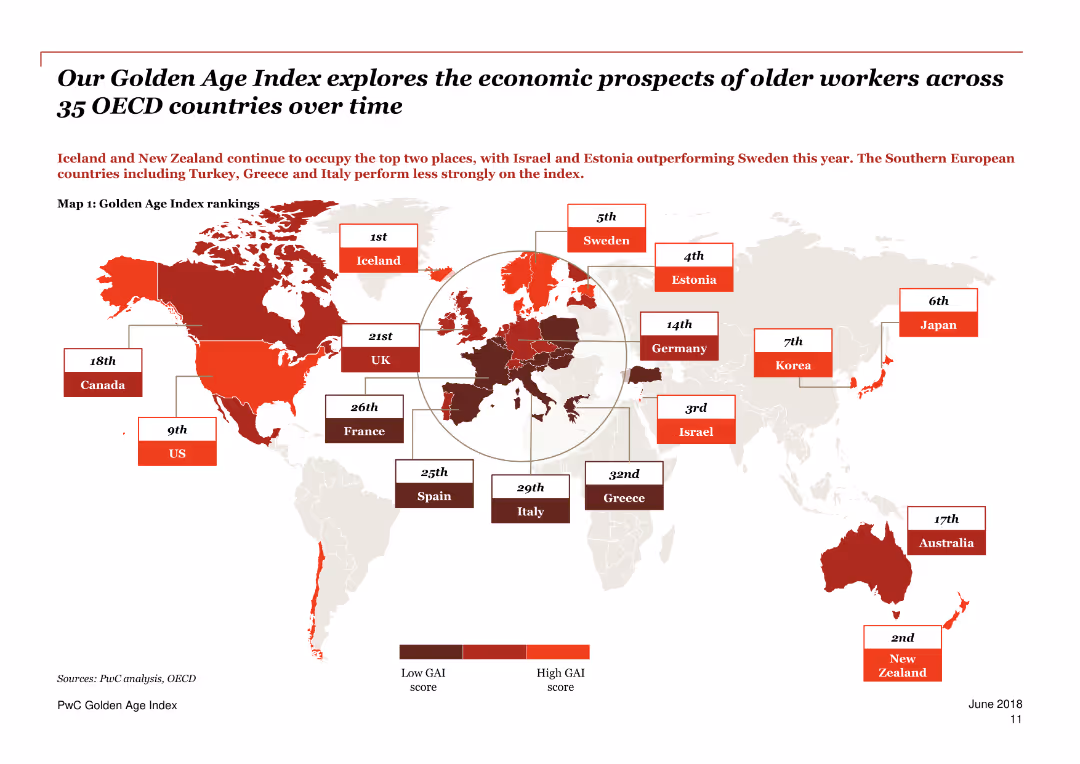
A world map highlighting countries in various shades of red indicating their Golden Age Index rankings.
Market Analysis and Trends
Government & Public Sector
The slide explores the economic prospects of older workers across 35 OECD countries over time, with Iceland and New Zealand leading the rankings.
Golden Age Index, older workers, OECD, economic prospects, rankings, countries, map, trends, employment, analysis
false
Market Analysis and Trends
Government & Public Sector government-and-public-sector
Graphic
PwC/Strategy&
View slide
A diamond-shaped quadrant with four segments shows Goldman Sachs services, juxtaposed with Orsted’s services on the right.
Organizational Structure and Change
Financial Services
Describes Goldman Sachs' comprehensive service structure and how it supports a local client with global capabilities through different services.
Goldman Sachs, Global Markets, Asset Management, Investment Banking, Client Services, Orsted, Financing, Advising
false
Organizational Structure and Change
Financial Services financial-services
Header Vertical
Goldman Sachs
View slide
Lists three strategic focal points: Growing businesses, diversifying services, and increasing efficiency, each with sub-points.
Strategic Planning
Financial Services
Presents a coherent global strategy for Goldman Sachs, focusing on business growth, product diversification, and operational efficiency.
Goldman Sachs, Global Strategy, Business Growth, Product Diversification, Operational Efficiency, Digital Investment
false
Strategic Planning
Financial Services financial-services
Header Horizontal
Goldman Sachs
View slide
A table with rows for different financial services and columns showing rankings in EMEA, Asia Pacific, and Latin America.
Market Analysis and Trends
Financial Services
Highlights Goldman Sachs' rankings across various financial services sectors globally, emphasizing its leading market position.
Goldman Sachs, Investment Banking, Global Markets, EMEA, Asia Pacific, Latin America, Market Position
false
Market Analysis and Trends
Financial Services financial-services
Table
Goldman Sachs
View slide
The slide has three blue rectangular boxes with financial target metrics like ROE/ROTE, Efficiency Ratio, and CET1 Ratio, featuring percentage values.
Financial Performance
Financial Services
This slide presents Goldman Sachs' financial targets, highlighting ROE/ROTE, Efficiency Ratio, and CET1 Ratio as measures of their commitment to generating returns.
Goldman Sachs, ROE, ROTE, Efficiency, CET1 Ratio, Financial Targets, Value Driving, Business Growth
false
Financial Performance
Financial Services financial-services
Table
Goldman Sachs
View slide
The slide features a circular arrow diagram with three sections around a central rectangle labeled 'Goldman Sachs'. The sections are titled 'Culture of Risk Management', 'Process and Structural Oversight', and 'Continuous Improvement'.
Risk Assessment and Management
Financial Services
This slide presents the risk management strategy at Goldman Sachs, focusing on the continuous cycle of culture, process oversight, and improvement. It's suitable for discussions on corporate risk policies and institutional culture of risk.
Goldman Sachs, Risk Management, Culture, Process Oversight, Continuous Improvement
false
Risk Assessment and Management
Financial Services financial-services
Linear Flow
Goldman Sachs
View slide
This slide features a hybrid internal-external framework with icons and a sequence of diamond shapes indicating services.
Operational Efficiency
Financial Services
The slide showcases Goldman Sachs' services spanning risk, analytics, payments, data, custody, clearing, and advice.
Goldman Sachs, services, internal-external, platform, finance
false
Operational Efficiency
Financial Services financial-services
Diagram
Goldman Sachs
View slide
Line charts showing trends in institutional quality scores over time.
Regulatory and Compliance
Government & Public Sector
Examines the role of quality governance in enhancing business confidence and reducing corruption in South Africa.
Governance, Service Delivery, Corruption, Institutional Quality, South Africa
false
Regulatory and Compliance
Government & Public Sector government-and-public-sector
Mixed Chart
PwC/Strategy&
View slide
The slide features a hierarchical chart with two main columns differentiated by color. On the left, a blue column lists the supervisory board's structure, and on the right, a darker blue column outlines the general partners' responsibilities.
Organizational Structure and Change
Industrial & Manufacturing
This slide illustrates the governance structure of Michelin, detailing the roles and relationships between the supervisory board and general partners. It can be used to explain company management and oversight practices.
Governance, Structure, Roles, Oversight, Partners, Liability, Management
false
Organizational Structure and Change
Industrial & Manufacturing industrial-and-manufacturing
Diagram
Morgan Stanley
View slide
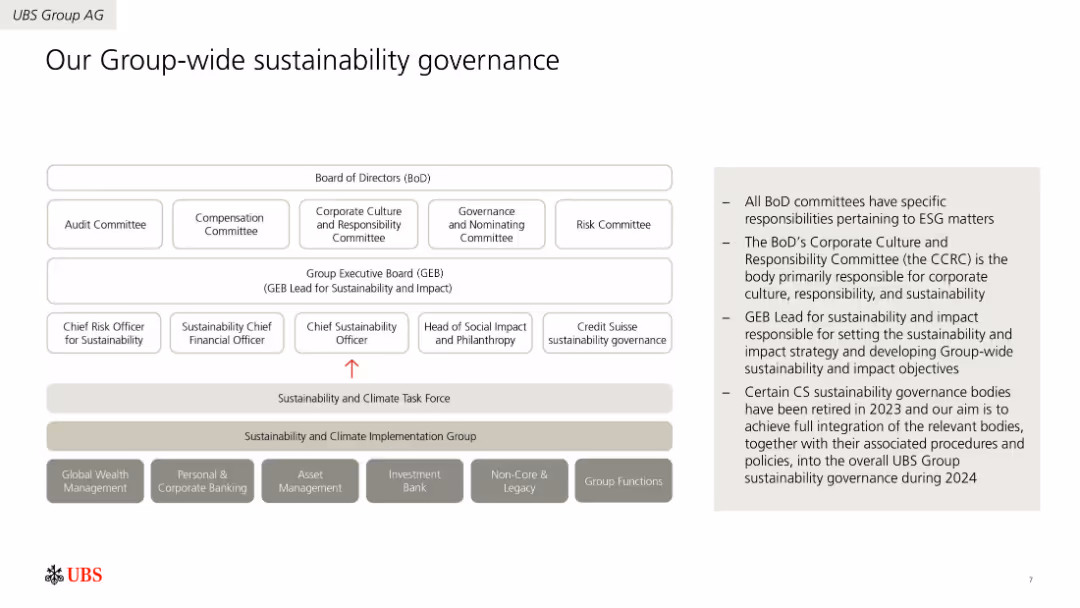
Organizational chart depicting the sustainability governance structure at UBS. Includes boxes for different committees and roles, along with brief descriptions of their responsibilities.
Regulatory and Compliance
Environmental Services & Sustainability
Describes UBS's sustainability governance framework, detailing the roles and responsibilities of various committees and executives. Emphasizes the integration of sustainability into corporate governance.
Governance, Sustainability, Structure, Committees, Responsibilities, Regulatory
false
Regulatory and Compliance
Environmental Services & Sustainability environmental-services-and-sustainability
Diagram
UBS
View slide
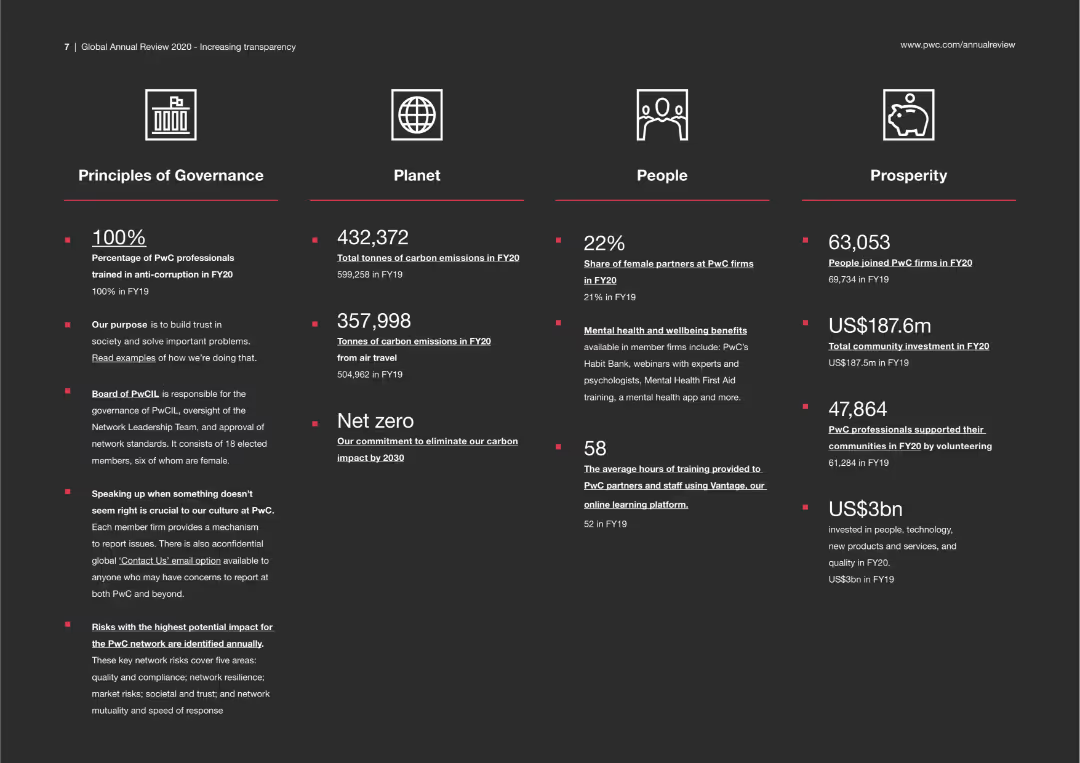
This slide is divided into four sections, each with a heading and bullet points detailing principles and statistics related to governance, environmental impact, diversity, and community investment.
Human Resources and Talent Management
Professional Services
The slide presents PwC's commitments and achievements in governance, environmental sustainability, diversity, and community engagement, emphasizing transparency and corporate responsibility.
Governance, sustainability, diversity, community investment, transparency
false
Human Resources and Talent Management
Professional Services professional-services
Pillar
PwC/Strategy&
View slide
Two column charts depict historical returns from government bonds during market shocks, comparing different countries. The background is white with 'Fixed Income' highlighted in blue.
Investment Analysis
Financial Services
The slide provides a historical comparison of government bond returns during economic shocks, potentially guiding investment decisions during times of market volatility. It is crucial for investors or policymakers analyzing diversification and risk management strategies.
Government Bonds, Returns, Shocks, Fixed Income, Diversification, Risk
false
Investment Analysis
Financial Services financial-services
Multiple Chart
JP Morgan
View slide
The slide shows two bar charts: one depicting real GDP year-over-year change by political party, and another showing S&P 500 calendar year returns by political party.
Market Analysis and Trends
Financial Services
This slide provides an analysis of economic and market performance under different government configurations, suggesting that both fare well regardless of the political party in power.
Government Configurations, GDP, S&P 500, Market Performance, Political Party
false
Market Analysis and Trends
Financial Services financial-services
Multiple Chart
JP Morgan
View slide
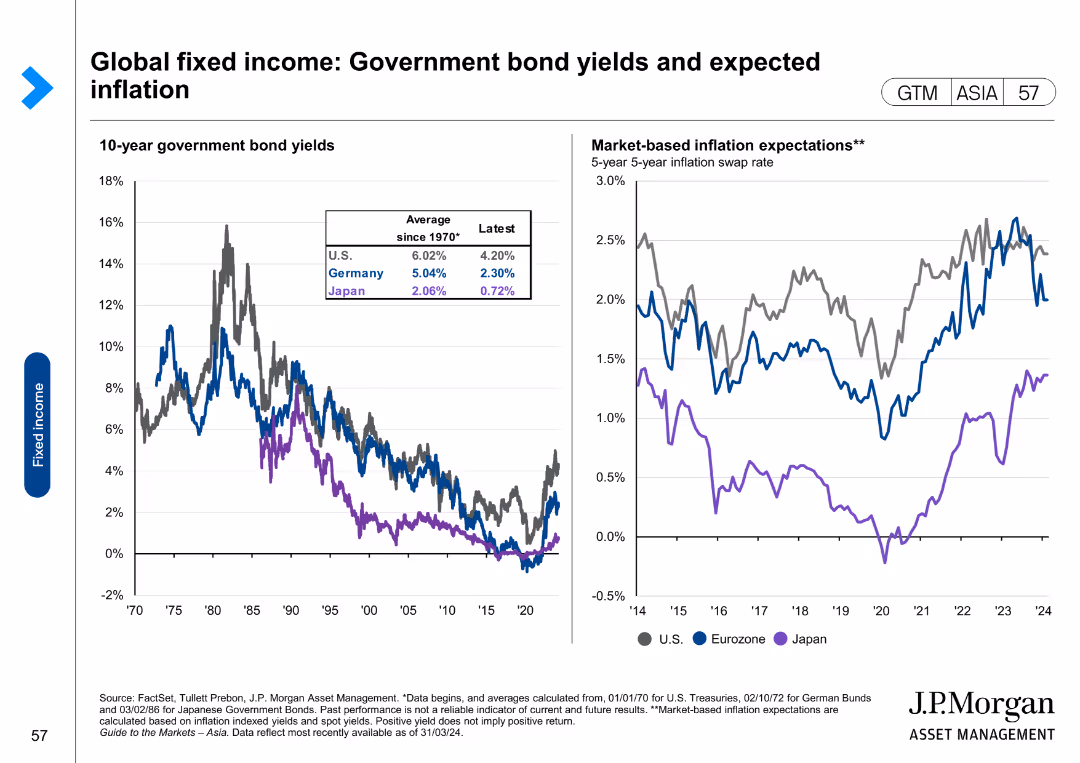
The slide includes two line charts. The first chart shows 10-year government bond yields for the U.S., Germany, and Japan over time. The second chart shows market-based inflation expectations for the same regions.
Financial Performance
Financial Services
This slide examines government bond yields and expected inflation for the U.S., Germany, and Japan, providing insights into fixed income performance and economic expectations.
Government bonds, yields, expected inflation, U.S., Germany, Japan, fixed income, financial performance
false
Financial Performance
Financial Services financial-services
Multiple Chart
JP Morgan
View slide
Two line charts are presented: one showing government debt as a percentage of GDP and the other illustrating government interest payments as a percentage of GDP for the US, Eurozone, and UK.
Risk Assessment and Management
Government & Public Sector
The slide examines government debt levels and interest payment trends, useful for assessing fiscal sustainability and debt risk in major economies.
Government debt, interest payments, fiscal sustainability, GDP, risk management
false
Risk Assessment and Management
Government & Public Sector government-and-public-sector
Multiple Chart
JP Morgan
View slide
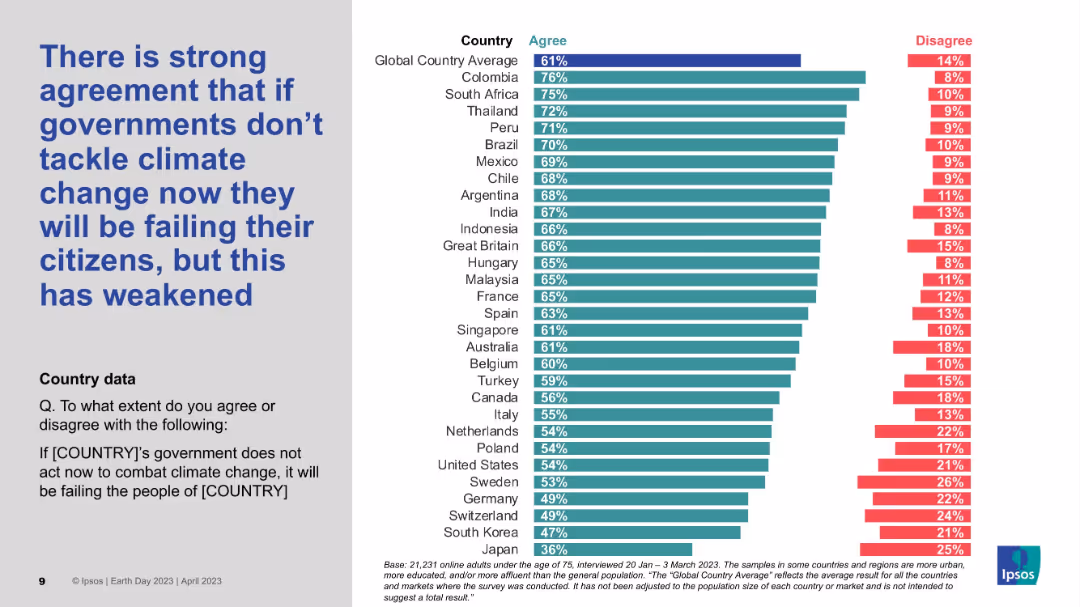
Bar chart ranked by country; agree/disagree split shown; left title in blue on grey.
Risk Assessment and Management
Government & Public Sector
The slide presents strong international agreement that governments failing to act on climate change are failing their citizens. It also highlights a weakening sentiment compared to previous years. Colombia and South Africa top the agreement scale.
Government failure, Climate urgency, Global views, Disagreement, Country comparison
false
Risk Assessment and Management
Government & Public Sector government-and-public-sector
Mixed Chart
IPSOS
View slide
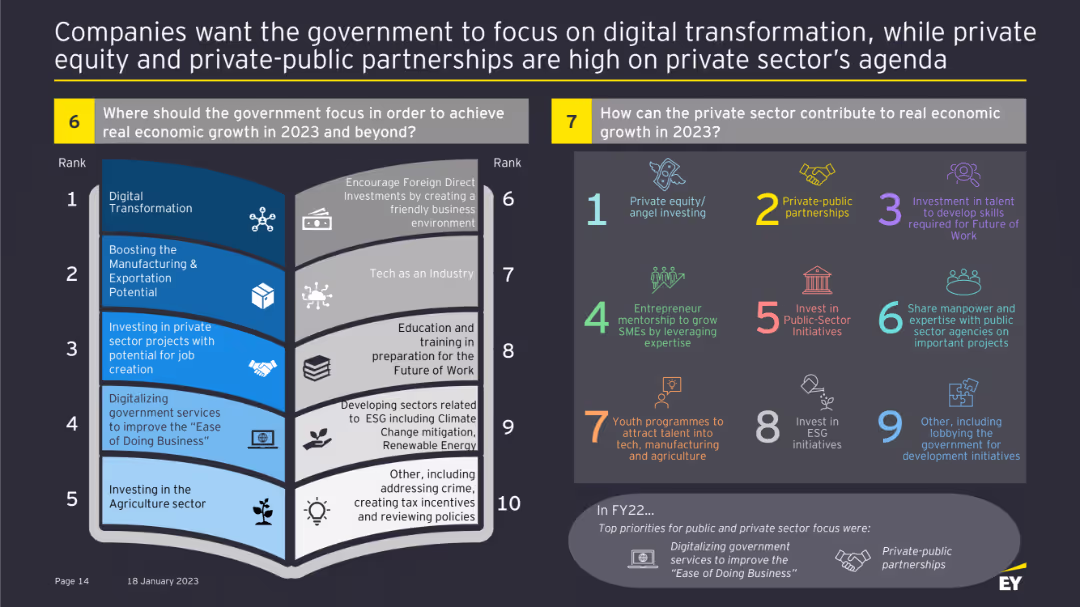
Two panels with ranked lists on where the government should focus for economic growth and how the private sector can contribute.
Strategic Planning
Government & Public Sector
This slide identifies key areas for government focus to achieve economic growth and outlines how the private sector can support these goals through various initiatives.
Government focus, private sector, economic growth, initiatives, digital transformation, investment, partnerships
false
Strategic Planning
Government & Public Sector government-and-public-sector
Header Horizontal
EY
View slide
This slide displays multiple column charts comparing expenditures in various government sectors between two fiscal years, highlighting percentage changes.
Regulatory and Compliance
Government & Public Sector
Analyzes year-on-year changes in government spending across different sectors, providing insights into budget allocation shifts.
Government spending, budget analysis, fiscal years, comparison
false
Regulatory and Compliance
Government & Public Sector government-and-public-sector
Single Chart
PwC/Strategy&
View slide
This slide presents a stacked column chart detailing government expenditure by subdivision over several years. It includes categories such as personnel and capital assets.
Regulatory and Compliance
Government & Public Sector
Analyzes trends in government spending across various categories over time, highlighting changes in expenditure.
Government spending, trends, expenditure, fiscal year, budget
false
Regulatory and Compliance
Government & Public Sector government-and-public-sector
Single Chart
PwC/Strategy&
View slide
This slide features a pie chart depicting budget income sources and a series of column charts showing budget income projections from 2021-22 to 2026-27. The layout includes textual information and visual elements such as icons representing various types of income, neatly aligned with corresponding data. The slide also includes the Isle of Man Government logo.
Financial Performance
Government & Public Sector
The slide presents the Isle of Man's government budget projections for 2022-23, focusing on income tax contributions to the total treasury income. It highlights that income tax is projected to make up 25.93% of total treasury income. It's useful for discussions on government revenue composition and financial planning.
Government, Budget, Income Tax, Projections, Treasury, Financial Planning, Pie Chart
false
Financial Performance
Government & Public Sector government-and-public-sector
Mixed Chart
PwC/Strategy&
View slide
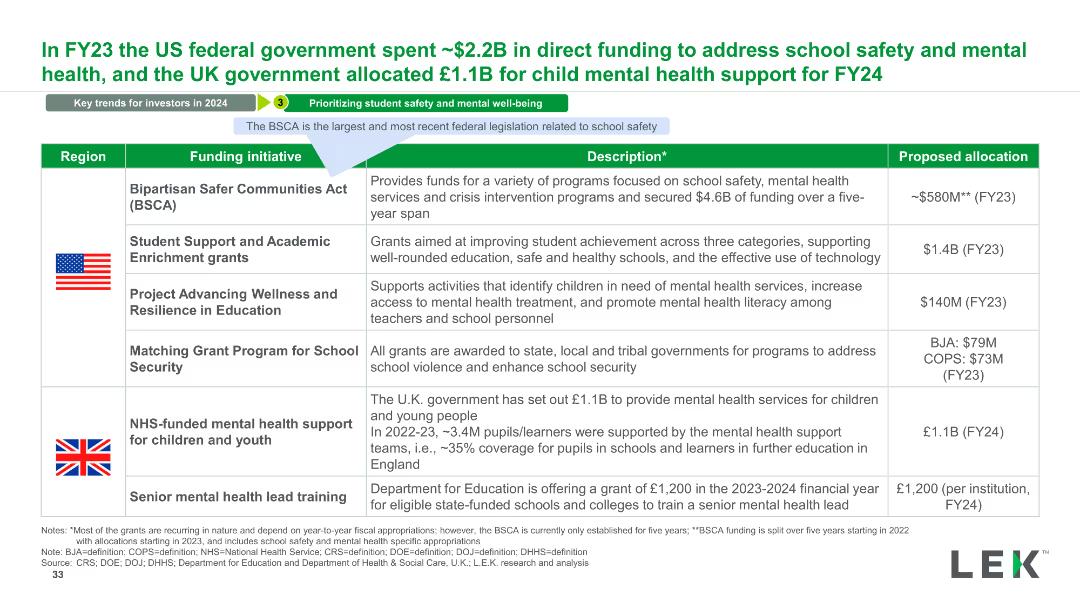
The slide features a table with columns for Region, Funding Initiative, Description, and Proposed Allocation. It includes flags for the US and UK and descriptions of funding initiatives.
Regulatory and Compliance
Government & Public Sector
This slide details government funding initiatives for school safety and mental health in the US and UK, outlining specific programs and their proposed budgets.
Government, Funding, Safety, Mental Health, School, Initiatives, US, UK, Budget, Support
false
Regulatory and Compliance
Government & Public Sector government-and-public-sector
Table
LEK
View slide
The slide displays a bar chart with horizontal bars indicating survey responses about government performance during the pandemic. The chart is accompanied by text on the left, providing an overview and interpretation of the results.
Regulatory and Compliance
Government & Public Sector
This slide presents survey results on Millennials' and Gen Z's perceptions of their national governments' handling of the COVID-19 pandemic. It shows mixed reviews, highlighting areas where governments performed well and areas needing improvement. The data can inform policy adjustments and public communication strategies.
Government, Pandemic, Response, Millennials, Gen Z
false
Regulatory and Compliance
Government & Public Sector government-and-public-sector
Mixed Chart
Deloitte
Previous
Loading...
Hold On!
We are searching in our database
If nothing, comes up, please try different filters!
Column Chart
Heatmap
Chevron
Org Chart
Infographic
Callouts
Timeline
List
Graphic
Picture
Process Flow
Diagram
Paragraph
Map
Table
Framework
Subtitle
Takeaway Box
Icon
Other Chart
Radar Chart
Waterfall Chart
Mekko Chart
Pie Chart
Scatter Plot
Line Chart
Bar chart
Bullet points
Create a FREE account to continue browsing
Receive Instant Access to 1,000+ slides from companies like McKinsey, Google, and Goldman Sachs
First Name
Last Name
Email
Password
I agree to all
Terms & Privacy Policy
Thank you! Your submission has been received!
Oops! Something went wrong while submitting the form.
Have an account?
Sign in
Upgrade to PRO to Save slides
Advanced Search and Filters
Access to 15,000+ slides
Access to Category Pages
Save/Bookmark Slides
PowerPoint Template Library
Pick a Plan
MONTHLY
$12/month
Billed every month, Cancel anytime.
YEARLY
$9/year
Billed $108 annually, Cancel anytime.
Checkout for $12/month
Checkout for $108/yr
Secured by Stripe | AES-256 bit encryption