My Account
My Slides
Search by Category
Templates
Leave Feedback
Login
Logout
Get Started
Browse all Slides
Browse all Slides
Create a FREE Account
Instant access to 1,000+ real slides from top companies like McKinsey, BCG, Goldman Sachs, Google and many more!
First Name
Last Name
Email
Password
I agree to all
Terms & Privacy Policy
Thank you! Your submission has been received!
Oops! Something went wrong while submitting the form.
Have an account?
Sign in
📢 Ready to start building slides? Check out our new template library
VIEW TEMPLATES
Welcome,
Welcome
PRO
Show Featured Only
Checkbox 8
Companies
Mckinsey
Bain
BCG
EY
Deloitte
Accenture
PwC/Strategy&
JP Morgan
Goldman Sachs
Morgan Stanley
Citigroup
Deutsche Bank
Barclays
LEK
KPMG
Kearney
Oliver Wyman
Booz Allen Hamilton
Gartner
IPSOS
Nielsen
Slide type
Text Only
Linear Flow
Vertical Flow
Single Chart
Header Horizontal
Mixed Chart
Header Vertical
Pillar
Multiple Chart
Graphic
Agenda
Title
Table
Framework
Industry
Technology & Software
Artificial Intelligence
Financial Services
Retail & E-commerce
Consumer Goods
Industrial & Manufacturing
Transportation & Logistics
Telecommunications
Real Estate & Construction
Hospitality & Tourism
Professional Services
Education & Training
Media & Entertainment
Agriculture & Food Production
Healthcare & Pharmaceuticals
Environmental Services & Sustainability
Government & Public Sector
Use Case
Mergers and Acquisitions
Performance Metrics and KPIs
Client Case Studies
Competitive Landscape
Corporate Finance and Valuation
Product and Service Analysis
Customer and Market Segmentation
Organizational Structure and Change
Industry Overview
Regulatory and Compliance
Risk Assessment and Management
Investment Analysis
Organizational Structure and Change
Human Resources and Talent Management
Financial Performance
Market Analysis and Trends
Sales and Business Development
Human Resources and Talent Management
Clear all
Thank you! Your submission has been received!
Oops! Something went wrong while submitting the form.
Tag
View slide
Multiple line charts showing the excise duty for various alcoholic beverages and cigarettes from 2017/18 to 2024/25.
Regulatory and Compliance
Government & Public Sector
Details changes in tax levies on alcohol and cigarettes, reflecting government regulatory measures.
Government, Public Sector, Alcohol, Cigarettes, Tax, Duty, Excise, Regulatory, Compliance
false
Regulatory and Compliance
Government & Public Sector government-and-public-sector
Single Chart
PwC/Strategy&
View slide
Line chart with annotations for actual and projected expenditure rates from 2018/19 to 2023/24.
Financial Performance
Government & Public Sector
Shows the consistency and changes in government spending efficiency over six fiscal years.
Government, Public Sector, Expenditure, Efficiency, Spending, Financial, Rate, Actuals, Projections
false
Financial Performance
Government & Public Sector government-and-public-sector
Single Chart
PwC/Strategy&
View slide
The slide features a four-column layout with textual information on the left and various bubble charts on the right, visually representing data on AI utilization across different business processes. Each chart is marked with a percentage, indicating the level of AI integration.
Industry Overview
Government & Public Sector
This slide discusses the potential of AI to improve operations in government and public services, with specific examples from the Air Force and other agencies. It explains how AI can predict performance and safety issues, and how it assists humans before performance degrades. Additionally, it lists different operational areas where AI is currently used, like customer experience and operations finance.
Government, Public Services, AI, Innovation, Performance, Safety, Operations, Finance, Customer Experience
false
Industry Overview
Government & Public Sector government-and-public-sector
Multiple Chart
Deloitte
View slide
The slide includes icons and bullet points discussing government support for digital initiatives across various infrastructural areas.
Regulatory and Compliance
Technology & Software
Analyzes the government's proactive role in digital growth, vital for understanding public sector strategies and digital economy compliance.
Government, digital initiatives, infrastructure, regulatory, compliance, strategy, public sector, digital growth
false
Regulatory and Compliance
Technology & Software technology-and-software
Header Vertical
Kearney
View slide
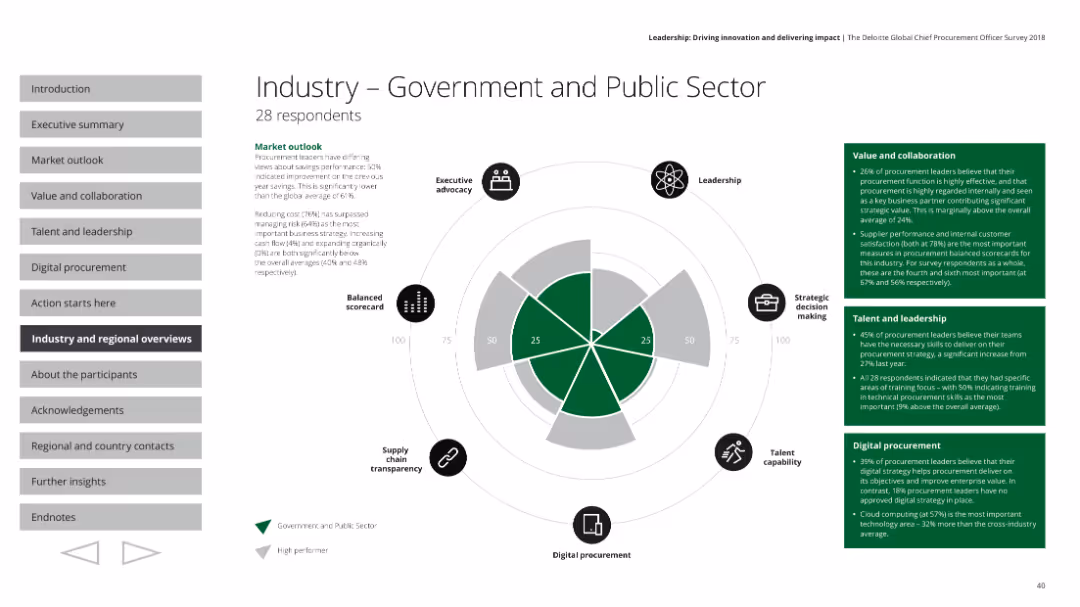
The slide features a radar chart, text boxes with survey results, and small icons indicating various aspects of performance.
Industry Overview
Government & Public Sector
This slide provides an overview of the government and public sector's procurement performance based on a survey. It covers executive advocacy, leadership, strategic decision making, talent capability, digital procurement, and supply chain transparency, with detailed market outlook and specific metrics on value, collaboration, talent, and leadership.
Government, public sector, procurement, radar chart, performance
false
Industry Overview
Government & Public Sector government-and-public-sector
Mixed Chart
Deloitte
View slide
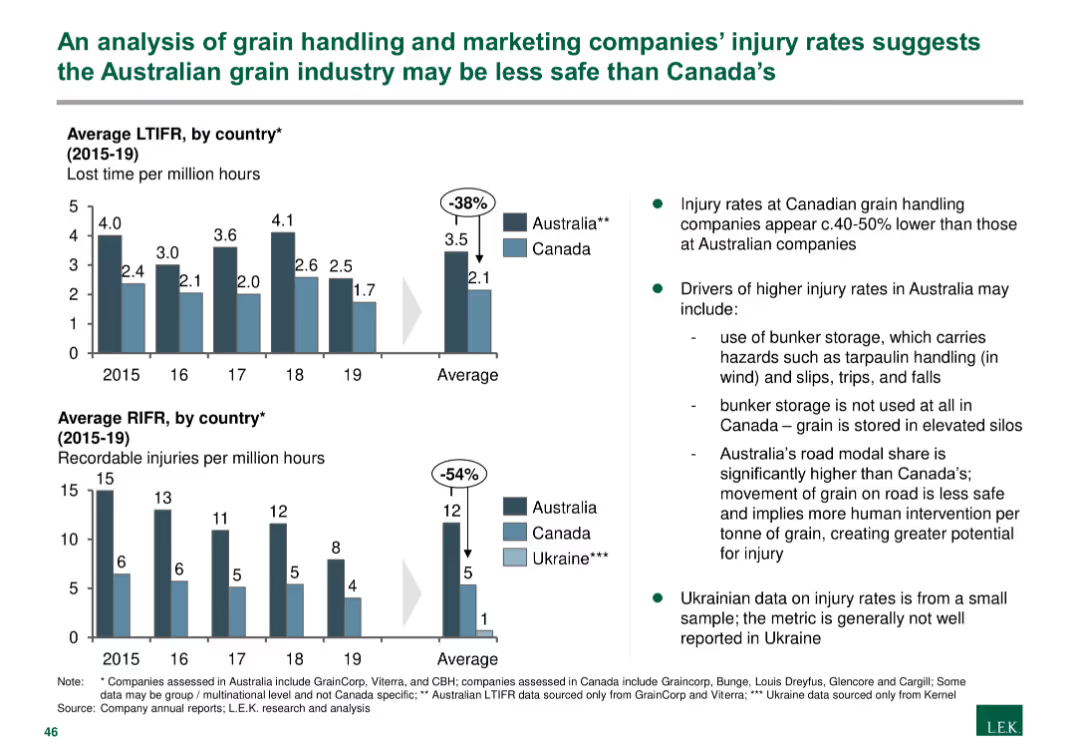
The slide presents column charts comparing lost time injury frequency rates (LTIFR) and recordable injury frequency rates (RIFR) in Australia, Canada, and Ukraine.
Risk Assessment and Management
Agriculture & Food Production
The slide analyzes safety metrics in the grain handling industry, showing that injury rates in Australia are higher than in Canada, with detailed notes on contributing factors and implications for safety management.
Grain handling, injury rates, safety, Australia, Canada, Ukraine, risk assessment, agriculture, food production
false
Risk Assessment and Management
Agriculture & Food Production agriculture-and-food-production
Multiple Chart
LEK
View slide
This slide presents a table with performance indicators for Australia's grain supply chain, using color coding to highlight areas of strength and weakness.
Operational Efficiency
Agriculture & Food Production
The slide evaluates the efficiency of Australia's grain supply chain, identifying areas where it meets or exceeds benchmarks, as well as areas needing improvement, particularly in rail and port operations.
Grain supply chain, Australia, performance indicators, rail efficiency, port efficiency, benchmarking, operational efficiency, agriculture
false
Operational Efficiency
Agriculture & Food Production agriculture-and-food-production
Table
LEK
View slide
This slide includes tables comparing ownership structure, geographic footprint, port terminals, and recent investments of three major bulk handlers.
Competitive Landscape
Agriculture & Food Production
The slide compares three major bulk handlers in the grain industry, detailing their ownership, geographic reach, port terminal capacities, and recent investments.
Grain, Bulk Handlers, Comparison, Investment, Port
false
Competitive Landscape
Agriculture & Food Production agriculture-and-food-production
Multiple Chart
LEK
View slide
This slide contains a comparative table with two columns, comparing grain and cement supply chains with metrics such as size, growth, and supply chain costs.
Market Analysis and Trends
Agriculture & Food Production
The slide compares the grain and cement supply chains based on various metrics to show why they were selected for review, highlighting key differences.
Grain, Cement, Supply Chain, Comparison, Metrics
false
Market Analysis and Trends
Agriculture & Food Production agriculture-and-food-production
Multiple Chart
LEK
View slide
The slide contains a timeline showing changes in ownership among major companies handling Australian grain, with different colored bars for handlers, marketers, and port operators.
Competitive Landscape
Agriculture & Food Production
This slide presents a timeline of the grain industry’s changes over ten years, highlighting consolidation among bulk handlers and new market entrants in rail and ports.
Grain, Industry, Timeline, Consolidation, Ownership
false
Competitive Landscape
Agriculture & Food Production agriculture-and-food-production
Diagram
LEK
View slide
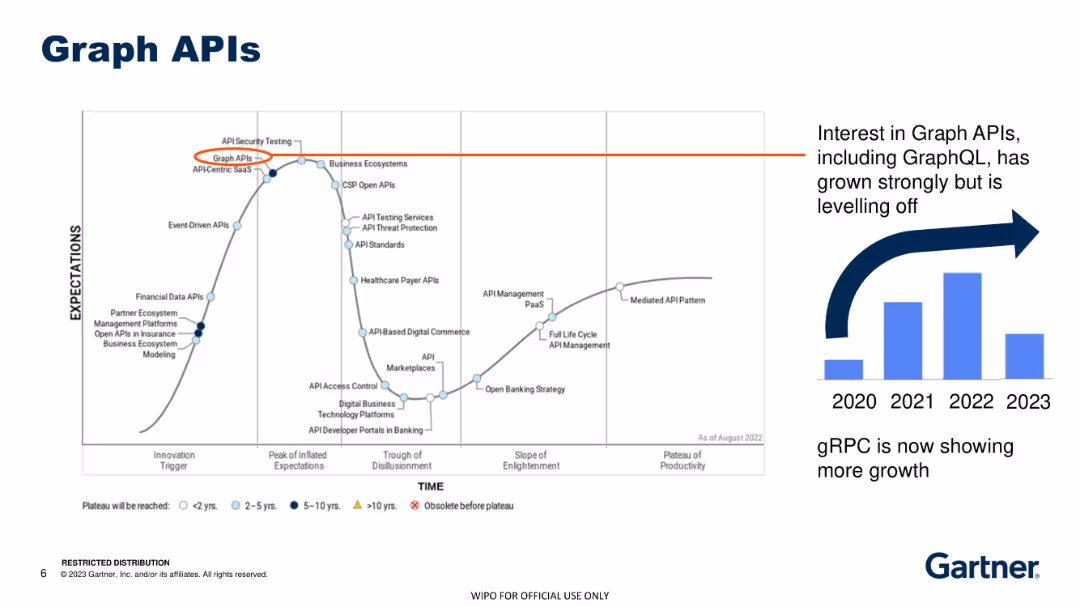
Line graph illustrating the adoption trends for Graph APIs, highlighting steady growth until 2023, with a secondary graph comparing the rise of gRPC.
Technology and Digital Transformation
Technology & Software
The slide examines the interest in Graph APIs and their adoption trends over recent years, noting the shift towards gRPC as the newer growth trend.
Graph APIs, gRPC, adoption trends, technology
false
Technology and Digital Transformation
Technology & Software technology-and-software
Multiple Chart
Gartner
View slide
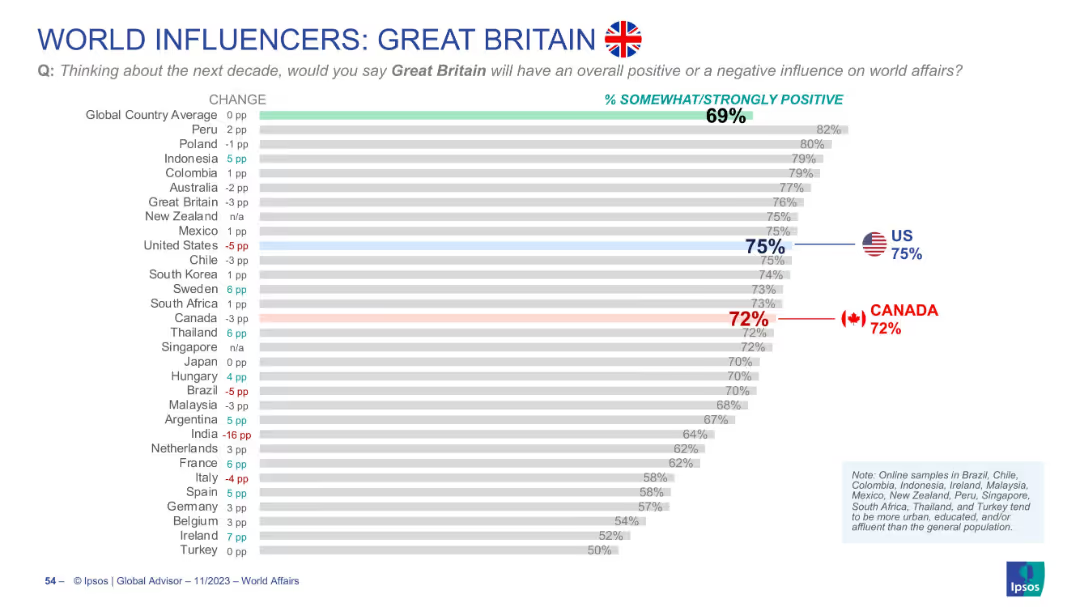
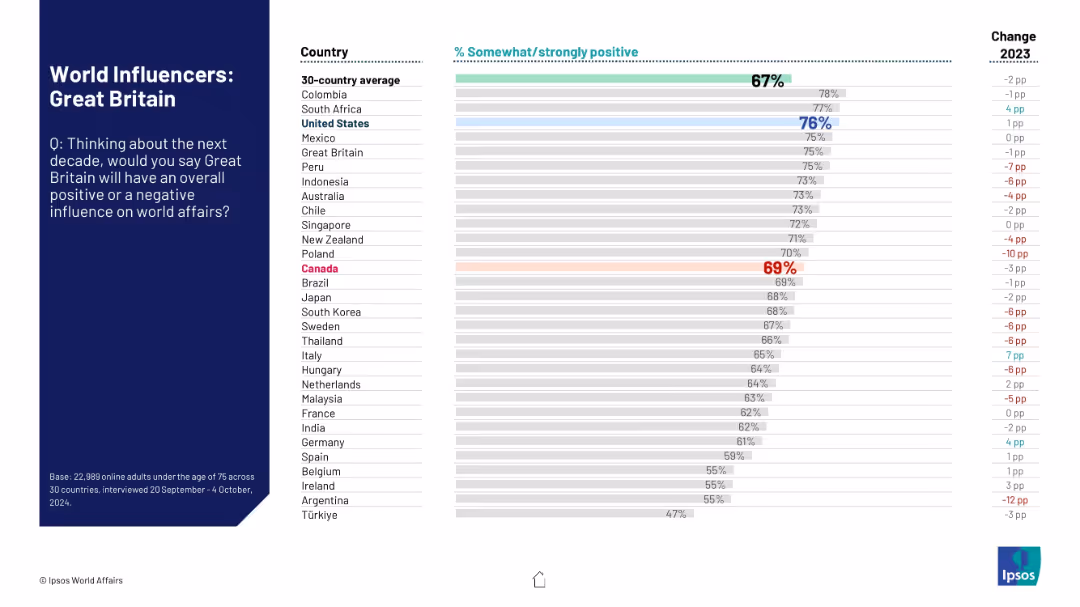
Horizontal bar chart showing international perceptions of the UK’s global influence
Market Analysis and Trends
Government & Public Sector
Surveys global sentiment toward Great Britain’s influence. The global average is 69%. Canada rates it 72%, U.S. at 75%. Results show small shifts in opinion across countries.
Great Britain, UK, global sentiment, Canada opinion, US opinion, Ipsos, bar chart, soft power, international views
false
Market Analysis and Trends
Government & Public Sector government-and-public-sector
Single Chart
IPSOS
View slide
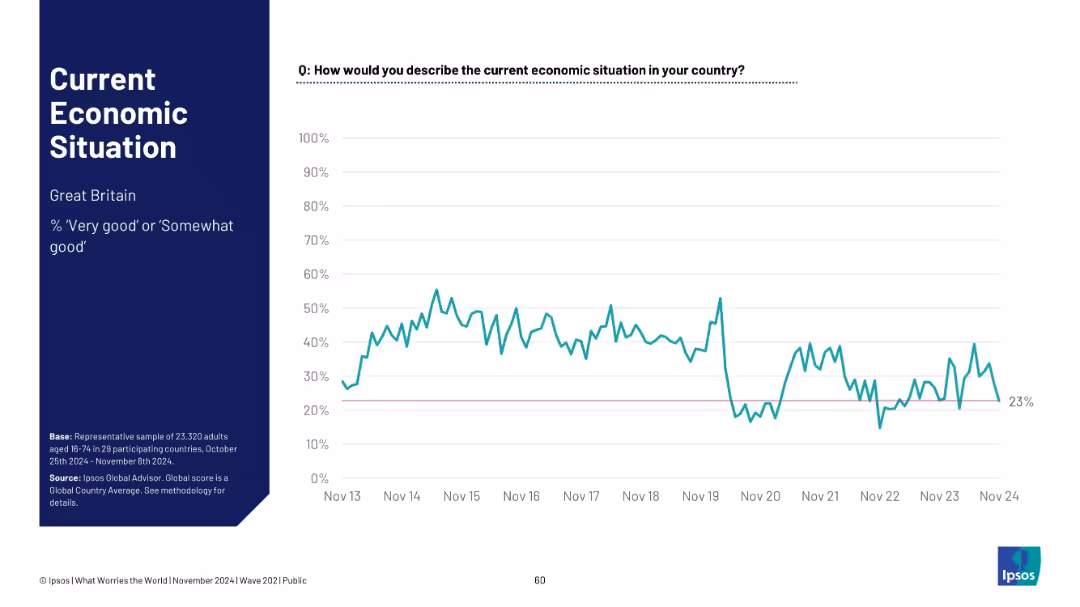
Layout mirrors previous slides; data for Great Britain. Title and summary left; sentiment trend graph right
Market Analysis and Trends
Government & Public Sector
Economic sentiment in Great Britain currently stands at 23%. The line graph shows significant fluctuation, with a major dip around 2020 and partial recovery in recent years.
Great Britain, economy perception, public sentiment, Ipsos report, economic evaluation, trend chart, UK economy
false
Market Analysis and Trends
Government & Public Sector government-and-public-sector
Single Chart
IPSOS
View slide
Split layout with dark blue title section on the left and a horizontal bar graph with country rankings on right.
Market Analysis and Trends
Government & Public Sector
The slide shows global perceptions of Great Britain's future influence on world affairs over the next decade. It includes a comparison across 30 countries, showing the percentage of people who view the UK's influence positively.
Great Britain, perception, influence, global opinion, Ipsos, bar chart, public opinion, international relations, positive impact, 2024 survey
false
Market Analysis and Trends
Government & Public Sector government-and-public-sector
Mixed Chart
IPSOS
View slide
The slide features a pie chart and a bar graph depicting the likelihood of employees seeking new employment within the next 12 months, segmented by age group. The design is straightforward with a clear visual hierarchy that directs attention to the key data points.
Human Resources and Talent Management
Professional Services
This slide presents data from a global workforce survey, highlighting the ongoing trend of the Great Resignation and its impact on employee retention across different age groups. It's particularly relevant for human resources discussions on strategies to improve employee retention and engagement.
Great Resignation, Employee Retention, Workforce, Age Groups, Survey Data, Pie Chart
false
Human Resources and Talent Management
Professional Services professional-services
Multiple Chart
PwC/Strategy&
View slide
The slide includes three donut charts representing the impact of the Great Resignation on different experience levels across total, hedge fund, and private equity sectors. An image on the left shows a meeting setting. The charts use shades of orange and red.
Human Resources and Talent Management
Financial Services
The slide discusses how the Great Resignation has most affected employees with 4-10 years of experience and highlights concerns about employee turnover rates among managers and investors.
Great Resignation, employee turnover, talent management, hedge fund, private equity
false
Human Resources and Talent Management
Financial Services financial-services
Multiple Chart
EY
View slide
Slide includes bar charts with detailed percentages, showing the impact of the Great Resignation across various company sizes and revenue brackets.
Human Resources and Talent Management
Professional Services
Evaluates the extent of employee resignations within marketing teams across different sectors, useful for HR strategy and workforce planning.
Great Resignation, marketing departments, HR, employee turnover, sector analysis
false
Human Resources and Talent Management
Professional Services professional-services
Multiple Chart
Deloitte
View slide
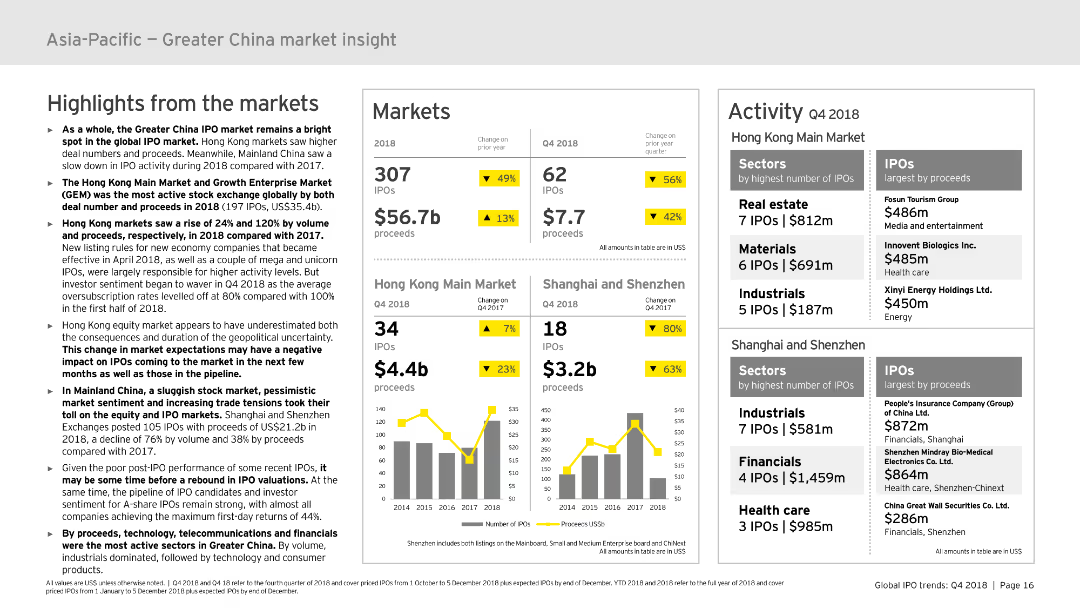
The slide includes several sections: highlights from the market, markets, and activity. It uses column charts and data tables to present detailed information on IPO activities and proceeds within the Greater China region. The visual complexity is moderate, ensuring clarity and effective communication of data.
Market Analysis and Trends
Financial Services
Provides an overview of the Greater China IPO market in 2018, covering key highlights, market performance, and detailed activity data for Hong Kong and Mainland China. Useful for market analysis and strategic planning.
Greater China, IPO, market insight, Hong Kong, Mainland China
false
Market Analysis and Trends
Financial Services financial-services
Multiple Chart
EY
View slide
The slide features an aerial image of an industrial site with large storage tanks. Overlaid is a pie chart showing how respondents’ perceptions of Greece have changed, with five segments in the chart.
Market Analysis and Trends
Real Estate & Construction
The slide provides data on how perceptions of Greece as a business location have improved, with a majority of respondents reporting a positive change in the last year.
Greece, attractiveness, perception, business location, industrial
false
Market Analysis and Trends
Real Estate & Construction real-estate-and-construction
Mixed Chart
EY
View slide
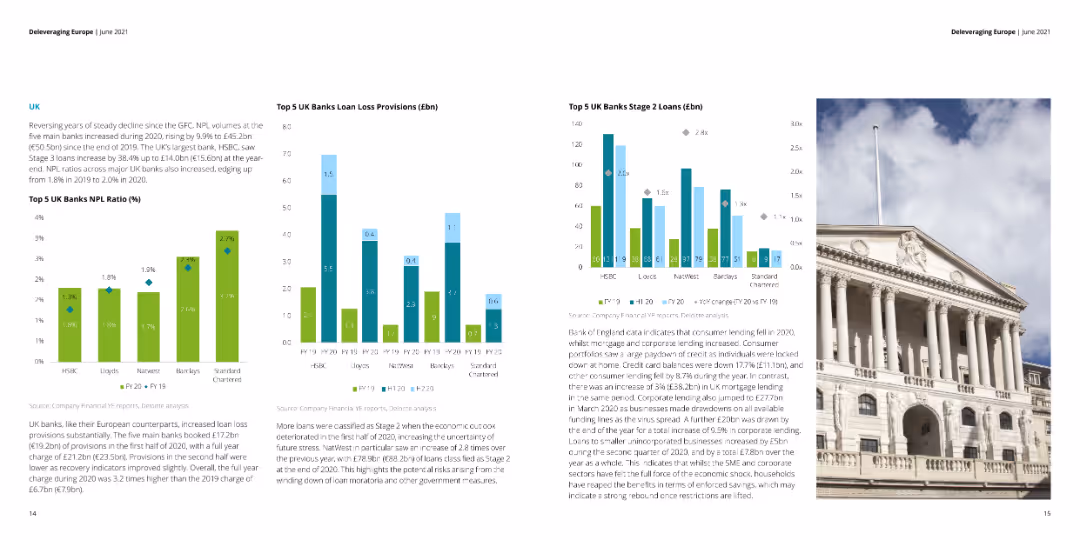
Column charts showing NPE ratios, NPE volumes, and loan loss provisions for top Greek banks.
Risk Assessment and Management
Financial Services
Details the progress of Greek banks in managing NPEs and loan loss provisions, focusing on financial stability and risk reduction.
Greece, banks, NPE, risk, management
false
Risk Assessment and Management
Financial Services financial-services
Multiple Chart
Deloitte
View slide
Left side features a text list with associated percentages, indicating priorities. The right side shows an image of people in a discussion.
Strategic Planning
Government & Public Sector
Survey results showing where respondents believe Greece should focus to maintain its competitive position, including education, reducing taxes, and innovation support.
Greece, competitiveness, education, innovation, strategic priorities
false
Strategic Planning
Government & Public Sector government-and-public-sector
Mixed Chart
EY
View slide
Left page includes a textual analysis with bullet points, while the right page features a vertical bar chart with percentages comparing perceptions among tech companies and the total sample.
Strategic Planning
Government & Public Sector
Discusses how Greece can enhance its image as a destination for investment, focusing on technology and innovation, with supporting survey data.
Greece, investment, technology, innovation, strategic image
false
Strategic Planning
Government & Public Sector government-and-public-sector
Mixed Chart
EY
View slide
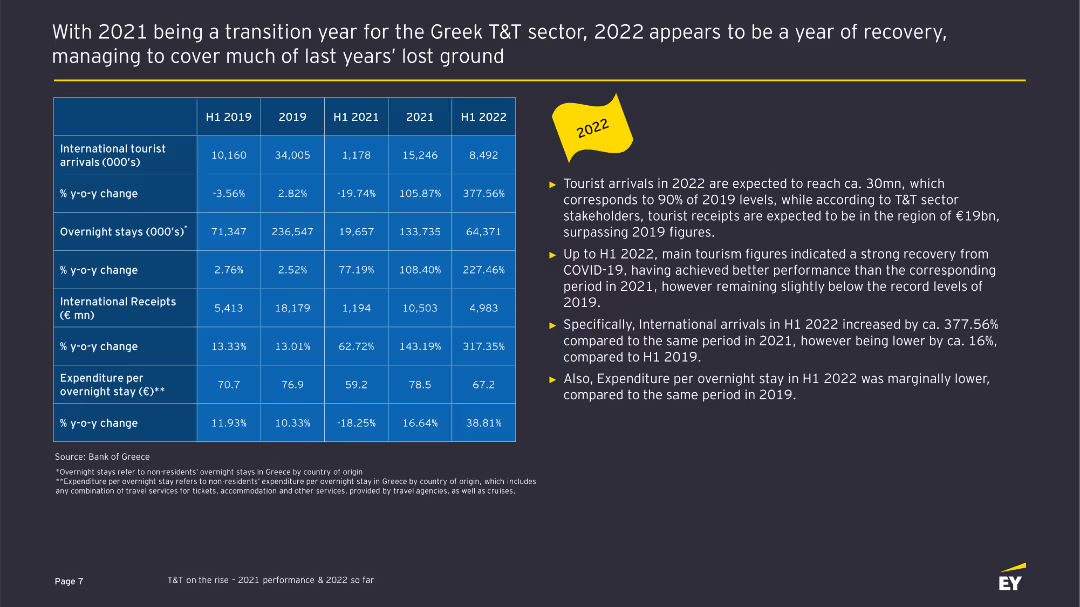
The slide includes a table comparing various metrics for international tourist arrivals, overnight stays, and receipts from 2019 to H1 2022. On the right, key highlights are listed in bullet points.
Financial Performance
Hospitality & Tourism
This slide provides a detailed comparison of the Greek tourism sector's performance metrics across different periods, highlighting recovery and trends.
Greek tourism, performance metrics, financial performance, sector analysis, tourism recovery
false
Financial Performance
Hospitality & Tourism hospitality-and-tourism
Table
EY
View slide
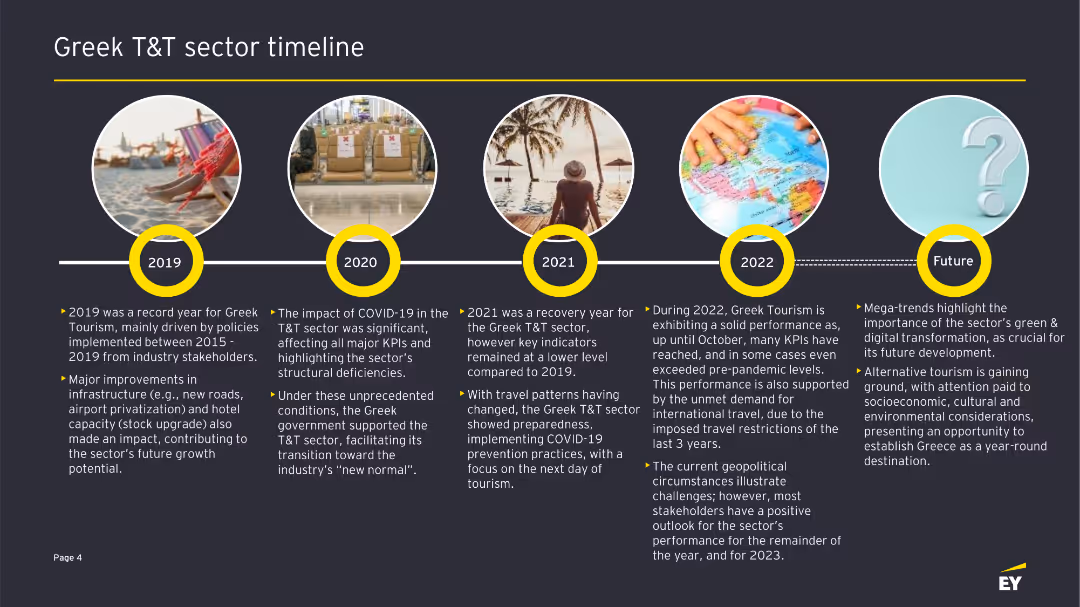
The slide displays a horizontal timeline with circular images and text boxes beneath each year from 2019 to the future, highlighting key events and trends in Greek tourism.
Strategic Planning
Hospitality & Tourism
This slide presents a timeline of significant events and trends in the Greek tourism and travel sector from 2019 to future projections.
Greek tourism, timeline, strategic planning, sector trends, travel industry
false
Strategic Planning
Hospitality & Tourism hospitality-and-tourism
Linear Flow
EY
View slide
Shows a column chart depicting the growth of green bond activity from 2014 to 2019 YTD, along with text highlights about sustainable transition bonds and IPO activity.
Strategic Planning
Financial Services
The slide focuses on the growth of green bonds and sustainable finance initiatives, showcasing significant increases in green bond activity and strategic ESG goals.
Green Bonds, Sustainable Finance, ESG, Growth, IPO Activity
false
Strategic Planning
Financial Services financial-services
Mixed Chart
Credit Suisse
View slide
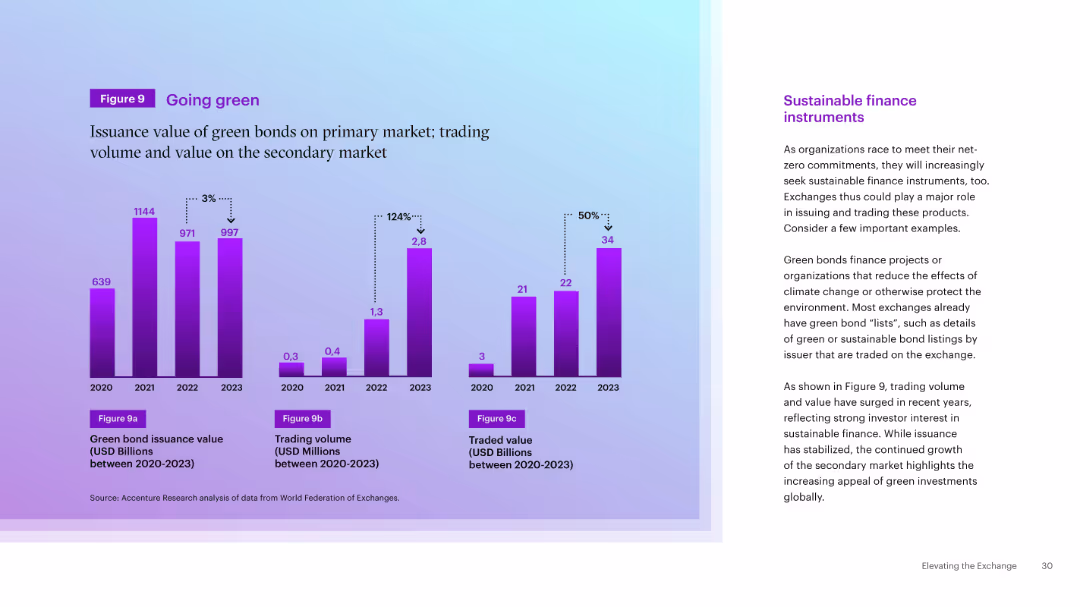
Triple bar chart showing green bond issuance, trading volume, and value from 2020–2023. Right-side explanatory text on sustainable finance.
Market Analysis and Trends
Financial Services
This slide visualizes the increasing issuance and trading of green bonds, reinforcing the rise of sustainable finance instruments. It shows a significant boost in trading value and volume, suggesting growing investor interest and exchange opportunity in ESG areas.
Green Bonds, Sustainable Finance, Trading, Market Trends, ESG, Exchanges, Environmental, Volume, Value
false
Market Analysis and Trends
Financial Services financial-services
Mixed Chart
Accenture
View slide
The slide has a gradient background with white text and demographic data visualization
Market Analysis and Trends
Environmental Services & Sustainability
It presents research on consumer attitudes towards green consumption and eco-friendly offerings
Green Consumption, Eco-Friendly, Consumer Attitudes, Survey, Innovation
false
Market Analysis and Trends
Environmental Services & Sustainability environmental-services-and-sustainability
Pillar
Accenture
View slide
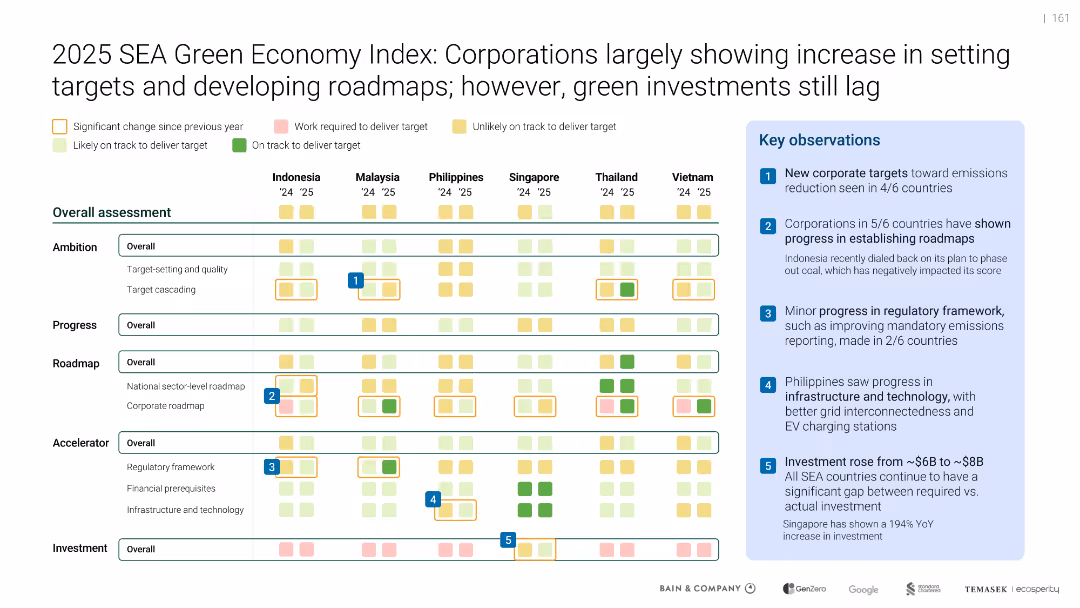
Matrix layout with colored squares indicating progress across ambition, roadmap, accelerator, and investment
Performance Metrics and KPIs
Environmental Services & Sustainability
Evaluates six SEA countries on ambition, progress, roadmaps, and enabling frameworks. Most countries improved in corporate targets and planning but still lag in green investments.
Green Economy Index, SEA countries, Corporate targets, Emissions, Roadmap, KPIs, Progress, Infrastructure
false
Performance Metrics and KPIs
Environmental Services & Sustainability environmental-services-and-sustainability
Mixed Chart
Bain
View slide
Comprised of bullet-pointed information on green energy investment and icons representing partnerships, this slide details the activities of the Green Investment Group with visual emphasis on key figures.
Regulatory and Compliance
Financial Services
Showcases the scale of green energy investments and partnerships of the Green Investment Group. It emphasizes the group's commitment to the green transition, serving as a reference for sustainability-focused discussions.
Green Energy, Investment, Partnerships, Sustainability, Transition
false
Regulatory and Compliance
Financial Services financial-services
Pillar
Morgan Stanley
View slide
Composed of four blocks each with a distinct background image and icon, detailing different strategic actions such as unlocking opportunities, confronting costs, strengthening financing, and driving collaboration.
Strategic Planning
Environmental Services & Sustainability
Outlines four key strategies to enhance green investment and climate action within SEA, focusing on proven solutions, addressing system costs, boosting green financing, and enhancing regional collaboration.
Green Investment, Climate Action, SEA, Financing, Collaboration
false
Strategic Planning
Environmental Services & Sustainability environmental-services-and-sustainability
Boxed
Bain
Previous
Loading...
Hold On!
We are searching in our database
If nothing, comes up, please try different filters!
Column Chart
Heatmap
Chevron
Org Chart
Infographic
Callouts
Timeline
List
Graphic
Picture
Process Flow
Diagram
Paragraph
Map
Table
Framework
Subtitle
Takeaway Box
Icon
Other Chart
Radar Chart
Waterfall Chart
Mekko Chart
Pie Chart
Scatter Plot
Line Chart
Bar chart
Bullet points
Create a FREE account to continue browsing
Receive Instant Access to 1,000+ slides from companies like McKinsey, Google, and Goldman Sachs
First Name
Last Name
Email
Password
I agree to all
Terms & Privacy Policy
Thank you! Your submission has been received!
Oops! Something went wrong while submitting the form.
Have an account?
Sign in
Upgrade to PRO to Save slides
Advanced Search and Filters
Access to 15,000+ slides
Access to Category Pages
Save/Bookmark Slides
PowerPoint Template Library
Pick a Plan
MONTHLY
$12/month
Billed every month, Cancel anytime.
YEARLY
$9/year
Billed $108 annually, Cancel anytime.
Checkout for $12/month
Checkout for $108/yr
Secured by Stripe | AES-256 bit encryption