My Account
My Slides
Search by Category
Templates
Leave Feedback
Login
Logout
Get Started
Browse all Slides
Browse all Slides
Create a FREE Account
Instant access to 1,000+ real slides from top companies like McKinsey, BCG, Goldman Sachs, Google and many more!
First Name
Last Name
Email
Password
I agree to all
Terms & Privacy Policy
Thank you! Your submission has been received!
Oops! Something went wrong while submitting the form.
Have an account?
Sign in
📢 Ready to start building slides? Check out our new template library
VIEW TEMPLATES
Welcome,
Welcome
PRO
Show Featured Only
Checkbox 8
Companies
Mckinsey
Bain
BCG
EY
Deloitte
Accenture
PwC/Strategy&
JP Morgan
Goldman Sachs
Morgan Stanley
Citigroup
Deutsche Bank
Barclays
LEK
KPMG
Kearney
Oliver Wyman
Booz Allen Hamilton
Gartner
IPSOS
Nielsen
Slide type
Text Only
Linear Flow
Vertical Flow
Single Chart
Header Horizontal
Mixed Chart
Header Vertical
Pillar
Multiple Chart
Graphic
Agenda
Title
Table
Framework
Industry
Technology & Software
Artificial Intelligence
Financial Services
Retail & E-commerce
Consumer Goods
Industrial & Manufacturing
Transportation & Logistics
Telecommunications
Real Estate & Construction
Hospitality & Tourism
Professional Services
Education & Training
Media & Entertainment
Agriculture & Food Production
Healthcare & Pharmaceuticals
Environmental Services & Sustainability
Government & Public Sector
Use Case
Mergers and Acquisitions
Performance Metrics and KPIs
Client Case Studies
Competitive Landscape
Corporate Finance and Valuation
Product and Service Analysis
Customer and Market Segmentation
Organizational Structure and Change
Industry Overview
Regulatory and Compliance
Risk Assessment and Management
Investment Analysis
Organizational Structure and Change
Human Resources and Talent Management
Financial Performance
Market Analysis and Trends
Sales and Business Development
Human Resources and Talent Management
Clear all
Thank you! Your submission has been received!
Oops! Something went wrong while submitting the form.
Tag
View slide
This content slide combines a text block discussing job impacts with two column charts. The left chart compares gray and green job changes under LCE scenarios, while the right chart shows total employment deviations from baseline over time.
Human Resources and Talent Management
Professional Services
The slide highlights the job market shifts due to the green transition, projecting job losses in fossil fuel sectors (gray jobs) and job creation in green sectors (green jobs) by 2050. It emphasizes the need for investment in eco-industries to boost employment and manage the transition smoothly.
Green Jobs, Employment, Workforce, Transition, LCE
false
Human Resources and Talent Management
Professional Services professional-services
Multiple Chart
EY
View slide
This slide divides the content into multiple sections, each discussing different market challenges and proposed actions to accelerate the transition to green technologies in SEA.
Market Analysis and Trends
Environmental Services & Sustainability
Provides a detailed analysis of various market challenges and specific actions needed to unlock green opportunities in SEA, emphasizing regulatory and market access improvements to facilitate sustainable practices and investments.
Green Solutions, Market Access, Regulatory Framework, SEA, Sustainability
false
Market Analysis and Trends
Environmental Services & Sustainability environmental-services-and-sustainability
Header Horizontal
Bain
View slide
Circular diagram illustrating the innovation landscape for renewable power integration, covering areas like technology, system operation, market design, and business models.
Technology and Digital Transformation
Environmental Services & Sustainability
The slide presents the interconnected innovations in green technology and renewable power integration. It highlights the synergies between different technologies and business models, emphasizing the role of AI and big data in advancing renewable energy solutions and enhancing system efficiency.
Green Technology, AI, Big Data, Renewable Energy
false
Technology and Digital Transformation
Environmental Services & Sustainability environmental-services-and-sustainability
Diagram
Roland Berger
View slide
The slide juxtaposes text with images of diverse ecosystems and landscapes, employing a balanced layout. Portrays headers that succinctly present data points and summaries.
Strategic Planning
Environmental Services & Sustainability
Summarizes key challenges and actions necessary to scale the green economy, highlighting incentives, risk levers, and the importance of regional collaboration and financial strategies in SEA.
Green economy, decarbonization, SEA, financial strategies, regional collaboration
false
Strategic Planning
Environmental Services & Sustainability environmental-services-and-sustainability
Text Only
Bain
View slide
This slide includes a bar chart with horizontal bars colored in yellow showing various challenges related to green finance. The slide title and the chart caption are prominently displayed at the top.
Regulatory and Compliance
Environmental Services & Sustainability
The bar chart illustrates multiple obstacles for funding ESG initiatives, such as immature market infrastructure, high financing costs, lack of green finance professionals, and market transparency. Each challenge is quantified, indicating the percentage of respondents acknowledging these issues.
Green finance, ESG, Market challenges, Financing costs, Sustainability
false
Regulatory and Compliance
Environmental Services & Sustainability environmental-services-and-sustainability
Single Chart
PwC/Strategy&
View slide
Slide includes a multi-colored heatmap representing various opportunities for developing green finance in Hong Kong. Each bar is differentiated by color corresponding to the level of opportunity.
Market Analysis and Trends
Financial Services
The chart assesses different sectors such as ESG reporting, green bonds, and sustainability funds, indicating the perceived opportunities in each sector. It uses percentages to show the response distribution across significant, moderate, and few opportunities, highlighting areas with potential for growth.
Green finance, ESG, Opportunities, Hong Kong, Market development
false
Market Analysis and Trends
Financial Services financial-services
Table
PwC/Strategy&
View slide
This slide has a bar chart with horizontal bars, each representing a policy area with potential impact on green finance, colored in different shades of orange and gray.
Regulatory and Compliance
Government & Public Sector
Discusses several policy areas that could enhance Hong Kong's green finance competitiveness, like updating local tax policies, developing digital solutions for ESG reporting, and collaborating internationally on ESG data sharing. The importance of each area is measured by survey responses over two years.
Green finance, Policy, Subsidies, Tax, Hong Kong
false
Regulatory and Compliance
Government & Public Sector government-and-public-sector
Single Chart
PwC/Strategy&
View slide
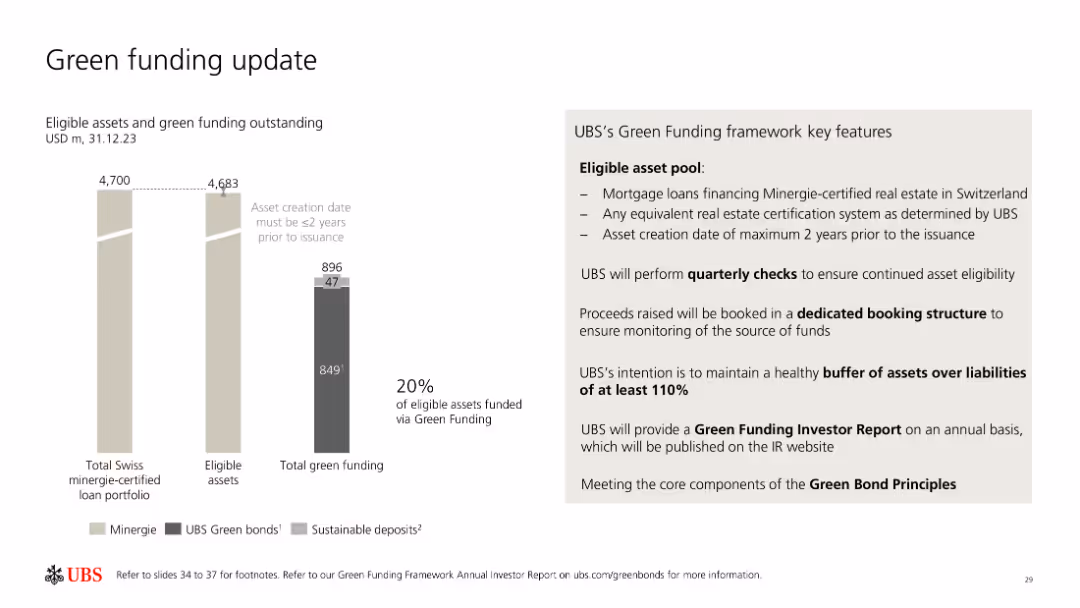
The slide includes bar charts and a list outlining UBS's green funding metrics, eligible asset pool, and key features of their green funding framework.
Investment Analysis
Financial Services
UBS provides an update on their green funding, detailing eligible assets, green bonds, sustainable deposits, and the framework for maintaining and monitoring green funding.
Green funding, UBS, sustainable assets, framework, bonds
false
Investment Analysis
Financial Services financial-services
Mixed Chart
UBS
View slide
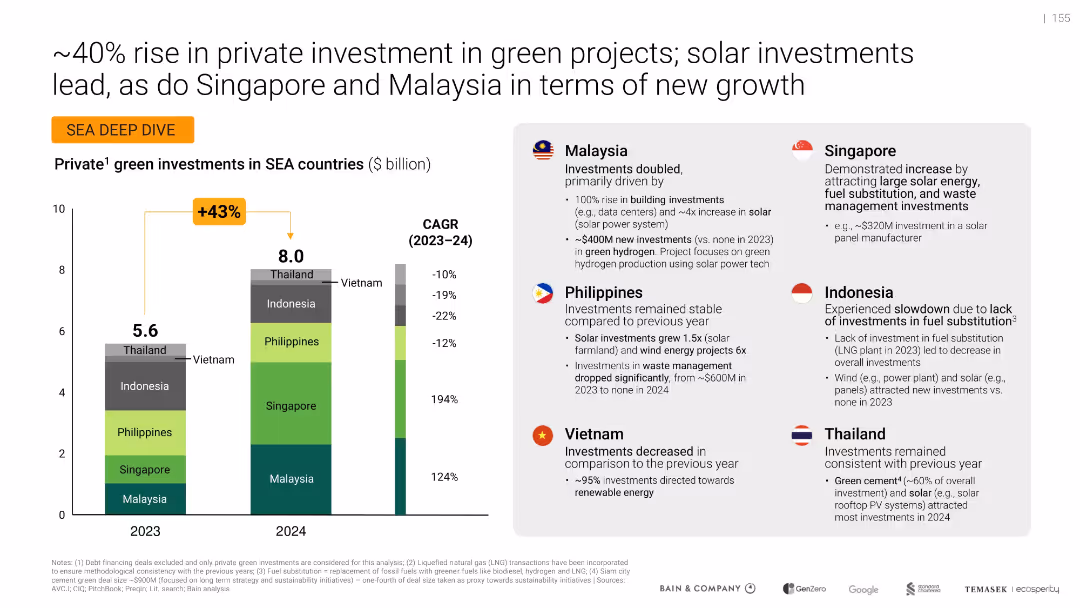
Bar graph on green investment per SEA country, side panel with country-specific insights using icons and flags
Investment Analysis
Environmental Services & Sustainability
Highlights a 43% increase in green investments across SEA countries from 2023 to 2024, driven mainly by Malaysia and Singapore. Provides country-specific breakdowns of contributing factors such as solar energy and data center investments.
Green investment, SEA countries, Malaysia, Singapore, Solar energy, Renewable, Growth, CAGR, Infrastructure, Hydrogen
false
Investment Analysis
Environmental Services & Sustainability environmental-services-and-sustainability
Mixed Chart
Bain
View slide
Column chart on right showing emission reduction, text with bullet points on the left
Strategic Planning
Environmental Services & Sustainability
Highlights EY's efforts to reduce CO2 emissions from air travel, outlining strategies and goals
Green mobility, CO2 reduction, travel, emissions, EY
false
Strategic Planning
Environmental Services & Sustainability environmental-services-and-sustainability
Mixed Chart
EY
View slide
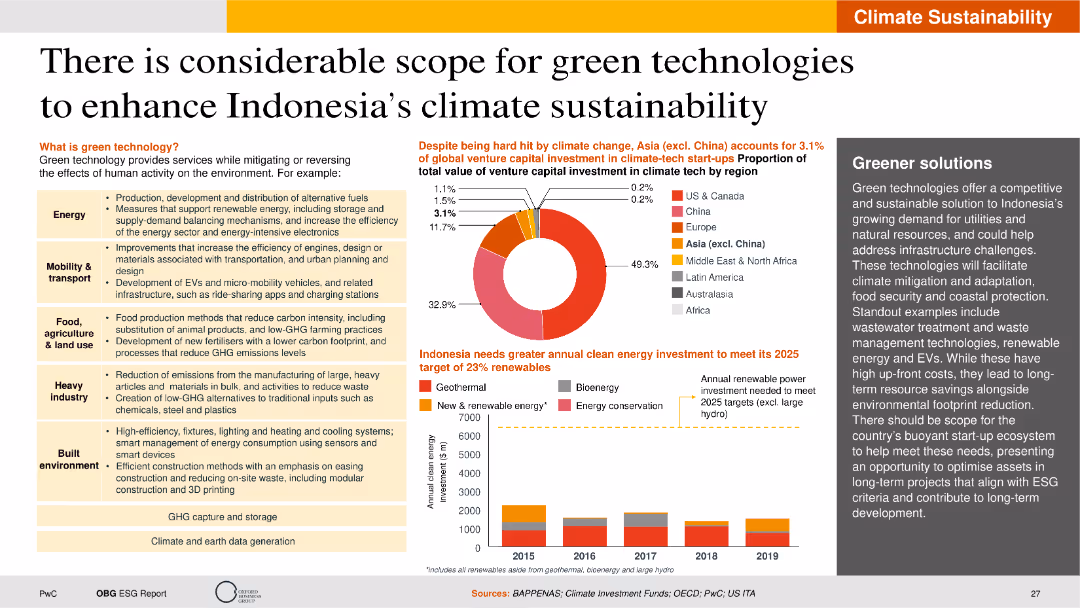
The slide is visually detailed with pie charts, bar charts, and text boxes. It highlights the scope of green technologies in various sectors, including energy, transportation, and agriculture.
Technology and Digital Transformation
Technology & Software
The slide explores the potential of green technologies to improve Indonesia's climate sustainability. It covers various sectors such as energy, mobility, agriculture, and the built environment, highlighting the benefits of green technologies in mitigating environmental impacts. The slide also presents data on venture capital investments in climate tech and the necessary investments for Indonesia to meet its renewable energy targets by 2025.
Green technology, climate sustainability, venture capital, renewable energy, mitigation
false
Technology and Digital Transformation
Technology & Software technology-and-software
Multiple Chart
PwC/Strategy&
View slide
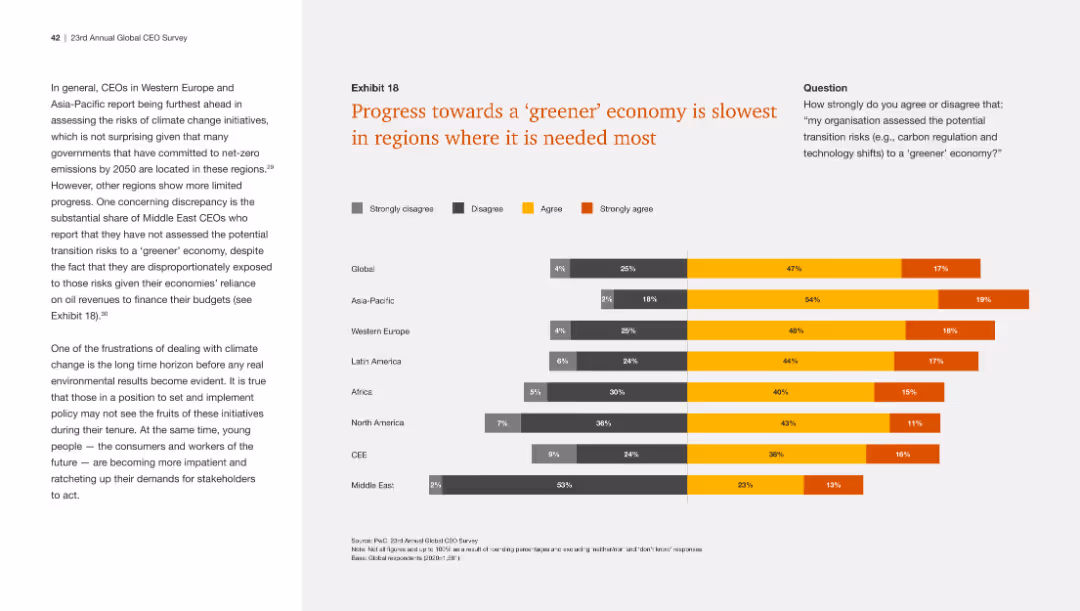
Bar chart displaying agreement on the organization's assessment of potential transition risks to a greener economy by global region, with a focus on the Middle East.
Market Analysis and Trends
Environmental Services & Sustainability
The slide discusses the slow progress towards a greener economy in various regions, with the Middle East showing the least agreement on assessing transition risks.
Greener economy, transition risks, regions, Middle East, assessment
false
Market Analysis and Trends
Environmental Services & Sustainability environmental-services-and-sustainability
Mixed Chart
PwC/Strategy&
View slide
The slide shows multiple charts: a bar chart for investment percentages in greenfield initiatives, a column chart for investment constraints, and a column chart for quality perception of PPP tenders.
Market Analysis and Trends
Real Estate & Construction
This slide evaluates the attractiveness of greenfield infrastructure investments in Italy, focusing on the allocation of financing, perceived investment constraints, and the quality of PPP tenders compared to EU averages.
Greenfield, infrastructure, Italy, investment, PPP tenders
false
Market Analysis and Trends
Real Estate & Construction real-estate-and-construction
Multiple Chart
EY
View slide
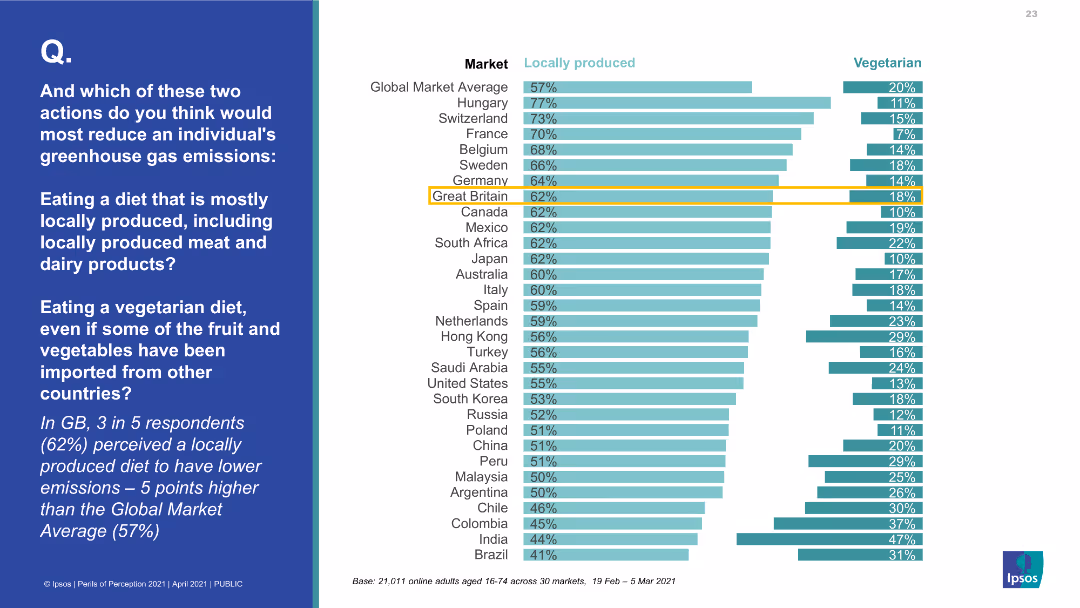
This slide contains a horizontal bar chart comparing two actions to reduce greenhouse gas emissions across various markets, with data points shown for each country.
Market Analysis and Trends
Environmental Services & Sustainability
The slide provides comparative data on the perceived effectiveness of locally produced diets versus vegetarian diets in reducing greenhouse gas emissions across different countries. It emphasizes that local diets are often seen as better despite evidence to the contrary.
Greenhouse gas emissions, diet comparison, vegetarian, local produce, market analysis
false
Market Analysis and Trends
Environmental Services & Sustainability environmental-services-and-sustainability
Multiple Chart
IPSOS
View slide
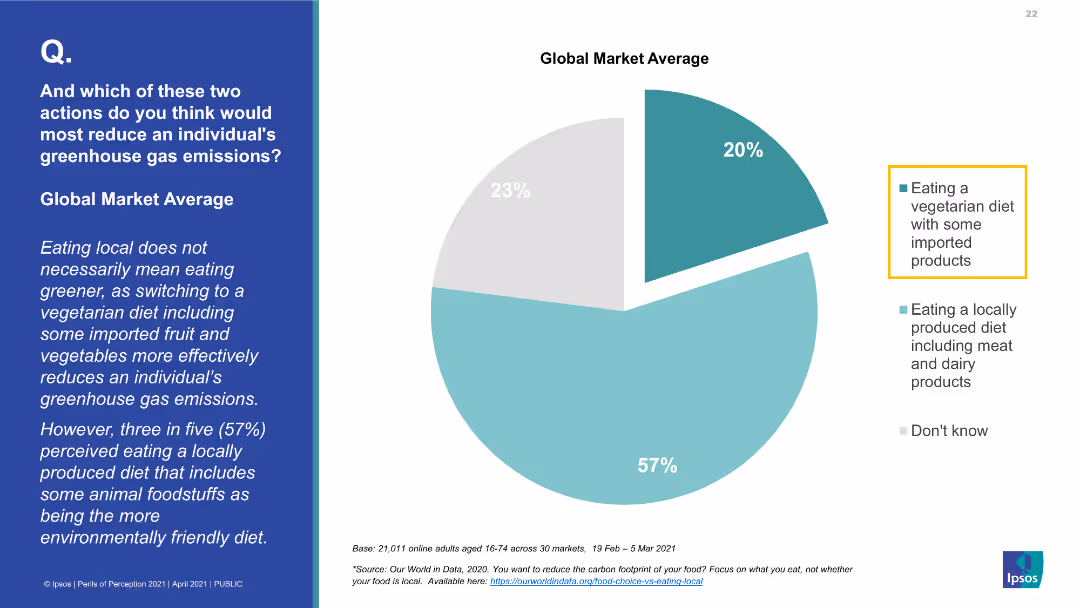
This slide features a pie chart with three segments: 20% for eating a vegetarian diet with some imported products, 57% for eating a locally produced diet including meat and dairy products, and 23% for don't know. The left side includes a textual explanation.
Market Analysis and Trends
Environmental Services & Sustainability
The slide compares perceptions of diet choices that reduce greenhouse gas emissions. It highlights that a locally produced diet is perceived as more environmentally friendly by 57% of respondents, despite evidence suggesting a vegetarian diet with some imports is greener.
Greenhouse gas emissions, diet, vegetarian, local produce, environmental impact
false
Market Analysis and Trends
Environmental Services & Sustainability environmental-services-and-sustainability
Mixed Chart
IPSOS
View slide
The slide presents moderate visual complexity with a balance of graphical elements showcasing greenhouse gas emissions data and text explaining alternative fuel use and activity footprint reduction. The layout integrates visuals and information effectively, with color coding to highlight different sections.
Technology and Digital Transformation
Industrial & Manufacturing
This slide elaborates on how the process industries' significant greenhouse gas emissions can be managed through the use of alternative fuels or the reduction of activity footprints via automation. It outlines various strategies for improving energy efficiency, reducing emissions, and the role of automation technologies in achieving these goals.
Greenhouse gas management, Automation in emissions reduction, Energy efficiency, Industrial process optimization
false
Technology and Digital Transformation
Industrial & Manufacturing industrial-and-manufacturing
Single Chart
LEK
View slide
The slide features a bar chart comparing system adequacy – loss of load expectations (LOLE) for various countries (Ireland, Germany, Belgium, US, France, UK) expected in 2025, measured in hours/year. Key points about the importance of building a flexible grid are also included.
Strategic Planning
Energy & Utilities
This slide discusses the challenges in building a flexible and intelligent energy grid to handle the increasing load from renewable energy sources. It compares the projected system adequacy across several countries, highlighting the urgent need for grid modernization.
Grid, Flexibility, Intelligent, Energy, LOLE, 2025, Renewable
false
Strategic Planning
Energy & Utilities energy-and-utilities
Mixed Chart
EY
View slide
Column charts showing total revenues and profit before tax for different regions, with additional text explanations.
Financial Performance
Financial Services
Details the financial performance by region for Q3 2022, highlighting revenues and profits across various geographies.
Group results, regions, financial performance, UBS, 3Q22, revenues, profit, cost/income ratio
false
Financial Performance
Financial Services financial-services
Multiple Chart
UBS
View slide
This slide features a single column chart with textual explanations beside it. The slide layout is simple, showing the breakdown of profit before tax for different groups.
Financial Performance
Financial Services
This slide explains the financial performance of different group functions within the organization, detailing profit before tax and other related financial impacts.
Group, Functions, Profit, Breakdown, Tax
false
Financial Performance
Financial Services financial-services
Mixed Chart
UBS
View slide
Showcases a composite stacked column chart detailing average deposits by branch age cohort, contrasting industry with Chase.
Strategic Planning
Financial Services
Explains the growth in the bank's deposit base and branch network's role as a long-term growth engine, with future deposit projections.
Growth Engine, Branch Network, Deposit Analysis, Financial Planning, Long-Term Strategy, Market Share
false
Strategic Planning
Financial Services financial-services
Single Chart
JP Morgan
View slide
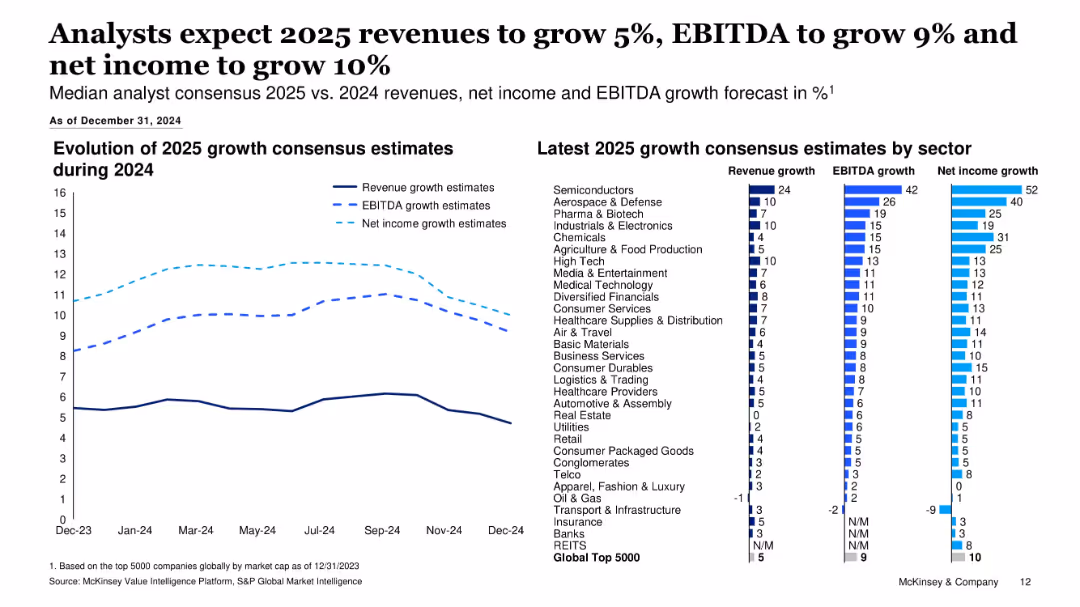
Combination of line chart and bar chart; left side tracks consensus growth estimate evolution, right side shows sector-specific 2025 growth forecasts.
Financial Performance
Financial Services
This slide outlines 2025 growth expectations for revenue, EBITDA, and net income across major sectors. Analysts forecast moderate growth, with semiconductors leading in all three metrics. Visuals show how estimates evolved over 2024.
Growth Forecast, Revenue, EBITDA, Net Income, 2025 Estimates, Sector Analysis, Consensus Estimates, Financial Performance
false
Financial Performance
Financial Services financial-services
Multiple Chart
McKinsey
View slide
Includes two line graphs illustrating pre-tax income projections over a timeline, with legends and annotations.
Investment Analysis
Financial Services
Discusses future income estimates related to growth initiatives, aiming for a positive return on investment, suitable for investor relations or financial planning.
Growth Initiatives, Income Projections, Investment, ROI, Financial Planning, Trends, Analysis
false
Investment Analysis
Financial Services financial-services
Single Chart
Goldman Sachs
View slide
Combines text and icons to outline industry trends and growth opportunities, focusing on tech and analytics, and IPO market evolution.
Strategic Planning
Technology & Software
Identifies growth opportunities in a changing industry landscape, focusing on technological advancements and market evolution.
Growth Opportunities, Industry Trends, Technology, IPO Market, Private Capital, International Expansion, Digital Transformation
false
Strategic Planning
Technology & Software technology-and-software
Table
JP Morgan
View slide
Pie charts illustrating the classification success rate of machine learning models on company growth categories.
Market Analysis and Trends
Financial Services
Discusses the segmentation of companies based on their growth profitability and the effectiveness of machine learning models.
Growth segmentation, machine learning, profitability, classification success
false
Market Analysis and Trends
Financial Services financial-services
Mixed Chart
Accenture
View slide
Structured around icons and bullet points focusing on strategies for wealth management and private banking.
Strategic Planning
Financial Services
Outlines JPMorgan's growth strategies for the next decade in asset management, including expanding and building new financial products.
Growth strategies, asset management, wealth management, private banking, financial planning, market expansion
false
Strategic Planning
Financial Services financial-services
Pillar
JP Morgan
View slide
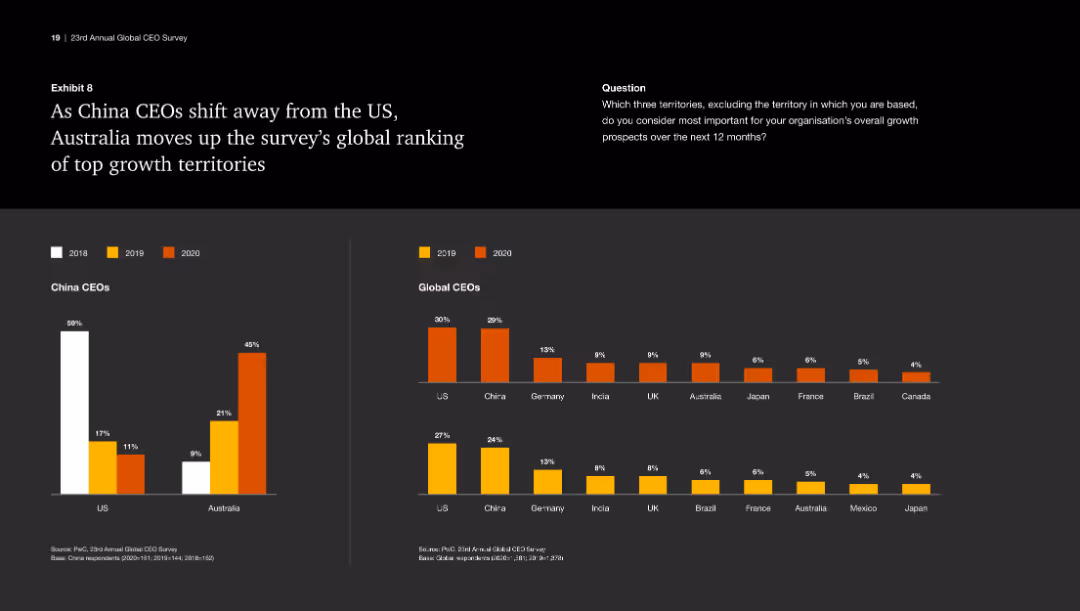
This slide features a column chart showing the ranking of US and Australia in terms of attractiveness to China CEOs from 2018 to 2020. It uses color to differentiate each year.
Market Analysis and Trends
Industrial & Manufacturing
The slide highlights the shift of China CEOs' preference from the US to Australia as a top growth territory, showcasing the rankings and changes over the years.
Growth territories, China CEOs, Australia, US, ranking
false
Market Analysis and Trends
Industrial & Manufacturing industrial-and-manufacturing
Multiple Chart
PwC/Strategy&
View slide
This slide features a line chart with annotations for specific years and acquisitions, a sidebar with bullet points emphasizing revenue growth, and a company logo. The color scheme is blue, green, and black on a white background. The chart is the central visual element, with textual information in the sidebar presented in a clear, hierarchical layout with the use of bold fonts and contrasting colors.
Financial Performance
Industrial & Manufacturing
The slide illustrates the company's economic revenue growth over the years, highlighting significant acquisitions. The sidebar emphasizes a nine-fold increase in revenue since 2000, with equal contributions from organic growth and mergers and acquisitions. It appears to be used for showcasing the company's financial growth trajectory and strategic acquisitions to stakeholders or investors.
Growth, Acquisitions, Revenue, Organic, M&A, Economic, Line Chart, Annotations, Industrial, Strategic
false
Financial Performance
Industrial & Manufacturing industrial-and-manufacturing
Single Chart
Goldman Sachs
View slide
Column chart showing growth, company logos, red stamped labels
Mergers and Acquisitions
Industrial & Manufacturing
Strategies and outcomes of LANXESS's acquisitions
Growth, Acquisitions, Synergy, Integration, Consumer Protection
false
Mergers and Acquisitions
Industrial & Manufacturing industrial-and-manufacturing
Header Vertical
Morgan Stanley
View slide
A series of blocks and arrows outline the current state and a 5-year growth plan, with textual and numerical information in a clear, linear fashion. The color scheme is predominantly blue with white text for readability.
Financial Performance
Financial Services
Describes a pro forma simulation for third-party growth, balance sheet management, and future fee-earning potential, including plans for asset under supervision (AUS) growth and capital strategy.
Growth, Balance Sheet, Pro Forma, AUS, Capital
false
Financial Performance
Financial Services financial-services
Table
Goldman Sachs
View slide
This slide focuses on growth strategies through deepening client relationships and seizing market trends, with circular icons and bar chart. The design is clean, and the color theme is consistent with other slides, using shades of blue and white.
Strategic Planning
Financial Services
Detailing strategies for client relationship growth and trend adaptation, this JPMorgan Chase slide showcases investment areas such as data analytics and technology solutions. Suitable for strategic discussions on market trends, client engagement, and innovation in service offerings, particularly in private equity and debt.
Growth, Client Relationships, Market Trends, Data Analytics, Innovative Solutions, Private Equity, Private Debt, Traditional Assets
false
Strategic Planning
Financial Services financial-services
Multiple Chart
JP Morgan
Previous
Loading...
Hold On!
We are searching in our database
If nothing, comes up, please try different filters!
Column Chart
Heatmap
Chevron
Org Chart
Infographic
Callouts
Timeline
List
Graphic
Picture
Process Flow
Diagram
Paragraph
Map
Table
Framework
Subtitle
Takeaway Box
Icon
Other Chart
Radar Chart
Waterfall Chart
Mekko Chart
Pie Chart
Scatter Plot
Line Chart
Bar chart
Bullet points
Create a FREE account to continue browsing
Receive Instant Access to 1,000+ slides from companies like McKinsey, Google, and Goldman Sachs
First Name
Last Name
Email
Password
I agree to all
Terms & Privacy Policy
Thank you! Your submission has been received!
Oops! Something went wrong while submitting the form.
Have an account?
Sign in
Upgrade to PRO to Save slides
Advanced Search and Filters
Access to 15,000+ slides
Access to Category Pages
Save/Bookmark Slides
PowerPoint Template Library
Pick a Plan
MONTHLY
$12/month
Billed every month, Cancel anytime.
YEARLY
$9/year
Billed $108 annually, Cancel anytime.
Checkout for $12/month
Checkout for $108/yr
Secured by Stripe | AES-256 bit encryption