My Account
My Slides
Search by Category
Templates
Leave Feedback
Login
Logout
Get Started
Browse all Slides
Browse all Slides
Create a FREE Account
Instant access to 1,000+ real slides from top companies like McKinsey, BCG, Goldman Sachs, Google and many more!
First Name
Last Name
Email
Password
I agree to all
Terms & Privacy Policy
Thank you! Your submission has been received!
Oops! Something went wrong while submitting the form.
Have an account?
Sign in
📢 Ready to start building slides? Check out our new template library
VIEW TEMPLATES
Welcome,
Welcome
PRO
Show Featured Only
Checkbox 8
Companies
Mckinsey
Bain
BCG
EY
Deloitte
Accenture
PwC/Strategy&
JP Morgan
Goldman Sachs
Morgan Stanley
Citigroup
Deutsche Bank
Barclays
LEK
KPMG
Kearney
Oliver Wyman
Booz Allen Hamilton
Gartner
IPSOS
Nielsen
Slide type
Text Only
Linear Flow
Vertical Flow
Single Chart
Header Horizontal
Mixed Chart
Header Vertical
Pillar
Multiple Chart
Graphic
Agenda
Title
Table
Framework
Industry
Technology & Software
Artificial Intelligence
Financial Services
Retail & E-commerce
Consumer Goods
Industrial & Manufacturing
Transportation & Logistics
Telecommunications
Real Estate & Construction
Hospitality & Tourism
Professional Services
Education & Training
Media & Entertainment
Agriculture & Food Production
Healthcare & Pharmaceuticals
Environmental Services & Sustainability
Government & Public Sector
Use Case
Mergers and Acquisitions
Performance Metrics and KPIs
Client Case Studies
Competitive Landscape
Corporate Finance and Valuation
Product and Service Analysis
Customer and Market Segmentation
Organizational Structure and Change
Industry Overview
Regulatory and Compliance
Risk Assessment and Management
Investment Analysis
Organizational Structure and Change
Human Resources and Talent Management
Financial Performance
Market Analysis and Trends
Sales and Business Development
Human Resources and Talent Management
Clear all
Thank you! Your submission has been received!
Oops! Something went wrong while submitting the form.
Tag
View slide
Two large bar charts comparing revenue and EBIT variations of luxury brands from 2014 to 2017, emphasizing the cost of growth.
Financial Performance
Consumer Goods
Highlights the increasing cost of growth for luxury brands over recent years, using revenue and profit metrics to discuss financial sustainability.
Growth, Cost, Luxury Brands
false
Financial Performance
Consumer Goods consumer-goods
Multiple Chart
Bain
View slide
The slide uses a mix of bar and column charts to present data on different levers for operations efficiency radar related to product portfolio.
Strategic Planning
Industrial & Manufacturing
The slide details key levers for growth and customer focus in product portfolios, showing activities and trends over time.
Growth, Customer Focus, Efficiency, Product Portfolio
false
Strategic Planning
Industrial & Manufacturing industrial-and-manufacturing
Single Chart
Roland Berger
View slide
Column chart of profit distribution, infographic elements
Financial Performance
Financial Services
Santander's growth in customer focus and diversification
Growth, Diversification, Customer Focus, Banking, Profit
false
Financial Performance
Financial Services financial-services
Mixed Chart
Morgan Stanley
View slide
The slide highlights Gartner’s growth with icons and figures representing revenues, countries, and associates. It lists accolades and major enterprise functions served.
Industry Overview
Professional Services
It provides an overview of Gartner’s growth, market presence, and the value it delivers through actionable insights and serving major enterprise functions.
Growth, Gartner, revenues, associates, enterprise functions, insights
false
Industry Overview
Professional Services professional-services
Pillar
Gartner
View slide
Contains a column chart with multiple bars representing market growth rates in various luxury goods categories such as shoes, jewelry, and bags from 2016 to 2017.
Market Analysis and Trends
Retail & E-commerce
Highlights growth trends in different luxury product categories, showing how key segments like jewelry and beauty products are driving industry growth.
Growth, Luxury Goods, Analysis
false
Market Analysis and Trends
Retail & E-commerce retail-and-e-commerce
Single Chart
Bain
View slide
The slide features a column chart displaying rolling three-year net new assets in billions ($Bn) from 2016-2018 to 2021-2023, with bars increasing in height from left to right.
Financial Performance
Financial Services
The slide demonstrates Morgan Stanley's strong growth in net new assets over three-year periods, highlighting significant increases from 2016-2018 to 2021-2023.
Growth, Net New Assets, Financial Performance, Morgan Stanley, Column Chart, 2016-2023, Billion Dollars, Increasing Trend
false
Financial Performance
Financial Services financial-services
Single Chart
Morgan Stanley
View slide
A graphically intensive slide illustrating growth opportunities and textual information on a dark background.
Investment Analysis
Financial Services
This slide outlines the estimated growth opportunities across different financial sectors, highlighting the engineering support for these initiatives.
Growth, Opportunities, Franchise, Investing, Banking, Revenue, Engineering
false
Investment Analysis
Financial Services financial-services
Vertical Flow
Goldman Sachs
View slide
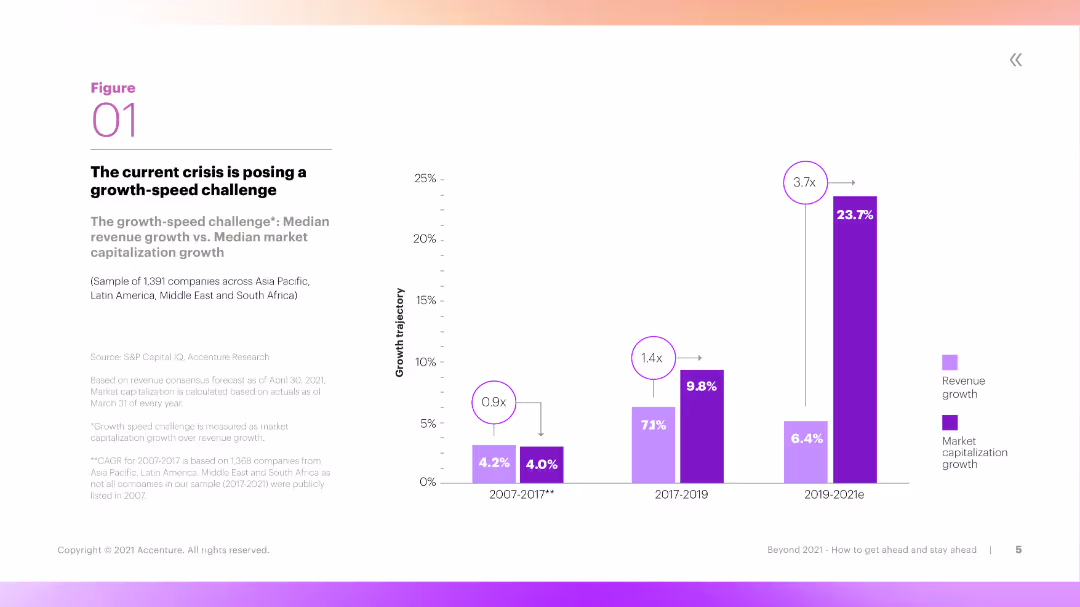
This slide features a column chart comparing median revenue growth and median market capitalization growth over three periods. The chart uses vibrant colors and clear labels to differentiate the data sets.
Market Analysis and Trends
Financial Services
The slide discusses the 'growth-speed challenge,' comparing revenue growth with market capitalization growth across three time periods. It highlights the challenges companies face in maintaining growth during crises.
Growth, Revenue, Market Capitalization, Crisis, Challenge
false
Market Analysis and Trends
Financial Services financial-services
Mixed Chart
Accenture
View slide
The slide features bar graphs depicting e-commerce, online travel, transport & food, and online media sectors. Use of blue shades, minimalistic design.
Market Analysis and Trends
Technology & Software
This slide illustrates the growth in various sectors of Singapore’s economy post-2020, highlighting a healthy surge with future projections.
Growth, Sectors, Singapore, Projections, eCommerce, Travel, Food, Media, 2025, Recovery
false
Market Analysis and Trends
Technology & Software technology-and-software
Multiple Chart
Bain
View slide
This slide presents three strategic focus areas—Scale & Efficiency, Comprehensive Client Solutions, and Investing for the Future—each with icons and bullet points. The design is sleek with plenty of whitespace, balancing text and visual elements such as icons.
Strategic Planning
Financial Services
JPMorgan Chase's slide outlines its strategy for business and client growth, detailing operational efficiency through technology, client solution delivery, and investment for future needs. It could be used to communicate to stakeholders about ongoing and future strategic initiatives, emphasizing areas like ETFs, digital assets, and data solutions for sustaining and enhancing market presence.
Growth, Strategy, Efficiency, ETFs, Alternatives, Digital Assets, Data Solutions, Technology, Investment, Clients
false
Strategic Planning
Financial Services financial-services
Pillar
JP Morgan
View slide
Checkmarks adjacent to key strategic and financial criteria, presented in a clean, bulleted format.
Investment Analysis
Financial Services
Criteria for assessing new growth opportunities, useful for strategic decision-making or investment opportunity analysis.
Growth, Strategy, Financial Stability, Investment, Evaluation, Criteria
false
Investment Analysis
Financial Services financial-services
Table
Goldman Sachs
View slide
It has a four-part grid layout each with its icon and text, combination of column and line charts discussing opportunities and leveraging strategies within various aspects of the industry.
Strategic Planning
Financial Services
Identifies organic growth opportunities in investment banking across regions, products, clients, and sectors, outlining areas for potential expansion and the current #1 rankings to maintain and strengthen.
Growth, Strategy, Investment Banking, Clients
false
Strategic Planning
Financial Services financial-services
Multiple Chart
JP Morgan
View slide
This slide includes a column chart series showing trends over years and a separate opportunity section with two vertical bar charts. There are icons with brief text descriptions at the bottom, and the design is structured with a mix of blue tones.
Financial Performance
Financial Services
The slide depicts strategic growth through advisor hiring, client referrals, and assets, along with investment in future planning, innovation, and market awareness, showcasing trends and future opportunities in the private banking sector.
Growth, Strategy, Investment, Banking, Trends, Opportunities, Innovation, Planning, Financial Services, Market Share
false
Financial Performance
Financial Services financial-services
Multiple Chart
JP Morgan
View slide
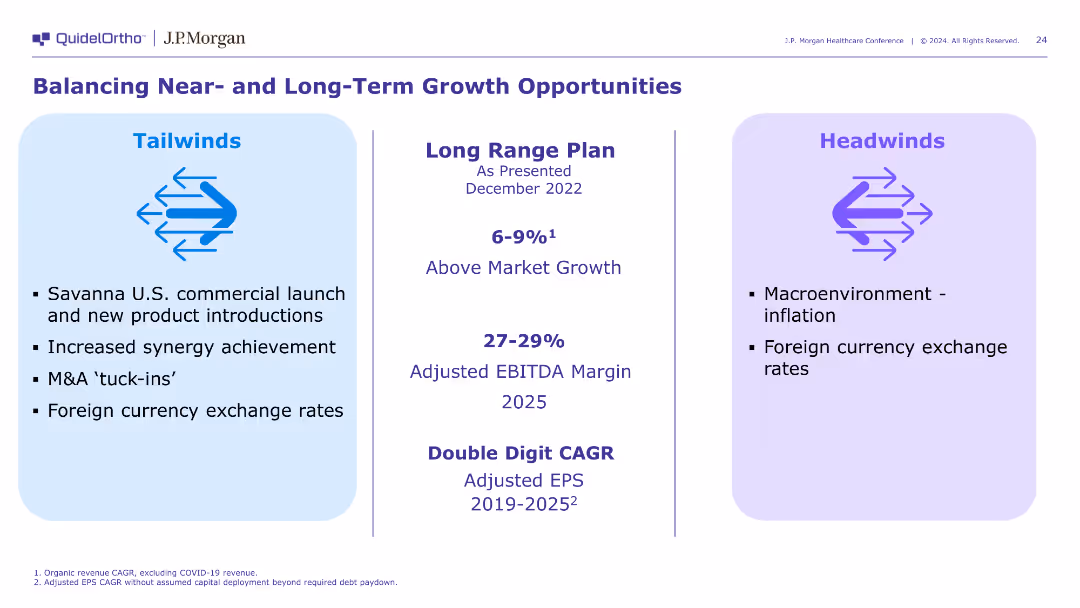
This slide is divided into three sections: Tailwinds, Long Range Plan, and Headwinds. It uses bullet points and a simple layout with blue and purple highlights for clarity.
Strategic Planning
Healthcare & Pharmaceuticals
Discusses the strategic planning and growth opportunities for QuidelOrtho, focusing on market tailwinds, long-term growth plans, and potential headwinds affecting the business.
Growth, Strategy, Planning, Tailwinds, Headwinds
false
Strategic Planning
Healthcare & Pharmaceuticals healthcare-and-pharmaceuticals
Header Horizontal
JP Morgan
View slide
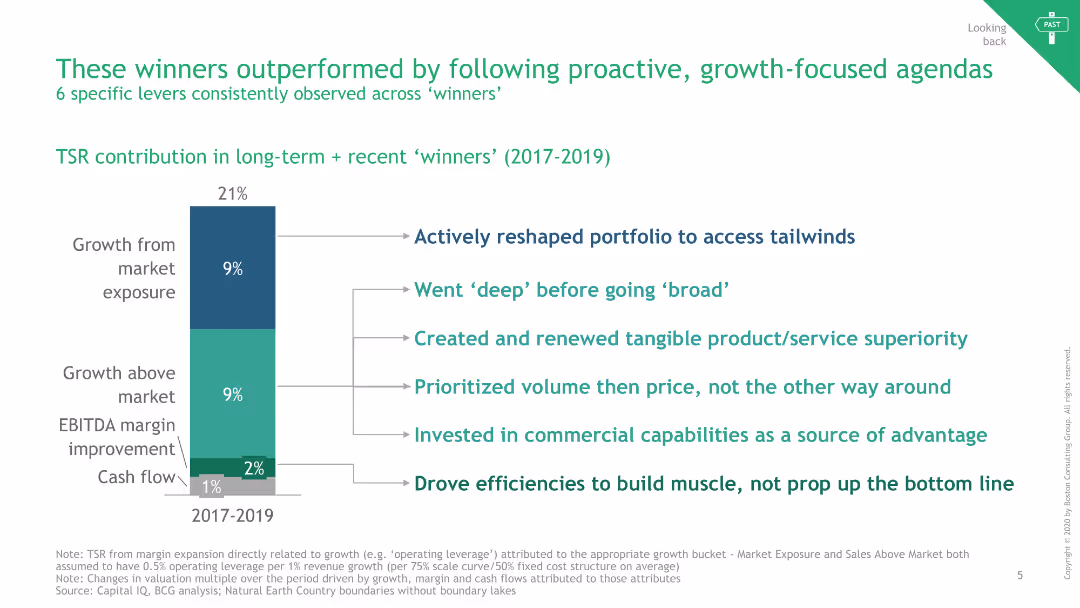
The slide features a vertical bar chart showing TSR contributions and bullet points listing six growth-focused strategies.
Strategic Planning
Consumer Goods
It outlines six levers consistently observed across high-performing companies, emphasizing proactive and growth-focused agendas.
Growth, TSR, Strategies, Proactive, FMCG
false
Strategic Planning
Consumer Goods consumer-goods
Mixed Chart
BCG
View slide
This slide features two column charts comparing firmwide management fees and AUS across several years. It is informative with additional key figures and growth opportunities listed, emphasizing on the increasing trend in a visually distinct manner with the use of color and size.
Financial Performance
Financial Services
Analyzes growth in management fees and AUS, showcasing the firm's growing financial stature and market opportunities, suitable for financial planning and forecasting discussions.
Growth, management fees, AUS, financial analysis
false
Financial Performance
Financial Services financial-services
Mixed Chart
Goldman Sachs
View slide
Comparison of core client relationships and wealth held away from 2019 to 1Q 2022, shown with increase multipliers. Clean design with blue and green color coding.
Market Analysis and Trends
Financial Services
Illustrates the growth of Morgan Stanley's business and the concurrent expansion of market opportunity over time.
Growth, market opportunity, Morgan Stanley, core client relationships, wealth management, expansion
false
Market Analysis and Trends
Financial Services financial-services
Multiple Chart
Goldman Sachs
View slide
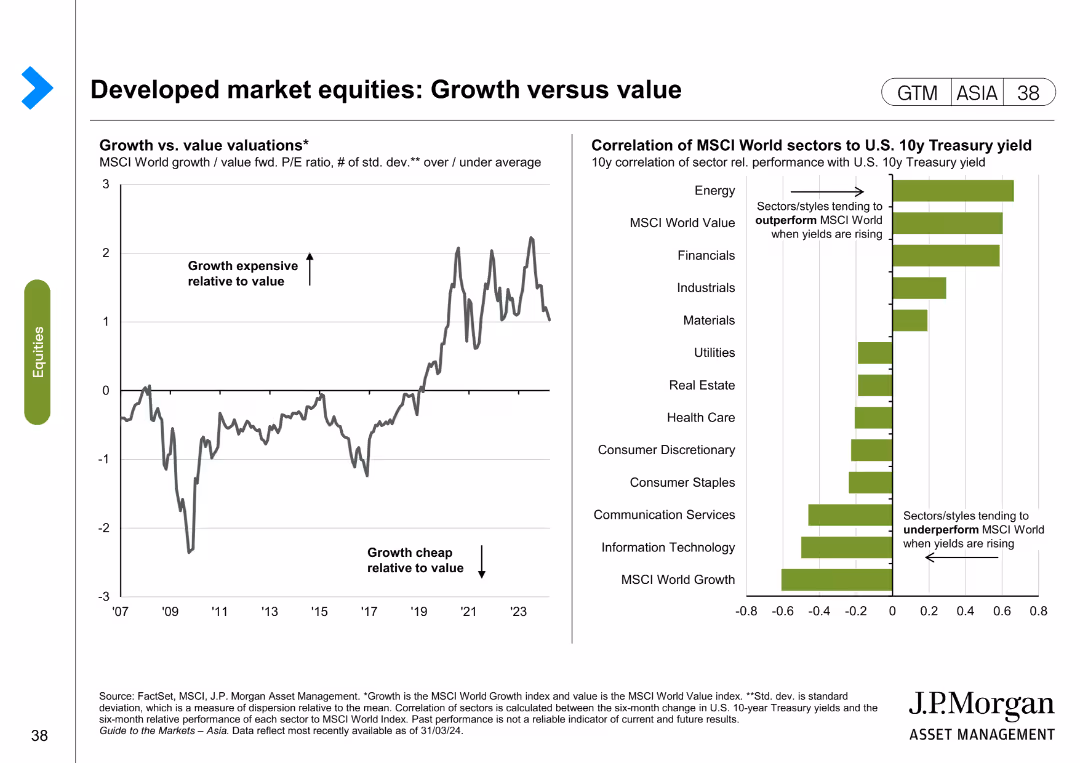
The left side of the slide presents a line chart showing the growth vs. value valuations over time, and the right side features a bar chart illustrating the correlation of MSCI World sectors to U.S. 10-year Treasury yield.
Market Analysis and Trends
Financial Services
The slide compares growth and value valuations in developed markets, highlighting trends and sector correlations with Treasury yields. It is used to identify market trends and investment opportunities.
Growth, value, developed markets, MSCI, Treasury yield, market trends, investment, sector correlation
false
Market Analysis and Trends
Financial Services financial-services
Multiple Chart
JP Morgan
View slide
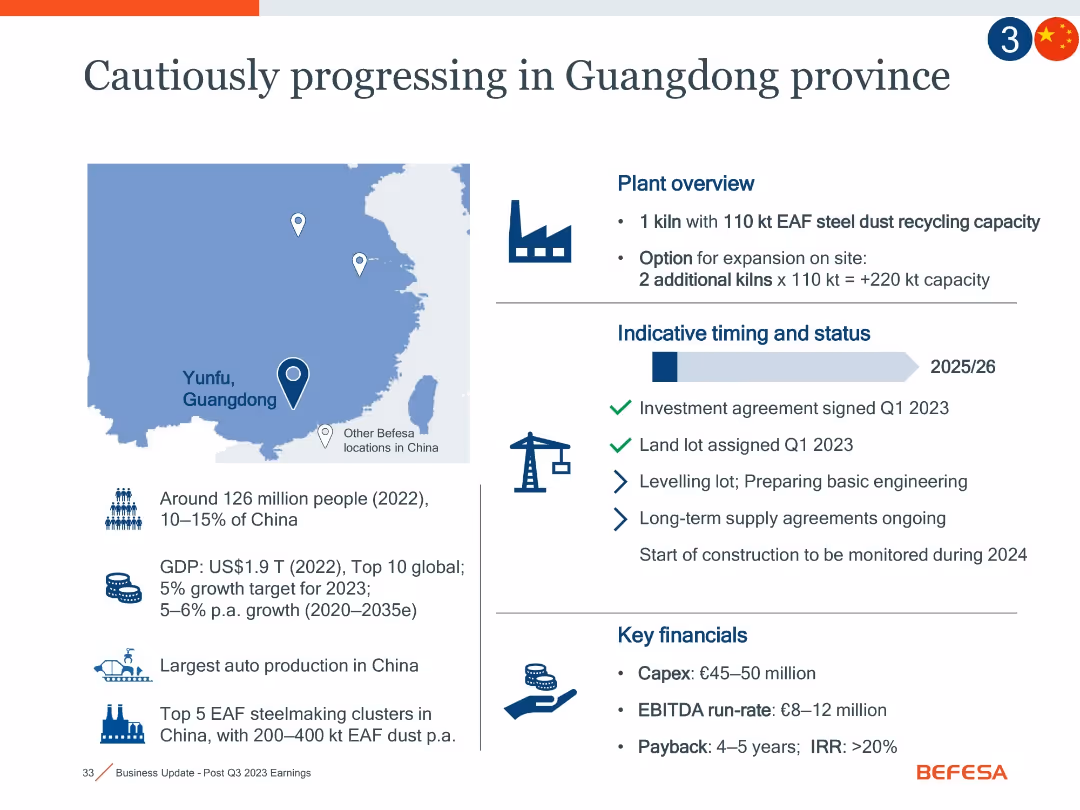
Left map with text on demographics, right section on plant overview and timing, plus bottom right financial metrics.
Strategic Planning
Industrial & Manufacturing
The slide discusses a new steel dust recycling plant in Yunfu, Guangdong, China. It outlines the strategic importance, growth potential of the region, and phased investment. Expected Capex is €45–50m with EBITDA of €8–12m. Timeline extends to 2025/26.
Guangdong, China, steel dust, EAF, Capex, recycling, market potential
false
Strategic Planning
Industrial & Manufacturing industrial-and-manufacturing
Mixed Chart
Goldman Sachs
View slide
Split layout with map of China, project highlights, and project status; uses icons, bullet points, and project financials
Investment Analysis
Industrial & Manufacturing
Details Befesa’s strategic expansion in Guangdong with one operational kiln and options for two more. Lists project timing, financials, regional strengths (auto/steel), and status of land and supply agreements.
Guangdong, kiln, investment, recycling, project timeline, capex, EBITDA, steel dust, expansion
false
Investment Analysis
Industrial & Manufacturing industrial-and-manufacturing
Mixed Chart
Goldman Sachs
View slide
Bullet lists for revenue, expenses, cost of credit, and tax rate forecasts
Strategic Planning
Financial Services
Financial projections and strategic guidance for the fiscal year
Guidance, Financial Projections, Strategy, Revenue, Expenses, Tax, Financials
false
Strategic Planning
Financial Services financial-services
Table
Citigroup
View slide
Contains stacked column charts, along with a side panel for drivers, presenting revenue and expense guidance and their influencing factors. Uses a blue and gray palette.
Strategic Planning
Financial Services
Communicates revenue and expense projections for 2022, alongside the drivers for each, which includes interest rates and investment banking. This slide can be used for strategic financial planning meetings or investor relations updates.
Guidance, Revenue, Expenses, Strategic Planning, Financial, Interest Rates, Investment Banking
false
Strategic Planning
Financial Services financial-services
Multiple Chart
Citigroup
View slide
The slide features a flow chart detailing the H-vision project's value chain and potential partners, categorized into supply, production, distribution, end-use, and evacuation.
Strategic Planning
Energy & Utilities
The slide outlines the H-vision project aiming to develop a blue hydrogen economy in Rotterdam by 2050. It includes the project's scope, objectives, context, and identifies key partners involved in the supply chain and production processes.
H-vision, partners, hydrogen, Rotterdam, value chain
false
Strategic Planning
Energy & Utilities energy-and-utilities
Vertical Flow
Kearney
View slide
This slide features a bar graph showing the net present value (NPV) build-up for the H-vision project, including revenue, costs, and subsidies required for profitability.
Investment Analysis
Energy & Utilities
The slide illustrates the financial requirements and expected profitability of the H-vision project in the reference scenario, highlighting the need for a €0.7 billion subsidy and the avoided cost of ETS certificates to achieve economic viability.
H-vision, subsidy, NPV, investment, profitability
false
Investment Analysis
Energy & Utilities energy-and-utilities
Mixed Chart
Kearney
View slide
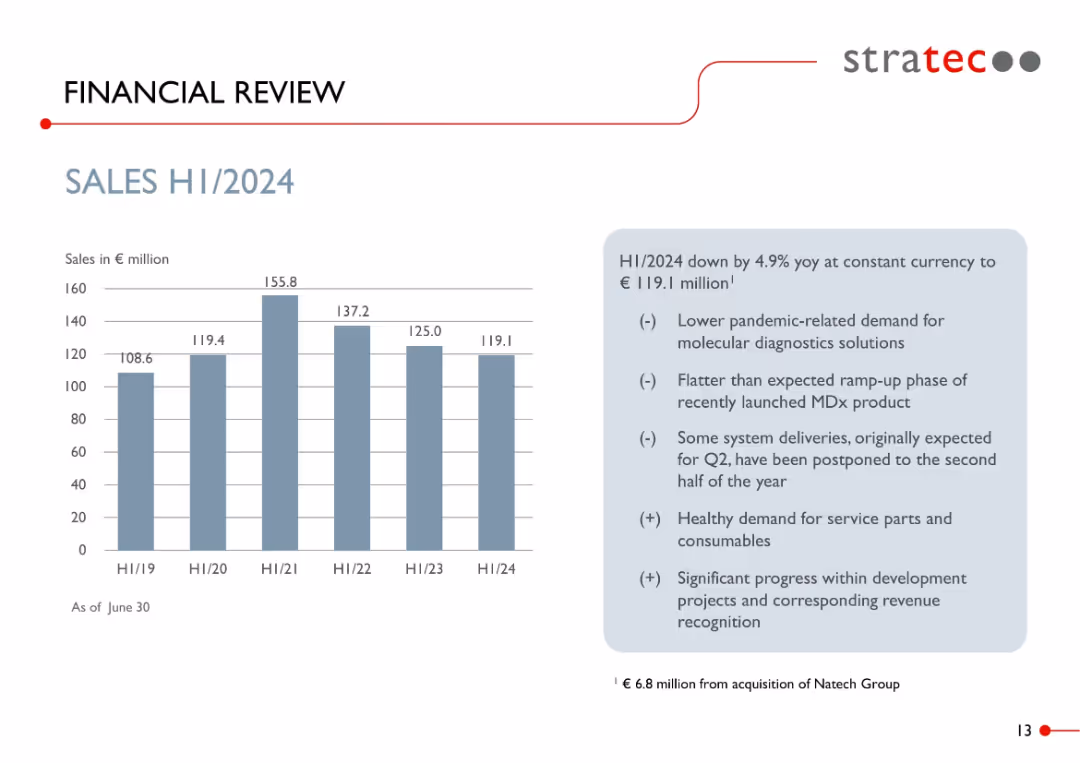
Bar chart on left showing H1 sales from 2019 to 2024; right side includes bullet point analysis with light blue background.
Financial Performance
Healthcare & Pharmaceuticals
Shows a sales decline to €119.1M in H1 2024, down 4.9% YoY. Explanations include reduced post-pandemic demand, slow product ramp-up, and delayed system deliveries. Highlights continued strength in service part demand and project revenue.
H1 2024, sales performance, diagnostics, COVID impact, revenue breakdown, consumables, STRATEC, demand trend
false
Financial Performance
Healthcare & Pharmaceuticals healthcare-and-pharmaceuticals
Mixed Chart
Goldman Sachs
View slide
The slide features diagrams of powertrain architectures for H2 Internal Combustion Engines, Fuel Cell Electric Vehicles, and Battery Electric Vehicles.
Technology and Digital Transformation
Transportation & Logistics
Explores the main architectures for decarbonizing mobility, comparing H2 ICE, FCEV, and BEV in terms of energy storage, conversion, and power generation.
H2 ICE, FCEV, BEV, powertrain architecture, mobility, decarbonization, energy storage, conversion, power generation
false
Technology and Digital Transformation
Transportation & Logistics transportation-and-logistics
Table
Roland Berger
View slide
The slide features a world map highlighting the number of H2 bus projects in various countries.
Market Analysis and Trends
Transportation & Logistics
The slide provides an overview of H2 bus projects worldwide, indicating the geographical distribution and the number of projects per country.
H2 buses, projects, global, evaluation, potential
false
Market Analysis and Trends
Transportation & Logistics transportation-and-logistics
Graphic
Kearney
View slide
The slide features a map showing the route of the H2 bus project in Pau, France, along with key characteristics and project partners listed on the side.
Regulatory and Compliance
Energy & Utilities
The slide describes an experimental project in Pau, France, using hydrogen buses for public transportation, highlighting project details, investment, and key characteristics.
H2 buses, public transport, France, experiment, Pau
false
Regulatory and Compliance
Energy & Utilities energy-and-utilities
Graphic
Kearney
View slide
The slide includes bar charts showing the percentage penetration of H2 in vehicle production across different segments (on-road, off-road) from 2023 to 2030.
Market Analysis and Trends
Transportation & Logistics
Examines the expected penetration rates of H2 technology in vehicle production, highlighting significant increases in buses and forklifts by 2030.
H2 penetration, vehicle production, on-road, off-road, buses, forklifts, segments, market trends, 2030
false
Market Analysis and Trends
Transportation & Logistics transportation-and-logistics
Multiple Chart
Roland Berger
View slide
The slide includes text descriptions of positive and negative power control opportunities, supported by two bar charts showing power output from TAC and renewable sources.
Financial Performance
Energy & Utilities
This slide explores monetization opportunities for hydrogen producers by providing grid services. It details positive and negative power control scenarios and discusses how these services can reduce the Levelized Cost of Hydrogen (LCOH).
H2 producer, monetization, power control, LCOH, grid services
false
Financial Performance
Energy & Utilities energy-and-utilities
Multiple Chart
Kearney
Previous
Loading...
Hold On!
We are searching in our database
If nothing, comes up, please try different filters!
Column Chart
Heatmap
Chevron
Org Chart
Infographic
Callouts
Timeline
List
Graphic
Picture
Process Flow
Diagram
Paragraph
Map
Table
Framework
Subtitle
Takeaway Box
Icon
Other Chart
Radar Chart
Waterfall Chart
Mekko Chart
Pie Chart
Scatter Plot
Line Chart
Bar chart
Bullet points
Create a FREE account to continue browsing
Receive Instant Access to 1,000+ slides from companies like McKinsey, Google, and Goldman Sachs
First Name
Last Name
Email
Password
I agree to all
Terms & Privacy Policy
Thank you! Your submission has been received!
Oops! Something went wrong while submitting the form.
Have an account?
Sign in
Upgrade to PRO to Save slides
Advanced Search and Filters
Access to 15,000+ slides
Access to Category Pages
Save/Bookmark Slides
PowerPoint Template Library
Pick a Plan
MONTHLY
$12/month
Billed every month, Cancel anytime.
YEARLY
$9/year
Billed $108 annually, Cancel anytime.
Checkout for $12/month
Checkout for $108/yr
Secured by Stripe | AES-256 bit encryption