My Account
My Slides
Search by Category
Templates
Leave Feedback
Login
Logout
Get Started
Browse all Slides
Browse all Slides
Create a FREE Account
Instant access to 1,000+ real slides from top companies like McKinsey, BCG, Goldman Sachs, Google and many more!
First Name
Last Name
Email
Password
I agree to all
Terms & Privacy Policy
Thank you! Your submission has been received!
Oops! Something went wrong while submitting the form.
Have an account?
Sign in
📢 Ready to start building slides? Check out our new template library
VIEW TEMPLATES
Welcome,
Welcome
PRO
Show Featured Only
Checkbox 8
Companies
Mckinsey
Bain
BCG
EY
Deloitte
Accenture
PwC/Strategy&
JP Morgan
Goldman Sachs
Morgan Stanley
Citigroup
Deutsche Bank
Barclays
LEK
KPMG
Kearney
Oliver Wyman
Booz Allen Hamilton
Gartner
IPSOS
Nielsen
Slide type
Text Only
Linear Flow
Vertical Flow
Single Chart
Header Horizontal
Mixed Chart
Header Vertical
Pillar
Multiple Chart
Graphic
Agenda
Title
Table
Framework
Industry
Technology & Software
Artificial Intelligence
Financial Services
Retail & E-commerce
Consumer Goods
Industrial & Manufacturing
Transportation & Logistics
Telecommunications
Real Estate & Construction
Hospitality & Tourism
Professional Services
Education & Training
Media & Entertainment
Agriculture & Food Production
Healthcare & Pharmaceuticals
Environmental Services & Sustainability
Government & Public Sector
Use Case
Mergers and Acquisitions
Performance Metrics and KPIs
Client Case Studies
Competitive Landscape
Corporate Finance and Valuation
Product and Service Analysis
Customer and Market Segmentation
Organizational Structure and Change
Industry Overview
Regulatory and Compliance
Risk Assessment and Management
Investment Analysis
Organizational Structure and Change
Human Resources and Talent Management
Financial Performance
Market Analysis and Trends
Sales and Business Development
Human Resources and Talent Management
Clear all
Thank you! Your submission has been received!
Oops! Something went wrong while submitting the form.
Tag
View slide
The slide presents various H2 storage systems (GH2 - Type III, IV, V, and LH2) with detailed descriptions and comments. Includes images of storage vessels and their applications.
Technology and Digital Transformation
Energy & Utilities
Explores the main H2 storage technologies for mobility, highlighting gaseous solutions already in operation and liquid solutions under development.
H2 storage, GH2, LH2, Type III, Type IV, Type V, technology, mobility, application
false
Technology and Digital Transformation
Energy & Utilities energy-and-utilities
Table
Roland Berger
View slide
The slide displays a comparison of Type I to IV H2 tanks, detailing materials, pressure levels, prices, and targeted applications. Visuals include detailed diagrams of each tank type.
Technology and Digital Transformation
Industrial & Manufacturing
Provides a comprehensive overview of different H2 storage tanks, their expected technology readiness by 2030, and specific use cases for mobility and infrastructure.
H2 storage, Type I, Type II, Type III, Type IV, technology readiness, market study, application, pressure levels
false
Technology and Digital Transformation
Industrial & Manufacturing industrial-and-manufacturing
Table
Roland Berger
View slide
This slide features two column charts showing market value projections for H2 storage solutions from 2023 to 2030, segmented by application and region.
Market Analysis and Trends
Energy & Utilities
Analyzes the projected growth of the H2 storage market for mobility and infrastructure, with an expected market size of almost EUR 10 billion by 2030.
H2 storage, market size, projections, mobility, infrastructure, application, region, growth, EUR billion
false
Market Analysis and Trends
Energy & Utilities energy-and-utilities
Multiple Chart
Roland Berger
View slide
The slide displays tables comparing cancellation policies and meal limits for HCPs across different companies.
Regulatory and Compliance
Healthcare & Pharmaceuticals
This slide provides a detailed comparison of HCP meal limits and speaker cancellation policies, crucial for compliance and event planning.
HCP, meal limits, cancellation policies, compliance, comparison
false
Regulatory and Compliance
Healthcare & Pharmaceuticals healthcare-and-pharmaceuticals
Multiple Chart
Deloitte
View slide
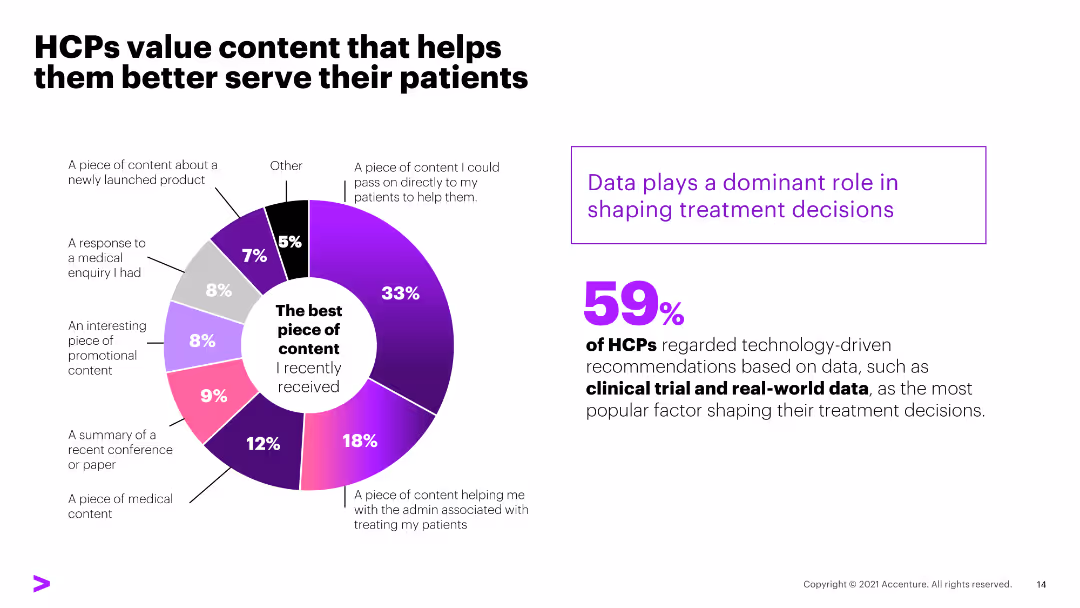
The slide features a circular chart in the center with percentages dividing different types of content valued by HCPs, and a large 59% statistic on the right in purple text.
Customer and Market Segmentation
Healthcare & Pharmaceuticals
The slide highlights that 59% of HCPs regarded technology-driven recommendations based on data, such as clinical trials and real-world data, as crucial for treatment decisions.
HCPs, content, patients, clinical data, technology
false
Customer and Market Segmentation
Healthcare & Pharmaceuticals healthcare-and-pharmaceuticals
Mixed Chart
Accenture
View slide
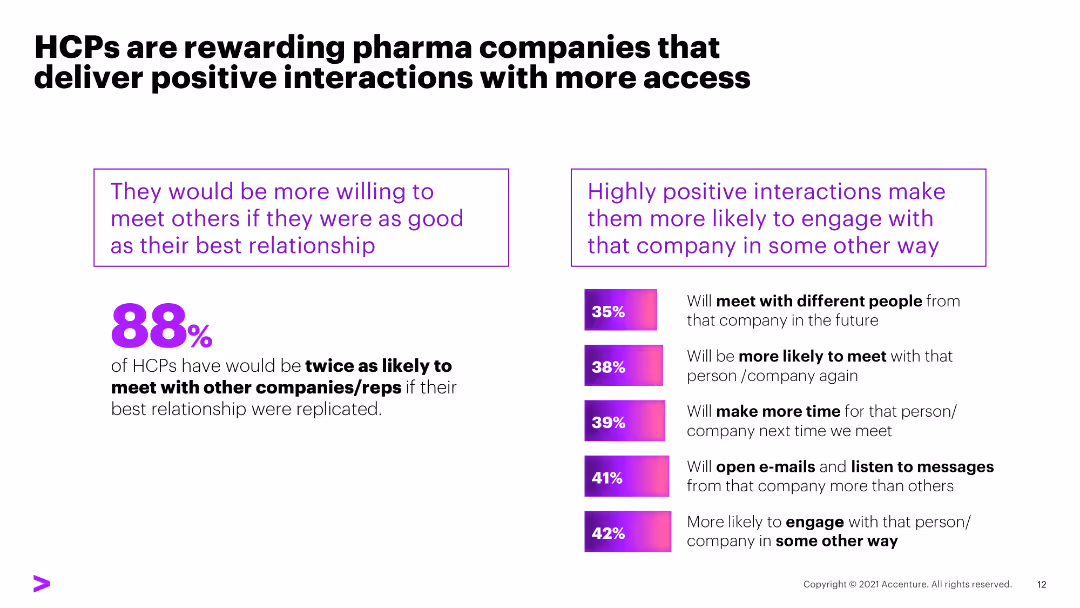
The slide contains a large statistic (88%) in bold purple text on the left and a column chart with various percentages on the right, each indicating a specific interaction behavior.
Customer and Market Segmentation
Healthcare & Pharmaceuticals
The slide shows that 88% of healthcare professionals (HCPs) would be twice as likely to meet with other companies/reps if their best relationship was replicated.
HCPs, interactions, pharma, engagement, statistics
false
Customer and Market Segmentation
Healthcare & Pharmaceuticals healthcare-and-pharmaceuticals
Mixed Chart
Accenture
View slide
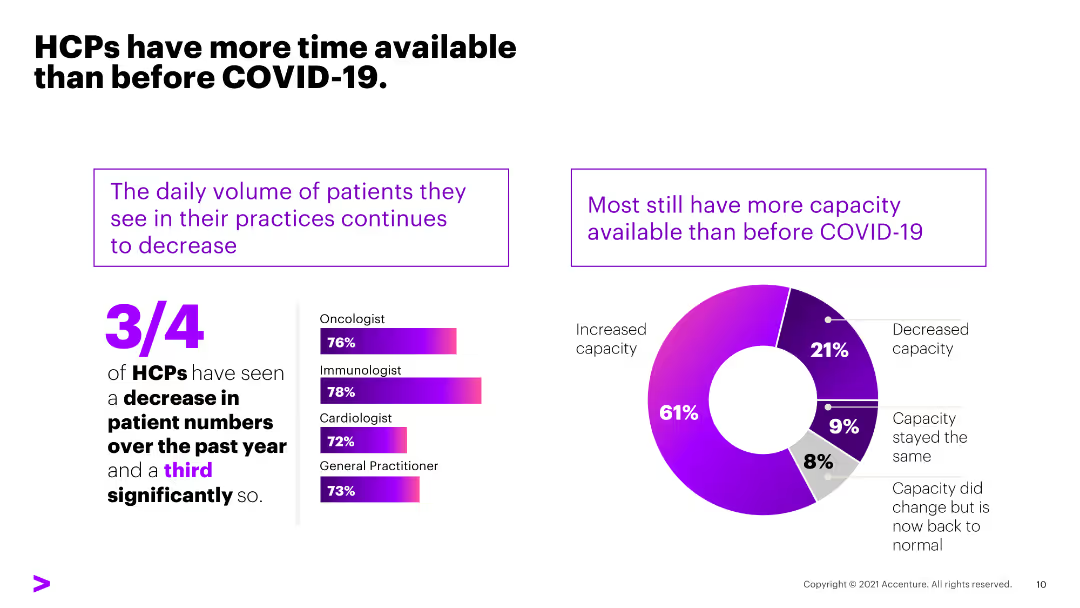
The slide has a white background with text and a donut chart on the right showing the change in patient volume. The left side contains text discussing the availability of HCPs.
Market Analysis and Trends
Healthcare & Pharmaceuticals
This slide highlights that HCPs have more available time due to a decrease in patient numbers during COVID-19, with detailed statistics on the change in patient volume by specialty.
HCPs, patient volume, COVID-19, availability, time, healthcare, decrease, capacity, specialty
false
Market Analysis and Trends
Healthcare & Pharmaceuticals healthcare-and-pharmaceuticals
Multiple Chart
Accenture
View slide
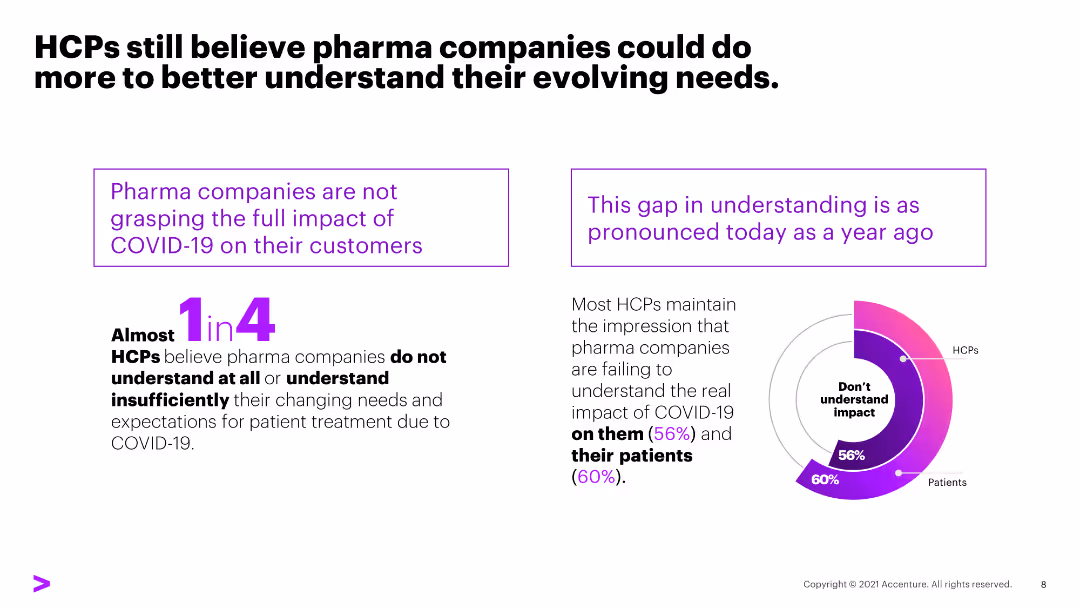
The slide has a white background with text and two key points highlighted in boxes. On the right, there's a column chart showing HCPs' perceptions of pharma companies' understanding.
Market Analysis and Trends
Healthcare & Pharmaceuticals
This slide discusses the gap in understanding the impact of COVID-19 on HCPs and their patients, highlighting the need for pharma companies to better understand evolving needs.
HCPs, pharma companies, COVID-19, understanding, patient needs, healthcare, perceptions, gap, impact
false
Market Analysis and Trends
Healthcare & Pharmaceuticals healthcare-and-pharmaceuticals
Mixed Chart
Accenture
View slide
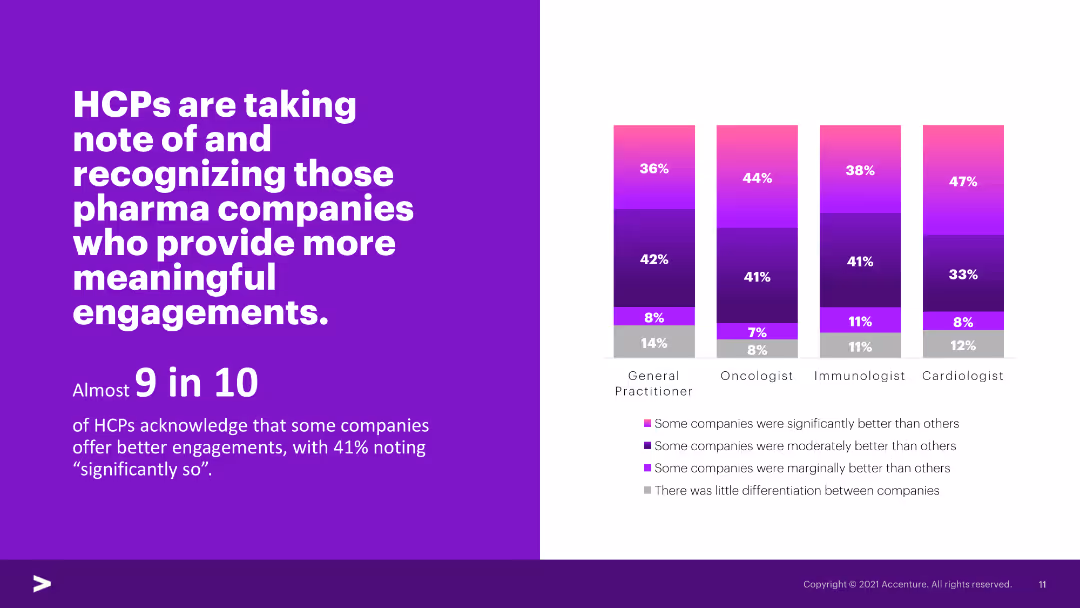
The slide has a purple background with text and a column chart on the right showing HCPs' recognition of pharma companies providing meaningful engagements.
Market Analysis and Trends
Healthcare & Pharmaceuticals
This slide indicates that almost 9 in 10 HCPs acknowledge that some pharma companies offer better engagements, with a significant percentage noting meaningful interactions.
HCPs, pharma companies, engagements, recognition, meaningful interactions, healthcare, perceptions, significant, statistics
false
Market Analysis and Trends
Healthcare & Pharmaceuticals healthcare-and-pharmaceuticals
Mixed Chart
Accenture
View slide
The slide features a detailed case study on HEFA (Hydroprocessed Esters and Fatty Acids) as a viable solution for bio jet fuels in the US, covering the process description, key metrics, feedstock characteristics, and environmental performance.
Client Case Studies
Transportation & Logistics
This slide examines HEFA as a technically viable solution for producing bio jet fuels in the US, detailing the conversion process, key metrics, feedstock characteristics, and environmental impacts associated with HEFA production.
HEFA, bio jet fuel, US, case study, process description, key metrics, feedstock characteristics, environmental performance
false
Client Case Studies
Transportation & Logistics transportation-and-logistics
Mixed Chart
Kearney
View slide
Displays a pie chart comparing 2020 market share in HEV plastic fuel tanks among competitors, with annotations about technology and market strategy. The chart uses various colors to represent different competitors.
Product and Service Analysis
Industrial & Manufacturing
The slide examines TI Fluid Systems' market share in the HEV plastic fuel tanks sector, highlighting their second position and strategic initiatives like the PACE awarded TAPT process to enhance market share.
HEV, market share, 2020, pie chart, fuel tanks
false
Product and Service Analysis
Industrial & Manufacturing industrial-and-manufacturing
Mixed Chart
Deutsche Bank
View slide
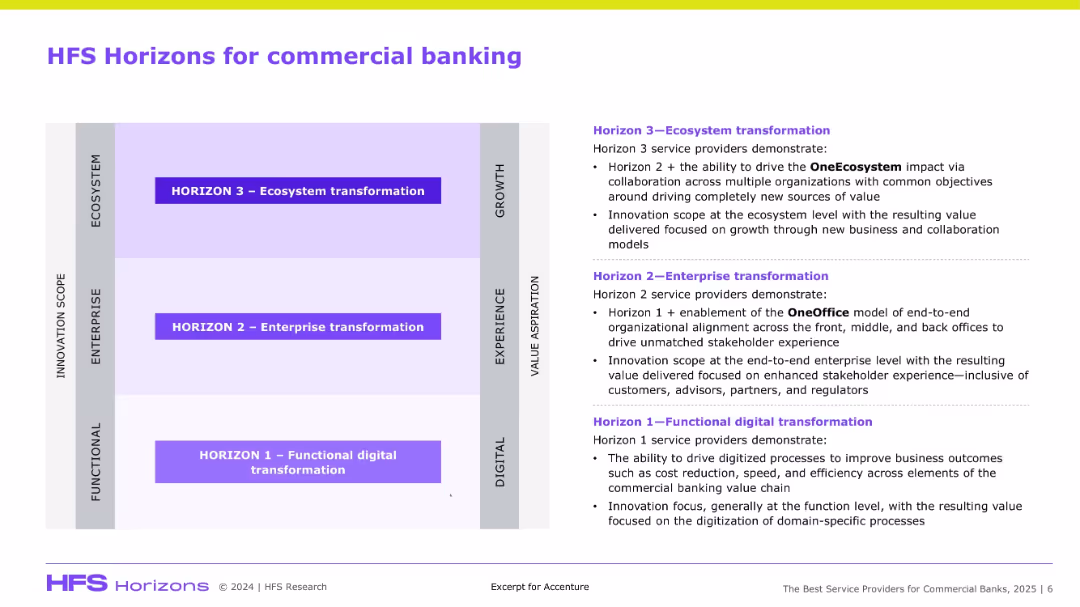
Matrix chart with three horizontal zones and detailed text explanation on the right side.
Technology and Digital Transformation
Financial Services
This slide presents a 3-tier model (Functional, Enterprise, Ecosystem transformation) explaining stages of digital maturity in commercial banking, with emphasis on value creation, innovation, and alignment.
HFS, commercial banking, digital transformation, ecosystem, innovation, OneOffice
false
Technology and Digital Transformation
Financial Services financial-services
Diagram
Accenture
View slide
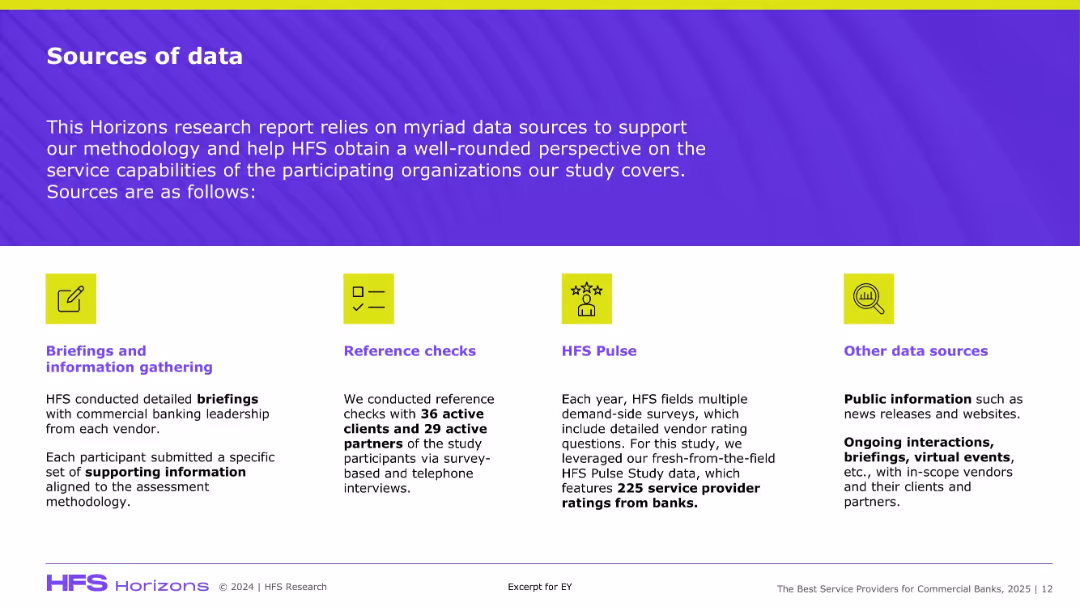
Four-column layout with icons and brief descriptions for each data source (briefings, reference checks, surveys, public info); uses light and bright background with structured blocks.
Regulatory and Compliance
Professional Services
This slide outlines the data sources used in the HFS Horizons research, emphasizing its comprehensive approach: vendor briefings, client and partner reference checks, HFS Pulse survey data, and public or third-party information. It highlights the robustness and credibility of the research methodology, especially for assessing service capabilities in commercial banking contexts.
HFS, data sources, methodology, vendor ratings, reference checks, surveys
false
Regulatory and Compliance
Professional Services professional-services
Agenda
Accenture
View slide
This slide contains pie charts showing the high percentage of HR leaders and employees who agree that companies should offer the best benefits and need to improve support, maintaining a consistent sentiment over three years.
Human Resources and Talent Management
Financial Services
Reflects the strong agreement among HR leaders and employees about the need for improved employer support and benefits, crucial for strategic HR planning.
HR Agreement, Employee Benefits, Employer Support, Pie Charts, Strategic Planning
false
Human Resources and Talent Management
Financial Services financial-services
Single Chart
Goldman Sachs
View slide
This slide presents a column chart contrasting employer and employee views on the attention paid to financial benefits over three years, with a significant increase in employee attention highlighted for the recent year.
Human Resources and Talent Management
Financial Services
Focuses on HR leaders' perspectives on employee attentiveness to benefits, indicating a growing awareness and importance of financial benefits in the workplace.
HR Perspectives, Financial Benefits, Employee Attentiveness, Bar Graph, Trends
false
Human Resources and Talent Management
Financial Services financial-services
Single Chart
Goldman Sachs
View slide
Donut chart showing 13% usage of HR analytics software across different sectors, with accompanying bar charts detailing sector-specific usage percentages.
Human Resources and Talent Management
Professional Services
Slide shows adoption rates of HR analytics software in various sectors, indicating low usage overall but higher in sectors like banking and pharma.
HR analytics, software usage, sectors, donut chart, bar chart
false
Human Resources and Talent Management
Professional Services professional-services
Multiple Chart
PwC/Strategy&
View slide
Bar chart with multiple bars in two colors showing various uses of HR data such as payroll, recruitment, and performance monitoring, with the highest use for standard data at 90%.
Human Resources and Talent Management
Professional Services
The slide illustrates common applications of HR data in organizations, emphasizing heavy use for standard operations like payroll and leave management.
HR data, payroll, recruitment, performance, bar chart
false
Human Resources and Talent Management
Professional Services professional-services
Single Chart
PwC/Strategy&
View slide
The slide provides column charts comparing perceptions of HR leaders and non-HR leaders on the effectiveness of HR functions in delivering workforce strategy.
Market Analysis and Trends
Professional Services
Assesses differing perceptions between HR and non-HR leaders regarding the effectiveness of HR strategies in adapting to market changes and achieving organizational goals. Useful for identifying areas for improvement in HR practices and alignment with overall business strategy.
HR effectiveness, workforce strategy, leadership perceptions, organizational alignment, HR practices
false
Market Analysis and Trends
Professional Services professional-services
Single Chart
PwC/Strategy&
View slide
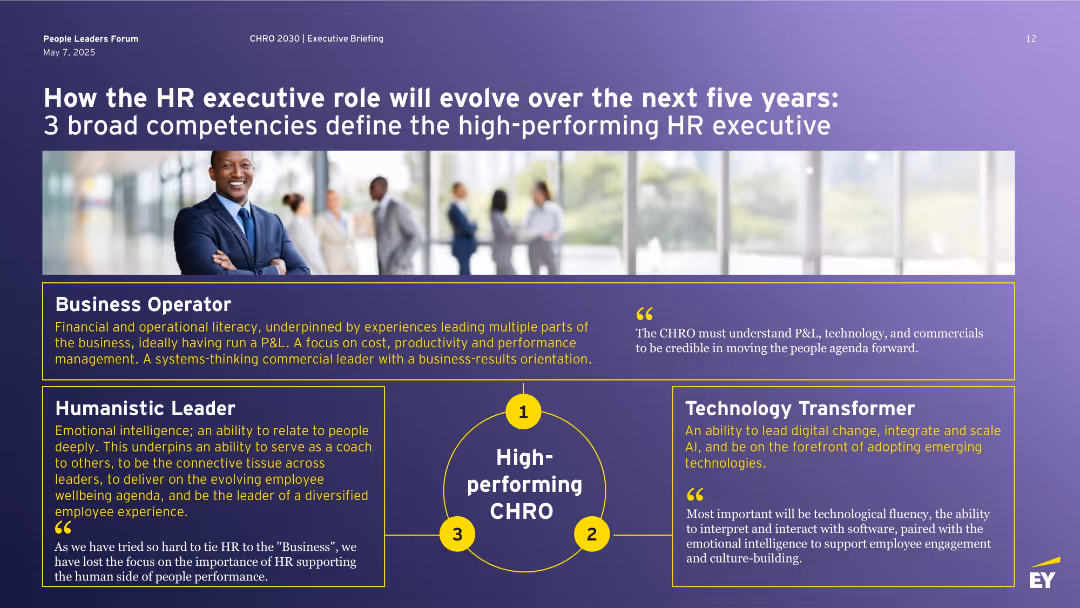
Split layout with photo of executive team and three yellow-highlighted competency blocks labeled 1–3 around a central circle labeled “High-performing CHRO.”
Human Resources and Talent Management
Professional Services
Explores the evolving role of HR executives over five years, identifying three core competencies: Business Operator, Humanistic Leader, and Technology Transformer. Each role is described in detail with supporting quotes, emphasizing the need for digital fluency, emotional intelligence, and commercial focus to succeed in future HR leadership.
HR executive, CHRO, digital fluency, competencies, leadership, emotional intelligence
false
Human Resources and Talent Management
Professional Services professional-services
Diagram
EY
View slide
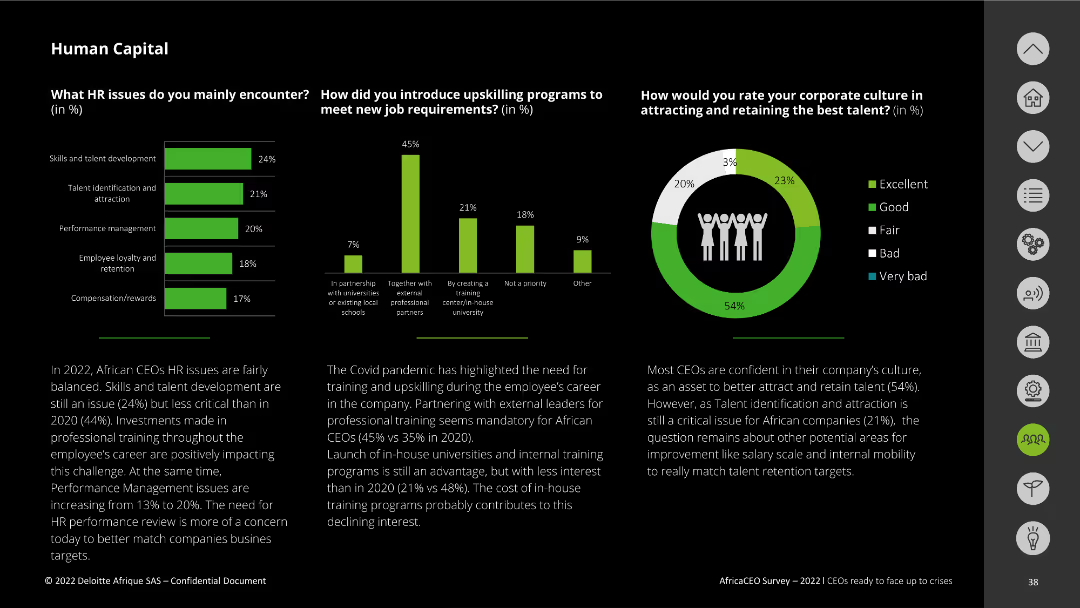
This slide features a series of vertical bar charts and a donut chart. It presents statistical data on HR issues, upskilling programs, and corporate culture. Text boxes provide additional context.
Human Resources and Talent Management
Professional Services
This slide discusses key HR issues African CEOs face, methods used to introduce upskilling programs, and how corporate culture impacts talent retention.
HR issues, upskilling, talent retention, corporate culture, African CEOs
false
Human Resources and Talent Management
Professional Services professional-services
Multiple Chart
Deloitte
View slide
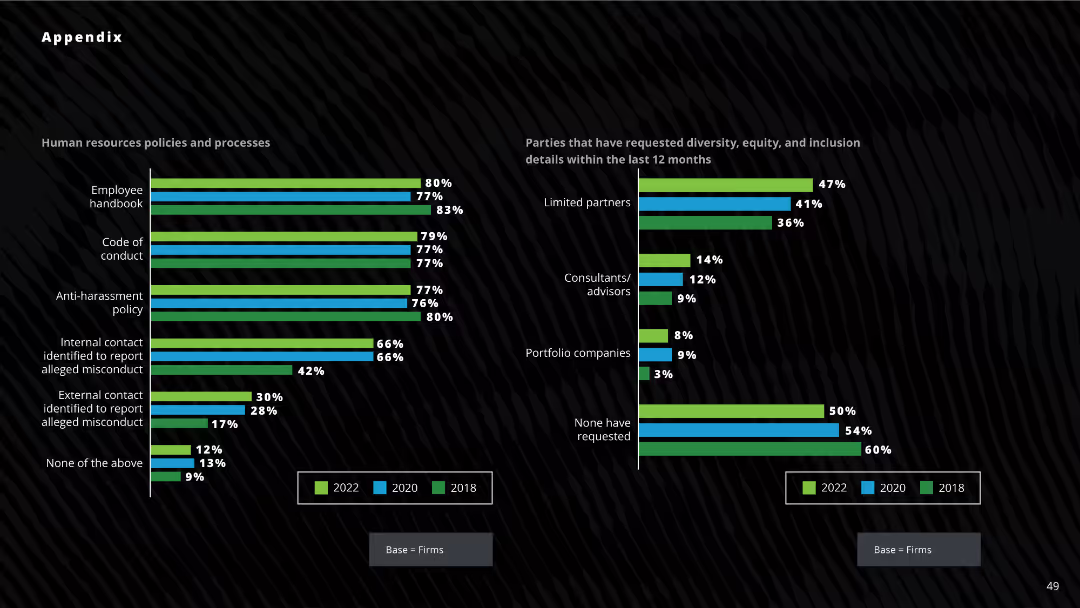
Two horizontal bar charts: one showing the adoption of HR policies across firms, the other displaying parties requesting diversity details within the last 12 months.
Human Resources and Talent Management
Professional Services
The slide illustrates the adoption rates of various HR policies over three years and highlights the parties requesting diversity details. Useful for understanding trends in HR policy adoption and diversity information requests.
HR policies, diversity, compliance, requests, adoption
false
Human Resources and Talent Management
Professional Services professional-services
Multiple Chart
Deloitte
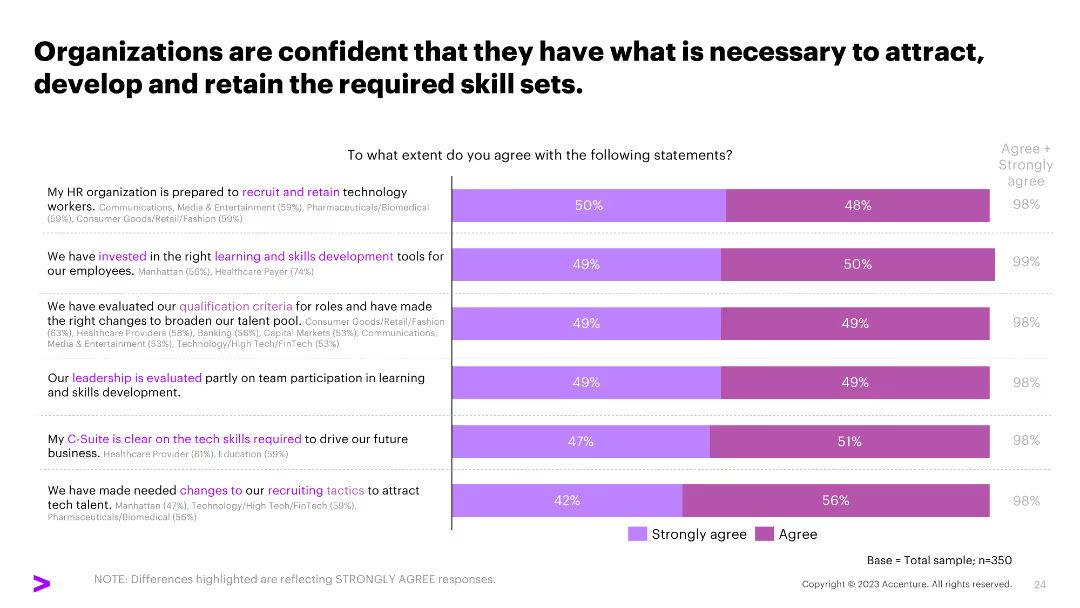
View slide
A column chart showing agreement levels on various HR practices, such as recruitment, skills development, and leadership evaluation, with percentages for each.
Human Resources and Talent Management
Professional Services
The slide shows how organizations agree on their capability to attract, develop, and retain required skill sets, emphasizing effective HR practices.
HR practices, skills development, recruitment, leadership evaluation
false
Human Resources and Talent Management
Professional Services professional-services
Mixed Chart
Accenture
View slide
Donut chart paired with a bar chart. The donut chart shows 34% have an HR tech strategy, while the bar chart details the strategy prevalence by sector like banking and engineering.
Human Resources and Talent Management
Professional Services
Evaluates the presence of formal HR technology strategies within various sectors, highlighting a significant strategy adoption in banking and engineering.
HR strategy, sectors, technology, donut chart, bar chart
false
Human Resources and Talent Management
Professional Services professional-services
Multiple Chart
PwC/Strategy&
View slide
Semi-circular gauge chart indicating the frequency of technology usage within HR departments, with a needle pointing to "Sometimes."
Human Resources and Talent Management
Professional Services
This slide uses a gauge chart to depict the varying extent of technology use within HR departments, highlighting a moderate frequency of use.
HR technology, gauge chart, usage frequency
false
Human Resources and Talent Management
Professional Services professional-services
Single Chart
PwC/Strategy&
View slide
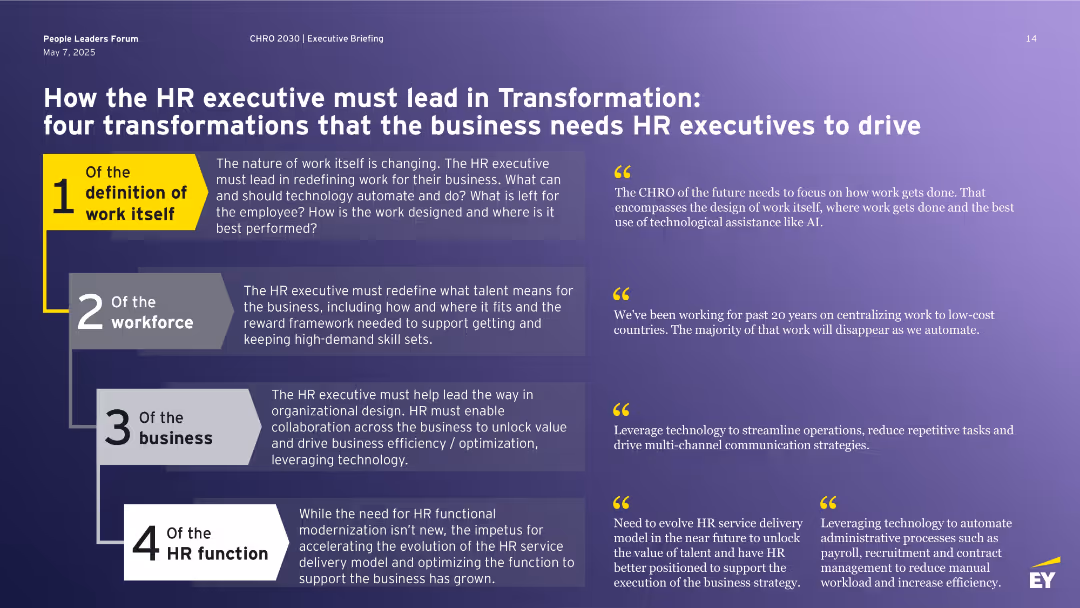
Purple slide with four large numbered transformation areas, each with a supporting quote and short paragraph.
Organizational Structure and Change
Professional Services
Outlines four major transformations HR must lead: redefining work, workforce, business, and the HR function itself. Each theme addresses how HR leaders should adapt to automation, workforce evolution, strategic business involvement, and HR service delivery to remain relevant and impactful in the age of AI and digital transformation.
HR transformation, automation, future of work, leadership, organizational design
false
Organizational Structure and Change
Professional Services professional-services
Vertical Flow
EY
View slide
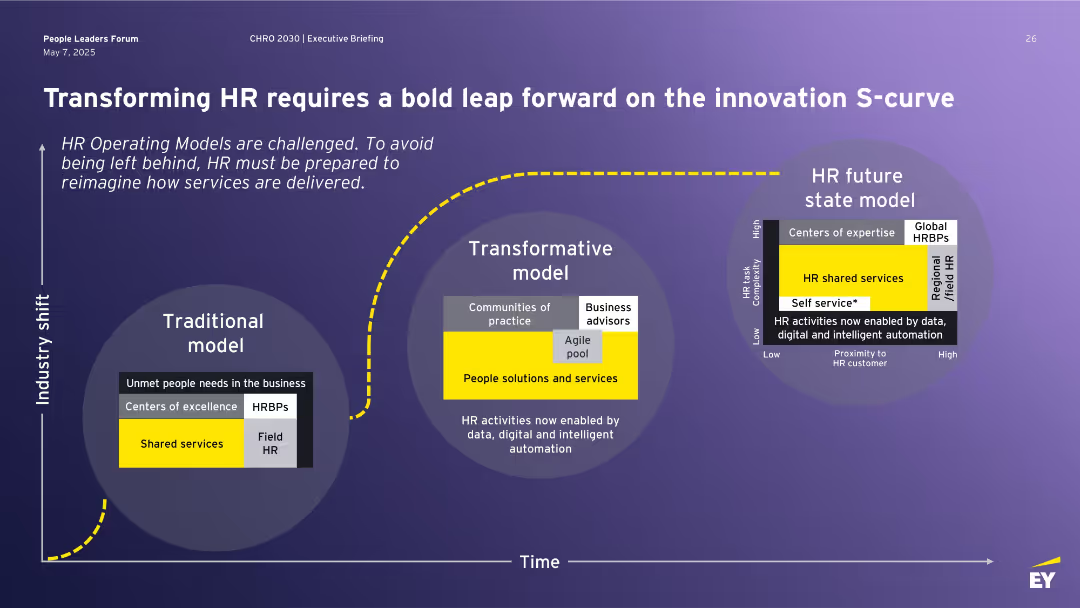
Three-part horizontal layout illustrating evolution from Traditional to Transformative to Future HR model using labeled circle diagrams, with a yellow dotted line representing industry shift over time.
Technology and Digital Transformation
Professional Services
This slide outlines the evolution of HR operating models from traditional to transformative and future-state frameworks. It highlights the impact of data, automation, and digital tools on HR service delivery. The innovation S-curve illustrates a necessary leap to stay relevant and meet business needs.
HR transformation, operating model, shared services, automation, innovation, S-curve, future of work
false
Technology and Digital Transformation
Professional Services professional-services
Single Chart
EY
View slide
Contains two gauge charts comparing views between HR Managers and CEOs/GMs. Each chart uses a gradient color scheme to show agreement levels, focusing on managerial perspectives.
Human Resources and Talent Management
Professional Services
Compares HR Managers and CEOs/GMs opinions on certain company policies, useful for understanding different internal viewpoints and fostering discussion on alignment and policy adjustments.
HR, CEO, perspectives, gauge chart
false
Human Resources and Talent Management
Professional Services professional-services
Multiple Chart
PwC/Strategy&
View slide
Sectioned layout with distinct points and icons.
Strategic Planning
Professional Services
This slide highlights how HR can lead change in reimagining work within organizations, with a focus on agility and digitalization.
HR, Change, Digitalization, Agility, Leadership
false
Strategic Planning
Professional Services professional-services
Header Horizontal
Deloitte
View slide
Central diagram with radiating points to highlight connections.
Technology and Digital Transformation
Professional Services
Explores various components of HR transformation, emphasizing technology and strategy for future workforce development.
HR, Innovation, Technology, Workforce, Strategy
false
Technology and Digital Transformation
Professional Services professional-services
Single Chart
Deloitte
View slide
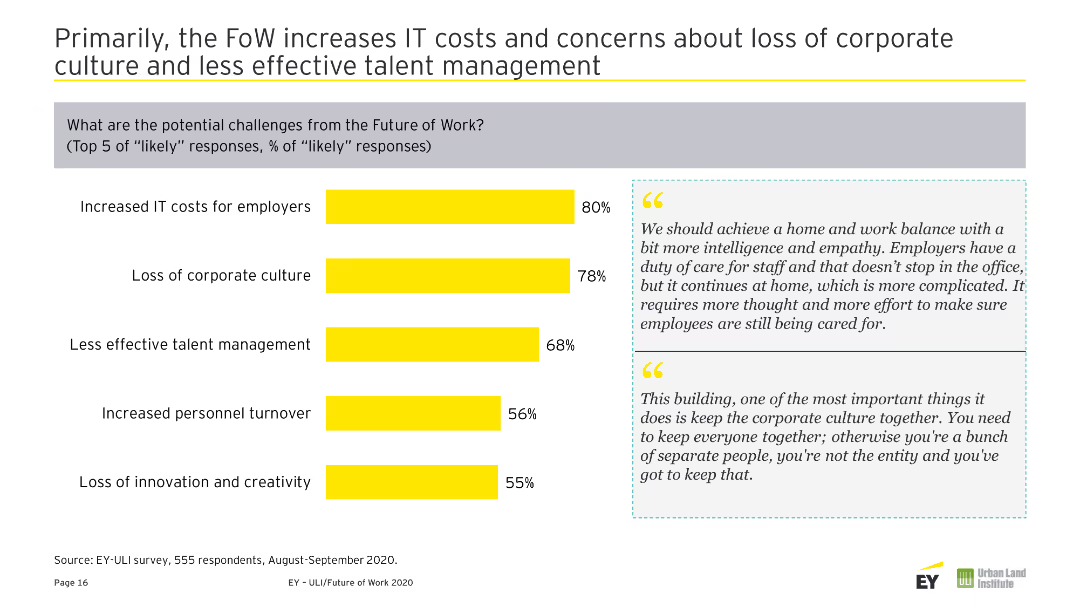
Two pie charts showing the importance of office space in retaining employees and creating a strong corporate culture post-COVID-19. Yellow and gray colors are used.
Human Resources and Talent Management
Real Estate & Construction
Evaluates the importance of office space in the post-COVID-19 environment for employee retention and corporate culture.
HR, Office Space, Retention, Corporate Culture, Post-COVID, Importance, Employees, Environment, Space
false
Human Resources and Talent Management
Real Estate & Construction real-estate-and-construction
Mixed Chart
EY
Previous
Loading...
Hold On!
We are searching in our database
If nothing, comes up, please try different filters!
Column Chart
Heatmap
Chevron
Org Chart
Infographic
Callouts
Timeline
List
Graphic
Picture
Process Flow
Diagram
Paragraph
Map
Table
Framework
Subtitle
Takeaway Box
Icon
Other Chart
Radar Chart
Waterfall Chart
Mekko Chart
Pie Chart
Scatter Plot
Line Chart
Bar chart
Bullet points
Create a FREE account to continue browsing
Receive Instant Access to 1,000+ slides from companies like McKinsey, Google, and Goldman Sachs
First Name
Last Name
Email
Password
I agree to all
Terms & Privacy Policy
Thank you! Your submission has been received!
Oops! Something went wrong while submitting the form.
Have an account?
Sign in
Upgrade to PRO to Save slides
Advanced Search and Filters
Access to 15,000+ slides
Access to Category Pages
Save/Bookmark Slides
PowerPoint Template Library
Pick a Plan
MONTHLY
$12/month
Billed every month, Cancel anytime.
YEARLY
$9/year
Billed $108 annually, Cancel anytime.
Checkout for $12/month
Checkout for $108/yr
Secured by Stripe | AES-256 bit encryption