My Account
My Slides
Search by Category
Templates
Leave Feedback
Login
Logout
Get Started
Browse all Slides
Browse all Slides
Create a FREE Account
Instant access to 1,000+ real slides from top companies like McKinsey, BCG, Goldman Sachs, Google and many more!
First Name
Last Name
Email
Password
I agree to all
Terms & Privacy Policy
Thank you! Your submission has been received!
Oops! Something went wrong while submitting the form.
Have an account?
Sign in
📢 Ready to start building slides? Check out our new template library
VIEW TEMPLATES
Welcome,
Welcome
PRO
Show Featured Only
Checkbox 8
Companies
Mckinsey
Bain
BCG
EY
Deloitte
Accenture
PwC/Strategy&
JP Morgan
Goldman Sachs
Morgan Stanley
Citigroup
Deutsche Bank
Barclays
LEK
KPMG
Kearney
Oliver Wyman
Booz Allen Hamilton
Gartner
IPSOS
Nielsen
Slide type
Text Only
Linear Flow
Vertical Flow
Single Chart
Header Horizontal
Mixed Chart
Header Vertical
Pillar
Multiple Chart
Graphic
Agenda
Title
Table
Framework
Industry
Technology & Software
Artificial Intelligence
Financial Services
Retail & E-commerce
Consumer Goods
Industrial & Manufacturing
Transportation & Logistics
Telecommunications
Real Estate & Construction
Hospitality & Tourism
Professional Services
Education & Training
Media & Entertainment
Agriculture & Food Production
Healthcare & Pharmaceuticals
Environmental Services & Sustainability
Government & Public Sector
Use Case
Mergers and Acquisitions
Performance Metrics and KPIs
Client Case Studies
Competitive Landscape
Corporate Finance and Valuation
Product and Service Analysis
Customer and Market Segmentation
Organizational Structure and Change
Industry Overview
Regulatory and Compliance
Risk Assessment and Management
Investment Analysis
Organizational Structure and Change
Human Resources and Talent Management
Financial Performance
Market Analysis and Trends
Sales and Business Development
Human Resources and Talent Management
Clear all
Thank you! Your submission has been received!
Oops! Something went wrong while submitting the form.
Tag
View slide
Utilizing a line graph, this slide compares the perceived I&D maturity level across different demographics within HR, highlighting differences between minority and non-minority women.
Strategic Planning
Professional Services
Analyzing perceptions of inclusion and diversity maturity within HR, this slide compares assessments between minority and non-minority women in HR roles, illustrating differences in viewpoints.
HR, Women, Minority, Non-minority, Perceptions, Inclusion, Diversity, Maturity, Assessments
false
Strategic Planning
Professional Services professional-services
Single Chart
Accenture
View slide
Graphic and text combination with a focus on the ACTIVATE phase.
Technology and Digital Transformation
Professional Services
Demonstrates Deloitte's holistic approach to engaging and optimizing workforce capabilities through HR solutions.
HR, Workforce, Solutions, Activate, Integration
false
Technology and Digital Transformation
Professional Services professional-services
Framework
Deloitte
View slide
A horizontal bar chart listing factors negatively affecting HR function, highlighting the top three factors.
Strategic Planning
Professional Services
Slide illustrates major barriers in HR function performance, useful in HR management discussions for identifying critical areas of focus.
HR, barriers, management, performance, top three
false
Strategic Planning
Professional Services professional-services
Single Chart
PwC/Strategy&
View slide
Circular chart showing the distribution of how employee engagement feedback is communicated within companies.
Strategic Planning
Professional Services
Discusses how effectively companies communicate employee engagement feedback, crucial for HR management improvement.
HR, communication, employee engagement, feedback, management
false
Strategic Planning
Professional Services professional-services
Single Chart
PwC/Strategy&
View slide
A donut chart showing 91% of respondents have disciplinary procedures in place.
Strategic Planning
Professional Services
Useful for HR management to evaluate the adoption and effectiveness of disciplinary procedures within organizations.
HR, disciplinary procedures, evaluation, adoption, effectiveness
false
Strategic Planning
Professional Services professional-services
Single Chart
PwC/Strategy&
View slide
A donut chart showing 81% of companies measure employee satisfaction.
Strategic Planning
Professional Services
Highlights the importance of measuring employee satisfaction in HR management, used for assessing HR practices.
HR, employee satisfaction, measurement, practices, assessment
false
Strategic Planning
Professional Services professional-services
Single Chart
PwC/Strategy&
View slide
Circular stacked pie chart showing the frequency of employee satisfaction measurements.
Strategic Planning
Professional Services
Details frequency of employee satisfaction assessments, aiding in operational planning and improvement in HR.
HR, frequency, employee satisfaction, assessment, operational planning
false
Strategic Planning
Professional Services professional-services
Single Chart
PwC/Strategy&
View slide
A pie chart shows 91% 'Yes' in a bold orange color, alongside a bar chart detailing percentages per sector like Financial Services and Manufacturing, indicating the presence of formal HR functions.
Market Analysis and Trends
Professional Services
Discusses the prevalence of formal HR functions across various sectors, useful for analyzing organizational maturity and HR management practices across industries.
HR, functions, organization, sectors, management, analysis, prevalence
false
Market Analysis and Trends
Professional Services professional-services
Multiple Chart
PwC/Strategy&
View slide
Two gauge-like diagrams; one for HR Managers and another for CEOs, each indicating their perception of HR's impact on organizational success through a color gradient from red to yellow.
Market Analysis and Trends
Professional Services
Evaluates how different organizational roles perceive the impact of HR on success, indicating overall sentiment and possible areas for HR development and intervention.
HR, impact, success, perception, management, organizational roles
false
Market Analysis and Trends
Professional Services professional-services
Multiple Chart
PwC/Strategy&
View slide
Bar chart showing the percentage of "Yes" responses regarding HR information system adoption across various sectors.
Human Resources and Talent Management
Professional Services
Explores the adoption rate of HR information systems across different sectors.
HR, information system, adoption, sectors, rate
false
Human Resources and Talent Management
Professional Services professional-services
Multiple Chart
PwC/Strategy&
View slide
Horizontal bar chart of methods used to measure employee satisfaction, highlighting surveys and feedback.
Strategic Planning
Professional Services
Focuses on various methods for measuring employee satisfaction, essential for developing effective HR strategies.
HR, measurement methods, employee satisfaction, surveys, feedback
false
Strategic Planning
Professional Services professional-services
Single Chart
PwC/Strategy&
View slide
Horizontal bar chart showing top priorities for HR within the next 12 months, with focus on key talent retention.
Strategic Planning
Professional Services
Discusses key HR priorities to focus on in the upcoming year, vital for strategic HR planning and operational adjustments.
HR, priorities, strategy, talent retention, planning
false
Strategic Planning
Professional Services professional-services
Single Chart
PwC/Strategy&
View slide
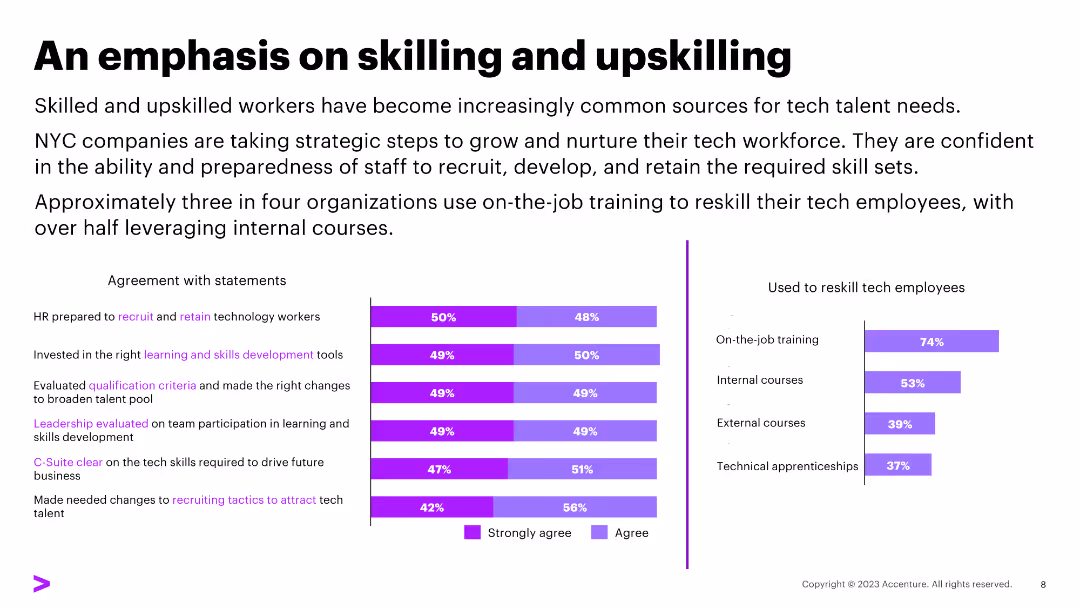
The slide features a column chart displaying percentages of agreement with statements and methods used to reskill employees. The layout is moderately dense with text and visuals.
Human Resources and Talent Management
Professional Services
Discusses the importance of skilling and upskilling workers, with data showing HR preparedness and reskilling methods.
HR, reskilling, training, upskilling, internal courses, external courses, technical apprenticeships
false
Human Resources and Talent Management
Professional Services professional-services
Multiple Chart
Accenture
View slide
A single gauge diagram in orange to yellow gradient, measuring the balance between reactive and proactive HR approaches, marked by a needle pointing towards 'Balanced-Proactive'.
Market Analysis and Trends
Professional Services
This slide examines the strategic orientation of HR functions, whether they are more reactive or proactive, aiding in discussions on strategic planning and operational effectiveness in HR practices.
HR, strategies, reactive, proactive, planning, effectiveness, orientation
false
Market Analysis and Trends
Professional Services professional-services
Single Chart
PwC/Strategy&
View slide
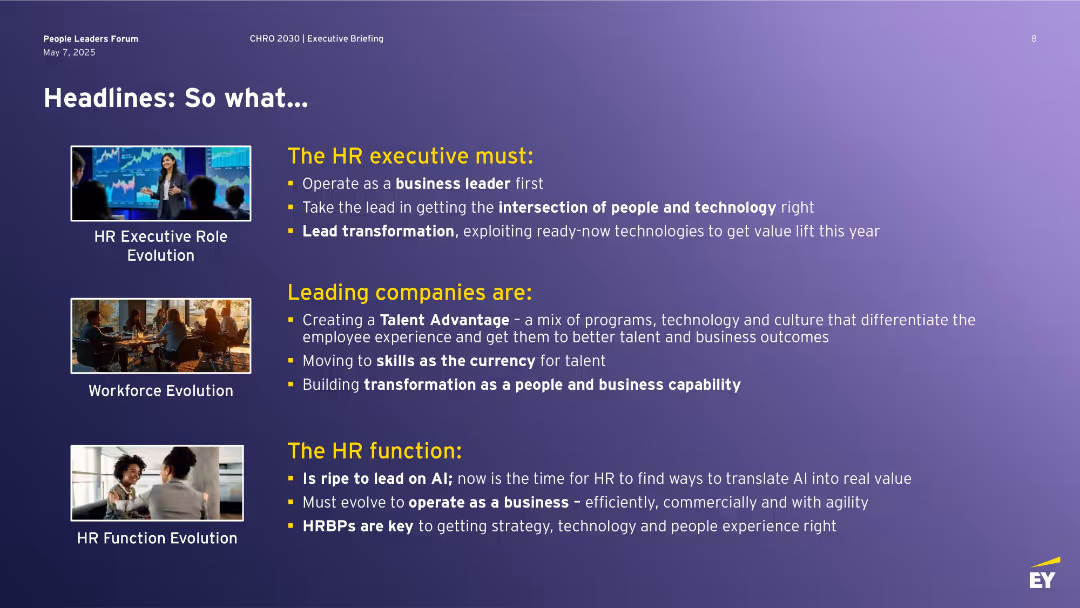
Purple background with three section blocks on HR role evolution, each with a photo and bullet-point text explaining HR's current imperatives.
Human Resources and Talent Management
Professional Services
Summarizes the evolving responsibilities of HR executives, emphasizing their role as business leaders who lead transformation by integrating technology and people strategy. Discusses how companies are shifting to skills-based models and AI adoption, and the need for HRBPs to deliver business outcomes through transformation and people experience strategies.
HR, transformation, talent advantage, AI, people strategy, HRBP, skills-based models
false
Human Resources and Talent Management
Professional Services professional-services
Header Vertical
EY
View slide
Donut chart showing percentages of employee access to HRIS, with 55% having access, 24% having limited access, and 21% with no access.
Human Resources and Talent Management
Professional Services
Explores how employees can access their data on HR information systems, showing a majority have some form of access.
HRIS, employee access, data records, donut chart
false
Human Resources and Talent Management
Professional Services professional-services
Single Chart
PwC/Strategy&
View slide
Donut chart illustrating managers' access levels to HRIS concerning their direct employees, with varying degrees of access detailed.
Human Resources and Talent Management
Professional Services
Analyzes managers' access to HR information systems in relation to their direct reports, revealing diverse access levels.
HRIS, manager access, employee data, donut chart
false
Human Resources and Talent Management
Professional Services professional-services
Single Chart
PwC/Strategy&
View slide
Bar chart showing percentages of various HRIS types, including outsourced, off-the-shelf, and in-house solutions. The largest bar represents HRIS custom developed by outsourced specialists at 46%.
Human Resources and Talent Management
Professional Services
This slide displays a bar chart categorizing HR information systems by type within organizations, highlighting the prevalence of outsourced solutions.
HRIS, outsourcing, in-house, off-the-shelf, bar chart
false
Human Resources and Talent Management
Professional Services professional-services
Single Chart
PwC/Strategy&
View slide
Donut chart displaying the extent of HRIS use in recruitment and staffing, with 55% using HRIS and 36% using it but only for basic details.
Human Resources and Talent Management
Professional Services
This slide presents data on HRIS usage in recruitment, showing a significant portion utilizing these systems, albeit often just for basic information.
HRIS, recruitment, staffing, donut chart, utilization
false
Human Resources and Talent Management
Professional Services professional-services
Single Chart
PwC/Strategy&
View slide
Box plot showing the spread of HRST scores by total paid amount with outlier analysis.
Market Analysis and Trends
Government & Public Sector
Evaluates the distribution of HRST scores and their corresponding costs, identifying outliers and highlighting the discrepancies in service expenditures relative to assessed needs.
HRST scores, total paid amount, outlier analysis, health risk screening tool, service expenditures, funding discrepancies, NH's DD population
false
Market Analysis and Trends
Government & Public Sector government-and-public-sector
Mixed Chart
Alvarez & Marsal
View slide
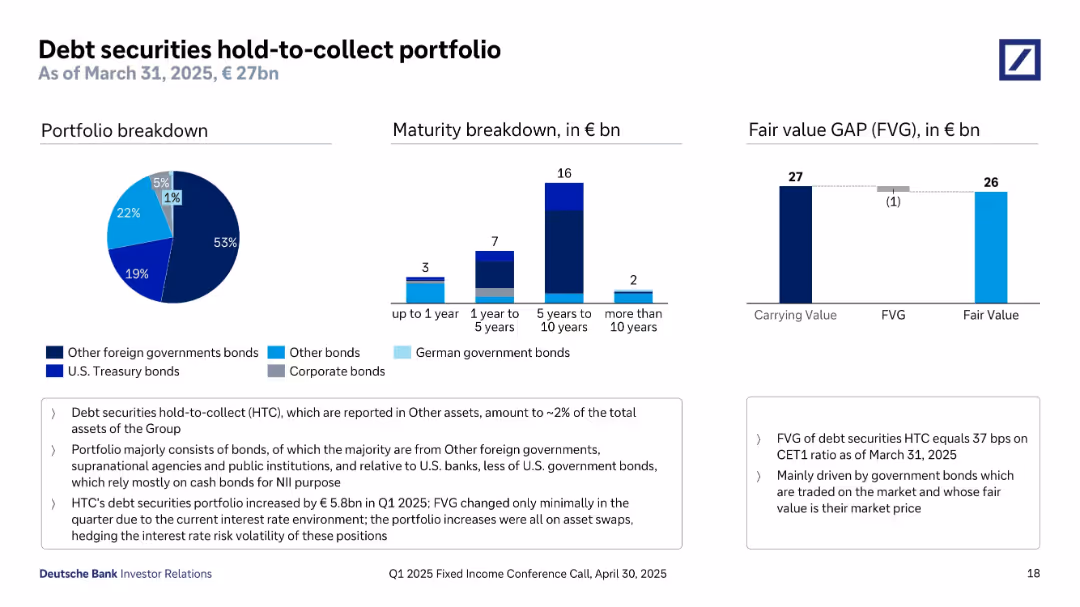
Three visualizations: pie chart (portfolio breakdown), bar chart (maturity), and a bar showing fair value vs carrying value (FVG). Each chart uses consistent color codes. Summary and highlights on the bottom and right.
Investment Analysis
Financial Services
This slide details Deutsche Bank's €27bn hold-to-collect (HTC) bond portfolio. Majority holdings are other foreign government and supranational agency bonds. Most maturities fall within 5–10 years. Fair value gap is minimal (€1bn), reflecting low mark-to-market risk. The slide emphasizes increased portfolio size this quarter, primarily from asset swaps, with negligible FVG changes. It also notes HTC assets account for ~2% of the bank's total assets.
HTC portfolio, government bonds, maturity breakdown, fair value gap, bond investment, NII, supranational
false
Investment Analysis
Financial Services financial-services
Multiple Chart
Deutsche Bank
View slide
This slide features comparative bar charts and a pie chart. There are two sections: one compares the online spend of HVUs vs. non-HVUs across various verticals, and the other shows the demographic and geographic composition of HVUs. Additionally, there are two column charts depicting changes in spend percentage.
Market Analysis and Trends
Technology & Software
The slide presents data on high-value users' (HVUs) online spending habits in Thailand compared to non-HVUs, indicating that HVUs spend significantly more. Demographic and geographic distributions of HVUs are detailed. Changes in spend over the past 12 months and intentions to increase spend are quantified through column charts, highlighting the growing trend in digital consumer behavior.
HVU, Thailand, Spending Habits, Demographics, E-commerce, Transport, Gaming, Growth, Consumer Behavior, Digital Economy
false
Market Analysis and Trends
Technology & Software technology-and-software
Multiple Chart
Bain
View slide
The slide uses horizontal bar graphs to compare the online spend of HVUs and non-HVUs in the Philippines. It features a blue and grey color scheme, with each category of spend such as transport, gaming, and travel represented by a bar. The right side of the slide includes two column charts showing changes in spend percentage. It provides demographic and geographic composition percentages through pie charts.
Customer and Market Segmentation
Technology & Software
This slide compares the online spending of high-value users (HVUs) with non-HVUs in the Philippines, emphasizing transport as a significant factor. It's useful for businesses and marketers to identify and capitalize on key differentiators in consumer spending behavior, especially in the context of transportation and e-commerce sectors.
HVUs, Non-HVUs, Philippines, Transport, Online Spend, Gaming, Travel, E-commerce, Market Segmentation
false
Customer and Market Segmentation
Technology & Software technology-and-software
Multiple Chart
Bain
View slide
Timeline from 1871 to 2020 showing major milestones for Handelsbanken, including restructures and financial crises, with a large image of a bank building, text annotations detailing each phase.
Strategic Planning
Financial Services
Chronicles the history and significant events in the development of Handelsbanken, emphasizing its stability and resilience through financial crises. Useful for corporate presentations and history lessons on banking.
Handelsbanken, banking, history, financial stability, crises, corporate resilience, timeline
false
Strategic Planning
Financial Services financial-services
Linear Flow
Bain
View slide
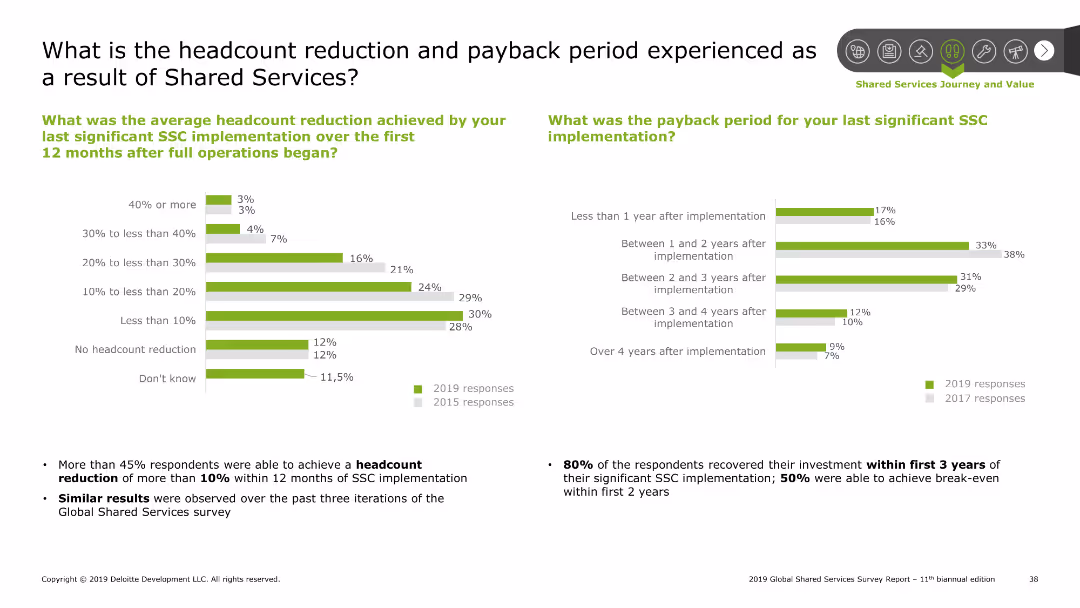
The slide has bar charts showing headcount reduction percentages and payback periods from SSC implementations.
Financial Performance
Professional Services
This slide provides data on headcount reduction and payback periods following significant shared services implementations, comparing responses from 2019 and 2017.
Headcount reduction, payback period, shared services, financial performance
false
Financial Performance
Professional Services professional-services
Multiple Chart
Deloitte
View slide
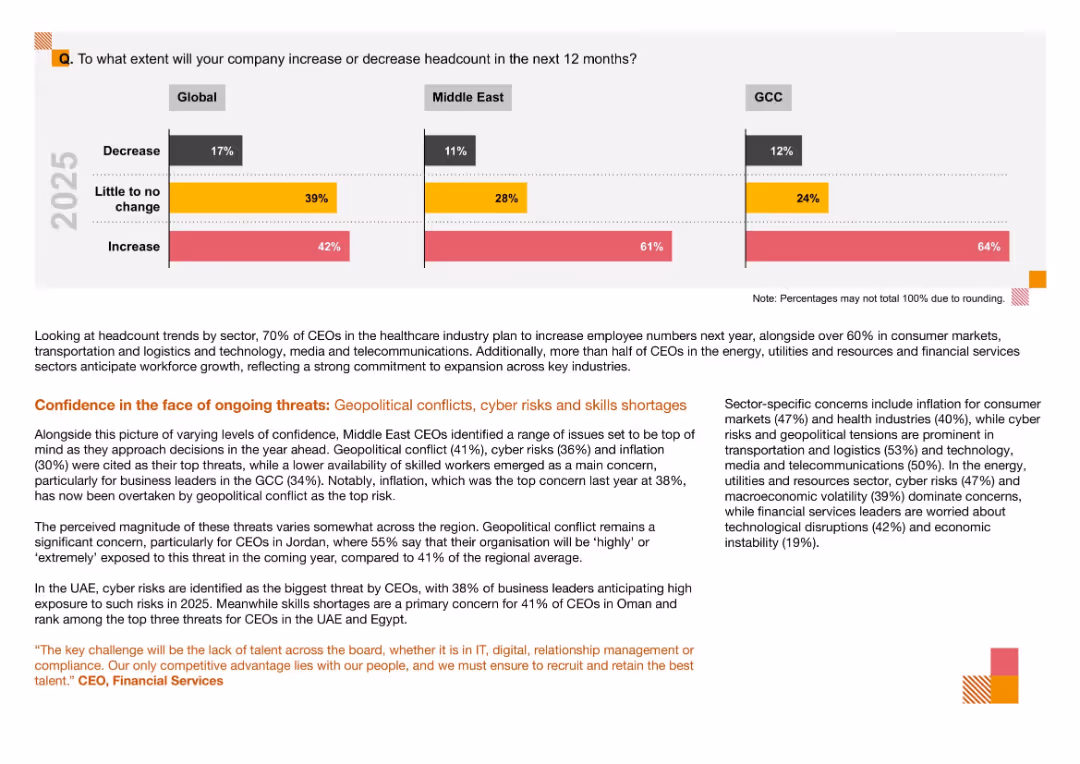
Three-bar segmented bar chart comparing Global, Middle East, and GCC regions; color-coded with text analysis below and highlights in orange and red
Human Resources and Talent Management
Financial Services
The slide shows anticipated headcount changes by region, highlighting growth expectations particularly in the GCC. It also outlines concerns like geopolitical conflict, cyber risks, and skills shortages, which shape CEO decisions on workforce planning in 2025.
Headcount, Workforce Trends, CEO Survey, Middle East, GCC, Cyber Risks, Geopolitical Conflict, Skills Shortage
false
Human Resources and Talent Management
Financial Services financial-services
Mixed Chart
PwC/Strategy&
View slide
This slide juxtaposes graphical trends with textual imperatives, offering a visual and narrative guide on the concurrent management of the pandemic and economic implications. The design is straightforward with effective use of space.
Strategic Planning
Professional Services
It delineates the dual imperatives of managing the health crisis and safeguarding the economy, presenting a timeline that visually correlates the spread of the virus with economic trends, serving as a strategic guide for leaders.
Health Crisis, Economic Trends, Strategic Guide, Leadership, Pandemic Management, Timeboxing, Dual Imperatives, Graphical Representation
false
Strategic Planning
Professional Services professional-services
Mixed Chart
McKinsey
View slide
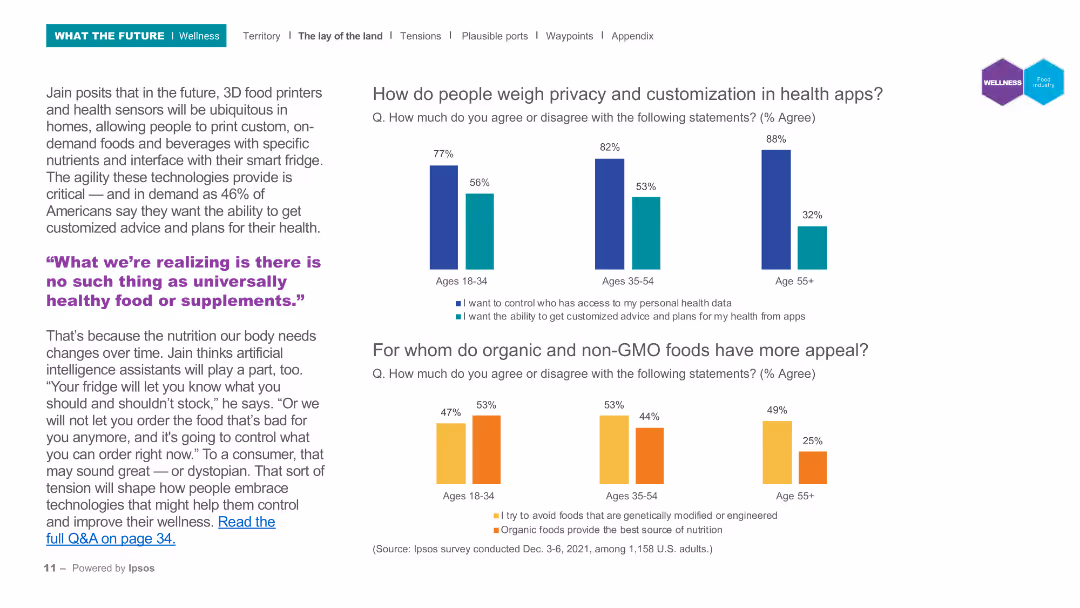
The slide contains column charts showing the importance of privacy and customization in health apps for different age groups.
Market Analysis and Trends
Healthcare & Pharmaceuticals
This slide examines the attitudes towards privacy and customization in health apps, showing significant age-based differences in priorities for health data control and personalized advice.
Health apps, privacy, customization, age groups, digital health
false
Market Analysis and Trends
Healthcare & Pharmaceuticals healthcare-and-pharmaceuticals
Multiple Chart
IPSOS
View slide
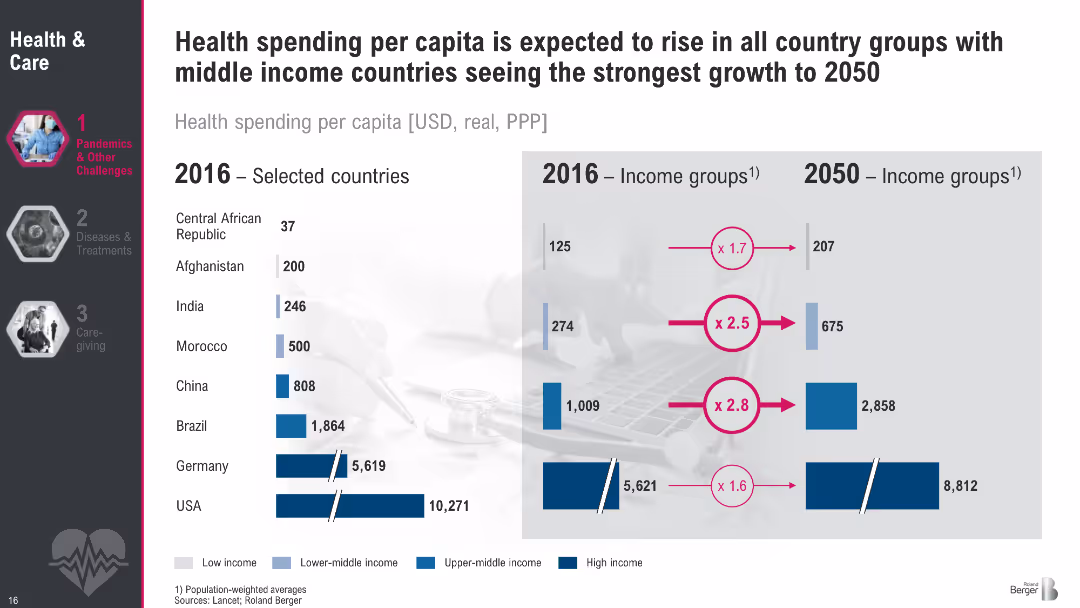
Comparative bar chart split by country and income groups (2016 vs. 2050 projections). Uses blue shades to represent income levels.
Financial Performance
Healthcare & Pharmaceuticals
This slide shows projected growth in per capita health spending across countries and income groups from 2016 to 2050. Low- and middle-income countries like India and China are projected to see the steepest increases, while high-income countries grow modestly. The visualization underlines disparities and expected convergence in global health investment.
Health expenditure, per capita, country comparison, income groups, projections, global health
false
Financial Performance
Healthcare & Pharmaceuticals healthcare-and-pharmaceuticals
Multiple Chart
Roland Berger
View slide
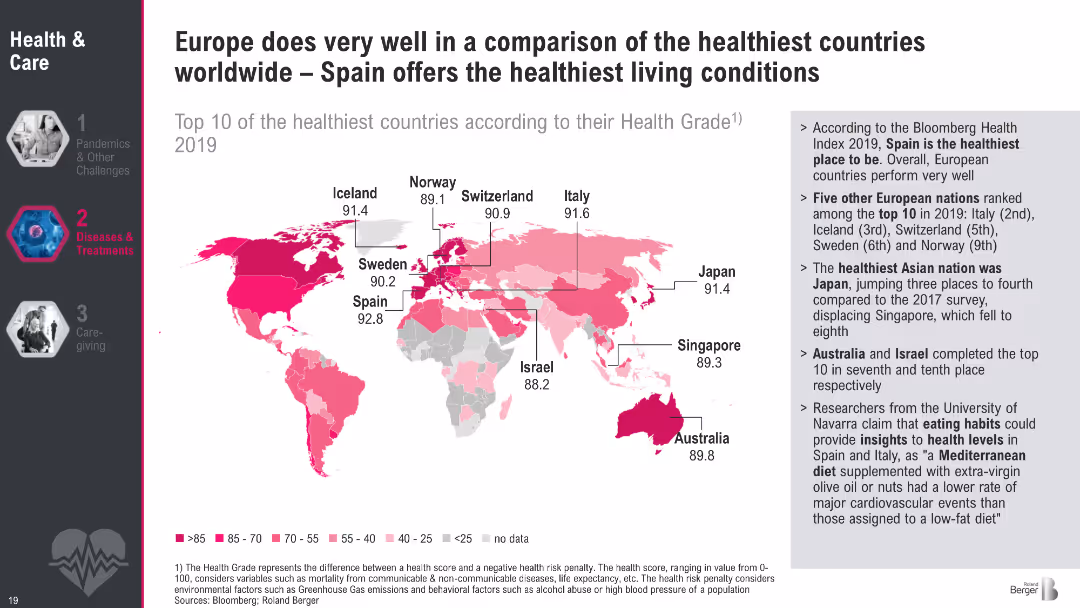
World map in pink gradients highlighting the top 10 healthiest countries according to Health Grade 2019. Right sidebar summarizes regional and dietary factors.
Industry Overview
Healthcare & Pharmaceuticals
This slide maps the top-ranked countries in terms of health based on the Bloomberg Health Index. Spain, Italy, and other European nations dominate the top 10. It attributes the high health rankings to lifestyle factors such as the Mediterranean diet. The sidebar offers brief insights into country-specific improvements and trends.
Health index, global health, country ranking, Mediterranean diet, wellness, Bloomberg
false
Industry Overview
Healthcare & Pharmaceuticals healthcare-and-pharmaceuticals
Graphic
Roland Berger
Previous
Loading...
Hold On!
We are searching in our database
If nothing, comes up, please try different filters!
Column Chart
Heatmap
Chevron
Org Chart
Infographic
Callouts
Timeline
List
Graphic
Picture
Process Flow
Diagram
Paragraph
Map
Table
Framework
Subtitle
Takeaway Box
Icon
Other Chart
Radar Chart
Waterfall Chart
Mekko Chart
Pie Chart
Scatter Plot
Line Chart
Bar chart
Bullet points
Create a FREE account to continue browsing
Receive Instant Access to 1,000+ slides from companies like McKinsey, Google, and Goldman Sachs
First Name
Last Name
Email
Password
I agree to all
Terms & Privacy Policy
Thank you! Your submission has been received!
Oops! Something went wrong while submitting the form.
Have an account?
Sign in
Upgrade to PRO to Save slides
Advanced Search and Filters
Access to 15,000+ slides
Access to Category Pages
Save/Bookmark Slides
PowerPoint Template Library
Pick a Plan
MONTHLY
$12/month
Billed every month, Cancel anytime.
YEARLY
$9/year
Billed $108 annually, Cancel anytime.
Checkout for $12/month
Checkout for $108/yr
Secured by Stripe | AES-256 bit encryption