My Account
My Slides
Search by Category
Templates
Leave Feedback
Login
Logout
Get Started
Browse all Slides
Browse all Slides
Create a FREE Account
Instant access to 1,000+ real slides from top companies like McKinsey, BCG, Goldman Sachs, Google and many more!
First Name
Last Name
Email
Password
I agree to all
Terms & Privacy Policy
Thank you! Your submission has been received!
Oops! Something went wrong while submitting the form.
Have an account?
Sign in
📢 Ready to start building slides? Check out our new template library
VIEW TEMPLATES
Welcome,
Welcome
PRO
Show Featured Only
Checkbox 8
Companies
Mckinsey
Bain
BCG
EY
Deloitte
Accenture
PwC/Strategy&
JP Morgan
Goldman Sachs
Morgan Stanley
Citigroup
Deutsche Bank
Barclays
LEK
KPMG
Kearney
Oliver Wyman
Booz Allen Hamilton
Gartner
IPSOS
Nielsen
Slide type
Text Only
Linear Flow
Vertical Flow
Single Chart
Header Horizontal
Mixed Chart
Header Vertical
Pillar
Multiple Chart
Graphic
Agenda
Title
Table
Framework
Industry
Technology & Software
Artificial Intelligence
Financial Services
Retail & E-commerce
Consumer Goods
Industrial & Manufacturing
Transportation & Logistics
Telecommunications
Real Estate & Construction
Hospitality & Tourism
Professional Services
Education & Training
Media & Entertainment
Agriculture & Food Production
Healthcare & Pharmaceuticals
Environmental Services & Sustainability
Government & Public Sector
Use Case
Mergers and Acquisitions
Performance Metrics and KPIs
Client Case Studies
Competitive Landscape
Corporate Finance and Valuation
Product and Service Analysis
Customer and Market Segmentation
Organizational Structure and Change
Industry Overview
Regulatory and Compliance
Risk Assessment and Management
Investment Analysis
Organizational Structure and Change
Human Resources and Talent Management
Financial Performance
Market Analysis and Trends
Sales and Business Development
Human Resources and Talent Management
Clear all
Thank you! Your submission has been received!
Oops! Something went wrong while submitting the form.
Tag
View slide
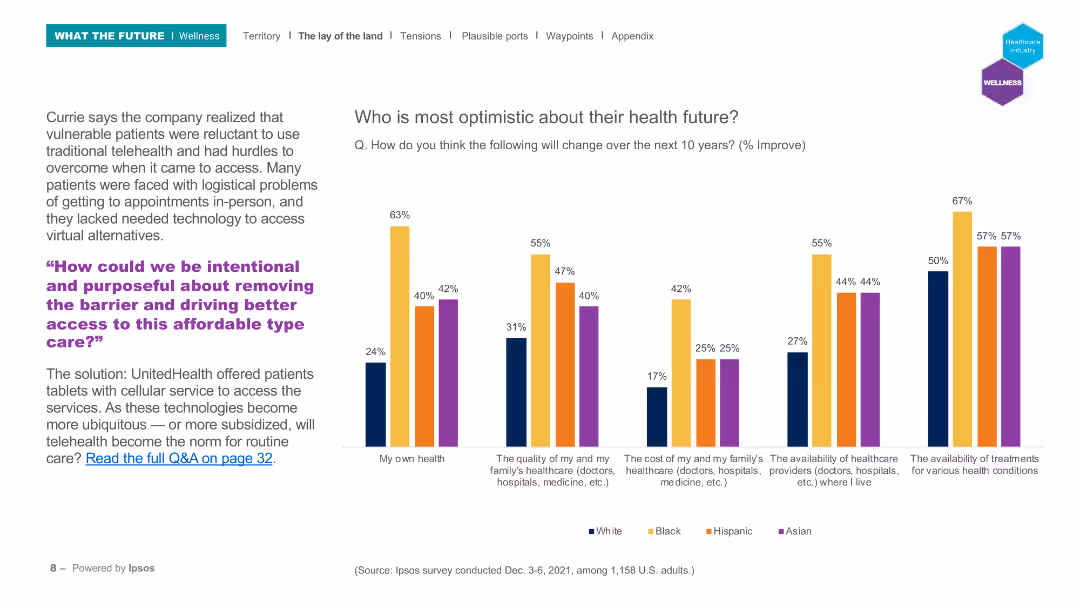
The slide features a column chart comparing optimism about health futures among different ethnic groups across several health-related categories.
Market Analysis and Trends
Healthcare & Pharmaceuticals
This slide presents survey data on optimism regarding future health across different ethnic groups in the U.S., highlighting disparities in expectations about personal health, healthcare quality, and availability.
Health optimism, ethnic groups, survey, healthcare, future trends
false
Market Analysis and Trends
Healthcare & Pharmaceuticals healthcare-and-pharmaceuticals
Mixed Chart
IPSOS
View slide
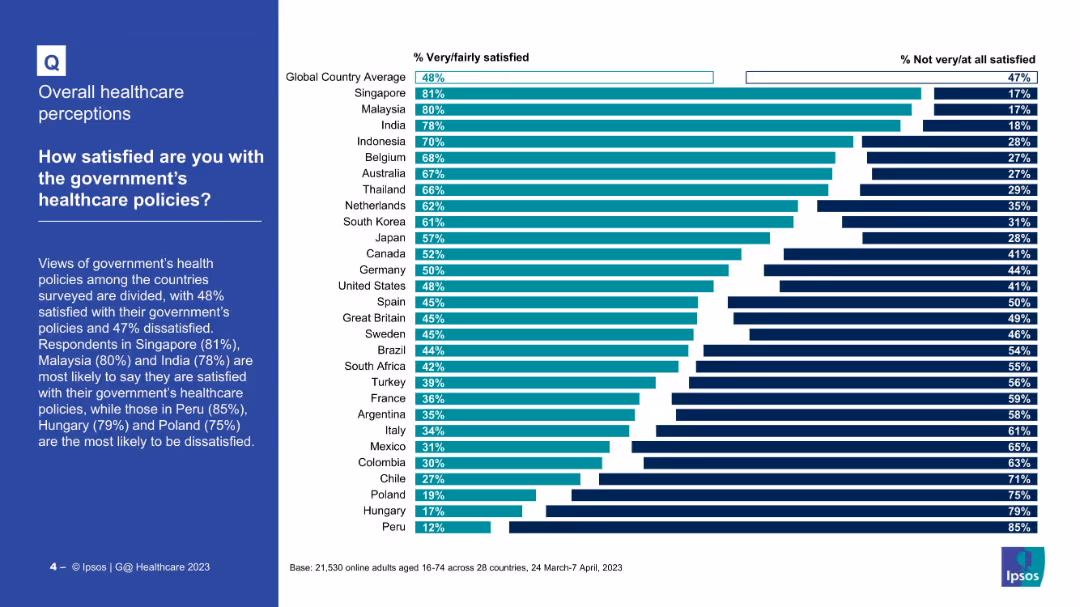
Bar chart showing satisfaction and dissatisfaction levels with healthcare policy by country
Market Analysis and Trends
Healthcare & Pharmaceuticals
This slide ranks countries based on citizens’ satisfaction with their government's healthcare policies. Singapore (81%) and Malaysia (80%) lead in satisfaction; Peru, Hungary, and Poland show the highest dissatisfaction.
Health policy, satisfaction, government, global survey, Ipsos, comparative analysis
false
Market Analysis and Trends
Healthcare & Pharmaceuticals healthcare-and-pharmaceuticals
Mixed Chart
IPSOS
View slide
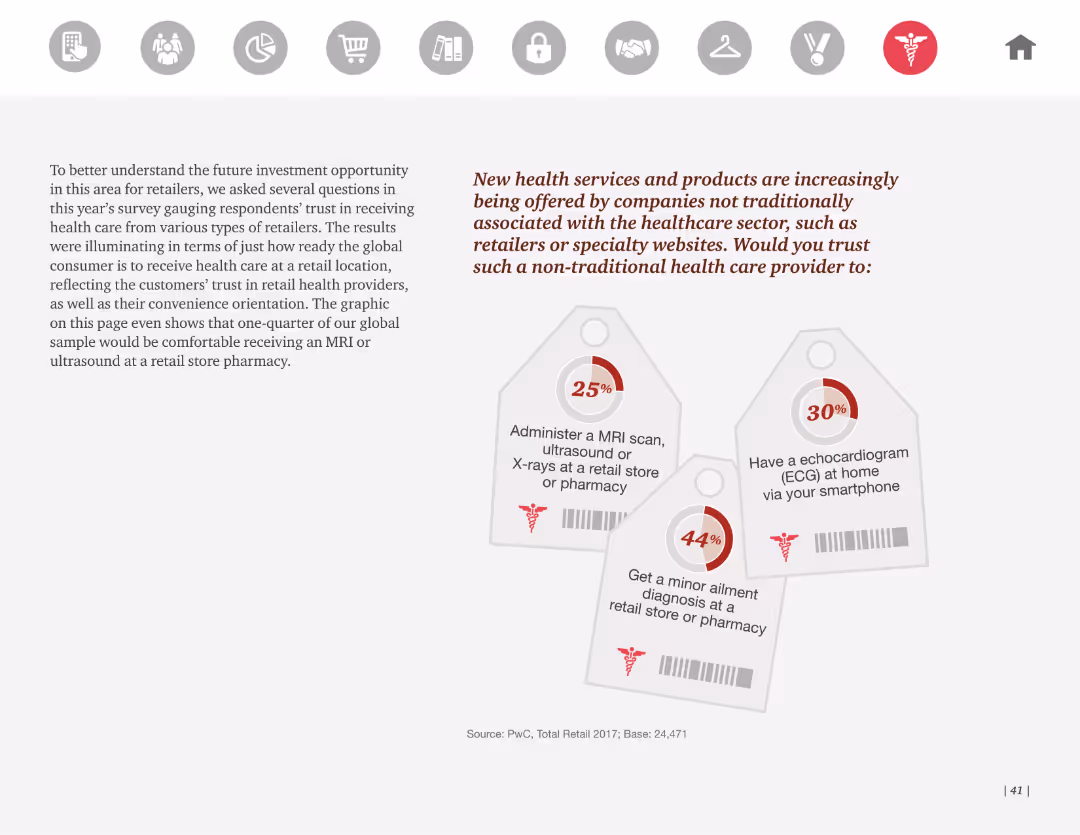
The slide shows a series of tag-shaped graphics with percentages, illustrating consumer willingness to receive healthcare services from non-traditional providers. It uses minimal text and a clean design.
Market Analysis and Trends
Healthcare & Pharmaceuticals
It discusses the trend of non-traditional companies offering health services, with a significant percentage of consumers willing to receive services like MRI scans, echocardiograms, and minor ailment diagnoses from retailers or online providers.
Health services, non-traditional providers, consumer trust, retail health, survey
false
Market Analysis and Trends
Healthcare & Pharmaceuticals healthcare-and-pharmaceuticals
Mixed Chart
PwC/Strategy&
View slide
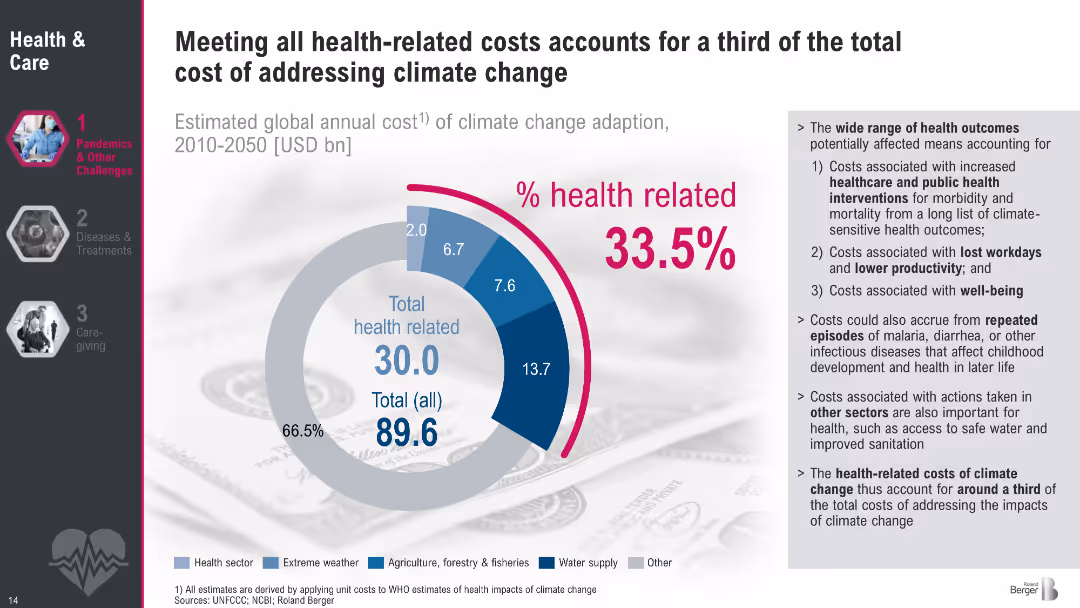
Donut chart showing health-related costs as part of climate change adaptation. Sidebar lists sources of health-related costs.
Strategic Planning
Healthcare & Pharmaceuticals
This slide presents a financial analysis of health-related costs within the broader climate adaptation budget. It reveals that health-related interventions comprise 33.5% of total adaptation costs from 2010–2050. It breaks down contributing factors such as healthcare interventions, productivity loss, and indirect costs from repeated infectious diseases and sanitation issues.
Health spending, climate adaptation, costs, interventions, sanitation, productivity, global health
false
Strategic Planning
Healthcare & Pharmaceuticals healthcare-and-pharmaceuticals
Mixed Chart
Roland Berger
View slide
This slide presents a structured summary of health outcomes influenced by broadband, using flowcharts and bullet points. It details user percentages accessing telehealth and other medical resources, citing benefits and drawbacks. Color coding assists in distinguishing between positive and negative impacts.
Market Analysis and Trends
Telecommunications
The slide outlines how broadband access has influenced health services, detailing user engagement and satisfaction with telehealth and online health resources.
Health, Broadband, Telehealth, Medical, Resources, Impact, Positive, Negative, Internet, Access
false
Market Analysis and Trends
Telecommunications telecommunications
Multiple Chart
Accenture
View slide
This slide features a side-by-side column chart comparison for Millennials and Gen Z's top concerns from 2020 to 2021. The chart is color-coded in green and blue, respectively, with a clear label for each concern.
Market Analysis and Trends
Healthcare & Pharmaceuticals
The slide presents comparative data on the evolving personal concerns of Millennials and Gen Z, highlighting health care/disease prevention as a top priority due to the pandemic.
Health, Concerns, Millennials, Gen Z, Pandemic, Data, Column Chart, Survey, Environment, Prevention
false
Market Analysis and Trends
Healthcare & Pharmaceuticals healthcare-and-pharmaceuticals
Single Chart
Deloitte
View slide
Slide with statistical data represented in charts, focused on mental and physical health concerns among women.
Technology and Digital Transformation
Healthcare & Pharmaceuticals
This slide examines critical concerns regarding women's mental and physical health, stressing the importance of well-being and the ability to switch off from work.
Health, Women, Mental Health, Physical Health, Data
false
Technology and Digital Transformation
Healthcare & Pharmaceuticals healthcare-and-pharmaceuticals
Title
Deloitte
View slide
The slide features a bar graph that outlines the growth forecast for health-tech market size and contains icons to represent different market segments.
Market Analysis and Trends
Healthcare & Pharmaceuticals
The slide projects the health-tech market growth and penetration among tier 2 and tier 3 populations, while acknowledging that the industry remains nascent. It provides insights into the challenges and potential for growth within health-tech, particularly in non-tier 1 city demographics. Useful for discussions on market potential and barriers to adoption in emerging markets.
Health-Tech, Market Growth, Penetration, Forecast, Barriers to Adoption, Emerging Markets
false
Market Analysis and Trends
Healthcare & Pharmaceuticals healthcare-and-pharmaceuticals
Mixed Chart
Kearney
View slide
The slide contains a blue column chart showing the monthly active user growth of Telemedicine platforms, indexed to January 2020. It has a source citation and a simple title header in red.
Client Case Studies
Healthcare & Pharmaceuticals
This slide demonstrates the significant growth and user retention of HealthTech platforms post-lockdown, with usage data indexed to pre-COVID-19 levels, signifying lasting impacts on health technology adoption.
HealthTech, Growth, User Retention, Telemedicine, Platforms, COVID-19, Lockdown, Adoption, Technology, Data
false
Client Case Studies
Healthcare & Pharmaceuticals healthcare-and-pharmaceuticals
Single Chart
Bain
View slide
A multi-year column chart presents investment trends in HealthTech, with a distinct color for each year. The layout includes a title at the top, a legend, and a source citation at the bottom.
Investment Analysis
Healthcare & Pharmaceuticals
The slide shows an upward trend in HealthTech investments over several years, highlighting deal numbers and values, which indicates growing financial interest in the sector.
HealthTech, Investments, Trends, Deal Value, Financial Interest, Growth, Sector, Analysis, Multi-Year, Data
false
Investment Analysis
Healthcare & Pharmaceuticals healthcare-and-pharmaceuticals
Single Chart
Bain
View slide
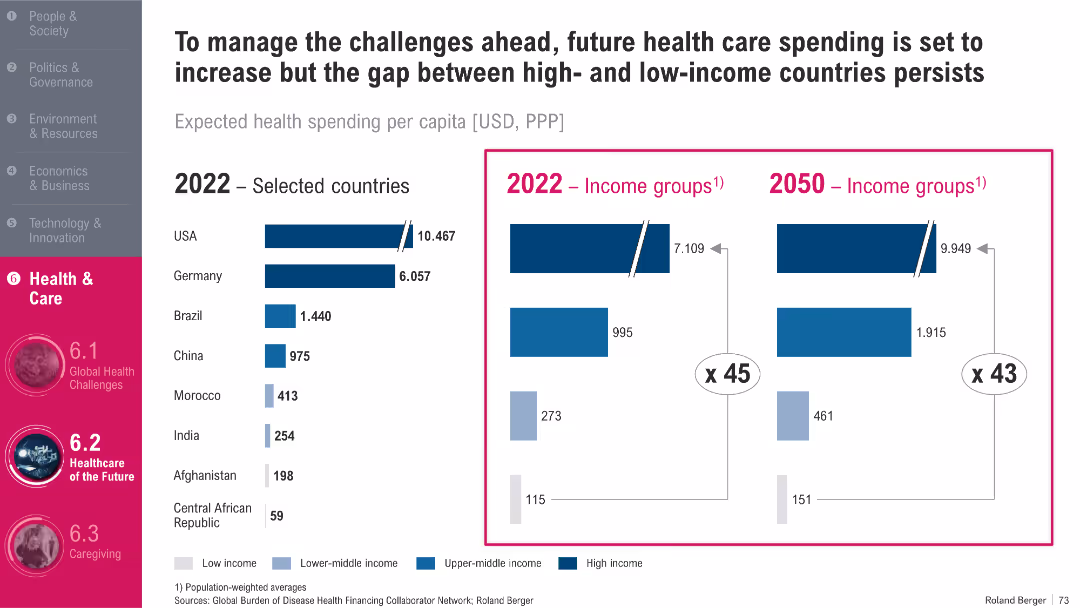
Dual charts: bar chart (left) for country data, bar chart (right) for income groups; strong contrast in bar coloring
Strategic Planning
Healthcare & Pharmaceuticals
This slide compares healthcare spending per capita across countries and income groups (2022 vs. 2050). It shows a widening gap between high- and low-income nations, despite overall increases in global healthcare investment. The disparity suggests persistent inequities in healthcare access and quality.
Healthcare Spending, Inequality, Forecast, PPP, Global Health Systems
false
Strategic Planning
Healthcare & Pharmaceuticals healthcare-and-pharmaceuticals
Single Chart
Roland Berger
View slide
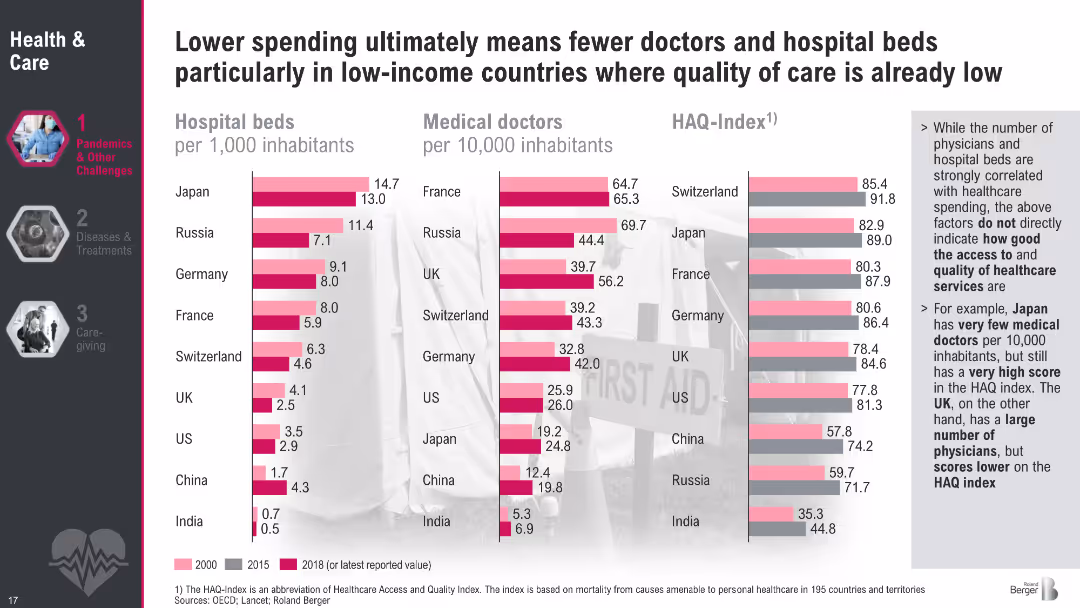
Three comparative bar charts for hospital beds, medical doctors, and HAQ Index across countries. Light to dark shades mark years (2000, 2015, 2018).
Human Resources and Talent Management
Healthcare & Pharmaceuticals
The slide compares healthcare infrastructure across countries—beds per capita, number of doctors, and healthcare quality (HAQ). It shows that low-income countries have significantly fewer resources. Interestingly, some high-scoring nations (like Japan) achieve good healthcare outcomes despite fewer doctors, revealing disparities in efficiency and access.
Healthcare access, HAQ Index, physicians, hospital beds, international comparison, infrastructure
false
Human Resources and Talent Management
Healthcare & Pharmaceuticals healthcare-and-pharmaceuticals
Multiple Chart
Roland Berger
View slide
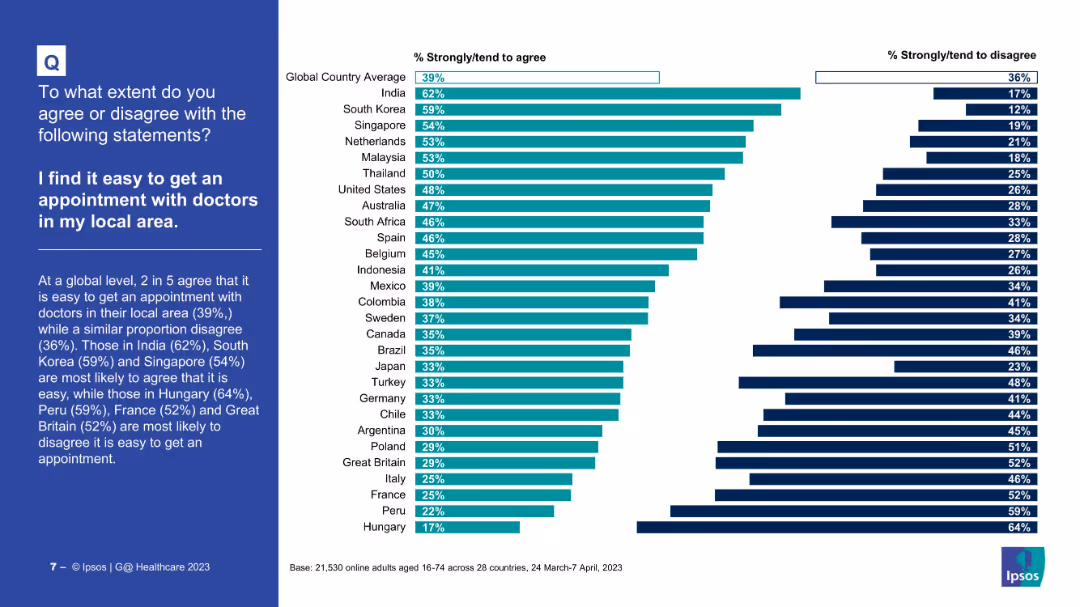
Country comparison bar chart on ease of getting doctor appointments locally
Market Analysis and Trends
Healthcare & Pharmaceuticals
The slide presents survey data showing how easy people in various countries find it to get local doctor appointments. India, South Korea, and Singapore report the most ease; Hungary and Peru the least.
Healthcare access, local doctors, appointment ease, survey data, international comparison, Ipsos
false
Market Analysis and Trends
Healthcare & Pharmaceuticals healthcare-and-pharmaceuticals
Mixed Chart
IPSOS
View slide
Slide showcasing L.E.K.'s healthcare sector overview, detailing their vertical and horizontal practices, and key capabilities.
Industry Overview
Healthcare & Pharmaceuticals
This slide provides an overview of L.E.K.'s comprehensive coverage of the healthcare ecosystem, including their practices and specialized capabilities.
Healthcare ecosystem, L.E.K., vertical practices, horizontal practices, capabilities
false
Industry Overview
Healthcare & Pharmaceuticals healthcare-and-pharmaceuticals
Diagram
LEK
View slide
The slide features a dark background, a quote in a yellow text box, and a question followed by a bar chart showing performance ratings of healthcare system aspects.
Customer and Market Segmentation
Healthcare & Pharmaceuticals
This slide presents Canadian consumers' ratings of the healthcare system's performance in optimizing experiences regardless of personal circumstances.
Healthcare experience, performance, consumer ratings, equitable treatment, Canada
false
Customer and Market Segmentation
Healthcare & Pharmaceuticals healthcare-and-pharmaceuticals
Mixed Chart
EY
View slide
Graphic slide showcasing the healthcare sector opportunity, including dedicated icons and statistics related to U.S. healthcare expenditure.
Market Analysis and Trends
Healthcare & Pharmaceuticals
Highlights the potential in the healthcare market, detailing JPMorgan Chase & Co.'s positioning and strategic focus.
Healthcare market, expenditure, U.S. GDP, banking strategy, JPMorgan Chase, financial services, market opportunity, client targeting
false
Market Analysis and Trends
Healthcare & Pharmaceuticals healthcare-and-pharmaceuticals
Linear Flow
JP Morgan
View slide
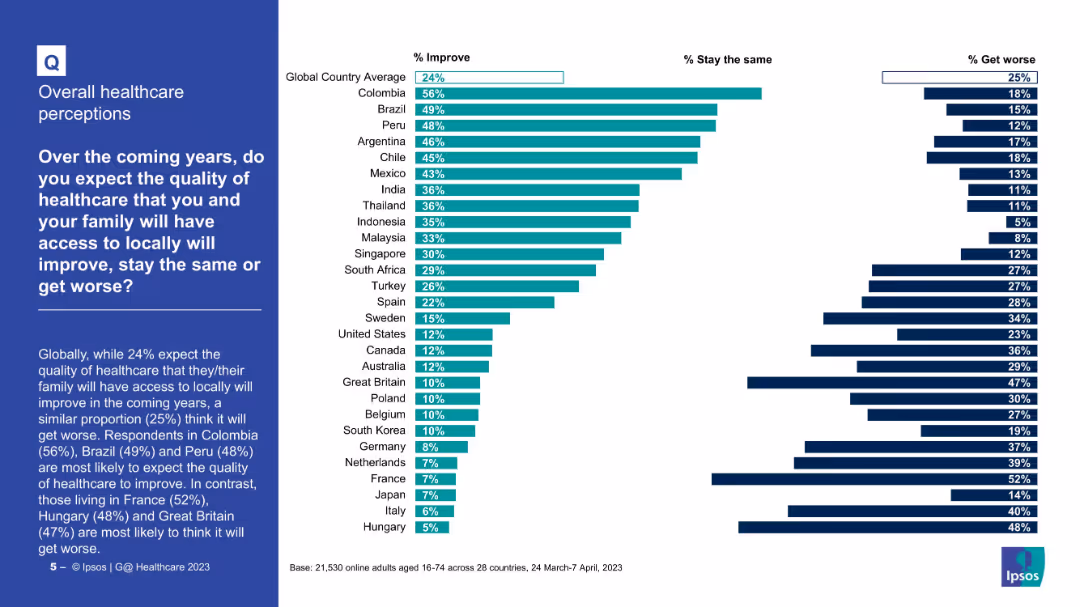
Horizontal bar chart comparing countries’ optimism, neutrality, or pessimism on future healthcare
Market Analysis and Trends
Healthcare & Pharmaceuticals
The slide reveals people’s expectations about healthcare quality in coming years. While 24% globally expect improvement, the highest optimism is in Colombia (56%). France and Hungary show most pessimism, expecting decline.
Healthcare outlook, future quality, global trends, public opinion, Ipsos
false
Market Analysis and Trends
Healthcare & Pharmaceuticals healthcare-and-pharmaceuticals
Mixed Chart
IPSOS
View slide
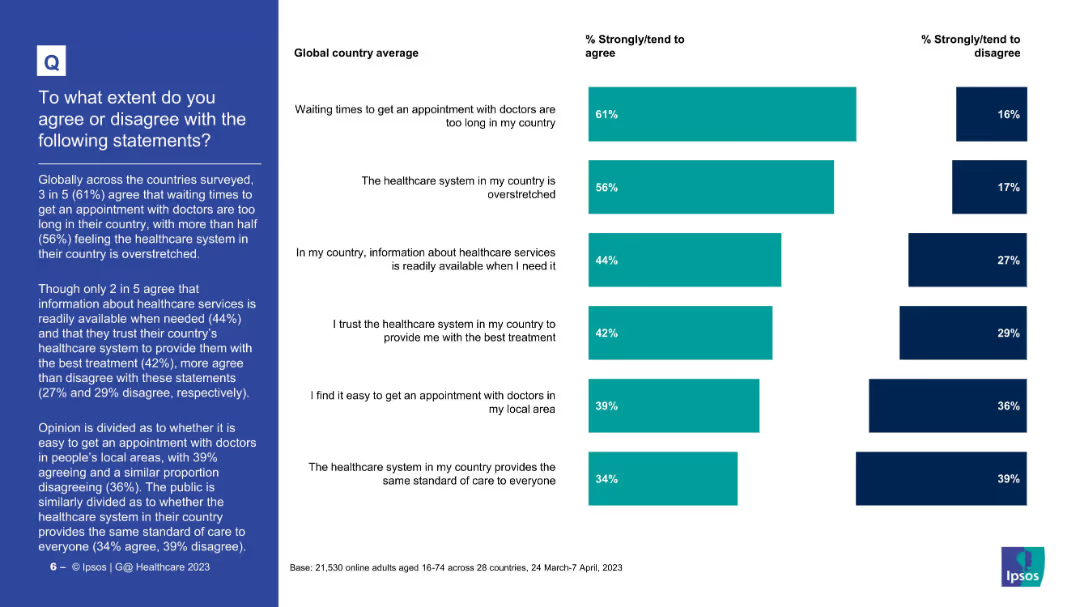
Vertical bar chart showing global averages for 6 healthcare-related statements
Market Analysis and Trends
Healthcare & Pharmaceuticals
This slide shows global average agreement levels on key healthcare system statements. 61% agree wait times are too long, and 56% believe the system is overstretched. Only 34% believe care is equal for all.
Healthcare perception, survey, global average, access to care, equity, satisfaction
false
Market Analysis and Trends
Healthcare & Pharmaceuticals healthcare-and-pharmaceuticals
Mixed Chart
IPSOS
View slide
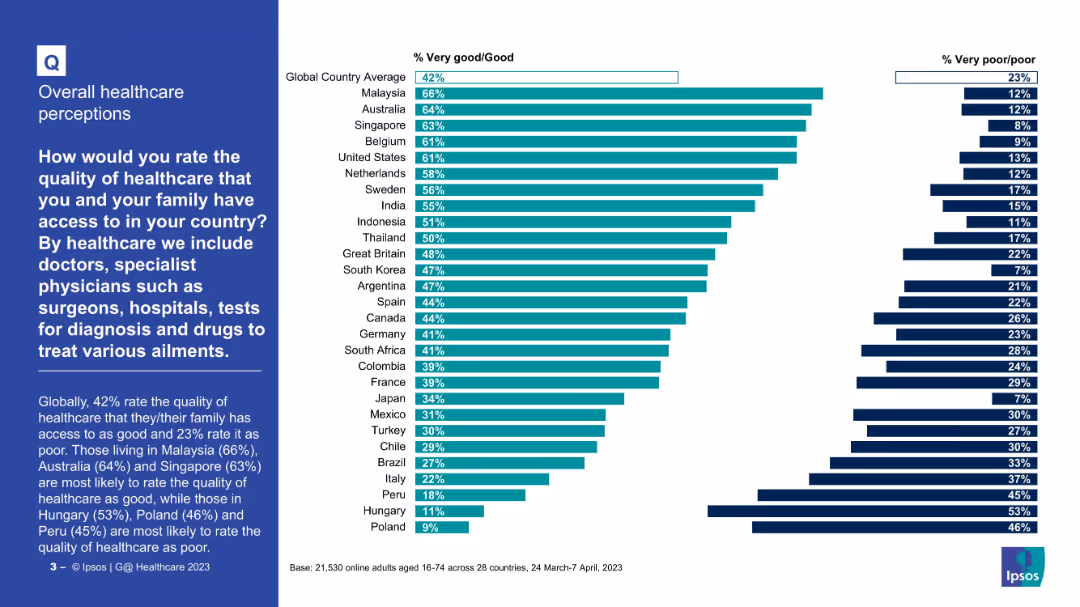
Horizontal bar chart comparing countries by percent rating healthcare as “Very good/Good” or “Poor”
Market Analysis and Trends
Healthcare & Pharmaceuticals
The chart compares how people in 28 countries rate the quality of healthcare. Malaysia, Australia, and Singapore top the list positively. Hungary, Peru, and Poland have the lowest satisfaction levels with highest “poor” ratings.
Healthcare quality, international comparison, satisfaction, global survey, medical care, Ipsos
false
Market Analysis and Trends
Healthcare & Pharmaceuticals healthcare-and-pharmaceuticals
Mixed Chart
IPSOS
View slide
Text-heavy slide with bullet points and icons representing various aspects of healthcare and bioengineering.
Regulatory and Compliance
Healthcare & Pharmaceuticals
Reviews potential healthcare innovations and disruptions due to bioengineering.
Healthcare, Bioengineering, Innovations, Disruptions
false
Regulatory and Compliance
Healthcare & Pharmaceuticals healthcare-and-pharmaceuticals
Header Vertical
McKinsey
View slide
This slide has two comparative diagrams contrasting the verticals of healthcare and connected cars, with related icons and key statistics.
Strategic Planning
Technology & Software
Illustrates J.P.Morgan's targeted vertical solutions with strategic investments in healthcare payments and connected car services.
Healthcare, Connected Cars, Vertical Solutions, Strategic Investments, J.P.Morgan
false
Strategic Planning
Technology & Software technology-and-software
Table
JP Morgan
View slide
Displays a grid layout with text and symbolic imagery for different aspects of future healthcare systems, like continuous monitoring and virtual care.
Strategic Planning
Healthcare & Pharmaceuticals
Provides a vision for digital transformation in healthcare, highlighting the necessity for innovations such as connected homes and intelligent treatments.
Healthcare, Digital Transformation, Future Trends, Patient Care, Technology Integration
false
Strategic Planning
Healthcare & Pharmaceuticals healthcare-and-pharmaceuticals
Table
Accenture
View slide
This slide has a column chart comparing doctors and hospital beds per '000 population across various countries. The background is white with blue and red bars, country flags, and a minimal text description.
Market Analysis and Trends
Healthcare & Pharmaceuticals
The slide presents healthcare statistics by country, focusing on the availability of doctors and hospital beds per '000 population. It is designed to highlight disparities in healthcare resources in the Asia-Pacific region.
Healthcare, Statistics, Access, Doctors, Hospital Beds, Asia-Pacific, Disparities, Resources, Comparison, Countries
false
Market Analysis and Trends
Healthcare & Pharmaceuticals healthcare-and-pharmaceuticals
Single Chart
Bain
View slide
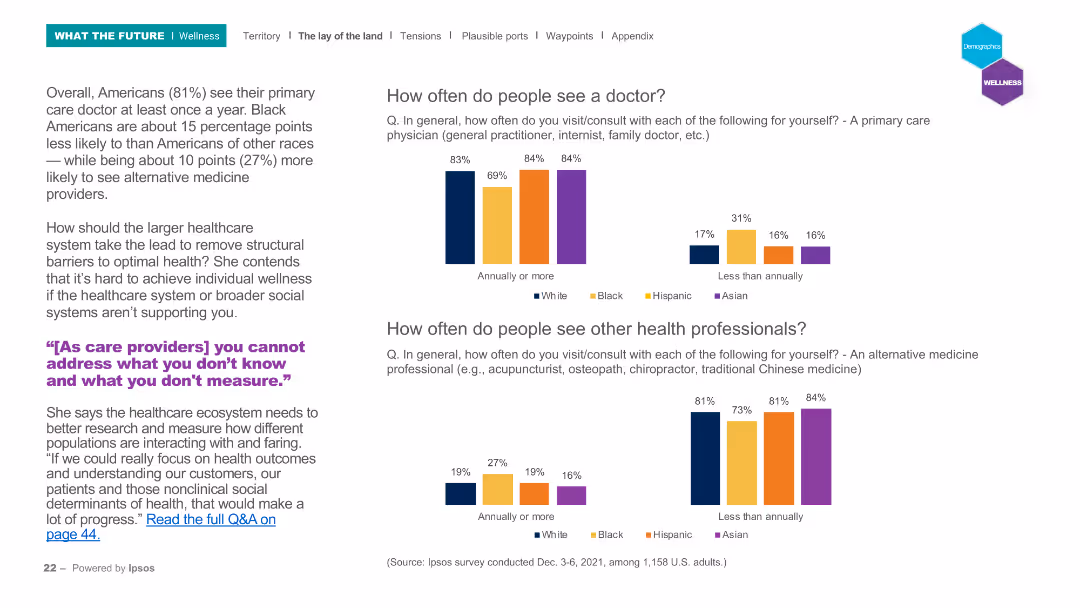
The slide has a header and two sections: a text block on the left and two sets of column charts on the right. The first column chart shows the frequency of doctor visits among different ethnic groups, while the second shows the frequency of visits to other health professionals, using different colors for each ethnic group.
Market Analysis and Trends
Healthcare & Pharmaceuticals
Analyzes the frequency of primary care doctor visits and consultations with other health professionals among different ethnic groups in the U.S. The column charts compare annual and less frequent visits, highlighting disparities in healthcare access and usage among these groups.
Healthcare, doctor visits, ethnic groups, survey, frequency
false
Market Analysis and Trends
Healthcare & Pharmaceuticals healthcare-and-pharmaceuticals
Multiple Chart
IPSOS
View slide
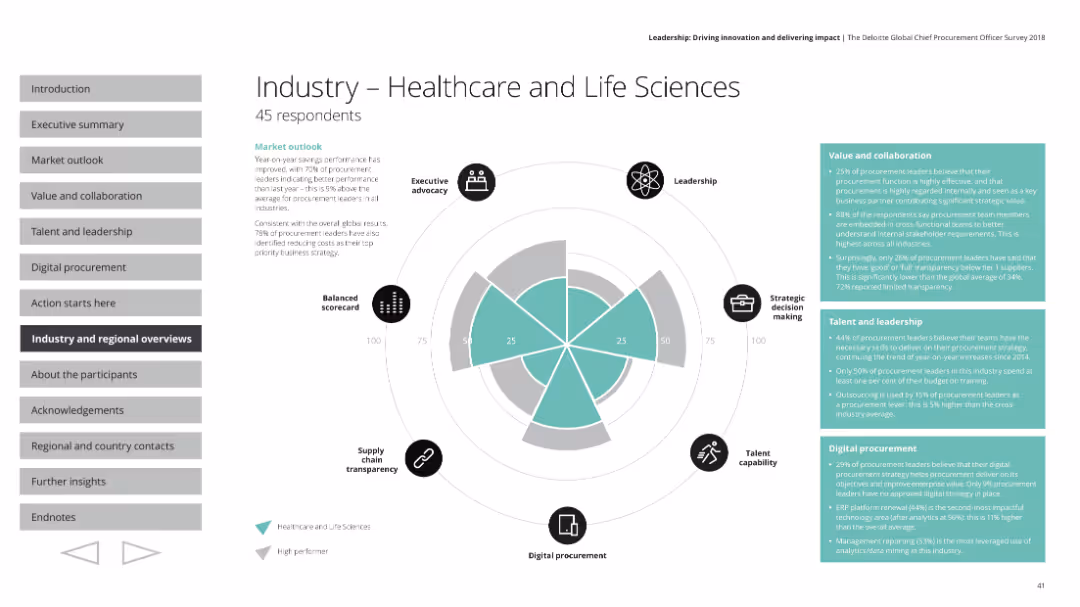
The slide shows a radar chart with various performance indicators, along with text boxes containing detailed survey results and small icons for each metric.
Industry Overview
Healthcare & Pharmaceuticals
This slide provides insights into the healthcare and life sciences industry's procurement performance from a survey. It discusses executive advocacy, leadership, strategic decision making, talent capability, digital procurement, and supply chain transparency, with market outlook and specific metrics on value, collaboration, talent, and leadership.
Healthcare, life sciences, procurement, radar chart, survey results
false
Industry Overview
Healthcare & Pharmaceuticals healthcare-and-pharmaceuticals
Mixed Chart
Deloitte
View slide
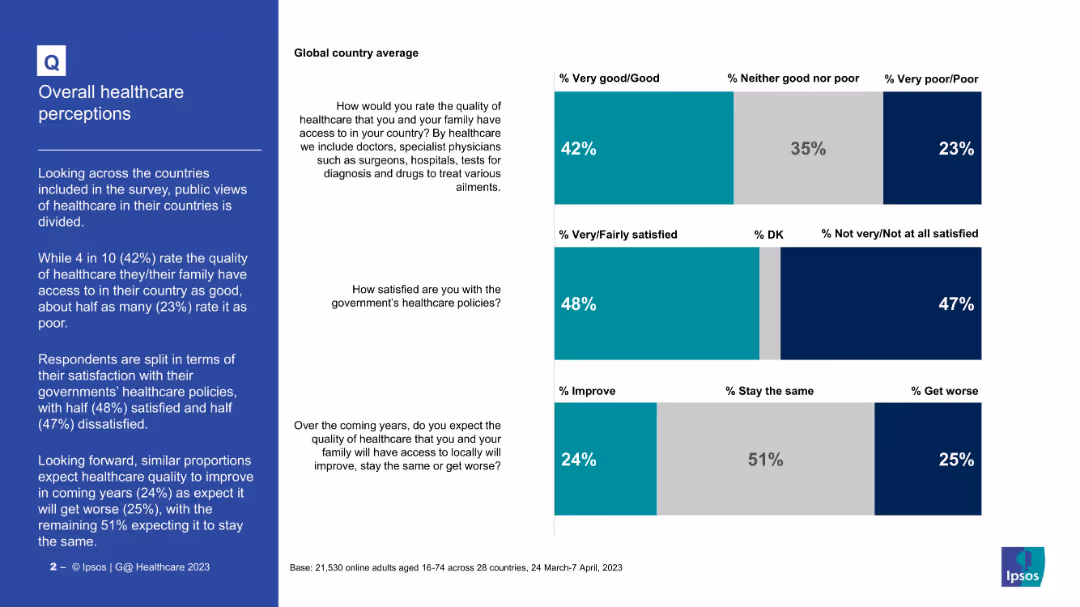
Three bar charts (stacked) with global averages for healthcare quality, policy satisfaction, outlook
Market Analysis and Trends
Healthcare & Pharmaceuticals
This slide provides global perceptions of healthcare based on three questions: quality of healthcare (42% good), satisfaction with policies (48%), and future outlook (24% expect improvement). Views are fairly divided on all metrics.
Healthcare, public opinion, global average, satisfaction, policy, healthcare quality, future outlook, survey
false
Market Analysis and Trends
Healthcare & Pharmaceuticals healthcare-and-pharmaceuticals
Mixed Chart
IPSOS
View slide
The slide features a header, a text block on the left, and a column chart on the right. The column chart presents survey data on racial factors in patient experience, comparing agreement levels on respectful treatment, comfort in disclosing personal information, and the impact of provider's race on patient comfort, using multiple colors.
Strategic Planning
Healthcare & Pharmaceuticals
Discusses the importance of better research in reducing healthcare inequities. The column chart shows survey results on how race impacts patient experience, highlighting areas for improvement in respectful treatment, comfort in disclosing information, and patient comfort with racially concordant providers.
Healthcare, research, inequity, race, patient experience
false
Strategic Planning
Healthcare & Pharmaceuticals healthcare-and-pharmaceuticals
Mixed Chart
IPSOS
View slide
A straightforward column chart displaying the total deal value in the Healthtech sector over time, with a summary of key points in text to the side. The chart is highlighted with selective coloring to draw attention to the increasing trend.
Investment Analysis
Healthcare & Pharmaceuticals
The slide showcases Healthtech's increasing deal values over the years, with a record peak in H1 2021. It emphasizes the sector's resilience and potential for future growth, suggesting a strong market presence and investor interest.
Healthtech, Deal Value, Growth, Investment, SEA
false
Investment Analysis
Healthcare & Pharmaceuticals healthcare-and-pharmaceuticals
Mixed Chart
Bain
View slide
The slide has a split design comparing two sectors, Healthtech and Edtech, with circular percentage charts and supporting text.
Market Analysis and Trends
Technology & Software
This slide compares Healthtech and Edtech adoption rates in the past year, showing potential areas of growth and interest for consumers.
Healthtech, Edtech, Adoption Rates, Digital Consumers, Growth Potential, Market Analysis
false
Market Analysis and Trends
Technology & Software technology-and-software
Multiple Chart
Bain
View slide
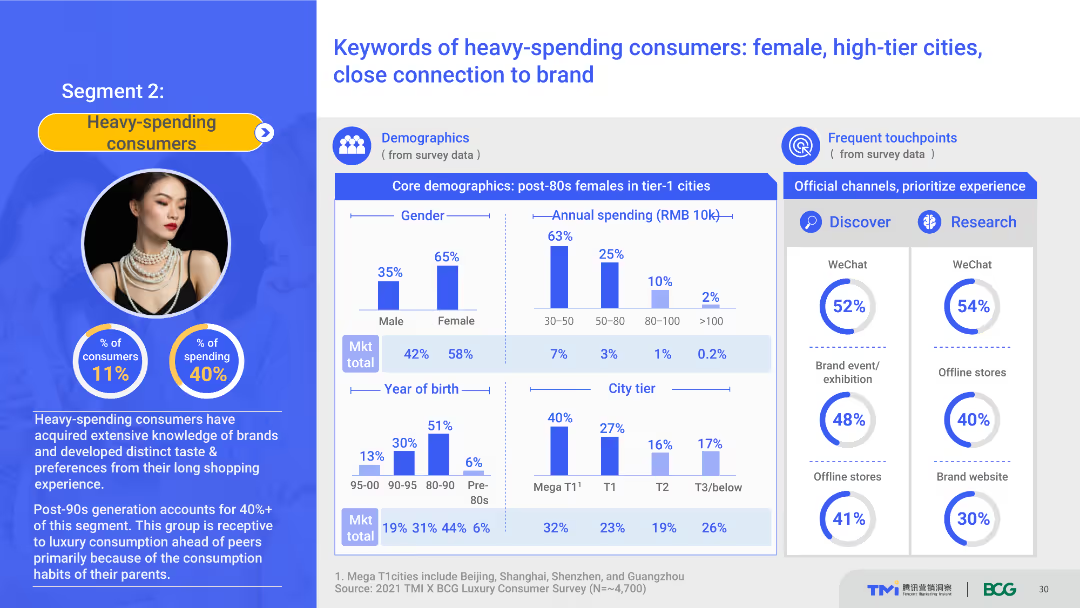
Several charts and graphs detailing demographics, spending patterns, and frequent touchpoints of heavy-spending consumers. The layout is dense with data, including pie charts and bar graphs.
Market Analysis and Trends
Consumer Goods
Provides an overview of the demographic and spending behavior of heavy-spending consumers in high-tier cities. Emphasizes the importance of WeChat as a touchpoint and the close brand connections of this consumer segment.
Heavy-spending consumers, demographics, high-tier cities, WeChat, brand connection
false
Market Analysis and Trends
Consumer Goods consumer-goods
Multiple Chart
BCG
Previous
Loading...
Hold On!
We are searching in our database
If nothing, comes up, please try different filters!
Column Chart
Heatmap
Chevron
Org Chart
Infographic
Callouts
Timeline
List
Graphic
Picture
Process Flow
Diagram
Paragraph
Map
Table
Framework
Subtitle
Takeaway Box
Icon
Other Chart
Radar Chart
Waterfall Chart
Mekko Chart
Pie Chart
Scatter Plot
Line Chart
Bar chart
Bullet points
Create a FREE account to continue browsing
Receive Instant Access to 1,000+ slides from companies like McKinsey, Google, and Goldman Sachs
First Name
Last Name
Email
Password
I agree to all
Terms & Privacy Policy
Thank you! Your submission has been received!
Oops! Something went wrong while submitting the form.
Have an account?
Sign in
Upgrade to PRO to Save slides
Advanced Search and Filters
Access to 15,000+ slides
Access to Category Pages
Save/Bookmark Slides
PowerPoint Template Library
Pick a Plan
MONTHLY
$12/month
Billed every month, Cancel anytime.
YEARLY
$9/year
Billed $108 annually, Cancel anytime.
Checkout for $12/month
Checkout for $108/yr
Secured by Stripe | AES-256 bit encryption