My Account
My Slides
Search by Category
Templates
Leave Feedback
Login
Logout
Get Started
Browse all Slides
Browse all Slides
Create a FREE Account
Instant access to 1,000+ real slides from top companies like McKinsey, BCG, Goldman Sachs, Google and many more!
First Name
Last Name
Email
Password
I agree to all
Terms & Privacy Policy
Thank you! Your submission has been received!
Oops! Something went wrong while submitting the form.
Have an account?
Sign in
📢 Ready to start building slides? Check out our new template library
VIEW TEMPLATES
Welcome,
Welcome
PRO
Show Featured Only
Checkbox 8
Companies
Mckinsey
Bain
BCG
EY
Deloitte
Accenture
PwC/Strategy&
JP Morgan
Goldman Sachs
Morgan Stanley
Citigroup
Deutsche Bank
Barclays
LEK
KPMG
Kearney
Oliver Wyman
Booz Allen Hamilton
Gartner
IPSOS
Nielsen
Slide type
Text Only
Linear Flow
Vertical Flow
Single Chart
Header Horizontal
Mixed Chart
Header Vertical
Pillar
Multiple Chart
Graphic
Agenda
Title
Table
Framework
Industry
Technology & Software
Artificial Intelligence
Financial Services
Retail & E-commerce
Consumer Goods
Industrial & Manufacturing
Transportation & Logistics
Telecommunications
Real Estate & Construction
Hospitality & Tourism
Professional Services
Education & Training
Media & Entertainment
Agriculture & Food Production
Healthcare & Pharmaceuticals
Environmental Services & Sustainability
Government & Public Sector
Use Case
Mergers and Acquisitions
Performance Metrics and KPIs
Client Case Studies
Competitive Landscape
Corporate Finance and Valuation
Product and Service Analysis
Customer and Market Segmentation
Organizational Structure and Change
Industry Overview
Regulatory and Compliance
Risk Assessment and Management
Investment Analysis
Organizational Structure and Change
Human Resources and Talent Management
Financial Performance
Market Analysis and Trends
Sales and Business Development
Human Resources and Talent Management
Clear all
Thank you! Your submission has been received!
Oops! Something went wrong while submitting the form.
Tag
View slide
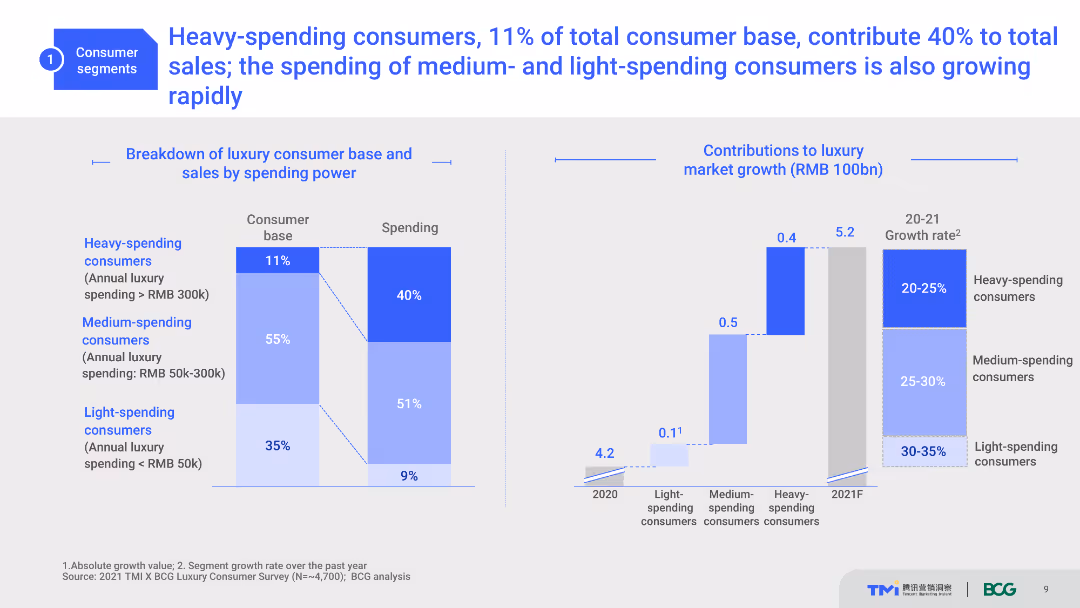
The slide features a column chart showing the breakdown of luxury consumer base and sales by spending power, with an emphasis on heavy-spending consumers.
Market Analysis and Trends
Retail & E-commerce
This slide highlights the contribution of heavy-spending consumers to the luxury market, indicating that although they are a smaller percentage of the consumer base, they contribute significantly to total sales, emphasizing the importance of targeting this group.
Heavy-spending consumers, luxury market, spending power, market growth, consumer base
false
Market Analysis and Trends
Retail & E-commerce retail-and-e-commerce
Multiple Chart
BCG
View slide
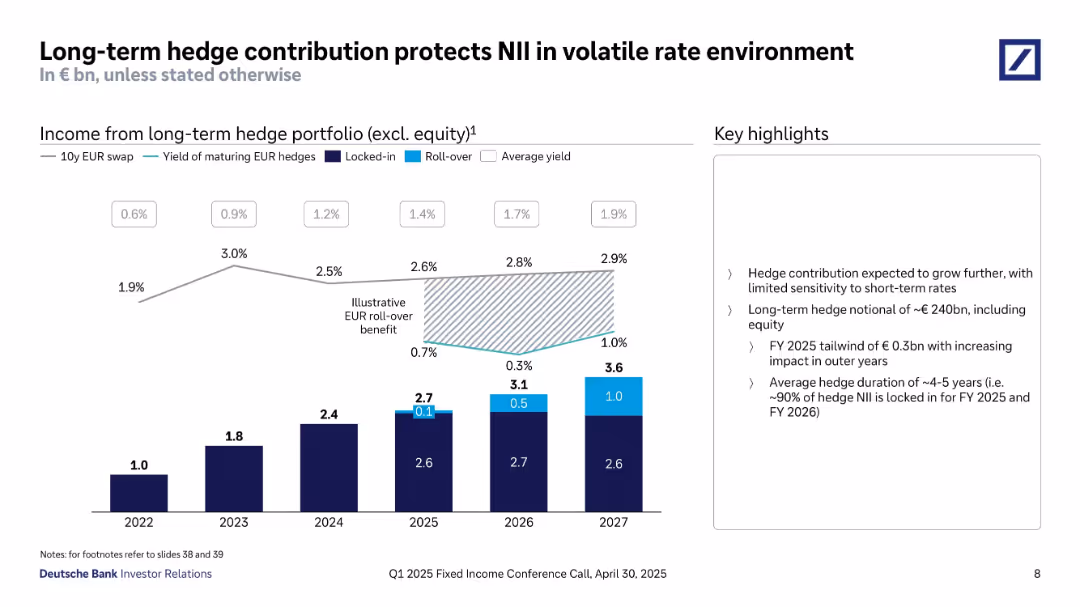
Bar chart showing income from long-term hedge portfolio over time; line graphs and shaded area show rate yields; text box with highlights.
Risk Assessment and Management
Financial Services
This slide illustrates how Deutsche Bank’s long-term hedge portfolio stabilizes NII. It shows income trends from 2022–2027, hedge yields, and locked-in rates. Key takeaways include low sensitivity to short-term rates and 90% hedge NII locked for FY 2025–26.
Hedge Portfolio, NII Protection, Interest Rate Risk, Long-term Strategy, Yield, FY 2025, Risk Management
false
Risk Assessment and Management
Financial Services financial-services
Mixed Chart
Deutsche Bank
View slide
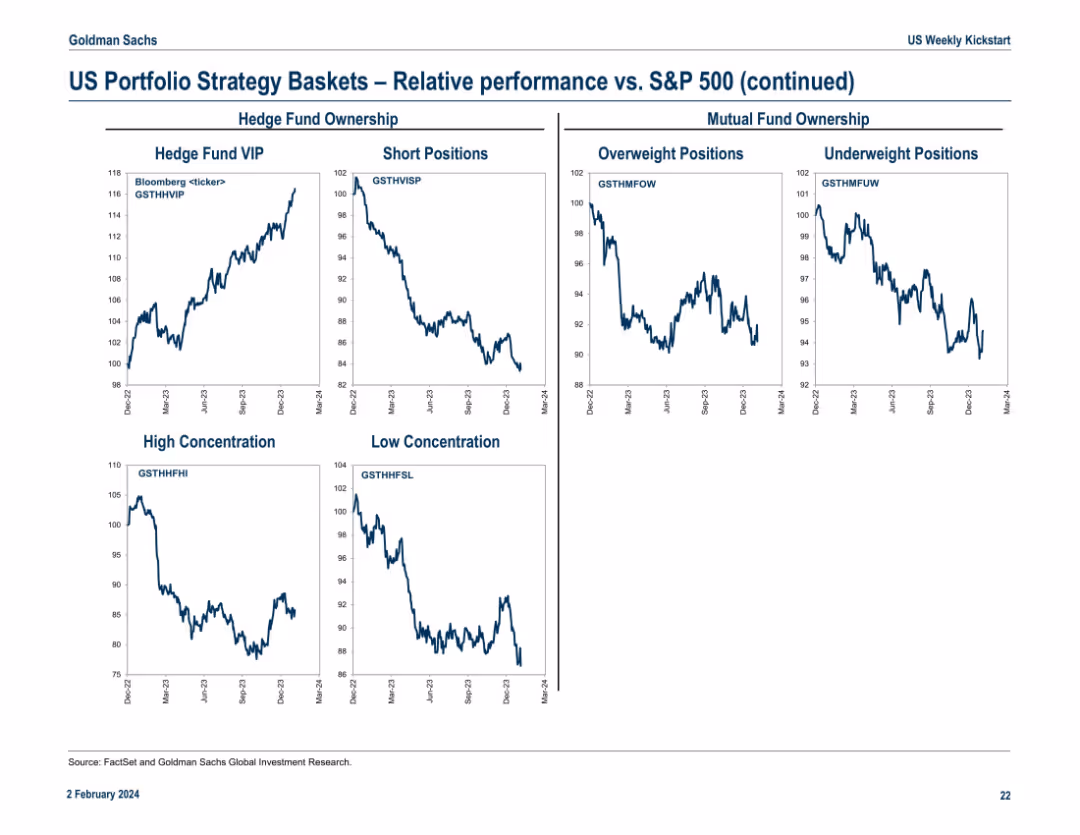
Six-panel layout with line charts showing various investment basket performances versus the S&P 500. Each panel has a different metric (e.g., Hedge Fund VIP, Short Positions). Basic grid structure, minimal text.
Performance Metrics and KPIs
Financial Services
This slide compares the relative performance of different hedge fund and mutual fund baskets (VIP, Short, Overweight, Underweight, High/Low Concentration) against the S&P 500 over the past year. The intent is to track investor positioning and sentiment through visual trend lines.
Hedge funds, mutual funds, short positions, overweights, S&P 500, trends
false
Performance Metrics and KPIs
Financial Services financial-services
Multiple Chart
Goldman Sachs
View slide
Includes a line chart and column chart showing the trends in hedge yields and the impact on gross income from 2019 to 2026, highlighting stability despite rate changes.
Financial Performance
Financial Services
This slide details the income stability through structural hedges, showing historical data and future projections of hedge yields and their impact on gross income. It underpins financial stability strategies by illustrating how income resilience is maintained through financial instruments.
Hedging, Income Stability, Projections, Finance
false
Financial Performance
Financial Services financial-services
Multiple Chart
Barclays
View slide
The slide is split horizontally, with two sections for "Helicopters" and "Aircrafts". Each section has its own set of bullet points and financial figures presented in red text. Icons for helicopters and aircraft are used to represent each category.
Financial Performance
Industrial & Manufacturing
The slide presents financial confidence in the medium to long-term prospects for helicopters and aircraft businesses, with data on backlogs and revenue growth over the past years. It is likely used to communicate business stability and forecast future growth to stakeholders.
Helicopters, Aircraft, Revenue, EBITA, Financial Growth
false
Financial Performance
Industrial & Manufacturing industrial-and-manufacturing
Header Vertical
Goldman Sachs
View slide
Pie charts and column chart showing Hellmann’s financial performance, market segmentation, and growth trends. Features data on market strategy for mayonnaise and variations.
Strategic Planning
Consumer Goods
Examines Hellmann’s growth and market strategy, focusing on its strong position in mayonnaise across various markets and its recent performance trends. Details strategic initiatives for maintaining market leadership.
Hellmann’s, Market Strategy, Growth Trends, Market Leadership, Strategic Initiatives
false
Strategic Planning
Consumer Goods consumer-goods
Multiple Chart
Deutsche Bank
View slide
The slide shows a column chart with features like detailed product descriptions, size calculators, and 360° views that shoppers find helpful for avoiding returns.
Customer and Market Segmentation
Retail & E-commerce
Identifies features that online shoppers consider helpful to prevent returns, such as detailed product descriptions, size calculators, and various product viewing options.
Helpful features, Online shopping, Product selection, Size calculator, 360° view
false
Customer and Market Segmentation
Retail & E-commerce retail-and-e-commerce
Mixed Chart
Roland Berger
View slide
The slide features two side-by-side graphs: one for Henry Hub and the other for UK NBP gas prices. Each graph shows the price estimates from banks, brokers, and consultants. The background image depicts a gas facility. Text explains trends.
Market Analysis and Trends
Energy & Utilities
This slide forecasts gas prices for Henry Hub and UK NBP, comparing bank, broker, and consultant estimates. It discusses the price trends and provides average price forecasts for 2026, highlighting the wide range of estimates due to market dynamics.
Henry Hub, UK NBP, gas prices, forecasts, bank/broker, consultants
false
Market Analysis and Trends
Energy & Utilities energy-and-utilities
Multiple Chart
EY
View slide
Central circular diagram surrounded by text blocks that emphasize the bank's strengths, with a background of a global map.
Strategic Planning
Financial Services
This slide emphasizes the longstanding global reach and comprehensive services of the bank, portraying it as a reliable financial partner through various market cycles, geared towards future client needs with robust financial strategies.
Heritage, Global, Strategy, Financial Services, Client Needs, Market Cycles, Future
false
Strategic Planning
Financial Services financial-services
Framework
Deutsche Bank
View slide
The slide depicts a circular diagram with four quadrants, each containing an icon and text. The purple central circle anchors the design, while arrows point outward to the individual pathways described.
Strategic Planning
Technology & Software
Outlines four strategic pathways that High Tech companies can pursue to expand industry boundaries, such as mergers & acquisitions, strategic alliances, demand sensors, and leveraging the installed base for expansion into adjacent areas.
High Tech, mergers & acquisitions, strategic alliances, demand sensors, adjacent areas, industry ecosystems, leapfrog growth, market-relevant joint offerings, bespoke solutions, installed base
true
Strategic Planning
Technology & Software technology-and-software
Diagram
Accenture
View slide
The slide features a dual-axis line chart tracking cumulative flows of US and European high yield bonds from 2013 to 2023. It uses a blue color scheme with two distinct lines, one for each region.
Market Analysis and Trends
Financial Services
This slide presents a comparison of high yield bond funds in the US and Europe, showing a trend of shrinkage since the end of 2020. It is useful for analyzing market movements and investment strategies in the corporate credit sector.
High Yield, Bonds, US, Europe, Trend, Market Analysis, Investment, Corporate Credit, Data Visualization
false
Market Analysis and Trends
Financial Services financial-services
Single Chart
Morgan Stanley
View slide
This slide has two line charts. The left chart shows the High Yield OAS from 1998 to 2023, while the right chart compares yields of Floating-Rate Loans, Emerging Markets, and High-Yield Bonds from 2015 to 2024.
Investment Analysis
Financial Services
The slide evaluates the current high yield market, showing that tight spreads offer less value and suggesting a shift to bank loans due to tighter spreads in the high yield market.
High Yield, OAS, Floating-Rate Loans, Emerging Markets, High-Yield Bonds, Investment, Market Trends
false
Investment Analysis
Financial Services financial-services
Multiple Chart
Morgan Stanley
View slide
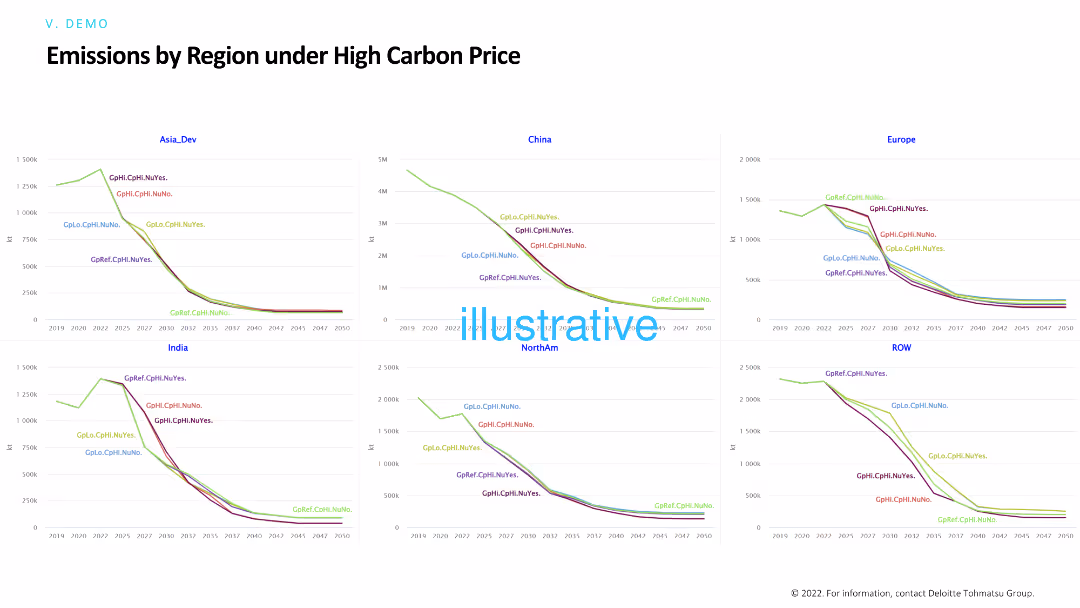
Similar to the previous slide, this one includes line charts showing emissions by region under high carbon price scenarios. The charts provide detailed comparisons of emissions trajectories for different regions over time.
Risk Assessment and Management
Environmental Services & Sustainability
This slide focuses on the impact of high carbon pricing on emissions across various regions, aiding in evaluating the effectiveness of carbon pricing policies in reducing emissions and managing environmental risks.
High carbon price, emissions, regions, environmental policies, carbon pricing
false
Risk Assessment and Management
Environmental Services & Sustainability environmental-services-and-sustainability
Multiple Chart
Deloitte
View slide
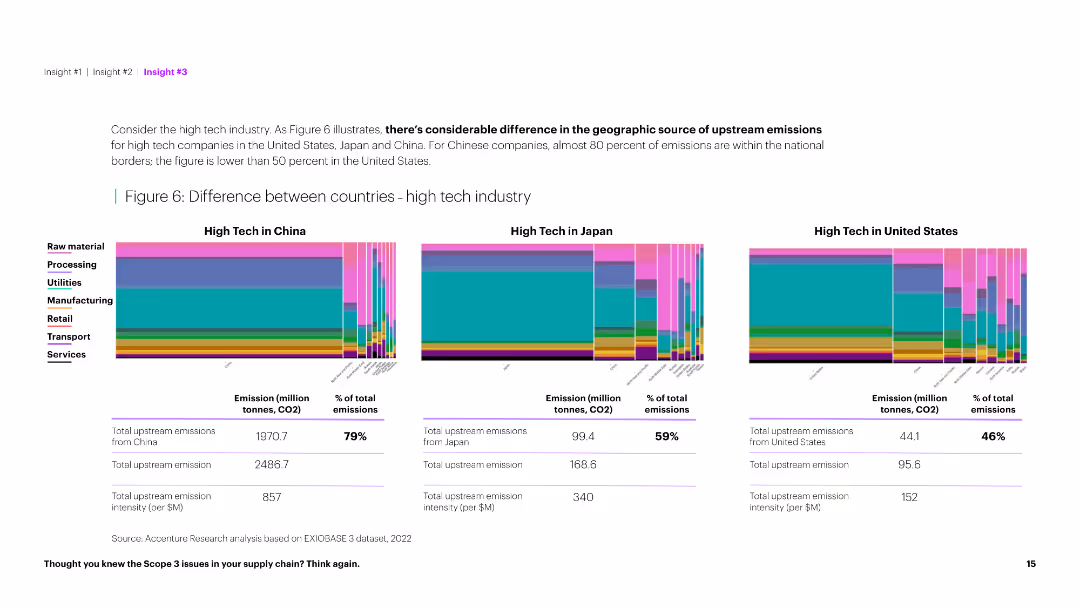
The slide features column charts comparing upstream emissions in the high tech industry across China, Japan, and the US, along with summary tables below.
Market Analysis and Trends
Technology & Software
This slide illustrates the significant differences in upstream emissions in the high tech industry among China, Japan, and the US, providing a comparative analysis.
High tech, emissions, country comparison, China, Japan, US, upstream, industry analysis, environmental impact, data visualization, sustainability
false
Market Analysis and Trends
Technology & Software technology-and-software
Multiple Chart
Accenture
View slide
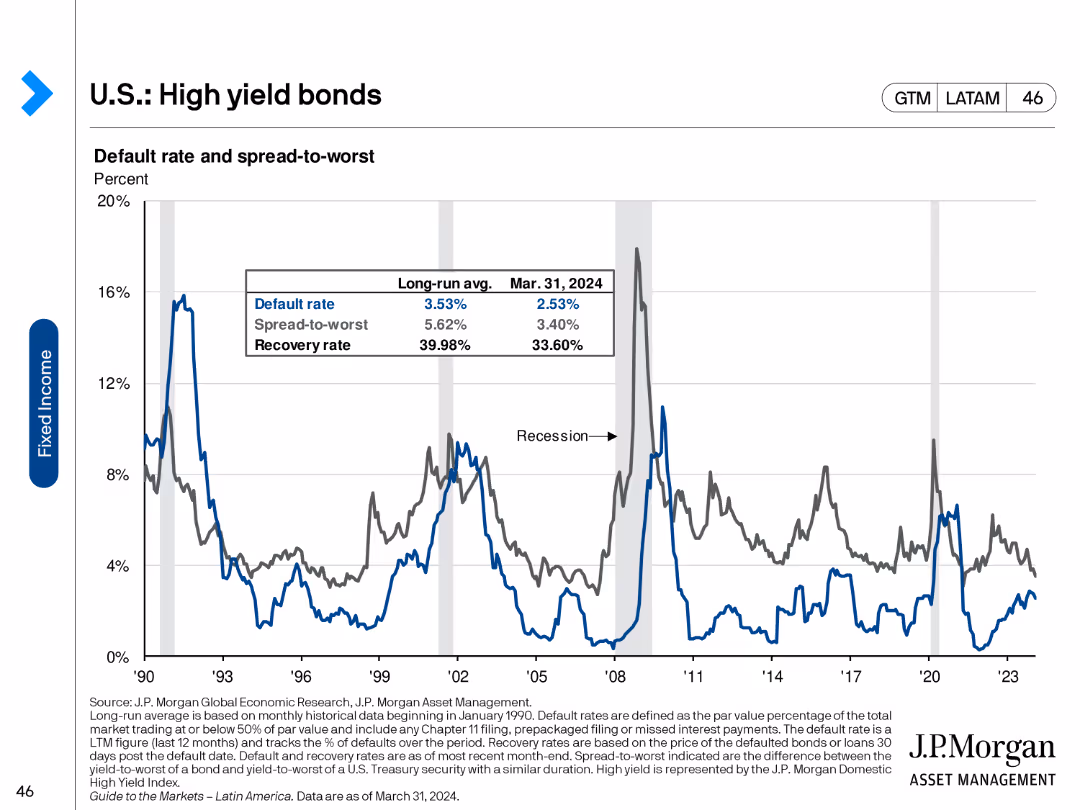
This slide features a line chart showing the default rate, spread-to-worst, and recovery rate for U.S. high yield bonds from 1990 to 2023. The chart uses three lines to represent different metrics, with annotations for key historical events.
Financial Performance
Financial Services
It presents historical data on default rates, spread-to-worst, and recovery rates for high yield bonds, highlighting trends and significant economic events that influenced these metrics.
High yield bonds, default rates, spread-to-worst, recovery rate, historical data
false
Financial Performance
Financial Services financial-services
Single Chart
JP Morgan
View slide
A stacked column chart illustrates the segmentation of the tourism industry in Europe by revenue, highlighting the high-end sector.
Market Analysis and Trends
Hospitality & Tourism
Discusses the market size and economic value of the high-end tourism sector within the broader European tourism industry.
High-end tourism, Market segmentation, Revenue, Europe
false
Market Analysis and Trends
Hospitality & Tourism hospitality-and-tourism
Multiple Chart
Bain
View slide
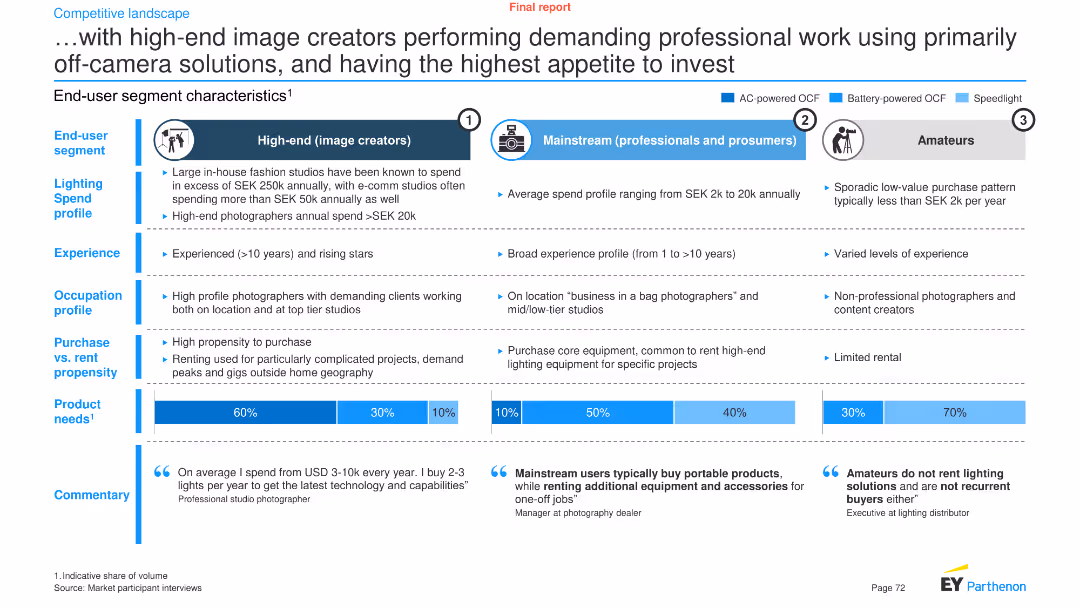
This slide has a comparative layout featuring three vertical sections. Each section describes a different end-user segment with icons, text, and bar graphs.
Market Analysis and Trends
Professional Services
It analyzes the characteristics, spending profiles, and product needs of high-end image creators, mainstream professionals, and amateurs.
High-end, image creators, lighting spend, segments, product needs, investment, professional work, end-user, market analysis, trends
false
Market Analysis and Trends
Professional Services professional-services
Multiple Chart
EY
View slide
The slide includes a column chart comparing vacancy rates and a bar chart showing timely application processing. It has a mix of text and visual data elements, with a clear focus on workforce metrics.
Operational Efficiency
Professional Services
Slide includes bar charts and a text block. Displays vacancy comparisons and application processing timeliness over time.
Highlights workforce capacity issues within DEHS, comparing vacancy rates and analyzing the timeliness of application processing over a specified period.
false
Operational Efficiency
Professional Services professional-services
Multiple Chart
Alvarez & Marsal
View slide
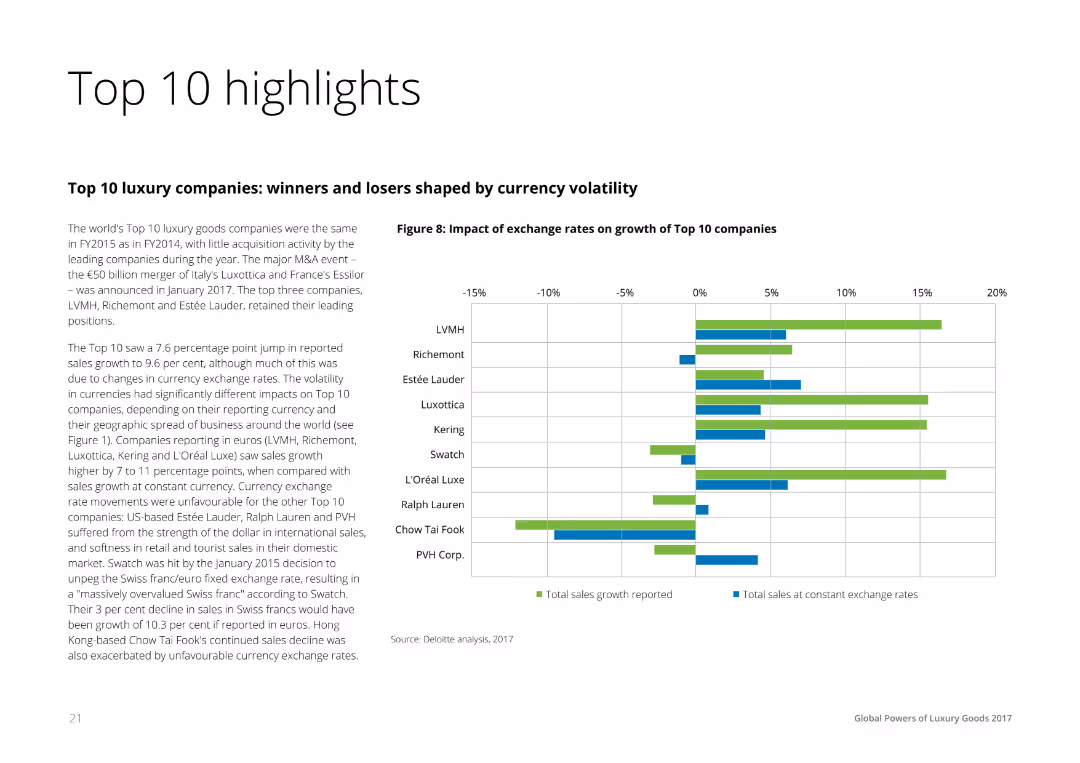
Text on the left summarizing the financial performance of the top 10 luxury companies, accompanied by a horizontal bar chart on the right comparing the impact of exchange rates on sales growth across these companies.
Financial Performance
Consumer Goods
The slide highlights the financial performance and currency exchange impact on the top 10 luxury companies, showing reported sales growth and the effects of exchange rate fluctuations. It is useful for understanding financial dynamics in the luxury sector.
Highlights, Financial, Performance, Luxury, Companies
false
Financial Performance
Consumer Goods consumer-goods
Mixed Chart
Deloitte
View slide
The slide features column charts depicting the gender distribution of Hispanic employees across different professional levels in the venture capital sector. Accompanying textual descriptions provide additional context.
Human Resources and Talent Management
Professional Services
This slide details the gender distribution of Hispanic employees in the venture capital industry, providing comparative data from 2018, 2020, and 2022, and highlighting trends and disparities in representation.
Hispanic employees, Gender diversity, VC industry, Diversity analysis, Professional levels
false
Human Resources and Talent Management
Professional Services professional-services
Multiple Chart
Deloitte
View slide
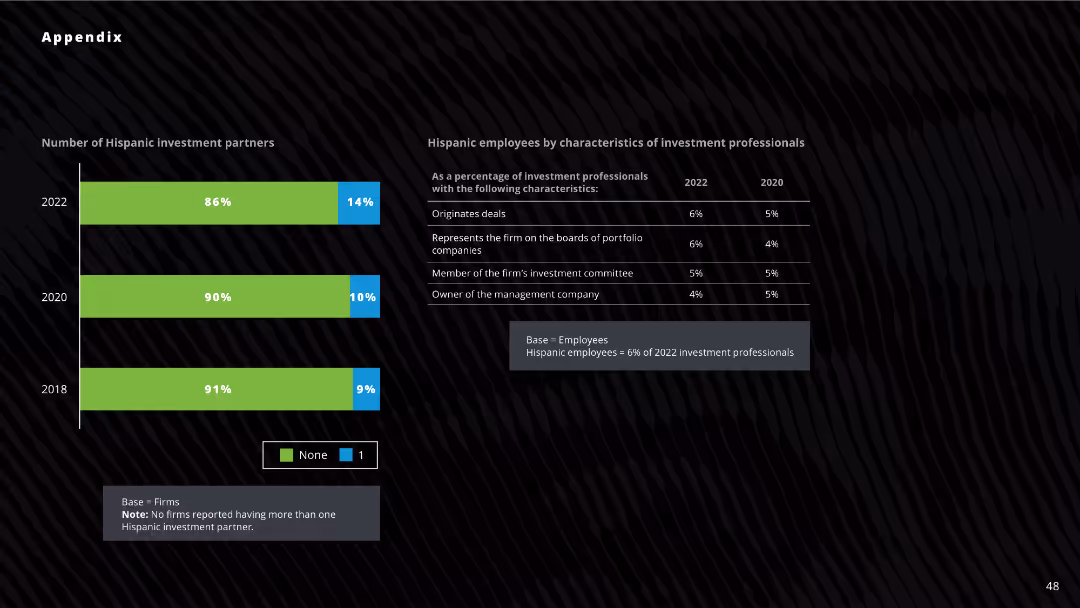
Column chart displaying the number of Hispanic investment partners across three years (2018, 2020, 2022). Data table to the right shows characteristics of Hispanic employees in investment firms.
Investment Analysis
Financial Services
The slide shows the percentage of firms with Hispanic investment partners and the roles of Hispanic employees in investment firms for 2022, 2020, and 2018. Useful for analyzing diversity in investment partnerships and roles.
Hispanic, investment, partners, diversity, analysis
false
Investment Analysis
Financial Services financial-services
Mixed Chart
Deloitte
View slide
This slide includes two line charts comparing the historical levelized cost of energy for unsubsidized wind and solar PV from 2009 to 2023.
Market Analysis and Trends
Energy & Utilities
The slide analyzes historical cost trends for unsubsidized wind and solar PV energy, showing significant cost reductions and potential areas for further improvements and competitiveness.
Historical LCOE, Wind Energy, Solar PV, Cost Trends, Unsubsidized Energy
false
Market Analysis and Trends
Energy & Utilities energy-and-utilities
Multiple Chart
Roland Berger
View slide
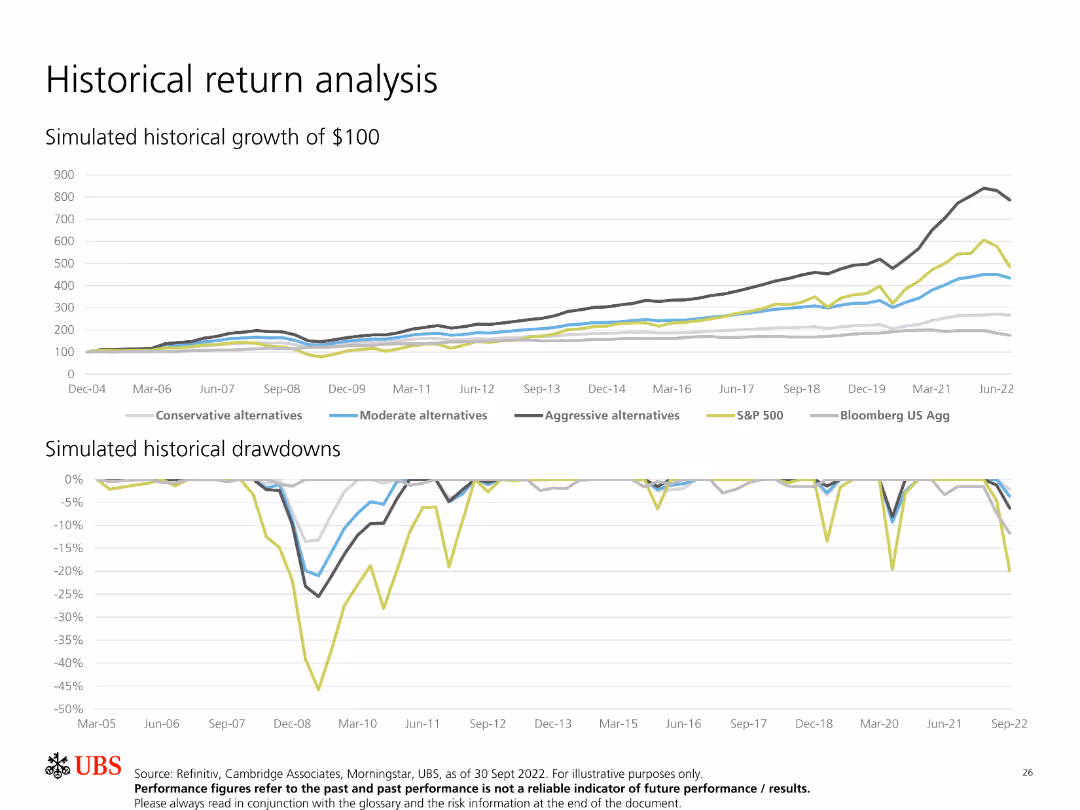
Features two line charts, one showing simulated historical growth of $100 and the other depicting simulated historical drawdowns.
Financial Performance
Financial Services
Analyzes historical returns of different investment strategies, comparing their growth and drawdowns over time to evaluate performance and risk.
Historical Returns, Growth, Drawdowns, Investment, Performance, Simulation, Analysis, Comparison, Strategies
false
Financial Performance
Financial Services financial-services
Multiple Chart
UBS
View slide
This slide presents a line chart showing historical trends in the levelized cost of energy for various utility-scale renewable energy technologies over time.
Market Analysis and Trends
Energy & Utilities
The slide tracks the historical cost declines in utility-scale renewable energy, providing insights into cost trends, technological advancements, and market competitiveness over several years.
Historical Trends, Utility-Scale, LCOE, Renewable Energy, Cost Decline
false
Market Analysis and Trends
Energy & Utilities energy-and-utilities
Single Chart
Roland Berger
View slide
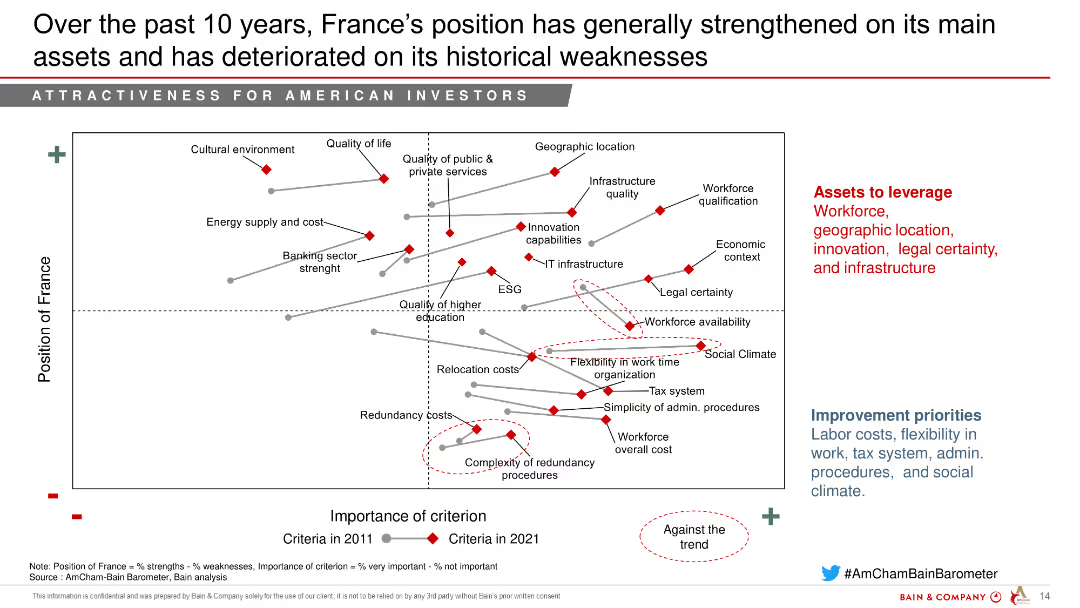
The slide contains a chart comparing France's position in 2011 and 2021 on various criteria, showing improvements and deteriorations over time.
Strategic Planning
Education & Training
This slide highlights the changes in France's strengths and weaknesses over the past decade, with improvements in key assets and ongoing challenges.
Historical comparison, Strengths, Weaknesses, Education, Training
false
Strategic Planning
Education & Training education-and-training
Mixed Chart
Bain
View slide
The slide includes a column chart tracking the historical average deposit growth across various sectors over several years.
Financial Performance
Financial Services
This slide illustrates the historical deposit growth trends, highlighting the compound annual growth rates (CAGR) for total and service deposits.
Historical, Deposit, Growth, Average, CAGR, Sectors, Financial, Trends, Performance, Analysis
false
Financial Performance
Financial Services financial-services
Single Chart
Citigroup
View slide
Slide with four color-coded sections detailing different business aspects affected by holistic cost programs: Growth, Cost, Talent, Liquidity.
Strategic Planning
Professional Services
Highlights the need for holistic approaches in addressing cost problems, illustrating how narrowly focused cost reduction programs can lead to issues arising in other areas of the business. This approach integrates various elements of the business for comprehensive improvement.
Holistic Solutions, Cost Reduction, Business Integration, Comprehensive Approach
false
Strategic Planning
Professional Services professional-services
Table
Deloitte
View slide
The slide includes a comparative bar chart detailing concerns regarding home EV charging across different regions (Global, North America, Europe, Asia-Pacific).
Market Analysis and Trends
Transportation & Logistics
It presents the concerns about energy costs and space availability for home EV charging, with regional differences highlighted.
Home EV charging, energy costs, regional concerns, installation costs, space availability
false
Market Analysis and Trends
Transportation & Logistics transportation-and-logistics
Multiple Chart
EY
View slide
Column charts and key statistics displayed clearly, with additional small bar chart showing the FICO score distribution.
Financial Performance
Financial Services
Analyzes home equity loans and changes over quarters with FICO score distribution, aiding financial institutions in assessing loan performance and customer creditworthiness within the home equity market.
Home Equity, Loans, FICO, Trends, Finance
false
Financial Performance
Financial Services financial-services
Multiple Chart
Morgan Stanley
View slide
Contains column charts on the left comparing government/subprime mix and servicing cost per unit from 2017 to 2021. Center lists metrics, right shows green column charts for Real Estate Portfolio data and a bar chart for net charge-off rate.
Financial Performance
Financial Services
Showcases improved servicing efficiency and optimized balance sheet in home lending, with decreased government/subprime mix, reduced servicing costs, increased loan sales and securitizations, and a lower net charge-off rate.
Home Lending, Efficiency, Portfolio Management, Risk, Asset, Securitization, Charge-Off
false
Financial Performance
Financial Services financial-services
Multiple Chart
JP Morgan
Previous
Loading...
Hold On!
We are searching in our database
If nothing, comes up, please try different filters!
Column Chart
Heatmap
Chevron
Org Chart
Infographic
Callouts
Timeline
List
Graphic
Picture
Process Flow
Diagram
Paragraph
Map
Table
Framework
Subtitle
Takeaway Box
Icon
Other Chart
Radar Chart
Waterfall Chart
Mekko Chart
Pie Chart
Scatter Plot
Line Chart
Bar chart
Bullet points
Create a FREE account to continue browsing
Receive Instant Access to 1,000+ slides from companies like McKinsey, Google, and Goldman Sachs
First Name
Last Name
Email
Password
I agree to all
Terms & Privacy Policy
Thank you! Your submission has been received!
Oops! Something went wrong while submitting the form.
Have an account?
Sign in
Upgrade to PRO to Save slides
Advanced Search and Filters
Access to 15,000+ slides
Access to Category Pages
Save/Bookmark Slides
PowerPoint Template Library
Pick a Plan
MONTHLY
$12/month
Billed every month, Cancel anytime.
YEARLY
$9/year
Billed $108 annually, Cancel anytime.
Checkout for $12/month
Checkout for $108/yr
Secured by Stripe | AES-256 bit encryption