My Account
My Slides
Search by Category
Templates
Leave Feedback
Login
Logout
Get Started
Browse all Slides
Browse all Slides
Create a FREE Account
Instant access to 1,000+ real slides from top companies like McKinsey, BCG, Goldman Sachs, Google and many more!
First Name
Last Name
Email
Password
I agree to all
Terms & Privacy Policy
Thank you! Your submission has been received!
Oops! Something went wrong while submitting the form.
Have an account?
Sign in
📢 Ready to start building slides? Check out our new template library
VIEW TEMPLATES
Welcome,
Welcome
PRO
Show Featured Only
Checkbox 8
Companies
Mckinsey
Bain
BCG
EY
Deloitte
Accenture
PwC/Strategy&
JP Morgan
Goldman Sachs
Morgan Stanley
Citigroup
Deutsche Bank
Barclays
LEK
KPMG
Kearney
Oliver Wyman
Booz Allen Hamilton
Gartner
IPSOS
Nielsen
Slide type
Text Only
Linear Flow
Vertical Flow
Single Chart
Header Horizontal
Mixed Chart
Header Vertical
Pillar
Multiple Chart
Graphic
Agenda
Title
Table
Framework
Industry
Technology & Software
Artificial Intelligence
Financial Services
Retail & E-commerce
Consumer Goods
Industrial & Manufacturing
Transportation & Logistics
Telecommunications
Real Estate & Construction
Hospitality & Tourism
Professional Services
Education & Training
Media & Entertainment
Agriculture & Food Production
Healthcare & Pharmaceuticals
Environmental Services & Sustainability
Government & Public Sector
Use Case
Mergers and Acquisitions
Performance Metrics and KPIs
Client Case Studies
Competitive Landscape
Corporate Finance and Valuation
Product and Service Analysis
Customer and Market Segmentation
Organizational Structure and Change
Industry Overview
Regulatory and Compliance
Risk Assessment and Management
Investment Analysis
Organizational Structure and Change
Human Resources and Talent Management
Financial Performance
Market Analysis and Trends
Sales and Business Development
Human Resources and Talent Management
Clear all
Thank you! Your submission has been received!
Oops! Something went wrong while submitting the form.
Tag
View slide
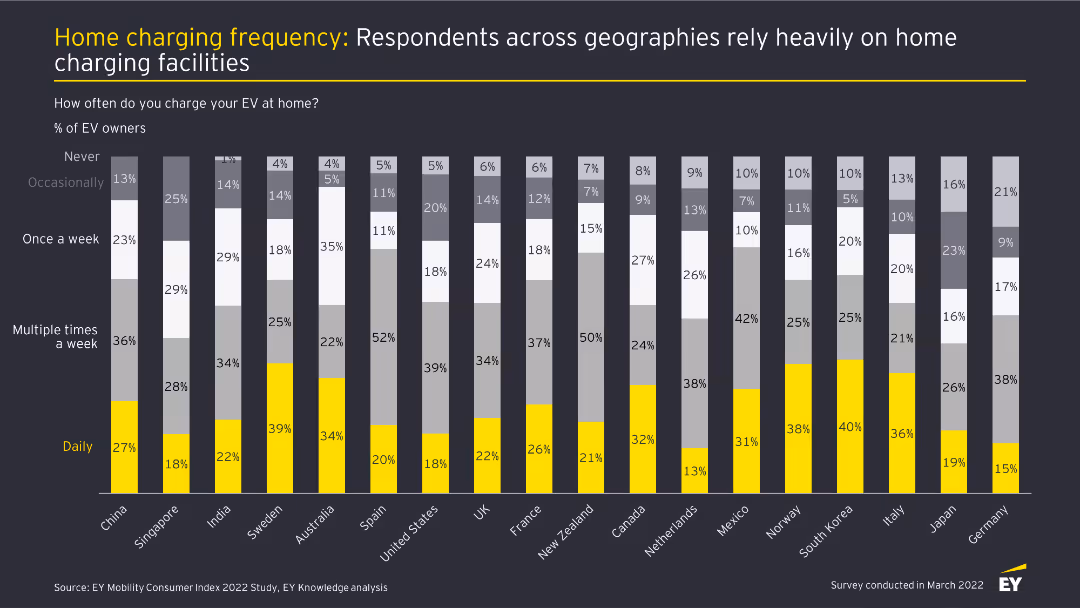
This slide presents a stacked bar chart showing the frequency of home charging among EV owners in different countries. Bars are divided into segments for daily, multiple times a week, once a week, occasionally, and never.
Market Analysis and Trends
Transportation & Logistics
The slide details how often EV owners charge their vehicles at home across various countries, with a significant portion charging daily or multiple times a week, indicating heavy reliance on home charging facilities.
Home charging, EV owners, charging frequency, market analysis, automotive industry
false
Market Analysis and Trends
Transportation & Logistics transportation-and-logistics
Single Chart
EY
View slide
Presents a line graph tracking the increase in social media hashtags for home hobbies, supported by a prominent quote.
Market Analysis and Trends
Retail & E-commerce
Analyzes the stabilization of market interests in home-based hobbies, indicating a sustained engagement in these activities beyond the immediate reaction to global events.
Home hobbies, Market stabilization, Social media trends, Hashtags increase, Engagement continuity, Line graph, Market interests
false
Market Analysis and Trends
Retail & E-commerce retail-and-e-commerce
Multiple Chart
Accenture
View slide
This slide features a pie chart on the left illustrating home lending portfolio by CLTV, a list in the center detailing major markets with forecasted declines, and bar graphs on the right showing NCO estimates for 2024-2025. The design is simple with color coding for easy interpretation.
Risk Assessment and Management
Financial Services
Showcasing the robustness of the Home Lending portfolio, this slide compares current equity and quality levels with anticipated market trends and stress scenarios. It's aimed at providing stakeholders with confidence in the stability and foresight of the company's lending strategies.
Home lending, Portfolio strength, Market trends, Stress scenarios, CLTV, NCO estimates, Equity
false
Risk Assessment and Management
Financial Services financial-services
Multiple Chart
JP Morgan
View slide
The slide has a balanced comparative layout with a mix of column charts and text explanations, contrasting past and current performance metrics for home lending.
Performance Metrics and KPIs
Financial Services
Highlights the high-quality customer focus of JPMorgan Chase's Home Lending business, detailing improvements in experience, productivity, and financial health.
Home lending, customer experience, productivity, financial health, JPMorgan Chase
false
Performance Metrics and KPIs
Financial Services financial-services
Multiple Chart
JP Morgan
View slide
The slide is split horizontally with two columns and features a sectioned layout. There are titles, subheadings, and bulleted lists, with no graphs or charts.
Industry Overview
Financial Services
This slide presents a summary of key initiatives and their progress related to home ownership, rental housing, and financial institution investment.
Homeownership, Rental Housing, Financial Institutions, Progress, Commitment
false
Industry Overview
Financial Services financial-services
Table
JP Morgan
View slide
Slide includes a column chart with year-on-year revenue data and growth projections for Hong Kong.
Market Analysis and Trends
Media & Entertainment
Analyzes the projected overall growth in Hong Kong's entertainment and media sector from 2016 to 2025, detailing the recovery from the pandemic.
Hong Kong, E&M, growth, forecast, pandemic
false
Market Analysis and Trends
Media & Entertainment media-and-entertainment
Single Chart
PwC/Strategy&
View slide
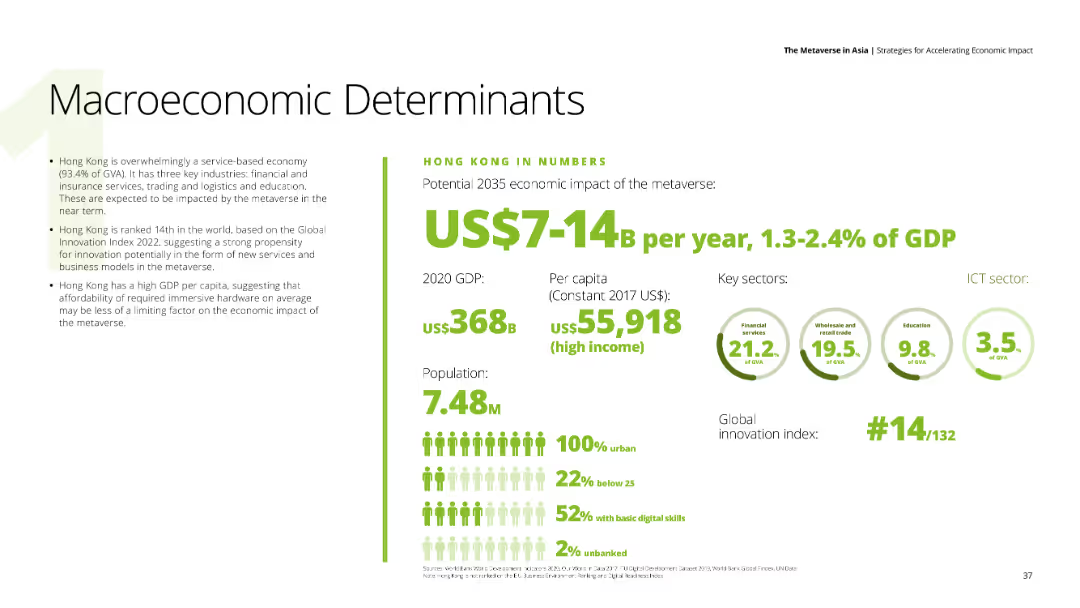
A data-driven slide with key economic indicators for Hong Kong, including GDP, population, and sector contributions.
Financial Performance
Financial Services
The slide presents Hong Kong’s macroeconomic determinants, highlighting the potential economic impact of the metaverse by 2035.
Hong Kong, GDP, economic impact, metaverse, financial indicators
false
Financial Performance
Financial Services financial-services
Mixed Chart
Deloitte
View slide
This slide includes vertical column charts and a photographic background, depicting the market size from 2007 to 2019 with a focus on Hong Kong.
Market Analysis and Trends
Consumer Goods
Evaluates the socio-political effects on Hong Kong's luxury goods market, suggesting shifts in consumer and tourist dynamics towards other Asian markets.
Hong Kong, Market analysis, Socio-political
false
Market Analysis and Trends
Consumer Goods consumer-goods
Mixed Chart
Bain
View slide
Displays a pie chart comparison of Hong Kong advertising revenue by segments for 2022 and 2027. The charts show a significant shift towards digital advertising over traditional formats like TV and newspaper. The design is straightforward with a clear visual representation of data changes over time, accompanied by concise text explanations.
Market Analysis and Trends
Media & Entertainment
Analyzes shifts in advertising revenue sources in Hong Kong, emphasizing the decline of traditional media and the rise of digital platforms. Useful for understanding market transitions and planning digital marketing strategies.
Hong Kong, advertising revenue, digital dominance, traditional media decline, market analysis
false
Market Analysis and Trends
Media & Entertainment media-and-entertainment
Multiple Chart
PwC/Strategy&
View slide
Displays a line graph charting cinema revenue in Hong Kong from 2018 to 2027, with annotations highlighting specific trends and yearly changes.
Market Analysis and Trends
Media & Entertainment
Focuses on the expected rebound of box office revenue in Hong Kong, detailing the impact of COVID-19 and the success of specific films in driving revenue.
Hong Kong, box office, cinema, COVID-19, revenue rebound, films
false
Market Analysis and Trends
Media & Entertainment media-and-entertainment
Mixed Chart
PwC/Strategy&
View slide
Slide contains a column chart detailing year-on-year cinema revenue in Hong Kong from 2019 to 2025.
Market Analysis and Trends
Media & Entertainment
Focuses on the recovery and forecast of Hong Kong's cinema industry, noting the impact of capacity limitations and film supply shortages.
Hong Kong, cinema, revenue, forecast, COVID-19
false
Market Analysis and Trends
Media & Entertainment media-and-entertainment
Mixed Chart
PwC/Strategy&
View slide
Features a column chart showing year-on-year growth of the entertainment and media sector in Hong Kong, emphasizing future revenue projections.
Financial Performance
Media & Entertainment
Projects future growth of the entertainment and media market in Hong Kong, emphasizing the impact of business-to-business segments and cinema.
Hong Kong, entertainment, media, growth projection, cinema, business-to-business
false
Financial Performance
Media & Entertainment media-and-entertainment
Mixed Chart
PwC/Strategy&
View slide
This slide features multiple column charts comparing global and Hong Kong trade show revenues from 2022 to 2027. It includes detailed annotations and percentage figures for annual growth and CAGR. The slide is designed with a clear separation between the charts and descriptive texts, which provide additional context on market trends and the impact of lifted quarantine measures.
Market Analysis and Trends
Media & Entertainment
Analyzes the growth of trade show revenues in Hong Kong, comparing it to global rates and detailing the factors influencing these trends, such as COVID-19 impacts and policy changes. This is particularly useful for understanding regional market dynamics within the global context.
Hong Kong, global comparison, trade shows, revenue growth, CAGR, market trends, COVID-19
false
Market Analysis and Trends
Media & Entertainment media-and-entertainment
Multiple Chart
PwC/Strategy&
View slide
Features a column chart showing the annual revenue figures for live music in Hong Kong from 2019 to 2025.
Market Analysis and Trends
Media & Entertainment
Discusses the trends and recovery in the live music segment in Hong Kong, highlighting the effects of COVID-19 on foreign artist visits.
Hong Kong, live music, revenue, CAGR, COVID-19
false
Market Analysis and Trends
Media & Entertainment media-and-entertainment
Mixed Chart
PwC/Strategy&
View slide
Features a bar chart comparing the CAGR of different media segments between Hong Kong and globally, using contrasting red and gray bars.
Market Analysis and Trends
Media & Entertainment
Analyzes the growth rates of various entertainment and media segments in Hong Kong from 2022 to 2027, highlighting areas like cinema and OTT video.
Hong Kong, media, entertainment, CAGR, growth rates, cinema, OTT
false
Market Analysis and Trends
Media & Entertainment media-and-entertainment
Mixed Chart
PwC/Strategy&
View slide
The slide features multiple pie charts comparing the composition of internet advertising revenue between Mainland China and Hong Kong for the years 2016 and 2025. Each chart is colored distinctly to differentiate the categories like paid search, mobile display, etc. The layout is straightforward with each pie chart accompanied by a legend and annotations highlighting specific data points.
Market Analysis and Trends
Media & Entertainment
This slide shows the projected growth of mobile display advertising in Hong Kong, predicting a significant increase by 2025. It compares this trend with Mainland China's internet advertising revenue, highlighting the differences in growth within the regions. The slide aims to analyze market shifts and future potentials in the digital advertising space, especially mobile display, which is forecasted to grow at a compound annual growth rate (CAGR).
Hong Kong, mobile advertising, internet, 2025, CAGR, growth, pie chart, revenue
false
Market Analysis and Trends
Media & Entertainment media-and-entertainment
Multiple Chart
PwC/Strategy&
View slide
Slide shows line graphs tracking the revenue trends and year-on-year growth for different regions.
Market Analysis and Trends
Media & Entertainment
Compares the economic impact on Hong Kong's entertainment and media revenue with global and regional trends.
Hong Kong, revenue, entertainment, media, growth
false
Market Analysis and Trends
Media & Entertainment media-and-entertainment
Multiple Chart
PwC/Strategy&
View slide
Features pie charts comparing revenue segments from 2018, 2022, and 2027, alongside a column for contextual data. The pie charts display proportions in distinct colors for different segments, and the slide is text-heavy, providing detailed contextual information about the impact of the COVID-19 pandemic and recovery predictions.
Market Analysis and Trends
Media & Entertainment
Discusses the segment distribution of the business-to-business market in Hong Kong, focusing on the major hit from COVID-19 and recovery projections. Useful for business planning and analysis in post-pandemic market scenarios.
Hong Kong, trade shows, business-to-business, market distribution, COVID-19 impact, recovery prediction
false
Market Analysis and Trends
Media & Entertainment media-and-entertainment
Multiple Chart
PwC/Strategy&
View slide
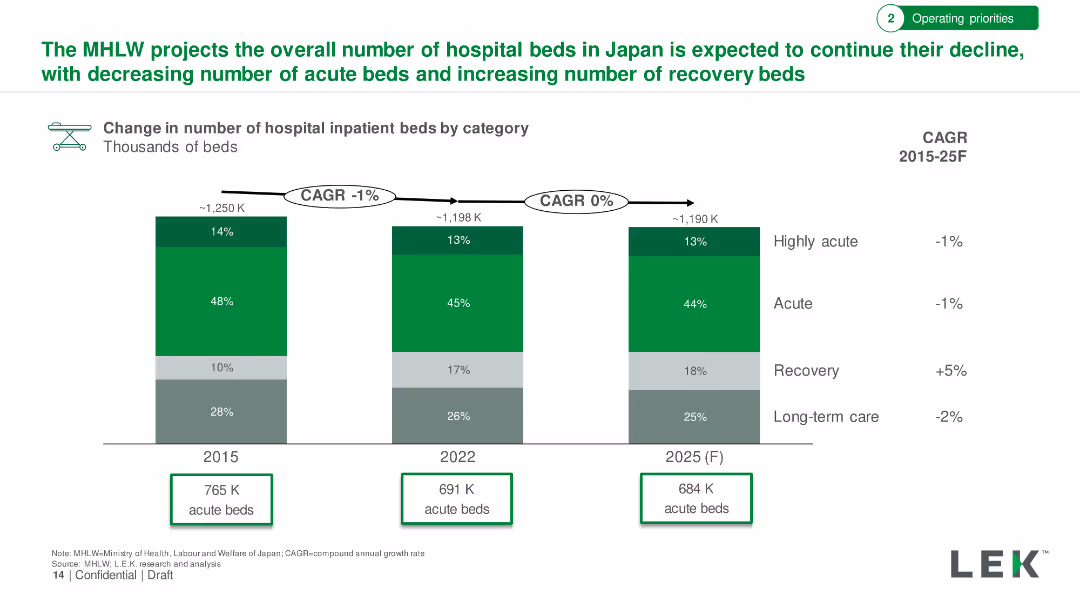
Bar chart showing change in the number of hospital inpatient beds by category from 2015 to 2025. Detailed with bed type categories and CAGR.
Market Analysis and Trends
Healthcare & Pharmaceuticals
Projection of hospital bed trends in Japan, showing a decline in acute beds and an increase in recovery beds through 2025.
Hospital Beds, Japan, Acute Beds, Recovery Beds, Projection
false
Market Analysis and Trends
Healthcare & Pharmaceuticals healthcare-and-pharmaceuticals
Single Chart
LEK
View slide
The slide contains a column chart depicting spending priorities over the next 3 years across three categories: Physical and digital infrastructure, Medical supplies and devices, and Staff.
Strategic Planning
Healthcare & Pharmaceuticals
The slide shows the expected increase in spending by hospitals in three main areas over the next three years, with a focus on innovative drugs/therapy, physician support systems, and patient-facing digital solutions.
Hospitals, spending, infrastructure, medical supplies, staff
false
Strategic Planning
Healthcare & Pharmaceuticals healthcare-and-pharmaceuticals
Multiple Chart
LEK
View slide
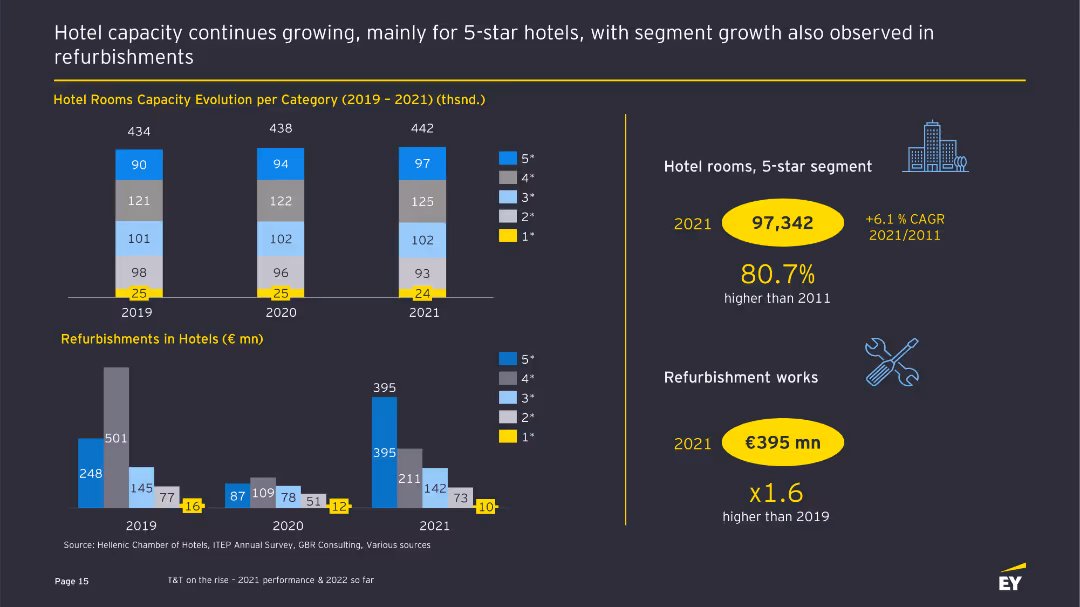
The slide features bar charts showing the evolution of hotel room capacities and refurbishments from 2019 to 2021, with text providing additional context.
Operational Efficiency
Hospitality & Tourism
This slide presents data on hotel room capacity evolution and refurbishment activities, highlighting growth in the 5-star segment and significant investments in refurbishments.
Hotel capacity, refurbishments, operational efficiency, tourism sector, bar charts
false
Operational Efficiency
Hospitality & Tourism hospitality-and-tourism
Multiple Chart
EY
View slide
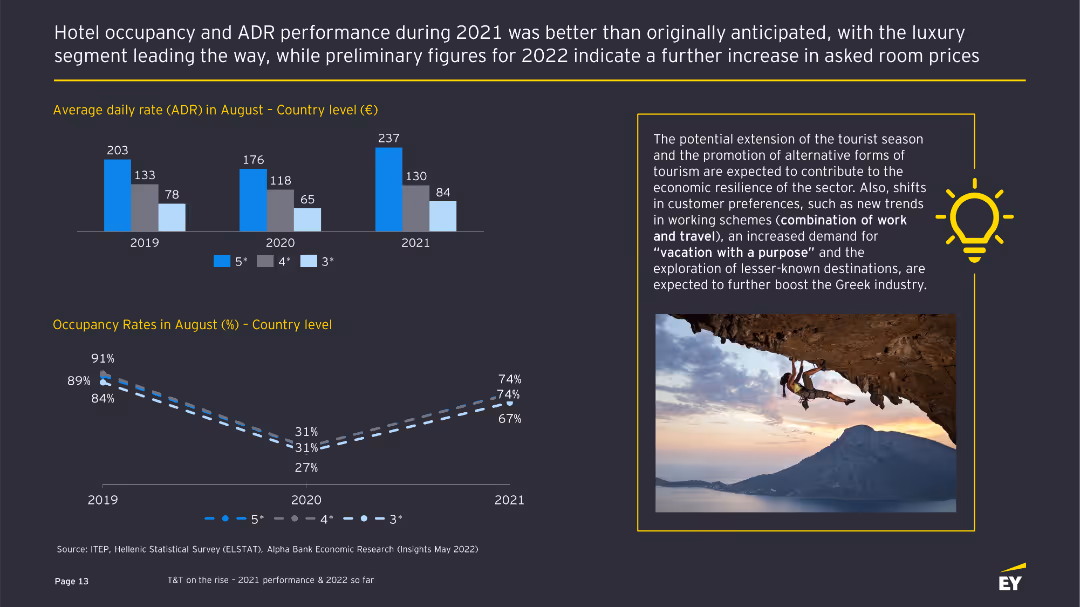
The slide includes bar charts comparing average daily rates (ADR) and occupancy rates in August across different years and hotel categories, with text summarizing insights.
Performance Metrics and KPIs
Hospitality & Tourism
This slide analyzes hotel occupancy and ADR performance, highlighting improvements and shifts in customer preferences, and the potential for alternative tourism.
Hotel occupancy, ADR, performance analysis, tourism insights, bar charts
false
Performance Metrics and KPIs
Hospitality & Tourism hospitality-and-tourism
Multiple Chart
EY
View slide
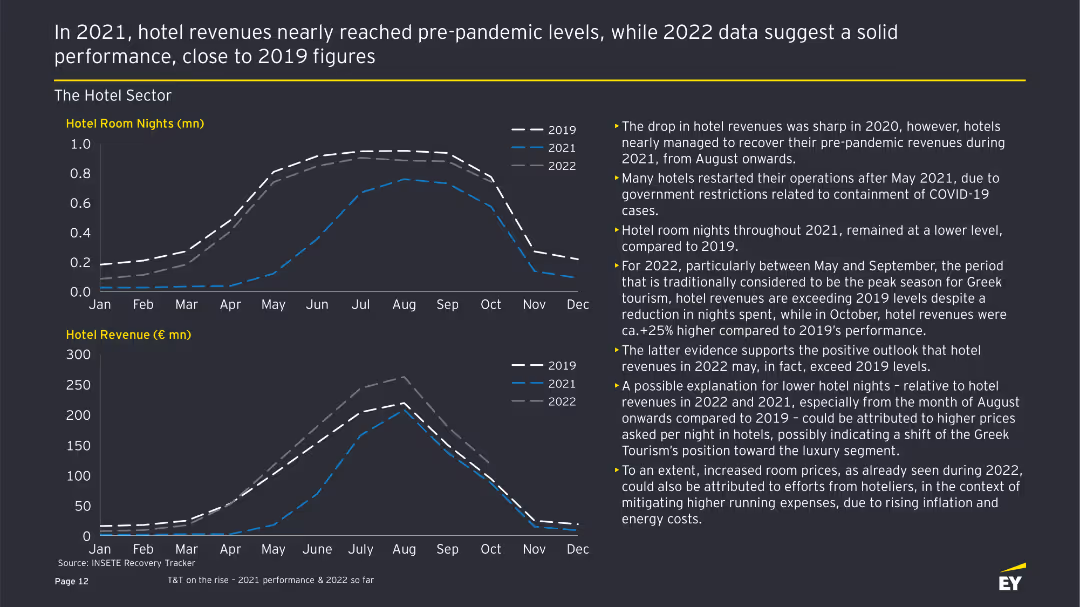
The slide features two line charts showing hotel room nights and revenue from 2019 to 2022, with accompanying text highlighting trends and performance.
Financial Performance
Hospitality & Tourism
This slide provides an analysis of the Greek hotel sector's performance, comparing room nights and revenue across different years, emphasizing recovery and growth trends.
Hotel performance, room nights, revenue analysis, financial performance, tourism trends
false
Financial Performance
Hospitality & Tourism hospitality-and-tourism
Multiple Chart
EY
View slide
Pie chart representing percentage of internet-using buyers, with side bar graphs detailing the triggers for offline and online buyers.
Market Analysis and Trends
Hospitality & Tourism
Comparison between offline and online buyers for hotels, emphasizing trust and payment reasons for offline purchases and multiple options online.
Hotels, Trust, Payment, Offline Buying, Online Options, Market Trends
false
Market Analysis and Trends
Hospitality & Tourism hospitality-and-tourism
Mixed Chart
BCG
View slide
The slide includes two line charts, one showing nominal house prices indexed to 2015 for various countries and another showing household debt as a percentage of GDP.
Market Analysis and Trends
Financial Services
This slide presents data on house price trends and household debt levels, providing insights into consumer balance sheets and potential economic vulnerabilities.
House prices, household debt, consumer balance sheets, economic trends, GDP
false
Market Analysis and Trends
Financial Services financial-services
Multiple Chart
JP Morgan
View slide
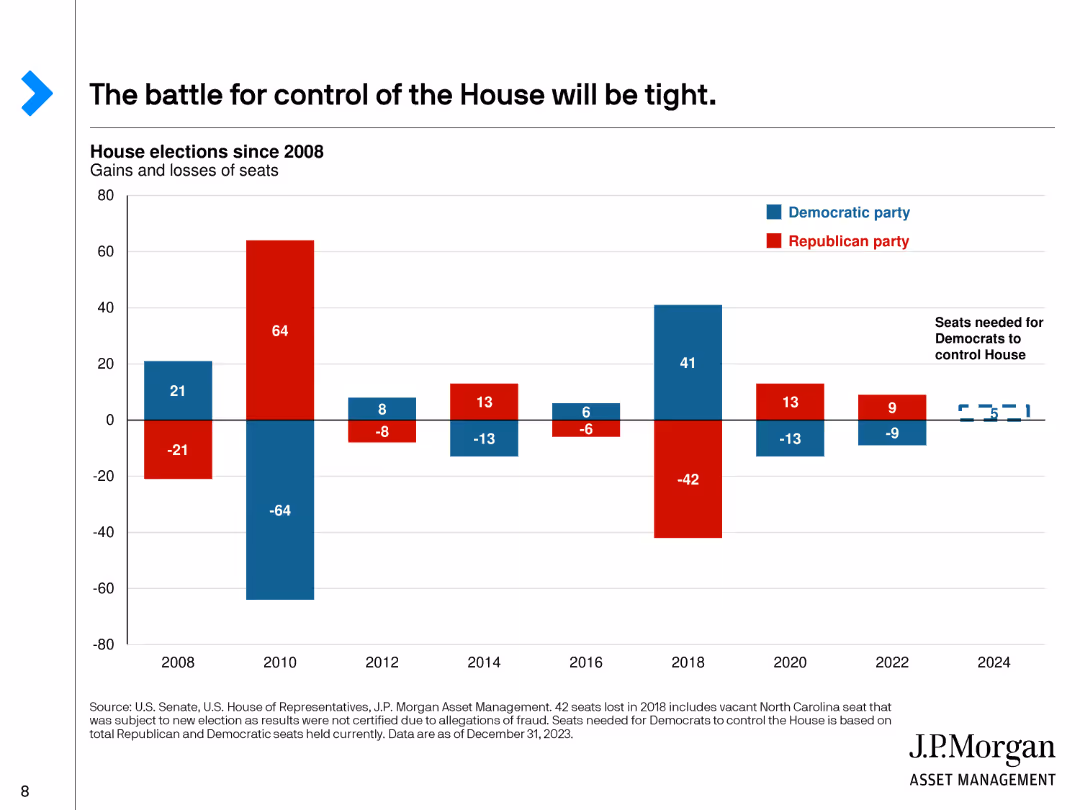
This slide features a bar chart showing the gains and losses of seats in the House of Representatives by party since 2008, with red for Republicans and blue for Democrats.
Market Analysis and Trends
Government & Public Sector
Discusses the competitive nature of the House of Representatives elections, showing historical gains and losses for each party and the current balance of power.
House, Representatives, Elections, Gains, Losses
false
Market Analysis and Trends
Government & Public Sector government-and-public-sector
Single Chart
JP Morgan
View slide
A column chart illustrates the value of household investments in various ranges, comparing data from 2022 and 2023.
Market Analysis and Trends
Financial Services
It shows the distribution of household investment values among Canadians, comparing figures from 2022 and 2023.
Household, Investments, Value, Canadians, 2023, 2022, Column Chart, Financial, Trends
false
Market Analysis and Trends
Financial Services financial-services
Single Chart
IPSOS
View slide
The slide shows a series of vertical stack coin icons representing the value distribution of household investments.
Financial Performance
Financial Services
The slide illustrates the distribution of household investment values, ranging from under $50K to over $1M.
Household, Investments, Value, Distribution, Wealth
false
Financial Performance
Financial Services financial-services
Single Chart
IPSOS
View slide
The slide presents two contrasting graphs: a line chart showing household net worth to income ratio and an area chart depicting savings buffer over time. The juxtaposition highlights shifts in economic stability.
Investment Analysis
Financial Services
This slide gives an overview of the household sector's financial health, crucial for understanding consumer behavior and potential investment risks. The net worth and savings data are pivotal for financial planning and advising within the financial services industry.
Household, Net Worth, Savings, Finance
false
Investment Analysis
Financial Services financial-services
Multiple Chart
Morgan Stanley
View slide
The slide includes three line charts showing the 'National Percentage of Units Offering Concessions by Class'. It has a clear legend and timeframe, depicting data trends across the classes with precision and clear labeling.
Market Analysis and Trends
Real Estate & Construction
It focuses on the availability of concessions in multifamily housing, implying changes in the market's competitiveness. The insight is useful for potential investors or managers in strategy planning.
Housing Concessions, Market Analysis, Class A B C, Real Estate, Investment Strategy, Competitive Analysis, Market Competitiveness, Data Trends
false
Market Analysis and Trends
Real Estate & Construction real-estate-and-construction
Single Chart
Citigroup
Previous
Loading...
Hold On!
We are searching in our database
If nothing, comes up, please try different filters!
Column Chart
Heatmap
Chevron
Org Chart
Infographic
Callouts
Timeline
List
Graphic
Picture
Process Flow
Diagram
Paragraph
Map
Table
Framework
Subtitle
Takeaway Box
Icon
Other Chart
Radar Chart
Waterfall Chart
Mekko Chart
Pie Chart
Scatter Plot
Line Chart
Bar chart
Bullet points
Create a FREE account to continue browsing
Receive Instant Access to 1,000+ slides from companies like McKinsey, Google, and Goldman Sachs
First Name
Last Name
Email
Password
I agree to all
Terms & Privacy Policy
Thank you! Your submission has been received!
Oops! Something went wrong while submitting the form.
Have an account?
Sign in
Upgrade to PRO to Save slides
Advanced Search and Filters
Access to 15,000+ slides
Access to Category Pages
Save/Bookmark Slides
PowerPoint Template Library
Pick a Plan
MONTHLY
$12/month
Billed every month, Cancel anytime.
YEARLY
$9/year
Billed $108 annually, Cancel anytime.
Checkout for $12/month
Checkout for $108/yr
Secured by Stripe | AES-256 bit encryption