My Account
My Slides
Search by Category
Templates
Leave Feedback
Login
Logout
Get Started
Browse all Slides
Browse all Slides
Create a FREE Account
Instant access to 1,000+ real slides from top companies like McKinsey, BCG, Goldman Sachs, Google and many more!
First Name
Last Name
Email
Password
I agree to all
Terms & Privacy Policy
Thank you! Your submission has been received!
Oops! Something went wrong while submitting the form.
Have an account?
Sign in
📢 Ready to start building slides? Check out our new template library
VIEW TEMPLATES
Welcome,
Welcome
PRO
Show Featured Only
Checkbox 8
Companies
Mckinsey
Bain
BCG
EY
Deloitte
Accenture
PwC/Strategy&
JP Morgan
Goldman Sachs
Morgan Stanley
Citigroup
Deutsche Bank
Barclays
LEK
KPMG
Kearney
Oliver Wyman
Booz Allen Hamilton
Gartner
IPSOS
Nielsen
Slide type
Text Only
Linear Flow
Vertical Flow
Single Chart
Header Horizontal
Mixed Chart
Header Vertical
Pillar
Multiple Chart
Graphic
Agenda
Title
Table
Framework
Industry
Technology & Software
Artificial Intelligence
Financial Services
Retail & E-commerce
Consumer Goods
Industrial & Manufacturing
Transportation & Logistics
Telecommunications
Real Estate & Construction
Hospitality & Tourism
Professional Services
Education & Training
Media & Entertainment
Agriculture & Food Production
Healthcare & Pharmaceuticals
Environmental Services & Sustainability
Government & Public Sector
Use Case
Mergers and Acquisitions
Performance Metrics and KPIs
Client Case Studies
Competitive Landscape
Corporate Finance and Valuation
Product and Service Analysis
Customer and Market Segmentation
Organizational Structure and Change
Industry Overview
Regulatory and Compliance
Risk Assessment and Management
Investment Analysis
Organizational Structure and Change
Human Resources and Talent Management
Financial Performance
Market Analysis and Trends
Sales and Business Development
Human Resources and Talent Management
Clear all
Thank you! Your submission has been received!
Oops! Something went wrong while submitting the form.
Tag
View slide
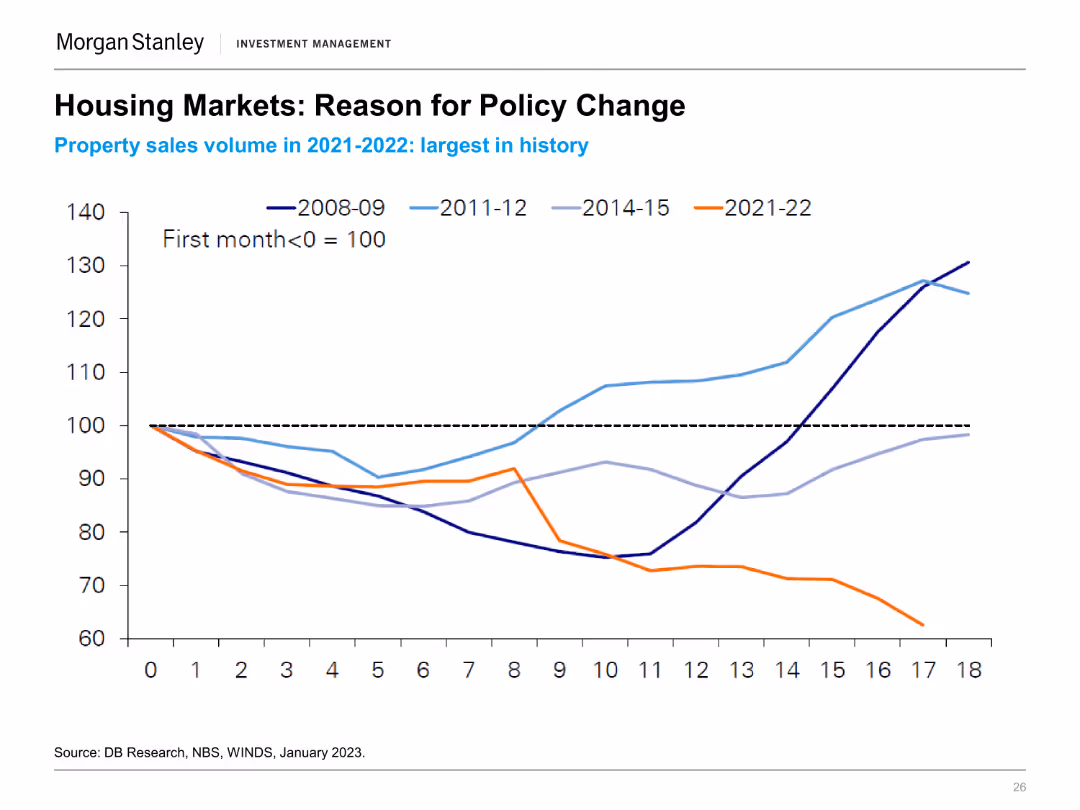
A line chart showing property sales volume (first month = 100) from 2008-09, 2011-12, 2014-15, and 2021-22, indicating historical comparisons and trends.
Regulatory and Compliance
Real Estate & Construction
The slide provides insights into China's housing market policy changes driven by the largest property sales volumes in recent history, comparing past cycles.
Housing Market, Policy Change, Property Sales, China, Historical Trends
false
Regulatory and Compliance
Real Estate & Construction real-estate-and-construction
Single Chart
Morgan Stanley
View slide
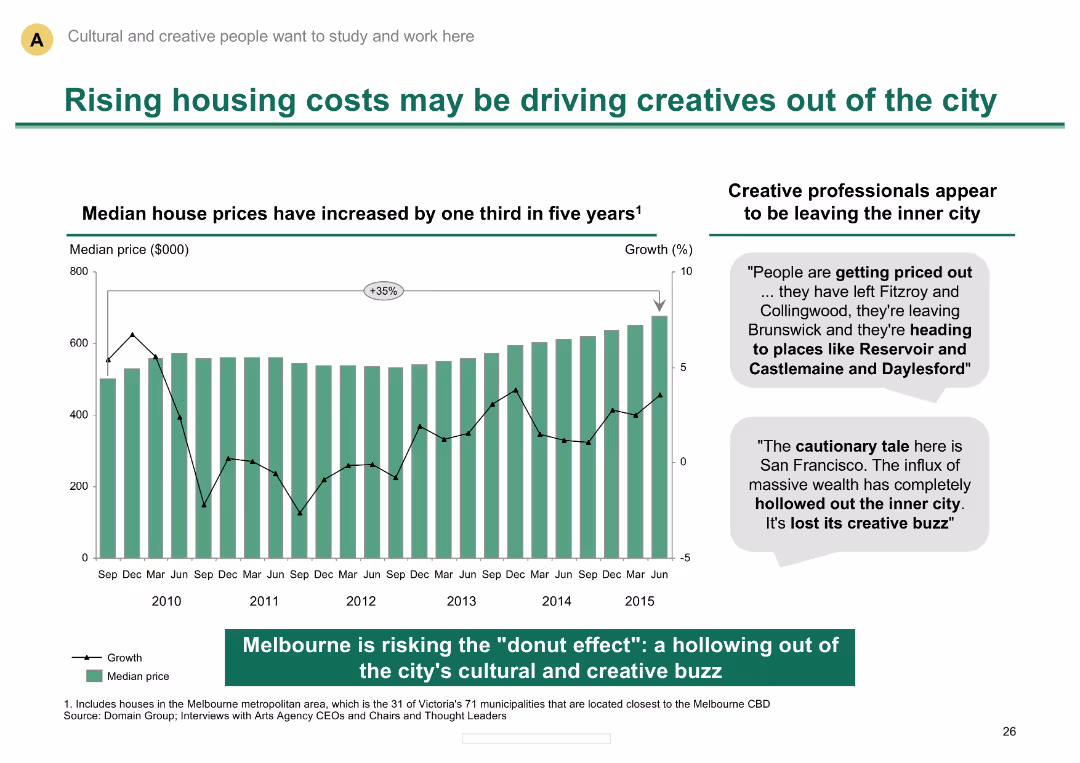
Column chart showing rise in median house prices; text describing impact on creative professionals
Market Analysis and Trends
Real Estate & Construction
Discusses the impact of rising housing costs on creative professionals in Melbourne, highlighting migration trends
Housing costs, creative professionals, real estate trends, Melbourne, urban migration, median house prices
false
Market Analysis and Trends
Real Estate & Construction real-estate-and-construction
Mixed Chart
BCG
View slide
The slide shows a line graph of TRREB sales and new listings, indicating market recovery trends.
Market Analysis and Trends
Real Estate & Construction
It analyzes the recovery of the housing market, comparing sales and new listings data post-pandemic.
Housing market, recovery, TRREB, sales, new listings, post-pandemic, data, analysis, trends, line graph
false
Market Analysis and Trends
Real Estate & Construction real-estate-and-construction
Single Chart
IPSOS
View slide
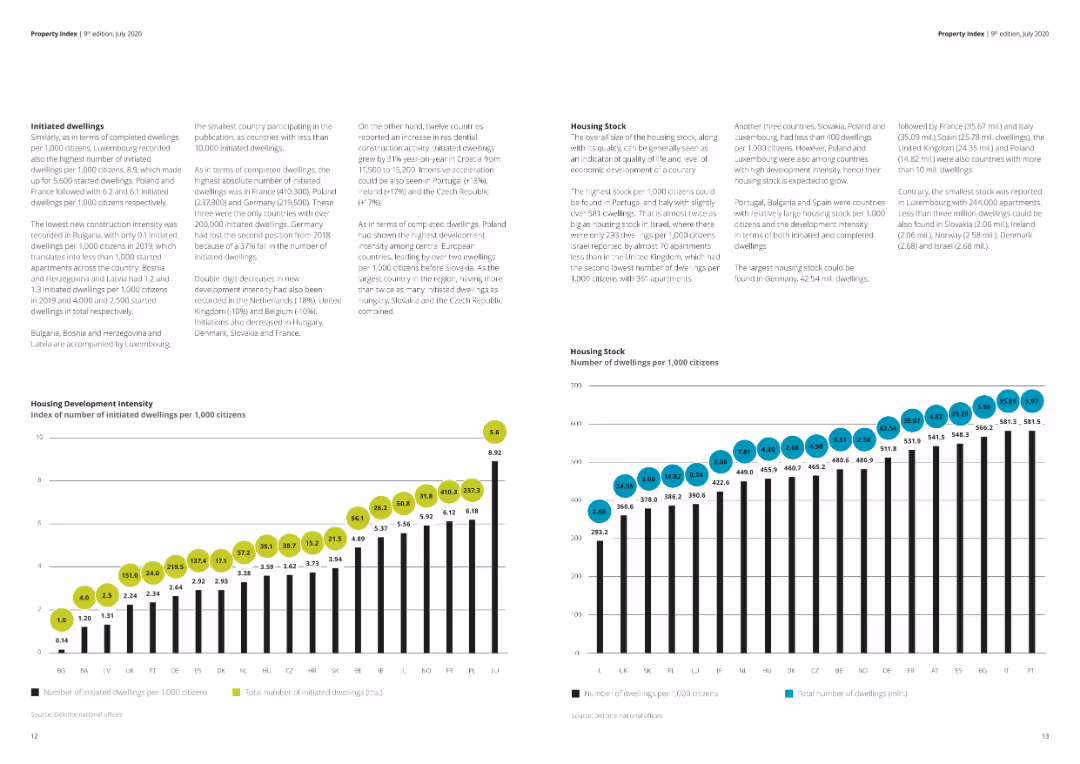
The slide contains two column charts showing the number of initiated and completed dwellings per 1,000 citizens across various European countries. Visual elements are detailed and data-dense, suitable for specific audience groups. Complexity is advanced.
Market Analysis and Trends
Real Estate & Construction
Provides detailed insights into housing development trends in Europe, highlighting the number of initiated and completed dwellings. This slide is valuable for analyzing construction trends and regional differences in housing market activity.
Housing, development, initiated, completed, dwellings, Europe
false
Market Analysis and Trends
Real Estate & Construction real-estate-and-construction
Multiple Chart
Deloitte
View slide
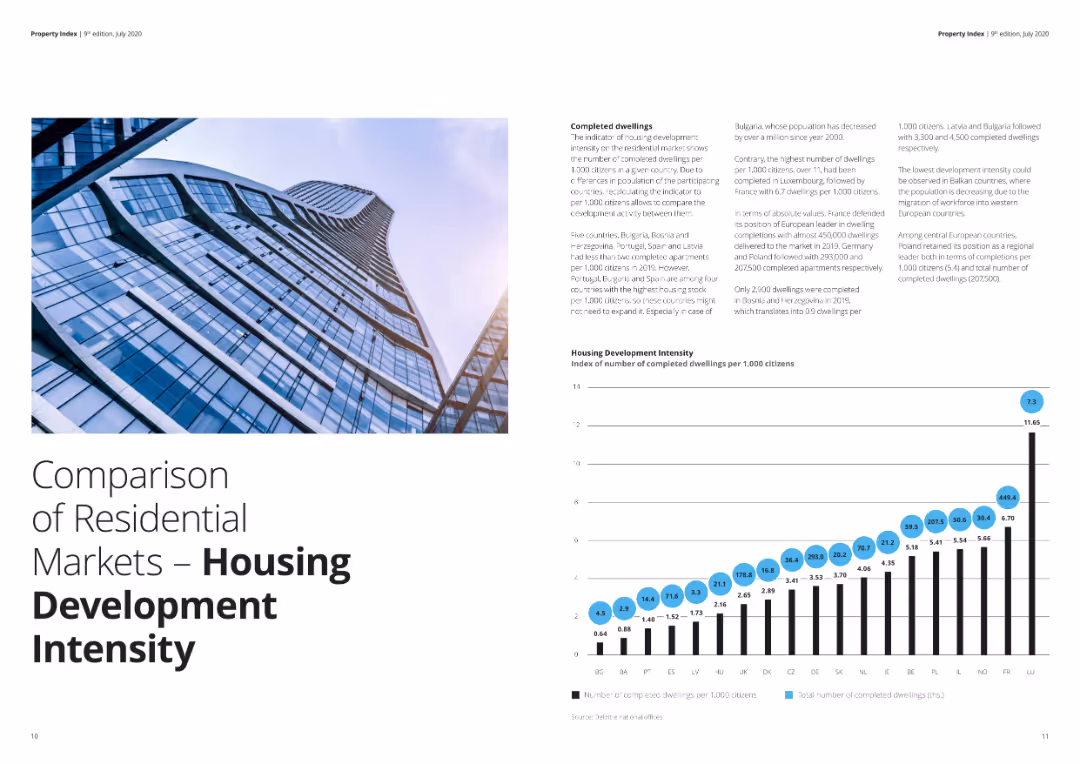
The slide includes a column chart comparing the housing development intensity across various European countries, along with accompanying text. Visual elements are moderately complex with clear labeling and distinct color coding.
Market Analysis and Trends
Real Estate & Construction
This slide compares the intensity of residential housing development in different European countries, measured by the number of completed dwellings per 1,000 citizens. It's useful for analyzing housing market trends and regional development.
Housing, development, residential, market, Europe, intensity
false
Market Analysis and Trends
Real Estate & Construction real-estate-and-construction
Mixed Chart
Deloitte
View slide
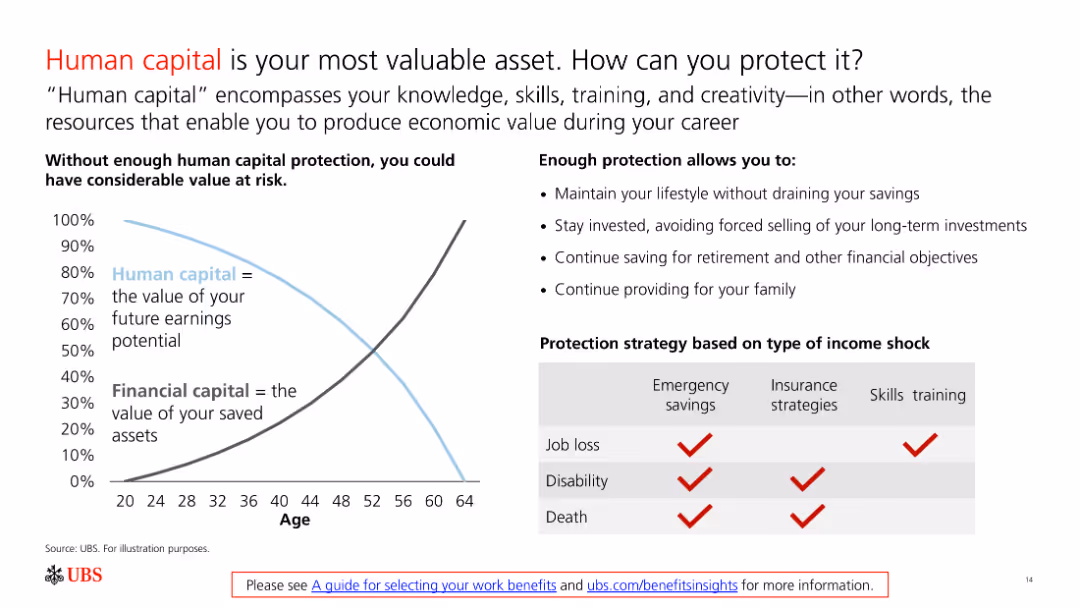
The slide features a line chart comparing human capital and financial capital over a lifetime and a table with protection strategies for income shocks.
Risk Assessment and Management
Financial Services
The slide emphasizes the importance of protecting human capital through various strategies, ensuring financial stability against job loss, disability, or death.
Human Capital, Protection, Financial Stability, Strategies, Risk
false
Risk Assessment and Management
Financial Services financial-services
Mixed Chart
UBS
View slide
This slide displays column charts detailing the impact of different human risks on the workforce, like political instability and migration. The colors indicate data for different timelines and geographies.
Human Resources and Talent Management
Professional Services
This slide examines the external human risks impacting the workforce, such as political instability and economic inequality, and how these vary by geography and over time. It emphasizes the strategic responses by businesses, including enhanced leadership and talent retention strategies, tailored for both current and future challenges.
Human Risk, Workforce, Impact, Leadership, Strategy
false
Human Resources and Talent Management
Professional Services professional-services
Mixed Chart
Deloitte
View slide
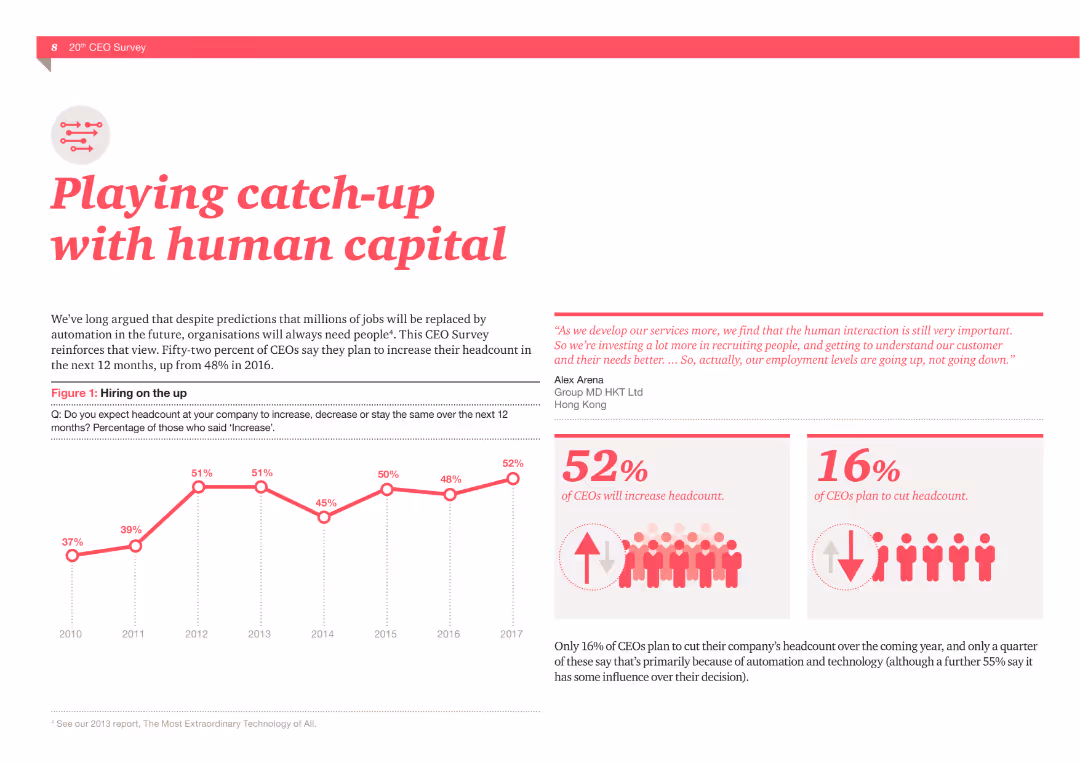
A column chart showing hiring trends from 2010 to 2017, and two statistics: 52% of CEOs plan to increase headcount, 16% plan to cut headcount. Includes a quote about the importance of human interaction.
Human Resources and Talent Management
Professional Services
The slide presents data from a CEO survey about hiring plans and the importance of human capital in the age of automation, supported by visual data and quotes.
Human capital, Hiring, CEOs, Headcount, Automation, Survey, Talent, Interaction, Recruitment, Employment
false
Human Resources and Talent Management
Professional Services professional-services
Multiple Chart
PwC/Strategy&
View slide
Combines textual explanations with imagery illustrating various human-AI interaction models.
Organizational Structure and Change
Professional Services
Explores the dynamic relationship between AI and human interaction, proposing models for maximizing AI utility in business settings.
Human-AI Dynamics, Organizational Change, AI Models, Business Optimization, Interaction Efficiency, Professional Services
false
Organizational Structure and Change
Professional Services professional-services
Header Horizontal
BCG
View slide
Diagram illustrating various touch points in the human-machine relationship, including technological inequality, social media, future of work, biotechnology, and AI.
Technology and Digital Transformation
Technology & Software
The slide explores the complex interactions between humans and machines, emphasizing the need for society to adapt and shape technological advancements. It covers topics such as technological inequality, social media impact, future work scenarios, biotechnology, and AI integration.
Human-Machine Interaction, Technological Inequality, AI
false
Technology and Digital Transformation
Technology & Software technology-and-software
Diagram
Roland Berger
View slide
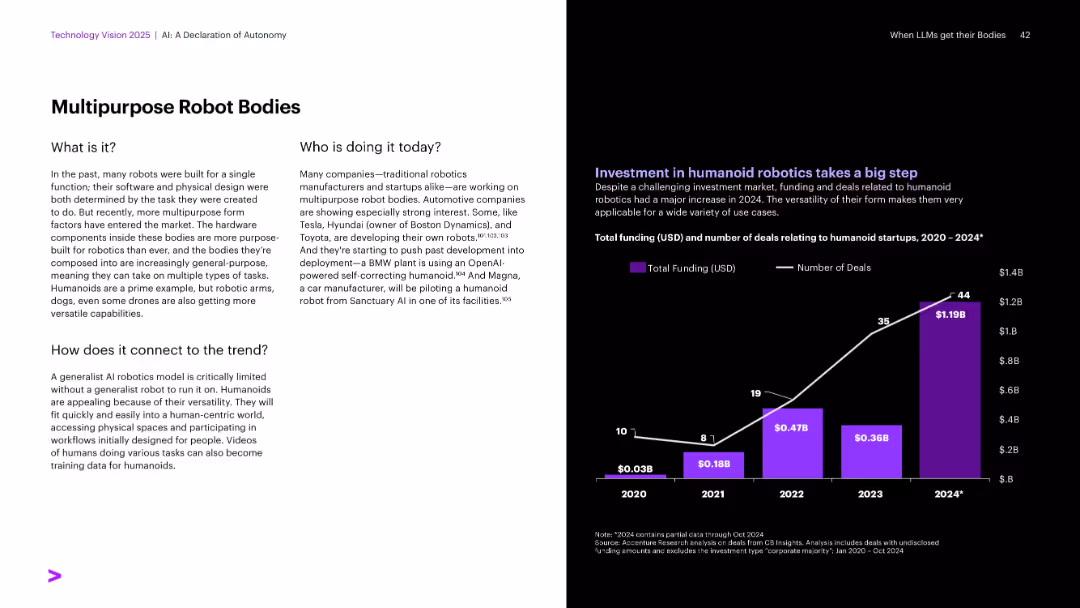
Textual explanation on white background left; chart on funding and deals in purple and white on the right.
Technology and Digital Transformation
Industrial & Manufacturing
Highlights the trend of general-purpose robot bodies, moving beyond task-specific designs. Automakers like Tesla and Toyota are developing humanoids. Investment in humanoid robotics has surged, with 2024 seeing the largest funding and number of deals, indicating strong market interest.
Humanoids, multipurpose robots, Tesla, Toyota, robotics investment
false
Technology and Digital Transformation
Industrial & Manufacturing industrial-and-manufacturing
Mixed Chart
Accenture
View slide
This slide shows multiple small stacked area and column charts comparing capacity scenarios across four categories (Central, Step Change, Fast Change, Slow Change).
Market Analysis and Trends
Energy & Utilities
Compares different capacity scenarios without the HumeLink upgrade, highlighting the potential impact on energy capacity across various changes and timelines.
HumeLink, capacity, scenarios, energy, comparison, Central, Step Change, Fast Change, Slow Change
false
Market Analysis and Trends
Energy & Utilities energy-and-utilities
Multiple Chart
EY
View slide
The slide is designed with a central pie chart that contrasts sharply with the background image of a modern, airy office space. The chart's sections are clearly delineated, using varying shades to differentiate between different work location approaches, and the background image adds depth to the visual narrative.
Technology and Digital Transformation
Professional Services
Showcasing the adoption rates of various hybrid work models, this slide offers a visual representation to aid in discussions about the flexibility and evolution of the modern workplace. It is particularly useful for HR and management to strategize on accommodating diverse work preferences in the evolving corporate landscape.
Hybrid Office, Work Models, Flexibility, Adoption Rates, Modern Workplace
false
Technology and Digital Transformation
Professional Services professional-services
Single Chart
EY
View slide
The slide presents an analysis of hybrid work models with a multi-segmented layout, featuring both text descriptions and colored blocks. Statistics are highlighted to draw focus, and a monochrome image of a casual office interaction serves as a backdrop, signifying the evolving work environment.
Human Resources and Talent Management
Professional Services
This slide analyzes the acceptance and structure of hybrid work models post-pandemic, providing valuable data for HR professionals and company leaders. It offers insights into current work patterns and their implications for company policies, talent retention, and the overall future of work.
Hybrid Work, Pandemic, Future of Work, Company Policy, Talent Retention
false
Human Resources and Talent Management
Professional Services professional-services
Text Only
EY
View slide
Structured layout with three sections, bulleted lists of digital innovations, and images of diverse working settings.
Technology and Digital Transformation
Professional Services
Data on digital innovation adoption for workplace flexibility, wellbeing, and collaboration, emphasizing hybrid technologies and health certifications.
Hybrid Work, Wellbeing, Digital Innovation, Collaboration
false
Technology and Digital Transformation
Professional Services professional-services
Header Horizontal
EY
View slide
The slide features a title, two sections with column charts, and additional small text boxes with statistics. The first chart shows the growth in consumers with hybrid fitness routines from 2020 to 2022. The second part has comparison stats on health outcomes between hybrid fitness consumers and general respondents.
Market Analysis and Trends
Healthcare & Pharmaceuticals
This slide discusses the increasing adoption of hybrid fitness models, comparing data from 2020 and 2022. It provides evidence of effectiveness by showing higher positive health outcomes among hybrid fitness users versus all respondents. The slide could be used to discuss market trends in health and fitness and consumer behavior changes post-pandemic.
Hybrid fitness, health outcomes, consumer trends, market analysis, data comparison
false
Market Analysis and Trends
Healthcare & Pharmaceuticals healthcare-and-pharmaceuticals
Single Chart
McKinsey
View slide
Combination of text, percentage circles, and data points highlighting changes in work habits and compensation expectations post-pandemic.
Human Resources and Talent Management
Professional Services
This slide explores new working norms post-pandemic, including hybrid work preferences, stress impacts, pay equity issues, and career opportunities, supported by survey data and statistics.
Hybrid work, compensation, career opportunities, pandemic, survey data, employee preferences
false
Human Resources and Talent Management
Professional Services professional-services
Multiple Chart
EY
View slide
Features a mix of text and a column chart illustrating preferred working patterns for Gen Z and millennials. Includes benefits of remote work in text bubbles.
Operational Efficiency
Professional Services
The slide highlights the high demand for hybrid working models among Gen Z and millennials and the need for businesses to adapt to this preference. It includes data on preferred working patterns and the benefits of remote work, such as cost savings and improved work-life balance.
Hybrid work, remote work, Gen Z, millennials, work-life balance
false
Operational Efficiency
Professional Services professional-services
Mixed Chart
Deloitte
View slide
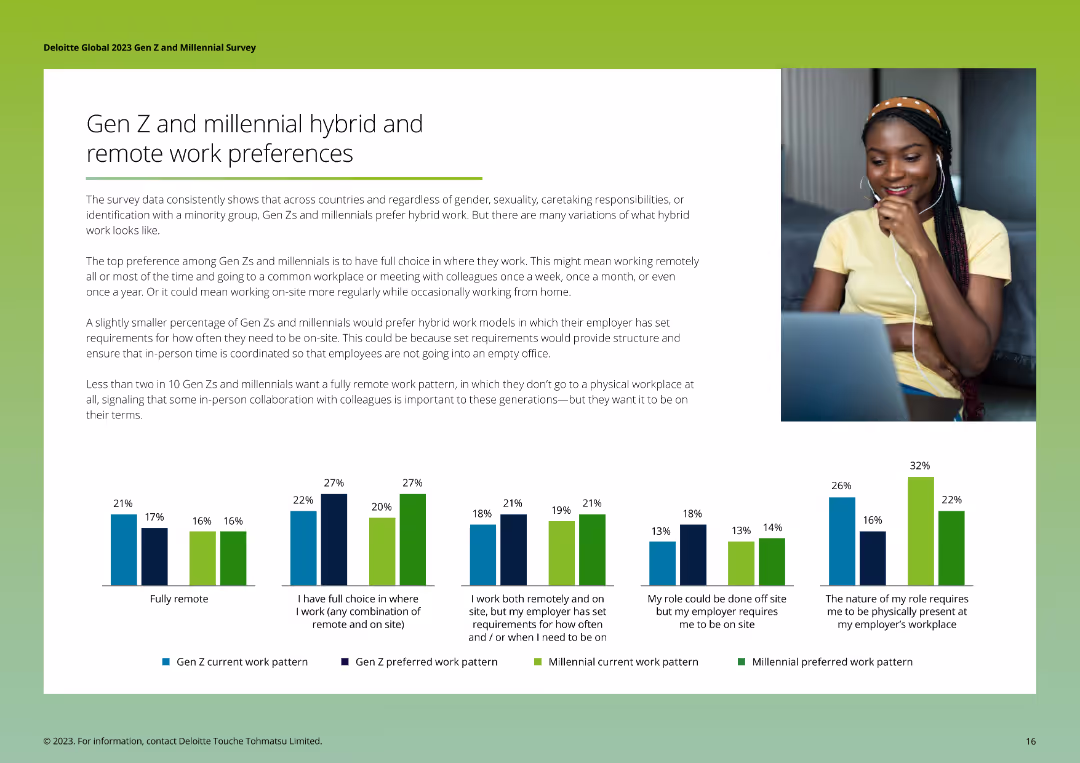
The slide features a series of column charts comparing current and preferred work patterns of Gen Zs and Millennials, highlighting preferences for hybrid and remote work models. The layout is clean and informative.
Technology and Digital Transformation
Telecommunications
The slide presents data on the hybrid and remote work preferences of Gen Zs and Millennials, showing current work patterns versus preferred arrangements, and emphasizing the desire for flexible work options and in-person collaboration under certain conditions.
Hybrid work, remote work, preferences, Gen Z, Millennials
false
Technology and Digital Transformation
Telecommunications telecommunications
Multiple Chart
Deloitte
View slide
Balanced layout with title, bullet points, and icons for productivity improvements. Neutral color palette with accent colors.
Technology and Digital Transformation
Professional Services
Discusses leadership views on flexible working options with technology integration for health, well-being, and collaboration. In-person collaboration and social events are emphasized.
Hybrid, Leadership, Flexibility, Productivity, Collaboration
false
Technology and Digital Transformation
Professional Services professional-services
Pillar
EY
View slide
Features bar graphs highlighting hydrogen demand changes by sector from 2019 to 2050, using a blue color scheme.
Market Analysis and Trends
Energy & Utilities
Analyzes sector-specific growth in hydrogen demand up to 2050, useful for market analysis in energy and industrial sectors considering a shift towards low-carbon solutions.
Hydrogen Demand, Sector Growth, 2050 Forecast, Market Analysis, Low-Carbon Transition
false
Market Analysis and Trends
Energy & Utilities energy-and-utilities
Single Chart
McKinsey
View slide
The slide is divided into sections detailing objectives, policy change propositions, and focuses on the European Union. Includes a map and objectives for decarbonizing various sectors.
Regulatory and Compliance
Government & Public Sector
Discusses the HyLaw initiative launched by Hydrogen Europe to identify and address legal barriers to hydrogen deployment, focusing on policy changes and integration in the EU.
Hydrogen Europe, HyLaw, legal barriers, policy changes, EU, decarbonization, integration, objectives
false
Regulatory and Compliance
Government & Public Sector government-and-public-sector
Table
Kearney
View slide
Features a column chart showing global hydrogen production by source and a text box with key considerations related to hydrogen production and CO2 emissions.
Market Analysis and Trends
Energy & Utilities
Explains the annual global hydrogen production and associated CO2 emissions, highlighting the predominance of fossil fuel-based production and its environmental impact.
Hydrogen production, CO2 emissions, fossil fuels, environmental impact, market trends
false
Market Analysis and Trends
Energy & Utilities energy-and-utilities
Multiple Chart
Kearney
View slide
Contains a column chart comparing H2/CO ratios across different production methods, with key comments on the right explaining the implications of these ratios.
Technology and Digital Transformation
Energy & Utilities
Highlights the importance of the H2/CO ratio in hydrogen production, comparing different methods and discussing the impact on end applications and flexibility.
Hydrogen, CO ratio, production methods, flexibility, end applications
false
Technology and Digital Transformation
Energy & Utilities energy-and-utilities
Mixed Chart
Kearney
View slide
The slide presents a table with multiple columns and rows detailing material-based technologies for hydrogen conversion, including their density, energy input, process maturity, advantages, and disadvantages. It uses color coding to differentiate technology advantages (Low, Medium, High).
Market Analysis and Trends
Energy & Utilities
This slide offers a comprehensive comparison of various hydrogen conversion and reconversion technologies. It includes key metrics like density, energy input, and process maturity, along with a summary of advantages and disadvantages for each technology.
Hydrogen, Conversion, Technology, Energy, Advantages
false
Market Analysis and Trends
Energy & Utilities energy-and-utilities
Table
Kearney
View slide
Column chart comparing levelized costs of green and pink hydrogen production, with and without subsidies, across different production technologies.
Financial Performance
Energy & Utilities
The slide illustrates the levelized costs of producing green and pink hydrogen, showing cost differences based on subsidies and production technologies.
Hydrogen, Cost analysis, Green hydrogen, Pink hydrogen, Subsidies
false
Financial Performance
Energy & Utilities energy-and-utilities
Single Chart
Roland Berger
View slide
Infographic with forecasted US hydrogen demand across various sectors, accompanied by a description of hydrogen types and their applications in the power sector.
Market Analysis and Trends
Energy & Utilities
The slide discusses the forecasted demand for hydrogen in the US, breaking down usage by sector and explaining different types of hydrogen and their power sector applications.
Hydrogen, Demand forecast, Economy, Power sector, Applications
false
Market Analysis and Trends
Energy & Utilities energy-and-utilities
Mixed Chart
Roland Berger
View slide
This slide features column charts, a pie chart, and bullet-point text. The layout is divided into three columns detailing the EU’s hydrogen strategy and its investment needs.
Industry Overview
Energy & Utilities
The slide outlines the European Union's hydrogen strategy, key action areas, and investment plans through 2050, aimed at achieving a climate-neutral Europe by promoting green hydrogen solutions.
Hydrogen, EU, Investment, Strategy, Climate
false
Industry Overview
Energy & Utilities energy-and-utilities
Multiple Chart
McKinsey
View slide
The slide features a flowchart diagram divided into two main categories: Physical transformation and Chemical combination, showing various methods of hydrogen conditioning such as Compression, Liquefaction, Chemical H₂, LOHC, Interstitial hydride, Complex hydride, and Adsorbent.
Technology and Digital Transformation
Energy & Utilities
The slide describes the process of hydrogen conditioning to increase energy density before storage and transport. It outlines physical and chemical transformation methods including compression, liquefaction, and various chemical combinations.
Hydrogen, Energy, Storage, Conditioning, Transport
false
Technology and Digital Transformation
Energy & Utilities energy-and-utilities
Diagram
Kearney
View slide
Features a timeline of major mergers, acquisitions, joint ventures, and partnerships in hydrogen technology from 2016 to 2019. Key events are highlighted with brief descriptions.
Mergers and Acquisitions
Energy & Utilities
Details the increasing interest of large corporations in hydrogen technology through various strategic partnerships and acquisitions over the years.
Hydrogen, M&A, joint ventures, partnerships, timeline, corporations, interest, technology
false
Mergers and Acquisitions
Energy & Utilities energy-and-utilities
Linear Flow
Kearney
Previous
Loading...
Hold On!
We are searching in our database
If nothing, comes up, please try different filters!
Column Chart
Heatmap
Chevron
Org Chart
Infographic
Callouts
Timeline
List
Graphic
Picture
Process Flow
Diagram
Paragraph
Map
Table
Framework
Subtitle
Takeaway Box
Icon
Other Chart
Radar Chart
Waterfall Chart
Mekko Chart
Pie Chart
Scatter Plot
Line Chart
Bar chart
Bullet points
Create a FREE account to continue browsing
Receive Instant Access to 1,000+ slides from companies like McKinsey, Google, and Goldman Sachs
First Name
Last Name
Email
Password
I agree to all
Terms & Privacy Policy
Thank you! Your submission has been received!
Oops! Something went wrong while submitting the form.
Have an account?
Sign in
Upgrade to PRO to Save slides
Advanced Search and Filters
Access to 15,000+ slides
Access to Category Pages
Save/Bookmark Slides
PowerPoint Template Library
Pick a Plan
MONTHLY
$12/month
Billed every month, Cancel anytime.
YEARLY
$9/year
Billed $108 annually, Cancel anytime.
Checkout for $12/month
Checkout for $108/yr
Secured by Stripe | AES-256 bit encryption