My Account
My Slides
Search by Category
Templates
Leave Feedback
Login
Logout
Get Started
Browse all Slides
Browse all Slides
Create a FREE Account
Instant access to 1,000+ real slides from top companies like McKinsey, BCG, Goldman Sachs, Google and many more!
First Name
Last Name
Email
Password
I agree to all
Terms & Privacy Policy
Thank you! Your submission has been received!
Oops! Something went wrong while submitting the form.
Have an account?
Sign in
📢 Ready to start building slides? Check out our new template library
VIEW TEMPLATES
Welcome,
Welcome
PRO
Show Featured Only
Checkbox 8
Companies
Mckinsey
Bain
BCG
EY
Deloitte
Accenture
PwC/Strategy&
JP Morgan
Goldman Sachs
Morgan Stanley
Citigroup
Deutsche Bank
Barclays
LEK
KPMG
Kearney
Oliver Wyman
Booz Allen Hamilton
Gartner
IPSOS
Nielsen
Slide type
Text Only
Linear Flow
Vertical Flow
Single Chart
Header Horizontal
Mixed Chart
Header Vertical
Pillar
Multiple Chart
Graphic
Agenda
Title
Table
Framework
Industry
Technology & Software
Artificial Intelligence
Financial Services
Retail & E-commerce
Consumer Goods
Industrial & Manufacturing
Transportation & Logistics
Telecommunications
Real Estate & Construction
Hospitality & Tourism
Professional Services
Education & Training
Media & Entertainment
Agriculture & Food Production
Healthcare & Pharmaceuticals
Environmental Services & Sustainability
Government & Public Sector
Use Case
Mergers and Acquisitions
Performance Metrics and KPIs
Client Case Studies
Competitive Landscape
Corporate Finance and Valuation
Product and Service Analysis
Customer and Market Segmentation
Organizational Structure and Change
Industry Overview
Regulatory and Compliance
Risk Assessment and Management
Investment Analysis
Organizational Structure and Change
Human Resources and Talent Management
Financial Performance
Market Analysis and Trends
Sales and Business Development
Human Resources and Talent Management
Clear all
Thank you! Your submission has been received!
Oops! Something went wrong while submitting the form.
Tag
View slide
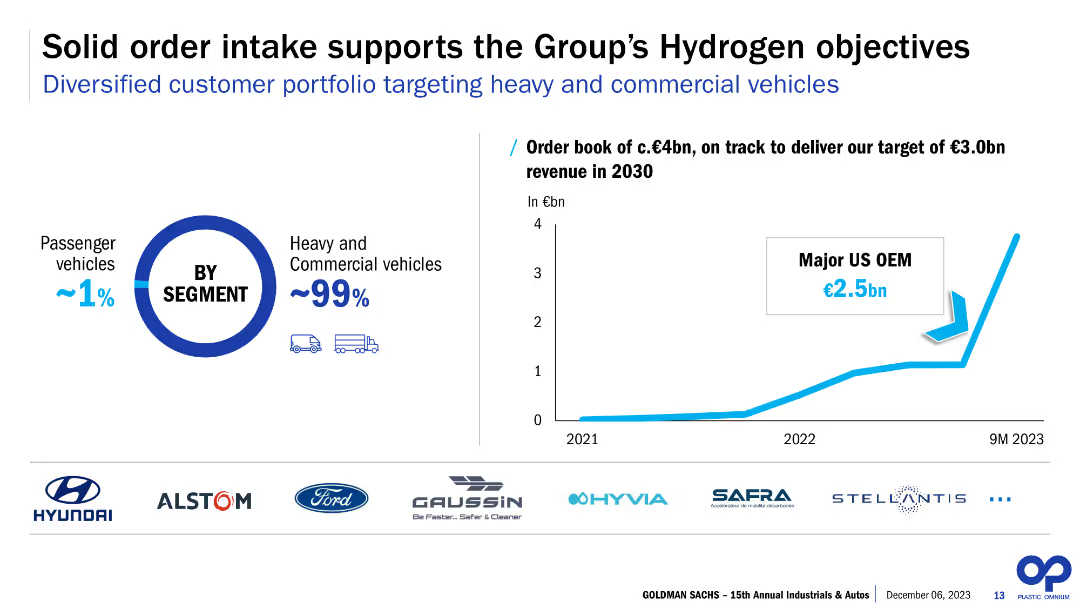
The slide showcases a rising trend line chart for order intake over three years, with logos of major customers below. It includes a text box highlighting a significant order value from a major U.S. OEM. The design is straightforward with a clear focus on the upward trend, utilizing shades of blue and an accent color for the key figure.
Investment Analysis
Industrial & Manufacturing
It highlights the company's solid order intake, emphasizing its alignment with the group's hydrogen objectives. The focus on heavy and commercial vehicles, as indicated by the segment breakdown, suggests a strategic shift towards this market. This could be used to discuss investment potential in the hydrogen sector and the company's positioning for future revenue growth.
Hydrogen, Order Intake, Commercial Vehicles, Trend Line, Strategic Direction, Major Customers, Industrial, Revenue Projections
false
Investment Analysis
Industrial & Manufacturing industrial-and-manufacturing
Multiple Chart
Goldman Sachs
View slide
The slide has a description box, a market trends box, and an overview of technologies. It includes a small diagram showing the comparative size and cost of various storage technologies like PHES, CAES, Li-ion, and compressed H₂.
Strategic Planning
Energy & Utilities
The slide discusses the viability of compressed hydrogen storage in salt caverns for long-term energy storage, highlighting market trends, competing technologies, and economic feasibility.
Hydrogen, Storage, Salt Caverns, Market Trends, Technology
false
Strategic Planning
Energy & Utilities energy-and-utilities
Mixed Chart
Kearney
View slide
The slide shows a technology maturity curve graph, plotting various hydrogen production technologies against time and risk. The chart includes technologies like SMR, Alkaline electrolysis, and Methane cracking, color-coded by thermochemical production, electrolysis production, and others.
Market Analysis and Trends
Energy & Utilities
This slide presents a maturity curve for hydrogen production technologies, categorizing them based on their development stage and associated risks. It highlights the transition from research to deployment phases, illustrating the technological advancements in hydrogen production.
Hydrogen, Technology, Maturity, Production, Risk
false
Market Analysis and Trends
Energy & Utilities energy-and-utilities
Single Chart
Kearney
View slide
Includes a detailed diagram categorizing H2 production technologies by primary source and conversion technology, along with associated hydrogen categories.
Technology and Digital Transformation
Energy & Utilities
Outlines different hydrogen production technologies, categorized into thermochemical, electrolysis, microbial, and photolytic methods, and their respective applications.
Hydrogen, conversion technologies, thermochemical, electrolysis, production methods
false
Technology and Digital Transformation
Energy & Utilities energy-and-utilities
Diagram
Kearney
View slide
Contains a process diagram of dark fermentation, supported by text descriptions of the biochemical reactions involved, along with pros, cons, and key feature estimates.
Technology and Digital Transformation
Energy & Utilities
Describes dark fermentation as a method of hydrogen production from organic matter, detailing the biochemical reactions, process steps, and advantages and disadvantages.
Hydrogen, dark fermentation, biochemical reactions, organic matter, production process
false
Technology and Digital Transformation
Energy & Utilities energy-and-utilities
Diagram
Kearney
View slide
Contains a matrix comparing potential applications of various decarbonization technologies, including hydrogen, across different sectors consuming fossil fuels.
Competitive Landscape
Energy & Utilities
Compares hydrogen's role and applicability with other decarbonization technologies in sectors like aviation, shipping, rail, trucks, industry, and power.
Hydrogen, decarbonization, low carbon, fossil fuels, competitive analysis
false
Competitive Landscape
Energy & Utilities energy-and-utilities
Table
Kearney
View slide
Features a timeline illustrating the history of hydrogen production technologies from the 1800s to the present, using boxes to highlight key milestones and developments.
Technology and Digital Transformation
Energy & Utilities
Describes the historical progression of hydrogen production technologies, emphasizing the shift from electrolysis to fossil fuel-based methods in the 1970s.
Hydrogen, electrolysis, fossil fuels, timeline, production technologies
false
Technology and Digital Transformation
Energy & Utilities energy-and-utilities
Linear Flow
Kearney
View slide
The slide includes a segmented bar chart on the left for GHG emissions by segment and a table on the right detailing hydrogen use cases and substitution methods.
Technology and Digital Transformation
Energy & Utilities
Details how hydrogen can be used to decarbonize sectors responsible for over 65% of global emissions, with specific use cases and substitution methods highlighted.
Hydrogen, emissions, decarbonization, energy transition, GHG
false
Technology and Digital Transformation
Energy & Utilities energy-and-utilities
Mixed Chart
Kearney
View slide
The slide includes a detailed text description, bullet points, and a graph comparing specific energy and energy density of various fuels.
Technology and Digital Transformation
Energy & Utilities
Provides an overview of hydrogen's properties, advantages, disadvantages, and physical properties, emphasizing its high energy density and applications.
Hydrogen, energy density, properties, advantages, disadvantages
false
Technology and Digital Transformation
Energy & Utilities energy-and-utilities
Mixed Chart
Kearney
View slide
Simplified value chain diagram of hydrogen-based energy conversion solutions with various flow elements like gas network, power network, and liquid fuel network.
Technology and Digital Transformation
Energy & Utilities
Illustrates the role of hydrogen in the energy transition, linking multiple energy sources and industrial applications through a comprehensive value chain diagram.
Hydrogen, energy transition, value chain, energy sources, industrial applications
false
Technology and Digital Transformation
Energy & Utilities energy-and-utilities
Diagram
Kearney
View slide
Contains a detailed process diagram of steam methane reforming, supported by text descriptions of each step and key feature estimates in a table format.
Technology and Digital Transformation
Energy & Utilities
Explains the process of steam methane reforming, highlighting the steps involved in separating hydrogen from methane, along with the pros, cons, and key feature estimates.
Hydrogen, methane, steam reforming, CO2, production process
false
Technology and Digital Transformation
Energy & Utilities energy-and-utilities
Diagram
Kearney
View slide
The slide features a column chart illustrating the order book from 2021 to 9M 2023, and a pie chart showing the segment distribution between passenger and commercial vehicles. It also lists logos of major clients and shows a projected revenue target for 2030.
Strategic Planning
Energy & Utilities
The slide discusses the solid order intake supporting Plastic Omnium’s hydrogen objectives, with a focus on heavy and commercial vehicles. It highlights major clients and sets a revenue target of €3.0bn by 2030, indicating strong future prospects and strategic planning in the hydrogen sector.
Hydrogen, order intake, commercial vehicles, passenger vehicles, revenue target, major clients, strategic planning, future prospects, Plastic Omnium, 2030
false
Strategic Planning
Energy & Utilities energy-and-utilities
Multiple Chart
Goldman Sachs
View slide
Features a process diagram of photolytic conversion technologies, supported by text descriptions of the reactions and processes involved, along with pros, cons, and key features.
Technology and Digital Transformation
Energy & Utilities
Explains photolytic technologies for hydrogen production, focusing on converting sunlight into hydrogen, with details on the processes, pros, cons, and key features.
Hydrogen, photolytic conversion, sunlight, production technologies, renewable energy
false
Technology and Digital Transformation
Energy & Utilities energy-and-utilities
Graphic
Kearney
View slide
Features a detailed diagram of the hydrogen value chain, including production technologies and applications across different sectors.
Technology and Digital Transformation
Energy & Utilities
Describes various hydrogen production technologies and their applications in different sectors, highlighting multiple pathways in the hydrogen value chain.
Hydrogen, production, value chain, technologies, applications
false
Technology and Digital Transformation
Energy & Utilities energy-and-utilities
Table
Kearney
View slide
The slide features a column chart showing the number of countries supporting hydrogen initiatives in various sectors like transportation, refueling stations, buses, and trucks.
Regulatory and Compliance
Energy & Utilities
Highlights global initiatives supporting hydrogen deployment across different sectors, emphasizing the number of countries involved in each initiative.
Hydrogen, support initiatives, countries, deployment, transportation, refueling, buses, trucks
false
Regulatory and Compliance
Energy & Utilities energy-and-utilities
Single Chart
Kearney
View slide
Displays a comparative table of hydrogen use cases across different countries, including industrial feedstock, FCEV manufacturing, electricity generation, and heating.
Strategic Planning
Energy & Utilities
Compares how different countries are developing hydrogen use cases across various sectors, focusing on strategic planning and implementation.
Hydrogen, use cases, strategy, comparative, countries, industrial feedstock, manufacturing, electricity generation
false
Strategic Planning
Energy & Utilities energy-and-utilities
Table
Kearney
View slide
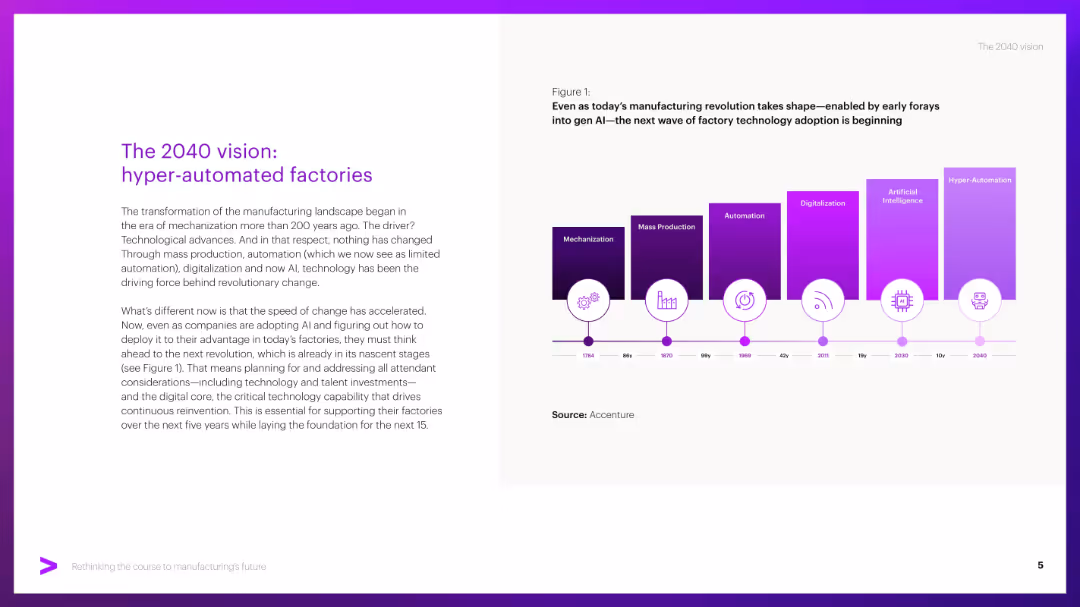
Split layout: left side has title and paragraph text, right side has a timeline graphic with colored blocks indicating tech evolution.
Strategic Planning
Industrial & Manufacturing
Describes the evolution of manufacturing from mechanization to hyper-automation, emphasizing the role of AI and digital technologies. Urges firms to prepare for upcoming shifts by investing in tech, talent, and digital core infrastructure.
Hyper-automation, AI, factories, automation timeline, digitalization
false
Strategic Planning
Industrial & Manufacturing industrial-and-manufacturing
Mixed Chart
Accenture
View slide
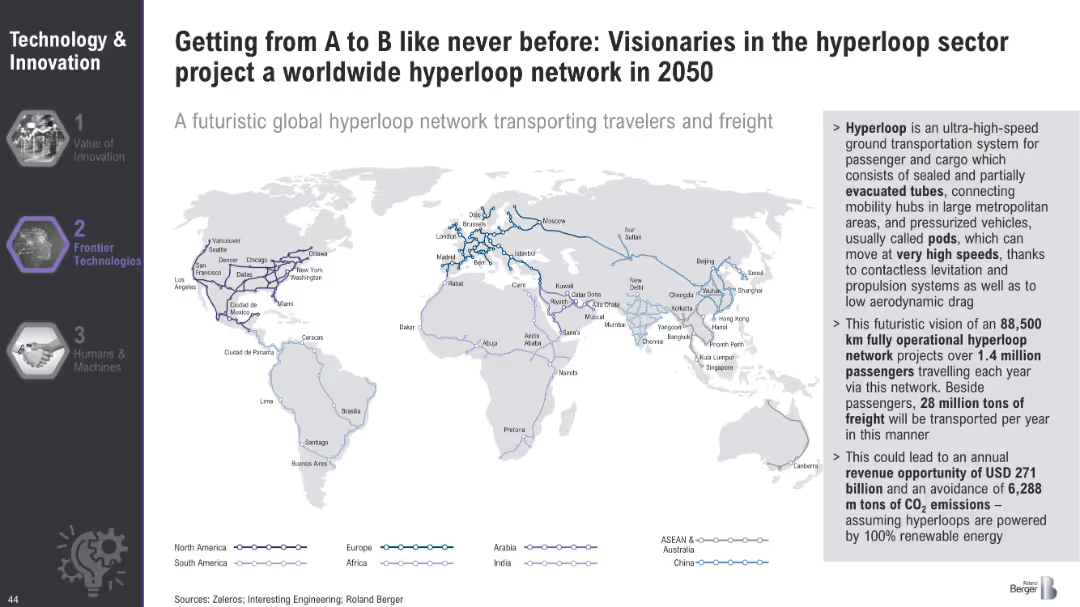
World map illustrating the projected global hyperloop network for 2050, highlighting major routes and connections across continents.
Technology and Digital Transformation
Transportation & Logistics
The slide envisions a global hyperloop network by 2050, outlining the potential routes and connections that could transport passengers and freight at high speeds. It emphasizes the economic and environmental benefits of this futuristic transportation system.
Hyperloop, Global Network, Transportation
false
Technology and Digital Transformation
Transportation & Logistics transportation-and-logistics
Graphic
Roland Berger
View slide
Features a detailed process flow diagram of the H₂ value chain, highlighting upstream, midstream, and downstream opportunities for carbon fiber vessels.
Strategic Planning
Industrial & Manufacturing
The slide identifies strategic opportunities for carbon fiber vessels within the H₂ value chain, covering storage, transportation, and end-use markets.
H₂, Carbon Fiber Vessels, Value Chain, Opportunities, Storage
false
Strategic Planning
Industrial & Manufacturing industrial-and-manufacturing
Linear Flow
Roland Berger
View slide
This slide includes a map and column charts showing the number of gaseous and liquid HRS globally, highlighting operational status and future plans.
Operational Efficiency
Energy & Utilities
The slide maps out existing H₂ production and distribution infrastructure, noting the phase-out of liquid HRS and the focus on gaseous systems for mobility.
H₂, Infrastructure, Mobility, Gaseous, Liquid HRS
false
Operational Efficiency
Energy & Utilities energy-and-utilities
Multiple Chart
Roland Berger
View slide
Contains two column charts showing market value growth in EUR billion by segment and by region from 2023 to 2030, with a 47% p.a. growth rate noted.
Market Analysis and Trends
Transportation & Logistics
The slide projects significant growth in the H₂ mobile storage market for transportation and stationary storage, with detailed breakdowns by segment and region.
H₂, Mobile Storage, Market Value, Growth, Segments, Regions
false
Market Analysis and Trends
Transportation & Logistics transportation-and-logistics
Multiple Chart
Roland Berger
View slide
The slide features a line graph comparing perceptions of I&D maturity among different groups within organizations, showing variance in perceived progress.
Strategic Planning
Professional Services
This slide tracks the progress of inclusion and diversity initiatives through a maturity curve, reflecting varying perceptions among employees, HR, and different gender and ethnic groups.
I&D Initiatives, Maturity Curve, Perceptions, Employees, HR, Gender, Ethnic Groups, Progress, Diversity
false
Strategic Planning
Professional Services professional-services
Single Chart
Accenture
View slide
The slide presents a column chart comparing regional data. It uses contrasting colors to differentiate between North America and the rest of the world across several I&D maturity levels. Textual analysis is provided on the side.
Strategic Planning
Professional Services
This slide provides insights into regional variations in I&D maturity levels, with a specific focus on North American perspectives versus global ones.
I&D, regional analysis, column chart, North America, global comparison, maturity levels
false
Strategic Planning
Professional Services professional-services
Single Chart
Accenture
View slide
Contains a hierarchical diagram of the IAF department and a world map with connections, illustrating global coordination.
Organizational Structure and Change
Financial Services
The slide explains how the IAF department responds to changing client needs, emphasizing its global coordination and strategic direction under the Group CEO's leadership.
IAF, Client Needs, Organizational Change, Global Coordination, Strategy
false
Organizational Structure and Change
Financial Services financial-services
Diagram
Credit Suisse
View slide
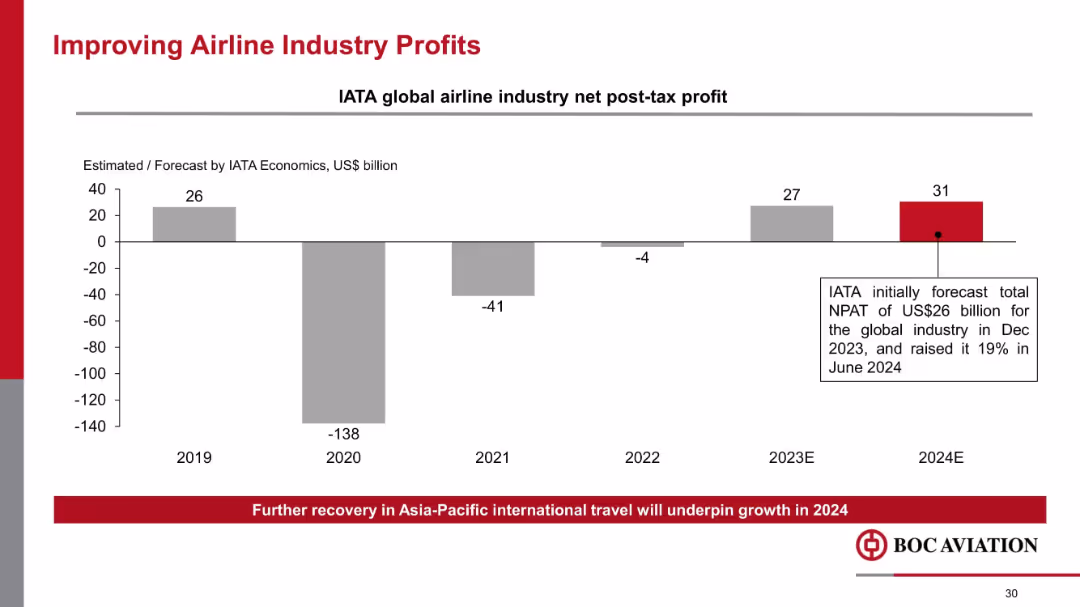
Vertical bar chart showing IATA profit estimates; bold highlight for 2024E; annotation box explaining forecast hike
Industry Overview
Transportation & Logistics
Charts the rebound in airline industry profitability post-COVID, highlighting IATA’s 2024 forecast of US$31B profit. Indicates optimism in airline recovery, especially in Asia-Pacific, and its effect on BOC Aviation’s outlook.
IATA, airline profits, aviation recovery, net profit, COVID rebound, forecast, industry trends
false
Industry Overview
Transportation & Logistics transportation-and-logistics
Mixed Chart
Goldman Sachs
View slide
Central smartphone image with features listed around it, and icons representing currencies and stocks.
Technology and Digital Transformation
Technology & Software
Promotes the IBKR GlobalTrader app, outlining its capabilities and global stock trading opportunities, emphasizing zero-commission trades.
IBKR, GlobalTrader, Mobile App, Stock Trading, Zero Commissions, Cryptocurrencies, Global Markets, Digital Platform
false
Technology and Digital Transformation
Technology & Software technology-and-software
Diagram
Goldman Sachs
View slide
Two graphs showing growth trends: an area graph for client accounts and a column chart for client equity.
Financial Performance
Financial Services
Depicts IBKR's growth trajectory through area and column charts, detailing increased client accounts and equity, suggesting robust platform performance.
IBKR, Growth, Client Accounts, Client Equity, Area Graph, Column Chart, Financial Markets, Interconnectedness
false
Financial Performance
Financial Services financial-services
Multiple Chart
Goldman Sachs
View slide
A horizontal timeline highlights key milestones in the company's history with descriptive text and images.
Industry Overview
Technology & Software
Traces the technological evolution of IBKR over four decades, marking significant milestones and innovations in trading platforms.
IBKR, Technological Evolution, Milestones, Automated Trading, Timeline, Innovations, Broker-Dealer, Market Expansion
false
Industry Overview
Technology & Software technology-and-software
Linear Flow
Goldman Sachs
View slide
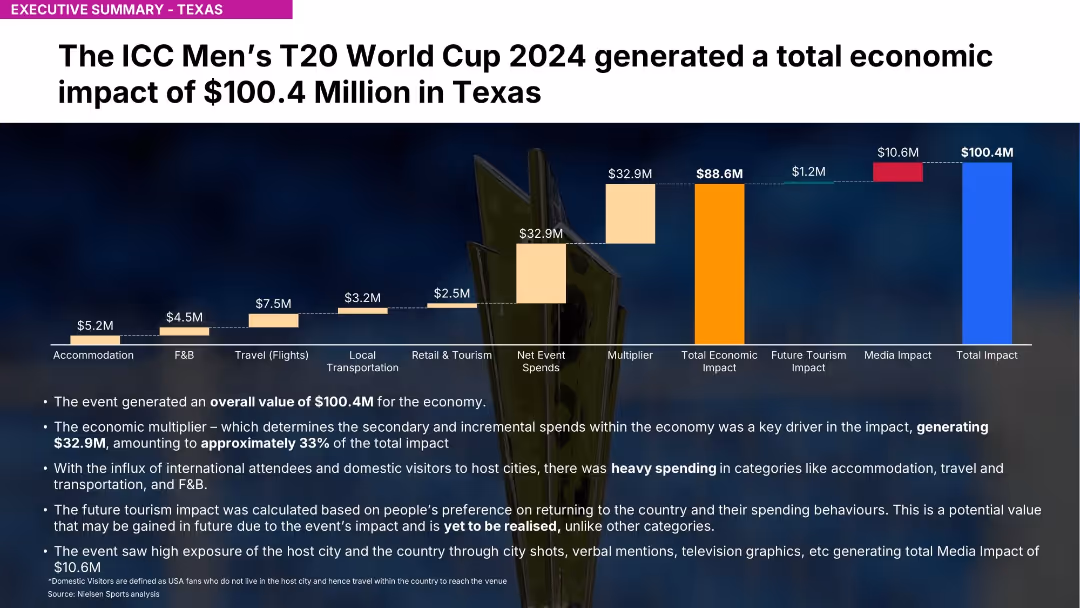
Bar chart with stacked economic impact contributions and bullet-point summary below
Investment Analysis
Media & Entertainment
Shows Texas generated $100.4M economic impact from the ICC T20 event. Key spend categories include accommodation, F&B, travel. Future tourism impact noted.
ICC, T20, Texas, economic impact, tourism, accommodation, F&B, Nielsen, sports economy, event analysis
false
Investment Analysis
Media & Entertainment media-and-entertainment
Mixed Chart
Nielsen
View slide
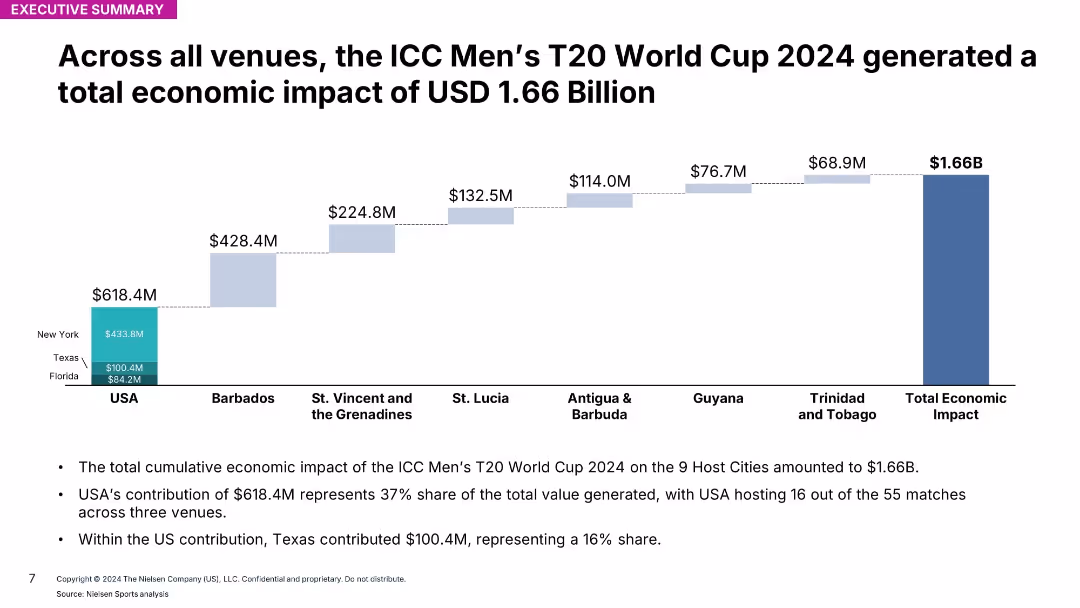
Stacked bar chart showing contributions by host countries/regions; total impact $1.66B
Investment Analysis
Media & Entertainment
Breaks down total $1.66B economic impact from ICC Men’s T20 World Cup across all host venues. USA is top contributor with 37% share, followed by Barbados.
ICC, T20, global impact, venues, host nations, event analysis, economic data, Nielsen, total contribution, summary
false
Investment Analysis
Media & Entertainment media-and-entertainment
Mixed Chart
Nielsen
Previous
Loading...
Hold On!
We are searching in our database
If nothing, comes up, please try different filters!
Column Chart
Heatmap
Chevron
Org Chart
Infographic
Callouts
Timeline
List
Graphic
Picture
Process Flow
Diagram
Paragraph
Map
Table
Framework
Subtitle
Takeaway Box
Icon
Other Chart
Radar Chart
Waterfall Chart
Mekko Chart
Pie Chart
Scatter Plot
Line Chart
Bar chart
Bullet points
Create a FREE account to continue browsing
Receive Instant Access to 1,000+ slides from companies like McKinsey, Google, and Goldman Sachs
First Name
Last Name
Email
Password
I agree to all
Terms & Privacy Policy
Thank you! Your submission has been received!
Oops! Something went wrong while submitting the form.
Have an account?
Sign in
Upgrade to PRO to Save slides
Advanced Search and Filters
Access to 15,000+ slides
Access to Category Pages
Save/Bookmark Slides
PowerPoint Template Library
Pick a Plan
MONTHLY
$12/month
Billed every month, Cancel anytime.
YEARLY
$9/year
Billed $108 annually, Cancel anytime.
Checkout for $12/month
Checkout for $108/yr
Secured by Stripe | AES-256 bit encryption