My Account
My Slides
Search by Category
Templates
Leave Feedback
Login
Logout
Get Started
Browse all Slides
Browse all Slides
Create a FREE Account
Instant access to 1,000+ real slides from top companies like McKinsey, BCG, Goldman Sachs, Google and many more!
First Name
Last Name
Email
Password
I agree to all
Terms & Privacy Policy
Thank you! Your submission has been received!
Oops! Something went wrong while submitting the form.
Have an account?
Sign in
📢 Ready to start building slides? Check out our new template library
VIEW TEMPLATES
Welcome,
Welcome
PRO
Show Featured Only
Checkbox 8
Companies
Mckinsey
Bain
BCG
EY
Deloitte
Accenture
PwC/Strategy&
JP Morgan
Goldman Sachs
Morgan Stanley
Citigroup
Deutsche Bank
Barclays
LEK
KPMG
Kearney
Oliver Wyman
Booz Allen Hamilton
Gartner
IPSOS
Nielsen
Slide type
Text Only
Linear Flow
Vertical Flow
Single Chart
Header Horizontal
Mixed Chart
Header Vertical
Pillar
Multiple Chart
Graphic
Agenda
Title
Table
Framework
Industry
Technology & Software
Artificial Intelligence
Financial Services
Retail & E-commerce
Consumer Goods
Industrial & Manufacturing
Transportation & Logistics
Telecommunications
Real Estate & Construction
Hospitality & Tourism
Professional Services
Education & Training
Media & Entertainment
Agriculture & Food Production
Healthcare & Pharmaceuticals
Environmental Services & Sustainability
Government & Public Sector
Use Case
Mergers and Acquisitions
Performance Metrics and KPIs
Client Case Studies
Competitive Landscape
Corporate Finance and Valuation
Product and Service Analysis
Customer and Market Segmentation
Organizational Structure and Change
Industry Overview
Regulatory and Compliance
Risk Assessment and Management
Investment Analysis
Organizational Structure and Change
Human Resources and Talent Management
Financial Performance
Market Analysis and Trends
Sales and Business Development
Human Resources and Talent Management
Clear all
Thank you! Your submission has been received!
Oops! Something went wrong while submitting the form.
Tag
View slide
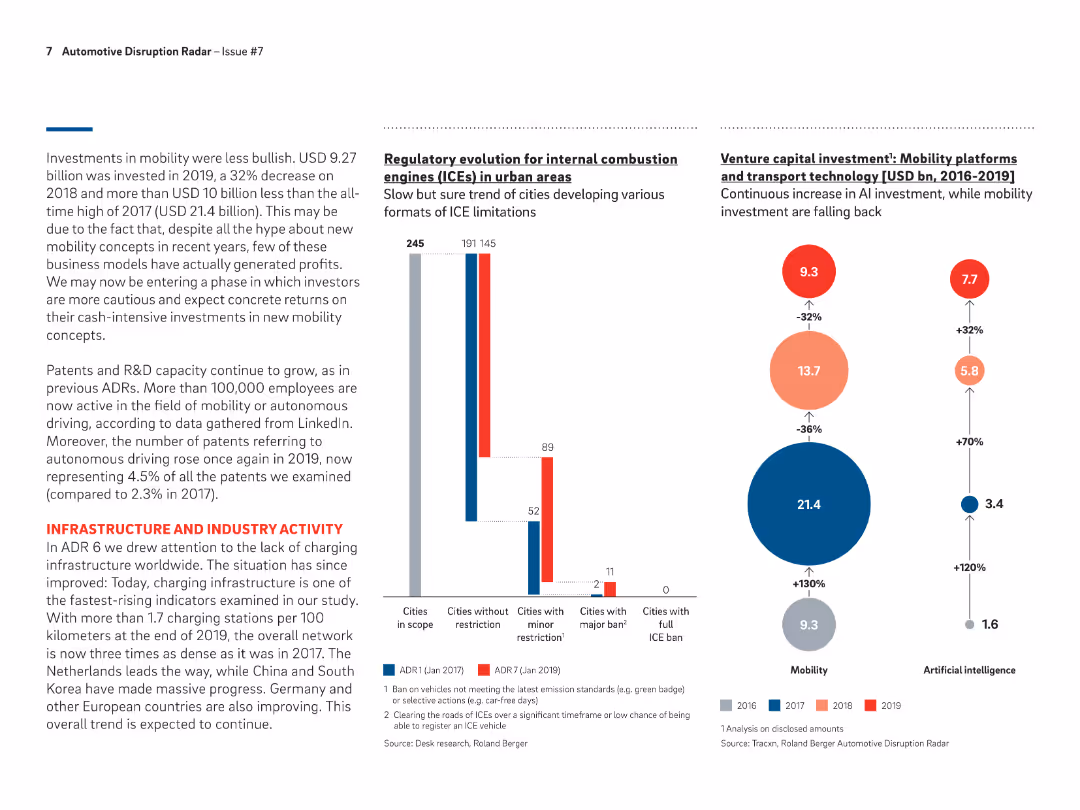
Bar chart showing the number of cities with various levels of ICE restrictions from ADR1 to ADR7, highlighting the increase in cities with minor and major restrictions.
Regulatory and Compliance
Transportation & Logistics
Discusses the regulatory changes impacting ICEs in urban areas, with a growing number of cities implementing restrictions to promote the adoption of cleaner vehicle technologies.
ICE restrictions, urban areas, regulatory changes, ADR
false
Regulatory and Compliance
Transportation & Logistics transportation-and-logistics
Multiple Chart
Roland Berger
View slide
The slide features multiple data visualizations including a large column chart, a line graph, and several tables with quantitative data. Colors like red and black are used for text and highlighting, with a clear division between different sections.
Market Analysis and Trends
Financial Services
This slide presents an overview of global token offerings in the first ten months of 2019, showcasing total funds raised and the evolution of offerings over the years. It includes specific examples like the Telegram ICO and uses visual aids to compare funding volumes and token offering counts.
ICO, STO, global, funding, blockchain, 2019, token offerings, digital tokens
false
Market Analysis and Trends
Financial Services financial-services
Mixed Chart
PwC/Strategy&
View slide
Donut chart showing market share by country/region in the ICT industry for 2021, alongside a column chart projecting global ICT spending from 2021 to 2023.
Technology and Digital Transformation
Technology & Software
The slide highlights the importance of a mature ICT industry as a foundation for technological innovation. It shows the market share of different regions in the ICT sector and projects an increase in global ICT spending, emphasizing the role of ICT in economic development.
ICT Industry, Market Share, Global Spending
false
Technology and Digital Transformation
Technology & Software technology-and-software
Multiple Chart
Roland Berger
View slide
A bar chart compares the ICT market size in 2021 and projected growth in 2026 across ASEAN countries. The slide background is dark red with a maroon header.
Market Analysis and Trends
Technology & Software
The slide predicts a substantial increase in digital talent demand aligned with the ICT market growth in ASEAN countries, useful for strategic planning in talent management.
ICT market, digital talent, ASEAN, market growth, talent management, 2026 projection
false
Market Analysis and Trends
Technology & Software technology-and-software
Multiple Chart
Kearney
View slide
This slide presents column charts showing the percentage of schools affected by various challenges impacting ICT teaching time. It includes quotes from the Federal Ministry of Education, Nigeria, and the Universal Basic Education Commission, highlighting the severity of irregular power supply in Nigeria.
Strategic Planning
Education & Training
This slide depicts the significant challenge of irregular power supply on ICT education in Nigerian public schools. It presents data and authoritative quotes to highlight the urgency of the issue and its impact on the effectiveness of ICT teaching, advocating for infrastructural improvements in the power supply.
ICT, Education, Nigeria, Power Supply, Challenges
false
Strategic Planning
Education & Training education-and-training
Mixed Chart
BCG
View slide
This slide shows a breakdown of ICT facility availability in schools by power source, using column and pie charts. It discusses the substantial reliance on generators due to unstable power supply and the associated challenges.
Strategic Planning
Education & Training
It analyzes the dependency on generators by Nigerian public schools for ICT, detailing the percentage of schools using generators and the impact on school operations and costs. The slide aims to underline the need for more reliable energy solutions to support education.
ICT, Generators, Nigeria, Education, Reliability
false
Strategic Planning
Education & Training education-and-training
Multiple Chart
BCG
View slide
This slide presents a bar chart comparing average minutes per week spent on practical ICT classes in various countries, highlighting the low figures for Nigeria both before and after solar adoption relative to other countries.
Strategic Planning
Education & Training
This slide offers an international perspective on ICT teaching hours, showing Nigeria's position relative to other countries and the impact of solar power adoption on improving these metrics. It suggests a need for continued efforts to enhance ICT infrastructure.
ICT, Global Comparison, Nigeria, Education, Solar Power
false
Strategic Planning
Education & Training education-and-training
Single Chart
BCG
View slide
Showcases a bar chart comparing the duration of ICT classes in Nigerian schools to those in other countries, emphasizing the gaps in technology education.
Strategic Planning
Education & Training
Critiques the current state of ICT education in Nigeria, showing significantly lower hours dedicated to practical ICT training compared to other nations, arguing for improved infrastructure to bridge this gap.
ICT, education, Nigeria, technology training, international comparison, infrastructure gaps
false
Strategic Planning
Education & Training education-and-training
Single Chart
BCG
View slide
Orange, blue and green hues separate policies and actions on the left from country examples on the right, emphasizing government roles.
Strategic Planning
Technology & Software
Focuses on government policies to retain and attract talent in the ICT sector, mentioning examples from different countries.
ICT, government policy, talent retention, work hours, diversity, workspace
false
Strategic Planning
Technology & Software technology-and-software
Header Vertical
Kearney
View slide
The slide includes a large column chart tracking the funding volume of IEOs over several months, accompanied by a line chart detailing the share of IEOs in the overall token offering market. It employs a professional color scheme of red and grey shades.
Investment Analysis
Financial Services
Summarizes the recent trends in Initial Exchange Offerings (IEOs), particularly focusing on the significant roles they play despite a broader decline in token offerings. Highlights the largest IEO by Bitfinex and discusses the potential for IEOs as a stable crowdfunding mechanism.
IEOs, token offerings, funding volume, trends, Bitfinex, blockchain, 2019
false
Investment Analysis
Financial Services financial-services
Multiple Chart
PwC/Strategy&
View slide
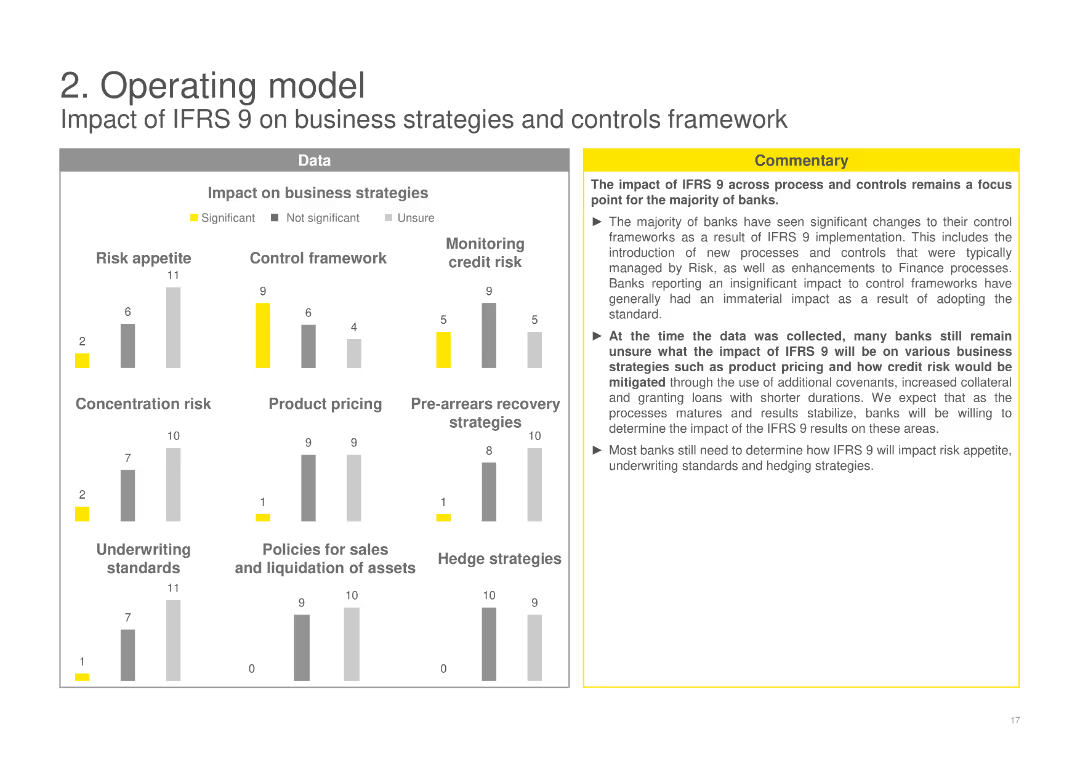
Includes column charts evaluating the impact of IFRS 9 on various business strategies like risk appetite, control framework, product pricing, and more, with a commentary box discussing overall impacts and uncertainties.
Operational Efficiency
Financial Services
Assesses the impact of IFRS 9 on different business strategies and controls framework, highlighting changes in risk appetite, control practices, and business strategies among banks post-implementation.
IFRS 9, business strategies, impact assessment, risk appetite, control framework
false
Operational Efficiency
Financial Services financial-services
Multiple Chart
EY
View slide
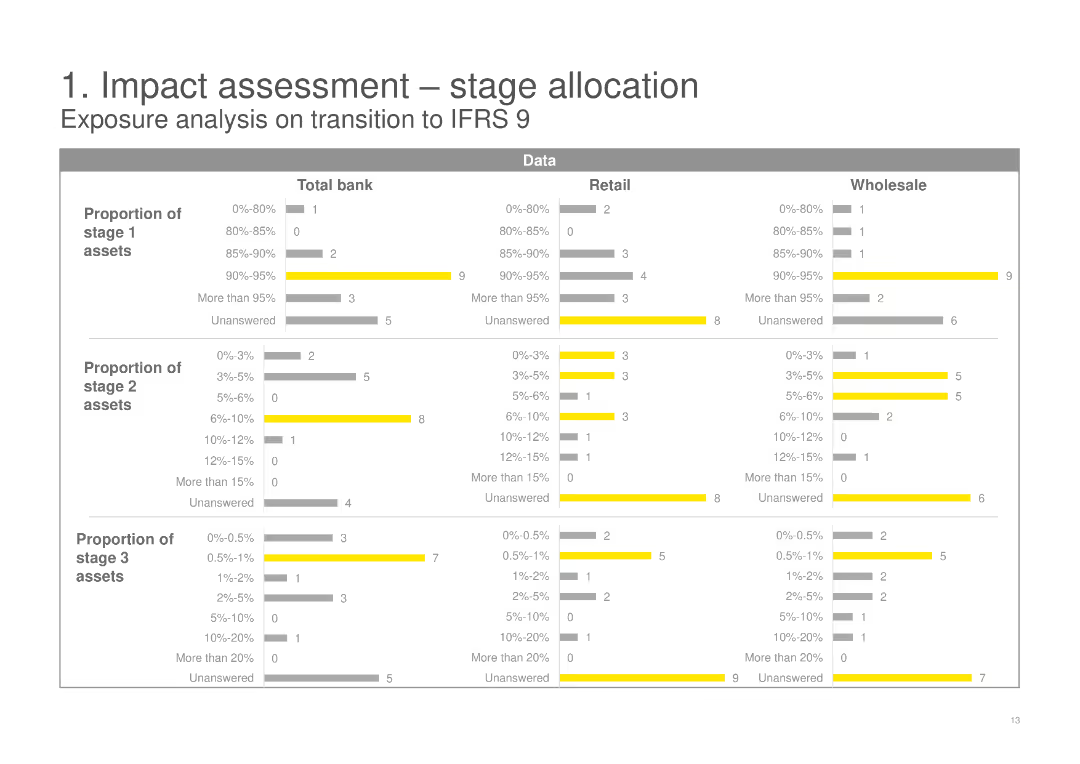
This slide includes three sets of horizontal bar charts showing the proportion of stage 1, 2, and 3 assets for Total bank, Retail, and Wholesale categories. The slide uses yellow and gray colors to differentiate data segments.
Risk Assessment and Management
Financial Services
The slide analyzes the exposure on transition to IFRS 9, detailing the proportions of stage 1, 2, and 3 assets across Total bank, Retail, and Wholesale categories, highlighting the potential impact and risks involved.
IFRS 9, stage allocation, risk assessment, transition, financial services, exposure analysis
false
Risk Assessment and Management
Financial Services financial-services
Multiple Chart
EY
View slide
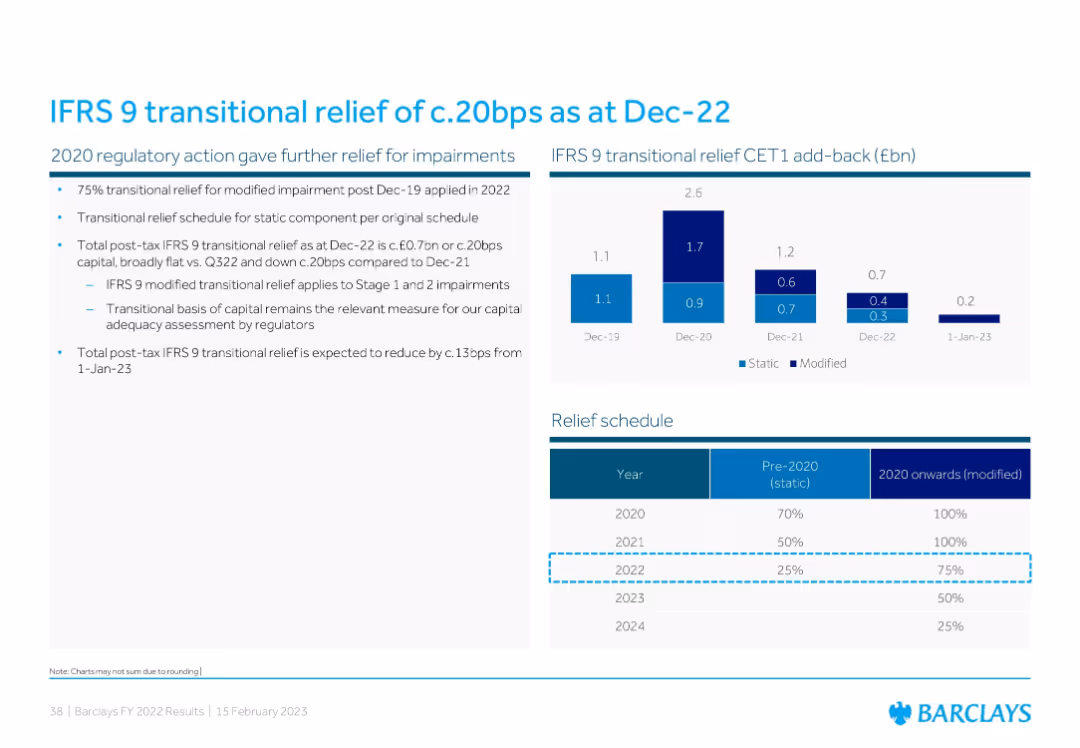
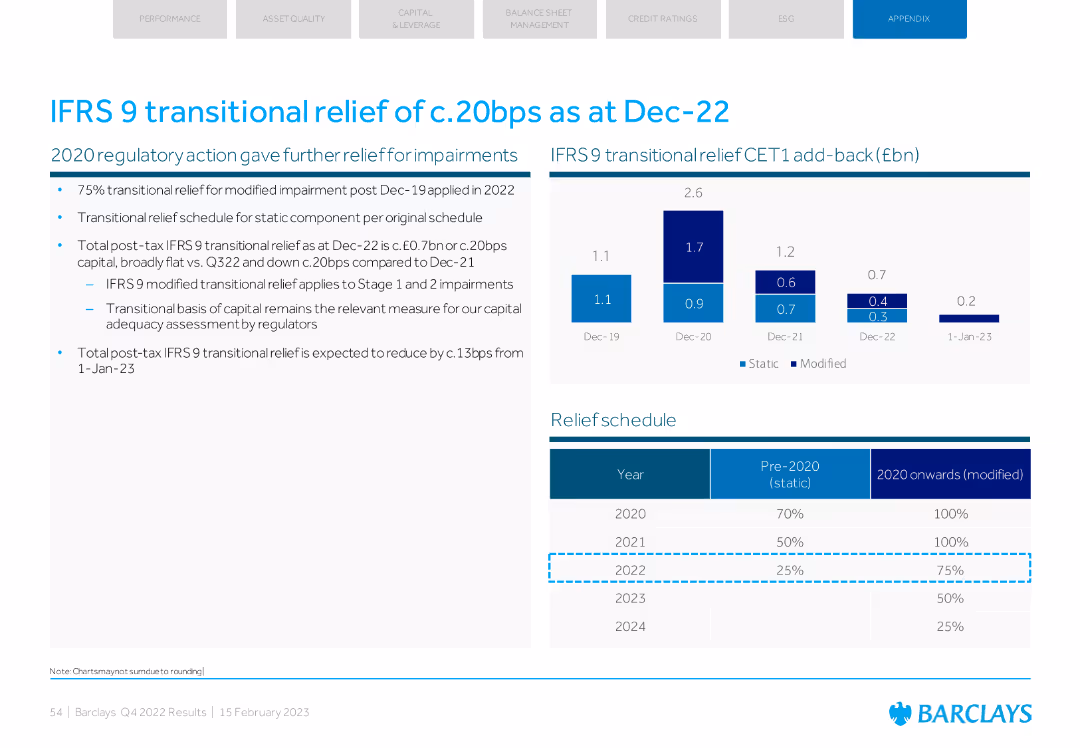
Combination of a bar chart showing IFRS 9 CET1 add-back history and a tabular relief schedule detailing pre-2020/static vs 2020 onward/modified relief percentages.
Regulatory and Compliance
Financial Services
This slide explains IFRS 9 transitional relief and its effect on Barclays’ CET1 capital. It presents CET1 add-back data from 2019–2022 and outlines how transitional relief for impairments will decline over time, affecting future capital adequacy metrics.
IFRS 9, transitional relief, CET1, impairment, regulation
false
Regulatory and Compliance
Financial Services financial-services
Mixed Chart
Barclays
View slide
Column charts showing transitional relief impact and a table with the relief schedule.
Regulatory and Compliance
Financial Services
Details the impact of IFRS 9 transitional relief on Barclays' CET1 capital and outlines the expected schedule for reducing this relief in future years.
IFRS 9, transitional relief, CET1, schedule, capital
false
Regulatory and Compliance
Financial Services financial-services
Mixed Chart
Barclays
View slide
Contains a column chart showing IFRS derivative trading assets and their impacts. Simple layout with key highlights on the side.
Financial Performance
Financial Services
Presents Q1 2023 IFRS derivative trading assets and the effect of netting and collateral on their valuation.
IFRS, derivatives, collateral, netting, financial reporting
false
Financial Performance
Financial Services financial-services
Mixed Chart
Deutsche Bank
View slide
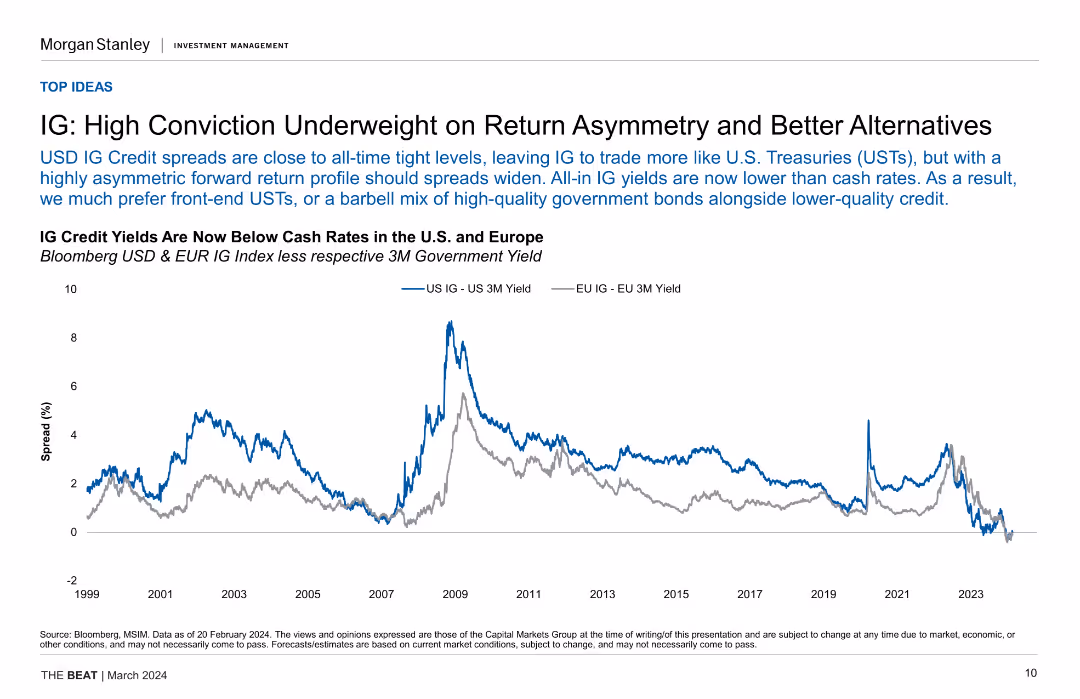
Line chart showing IG credit yields vs. cash rates in the US and Europe over time, highlighting the tight spread and lower IG yields compared to cash rates.
Investment Analysis
Financial Services
The slide discusses the underweight position on IG credit due to tight spreads and lower yields compared to cash rates, suggesting alternatives like front-end USTs.
IG Credit, Yields, Cash Rates, US, Europe, Investment Strategy, Financial Analysis
false
Investment Analysis
Financial Services financial-services
Single Chart
Morgan Stanley
View slide
This slide is divided into two main sections, each featuring a column chart. The left graph shows the funding allocations under the IIJA, and the right graph details the IRA's focus areas like clean energy and deficit reduction.
Regulatory and Compliance
Government & Public Sector
This slide breaks down the financial allocations from the IIJA and IRA, focusing on new energy and climate investments. It is crucial for understanding how government spending is being directed towards sustainable projects.
IIJA, IRA, government funding, climate investment, energy policies
false
Regulatory and Compliance
Government & Public Sector government-and-public-sector
Multiple Chart
BCG
View slide
Dominated by graphical data, this slide displays two main charts: the Eurozone real GDP forecast and the Eurocoin index, represented by bars and dots respectively. Text is limited, providing only sources and brief descriptions. The color palette includes shades of blue, black, and white. The slide design is clear, with each chart labeled and axis demarcated, promoting easy data interpretation.
Market Analysis and Trends
Financial Services
The slide illustrates IMF's economic forecasts and the Eurozone Eurocoin index, comparing them against other projections and historical data. It's typically used in economic or financial presentations to analyze trends, guide investment decisions, or provide economic forecasts.
IMF, GDP forecast, Eurozone, Eurocoin index, economic indicators
false
Market Analysis and Trends
Financial Services financial-services
Multiple Chart
McKinsey
View slide
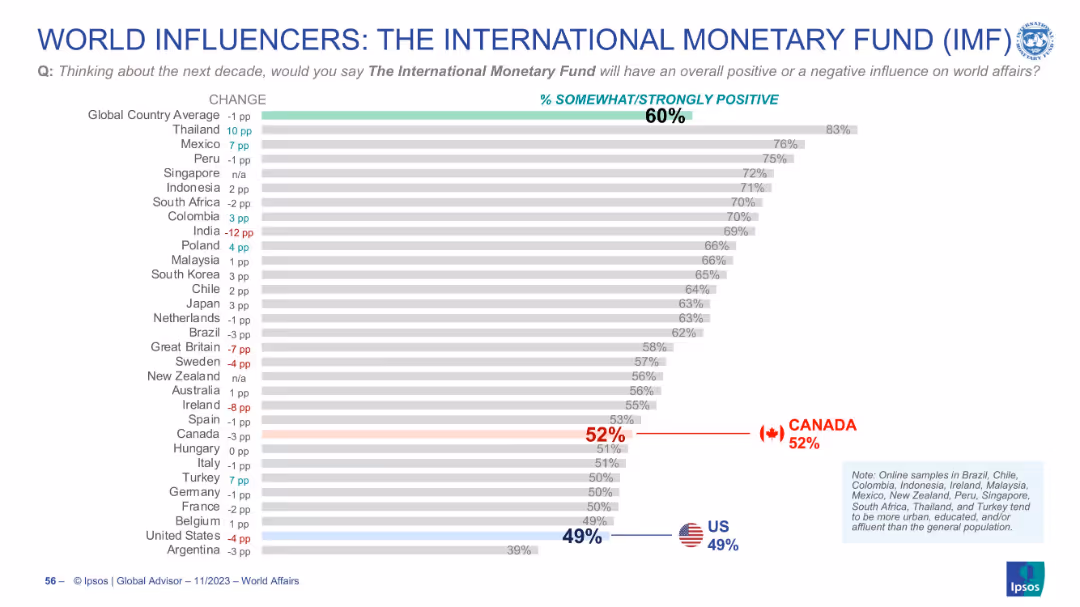
Horizontal bar chart with ranked countries, % values, and change indicators. Global and country averages shown. Flags highlight US and Canada positions.
Market Analysis and Trends
Financial Services
This slide presents global perceptions of the IMF’s influence over the next decade. The majority (60%) view the IMF positively, with strong support in Thailand and Mexico. US and Canadian views are lower than the global average.
IMF, global opinion, perception, influence, trends, country comparison, approval rating, international affairs
false
Market Analysis and Trends
Financial Services financial-services
Single Chart
IPSOS
View slide
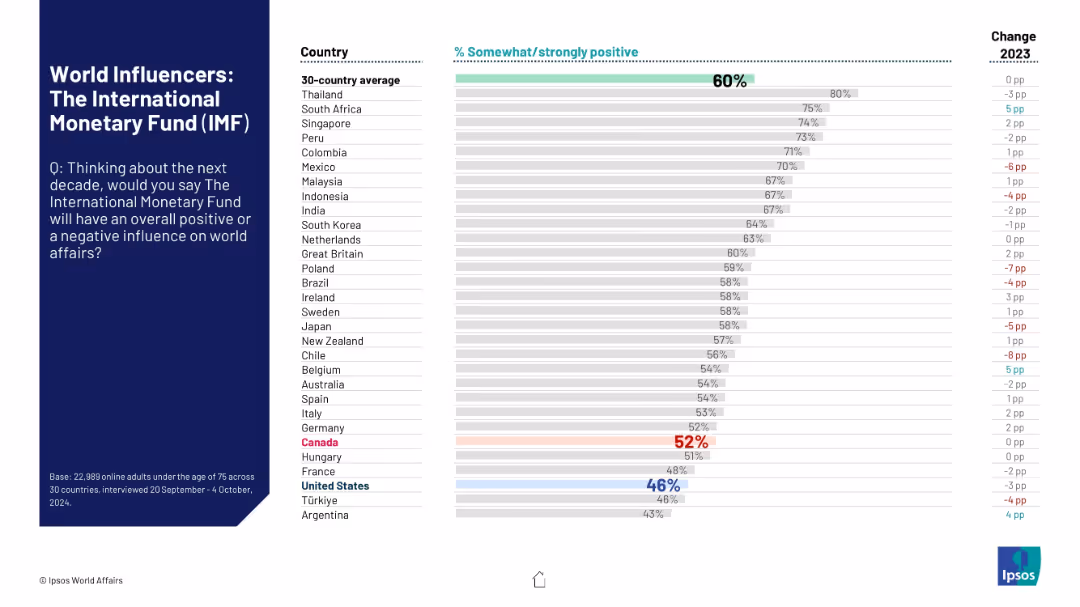
Uses standard layout with question on left and horizontal sentiment comparison by country on the right.
Market Analysis and Trends
Financial Services
The slide highlights how different countries rate the IMF’s potential global impact in the next decade. It visualizes approval ratings and the change from 2023, illustrating mixed global sentiment.
IMF, public sentiment, international finance, perception, influence, Ipsos, country comparison, bar chart, approval rating, 2024 survey
false
Market Analysis and Trends
Financial Services financial-services
Mixed Chart
IPSOS
View slide
The slide contains two sections: one with a line chart on IOC capital expenditures and another with a line chart comparing confirmed COVID-19 infections and crude oil prices. Supporting text provides additional context for each chart.
Market Analysis and Trends
Energy & Utilities
The slide discusses the muted investment in the IOC for 2022 and the resilience of markets amidst COVID-19. It provides a historical view of capital expenditures and the correlation between COVID-19 cases and crude oil prices.
IOC, capital expenditure, COVID-19, crude oil prices, market resilience
false
Market Analysis and Trends
Energy & Utilities energy-and-utilities
Multiple Chart
EY
View slide
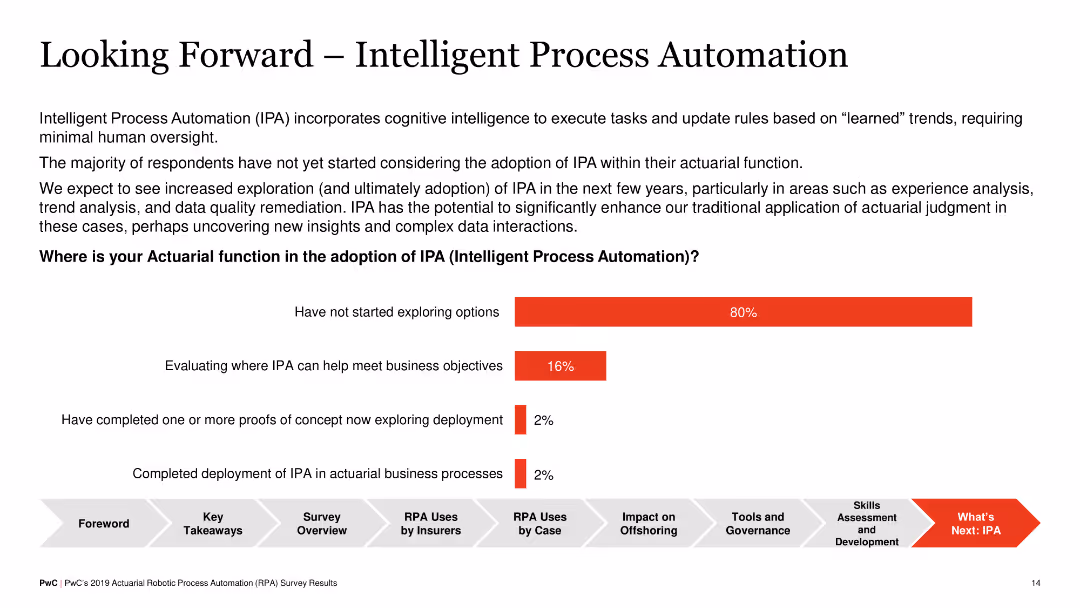
Plain text slide with no visual elements except a horizontal bar chart, outlining stages of adoption of Intelligent Process Automation (IPA) in actuarial functions, such as evaluating options and deploying IPA.
Strategic Planning
Financial Services
The slide discusses future adoption of IPA in actuarial functions, indicating most respondents haven't started exploring IPA options, but some are evaluating its benefits or have started proofs of concept. It emphasizes the potential future impact of IPA.
IPA, Strategic Planning, Actuarial, Adoption, Future
false
Strategic Planning
Financial Services financial-services
Mixed Chart
PwC/Strategy&
View slide
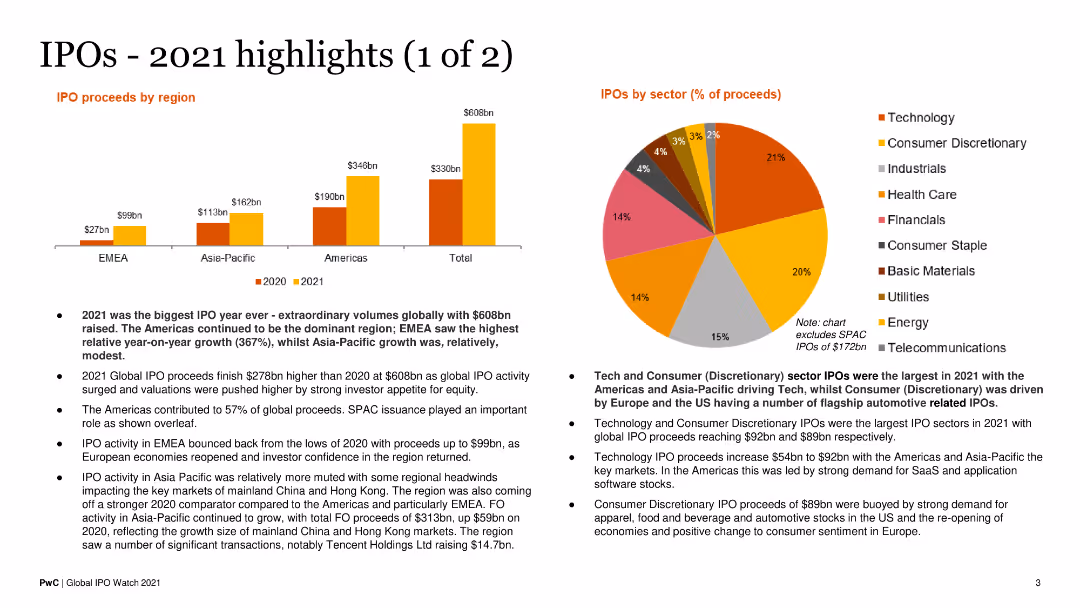
This slide includes a bar chart showing IPO proceeds by region and a pie chart for sector-wise proceeds. Text blocks explain key highlights. The layout is colorful and data-centric.
Financial Performance
Financial Services
It highlights the record-breaking IPO activity in 2021 across different regions and sectors, detailing the financial performance and growth trends.
IPO Proceeds, Regional Analysis, Sector Analysis, 2021 Highlights, Financial Trends
false
Financial Performance
Financial Services financial-services
Multiple Chart
PwC/Strategy&
View slide
The slide contains three column charts comparing IPO volumes, cash on the sidelines, and higher loan paydowns, showing changes from past averages to current levels.
Market Analysis and Trends
Financial Services
The slide indicates that key financial metrics are at cyclical lows, suggesting potential for future upside, with comparisons of IPO volumes, cash reserves, and loan paydowns.
IPO Volumes, Cash Reserves, Loan Paydowns, Financial Metrics, Cyclical Lows, Upside Potential, Column Charts, Analysis
false
Market Analysis and Trends
Financial Services financial-services
Multiple Chart
Morgan Stanley
View slide
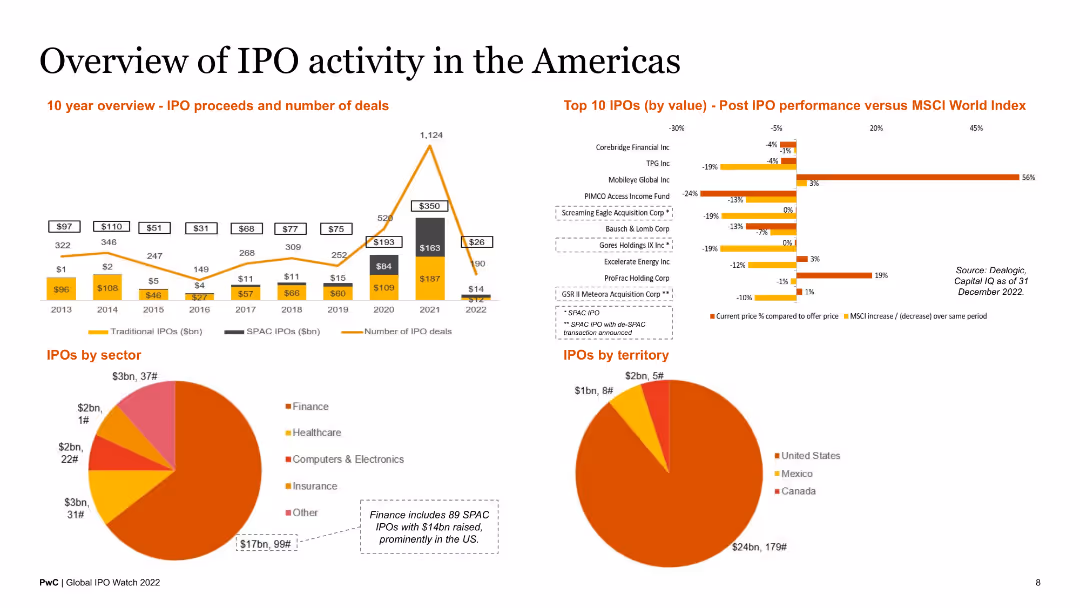
This slide includes a 10-year overview of IPO proceeds and number of deals, a bar chart of top 10 IPOs by value, and pie charts of IPOs by sector and territory. The layout is balanced with a mix of charts and brief text descriptions.
Market Analysis and Trends
Financial Services
The slide provides a comprehensive overview of IPO activity in the Americas, including historical data, top IPOs, and sector and territorial distribution. It is designed for market analysts and investors.
IPO activity, Americas, top IPOs, sector analysis, territorial overview
false
Market Analysis and Trends
Financial Services financial-services
Multiple Chart
PwC/Strategy&
View slide
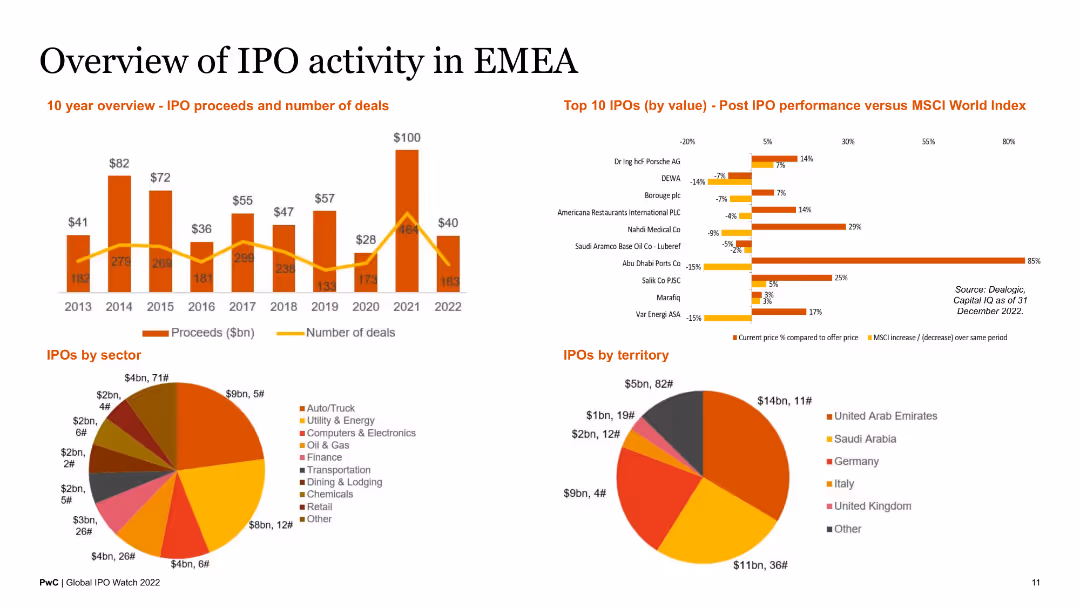
This slide includes a 10-year overview of IPO proceeds and number of deals, a bar chart of top 10 IPOs by value, and pie charts of IPOs by sector and territory. It provides a comprehensive visual and textual analysis.
Market Analysis and Trends
Financial Services
The slide provides an extensive overview of IPO activity in the EMEA region, detailing historical trends, top IPOs, and sectoral and territorial distributions. It is useful for regional market analysts and investors.
IPO activity, EMEA, top IPOs, sector analysis, territorial overview
false
Market Analysis and Trends
Financial Services financial-services
Multiple Chart
PwC/Strategy&
View slide
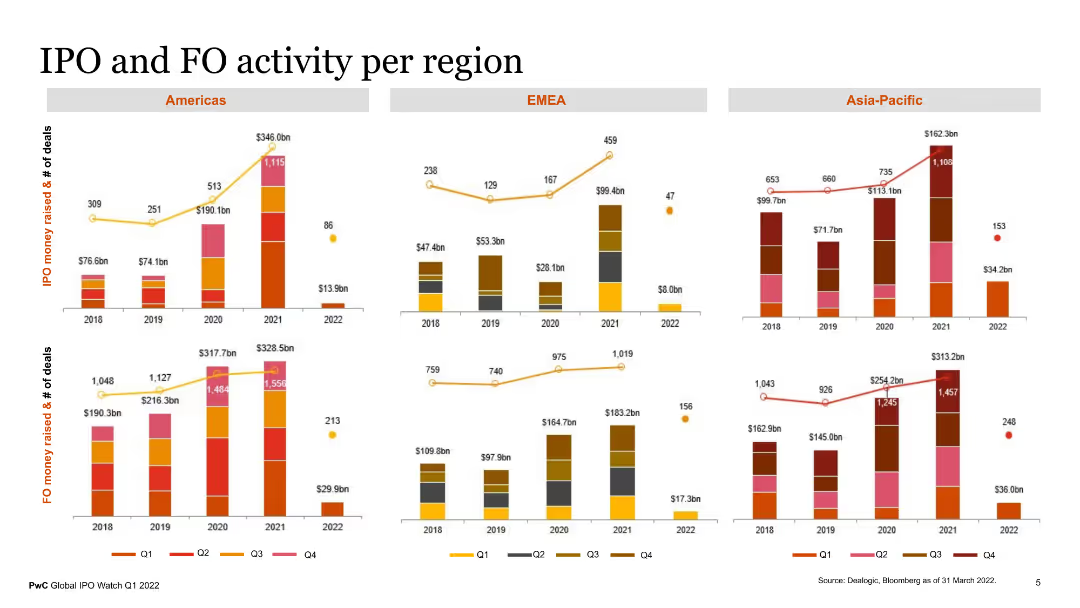
The slide features multiple column charts showing IPO and FO (Follow-on Offering) activity per region (Americas, EMEA, Asia-Pacific). The charts display the number of deals and money raised over multiple years, with different colors representing each quarter. The visual elements are complemented by text descriptions explaining regional performance.
Market Analysis and Trends
Financial Services
This slide presents a comprehensive analysis of IPO and FO activity across different regions, highlighting the number of deals and capital raised over the years. It provides valuable insights into regional market activities and trends, useful for financial market analysts and investors.
IPO activity, FO activity, regional analysis, financial trends, deals
false
Market Analysis and Trends
Financial Services financial-services
Multiple Chart
PwC/Strategy&
View slide
Light background with yellow title banner, text-heavy content, and a pie chart and bar chart showing survey results and IPO returns.
Strategic Planning
Financial Services
This slide indicates that CEOs are optimistic about pursuing IPOs in 2024, with a survey showing a significant interest in IPOs, mergers, and acquisitions. The slide includes a pie chart on transaction ambitions and a bar chart comparing YTD 2023 IPO returns vs. benchmark index returns.
IPO appetite, CEOs, 2024, strategic planning, survey results
false
Strategic Planning
Financial Services financial-services
Multiple Chart
EY
View slide
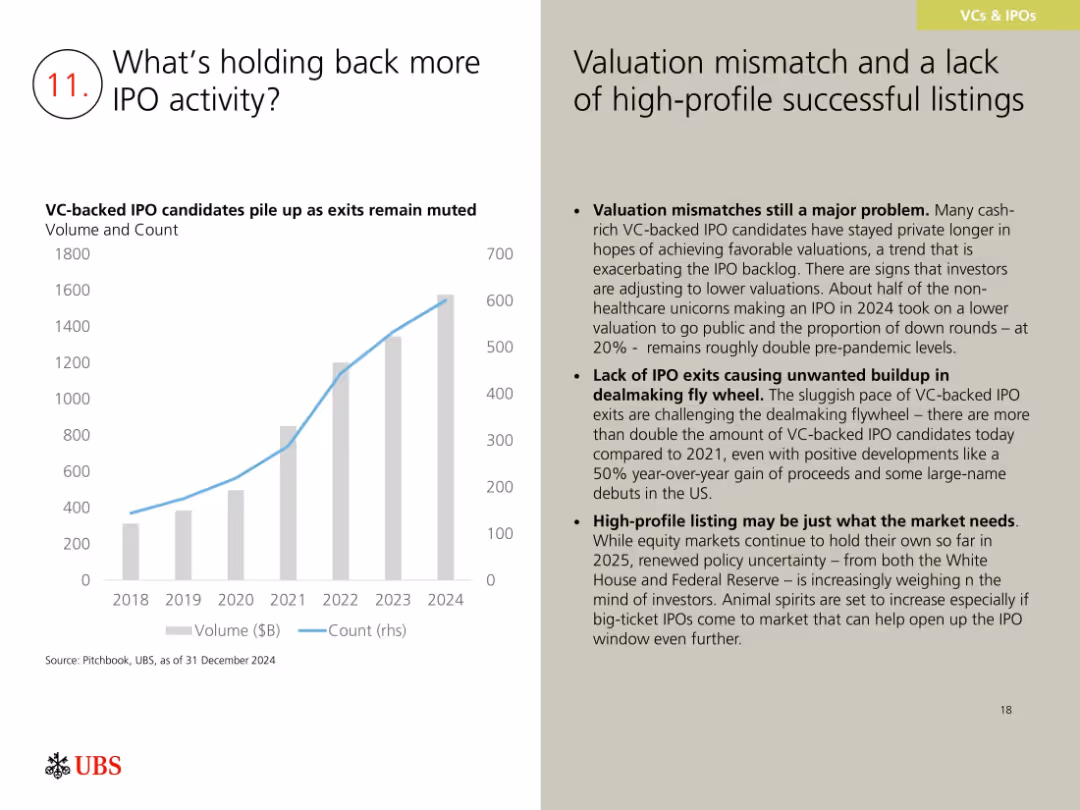
Bar and line chart showing VC-backed IPO candidate volume and count; right side has text on challenges and implications.
Market Analysis and Trends
Financial Services
This slide discusses reasons for a sluggish IPO market, citing valuation mismatches, lack of high-profile listings, and increased VC-backed company volume. While exits are slow, positive 2024 trends and investor anticipation may help re-open the IPO window in 2025.
IPO backlog, valuation mismatch, VC exits, dealmaking, 2024 outlook
false
Market Analysis and Trends
Financial Services financial-services
Mixed Chart
UBS
View slide
Light background with yellow title banner, text-heavy content, and a pie chart and line chart showing IPO pipeline and withdrawal trends.
Market Analysis and Trends
Financial Services
The slide highlights the increasing IPO backlogs and deal withdrawals, particularly in China. It includes a pie chart showing the IPO pipeline breakdown by sector and a line chart tracking postponed and withdrawn IPOs as a percentage of total IPO volume from 2014 to 2023.
IPO backlogs, growth sectors, China, 2023, financial trends
false
Market Analysis and Trends
Financial Services financial-services
Multiple Chart
EY
Previous
Loading...
Hold On!
We are searching in our database
If nothing, comes up, please try different filters!
Column Chart
Heatmap
Chevron
Org Chart
Infographic
Callouts
Timeline
List
Graphic
Picture
Process Flow
Diagram
Paragraph
Map
Table
Framework
Subtitle
Takeaway Box
Icon
Other Chart
Radar Chart
Waterfall Chart
Mekko Chart
Pie Chart
Scatter Plot
Line Chart
Bar chart
Bullet points
Create a FREE account to continue browsing
Receive Instant Access to 1,000+ slides from companies like McKinsey, Google, and Goldman Sachs
First Name
Last Name
Email
Password
I agree to all
Terms & Privacy Policy
Thank you! Your submission has been received!
Oops! Something went wrong while submitting the form.
Have an account?
Sign in
Upgrade to PRO to Save slides
Advanced Search and Filters
Access to 15,000+ slides
Access to Category Pages
Save/Bookmark Slides
PowerPoint Template Library
Pick a Plan
MONTHLY
$12/month
Billed every month, Cancel anytime.
YEARLY
$9/year
Billed $108 annually, Cancel anytime.
Checkout for $12/month
Checkout for $108/yr
Secured by Stripe | AES-256 bit encryption