My Account
My Slides
Search by Category
Templates
Leave Feedback
Login
Logout
Get Started
Browse all Slides
Browse all Slides
Create a FREE Account
Instant access to 1,000+ real slides from top companies like McKinsey, BCG, Goldman Sachs, Google and many more!
First Name
Last Name
Email
Password
I agree to all
Terms & Privacy Policy
Thank you! Your submission has been received!
Oops! Something went wrong while submitting the form.
Have an account?
Sign in
📢 Ready to start building slides? Check out our new template library
VIEW TEMPLATES
Welcome,
Welcome
PRO
Show Featured Only
Checkbox 8
Companies
Mckinsey
Bain
BCG
EY
Deloitte
Accenture
PwC/Strategy&
JP Morgan
Goldman Sachs
Morgan Stanley
Citigroup
Deutsche Bank
Barclays
LEK
KPMG
Kearney
Oliver Wyman
Booz Allen Hamilton
Gartner
IPSOS
Nielsen
Slide type
Text Only
Linear Flow
Vertical Flow
Single Chart
Header Horizontal
Mixed Chart
Header Vertical
Pillar
Multiple Chart
Graphic
Agenda
Title
Table
Framework
Industry
Technology & Software
Artificial Intelligence
Financial Services
Retail & E-commerce
Consumer Goods
Industrial & Manufacturing
Transportation & Logistics
Telecommunications
Real Estate & Construction
Hospitality & Tourism
Professional Services
Education & Training
Media & Entertainment
Agriculture & Food Production
Healthcare & Pharmaceuticals
Environmental Services & Sustainability
Government & Public Sector
Use Case
Mergers and Acquisitions
Performance Metrics and KPIs
Client Case Studies
Competitive Landscape
Corporate Finance and Valuation
Product and Service Analysis
Customer and Market Segmentation
Organizational Structure and Change
Industry Overview
Regulatory and Compliance
Risk Assessment and Management
Investment Analysis
Organizational Structure and Change
Human Resources and Talent Management
Financial Performance
Market Analysis and Trends
Sales and Business Development
Human Resources and Talent Management
Clear all
Thank you! Your submission has been received!
Oops! Something went wrong while submitting the form.
Tag
View slide
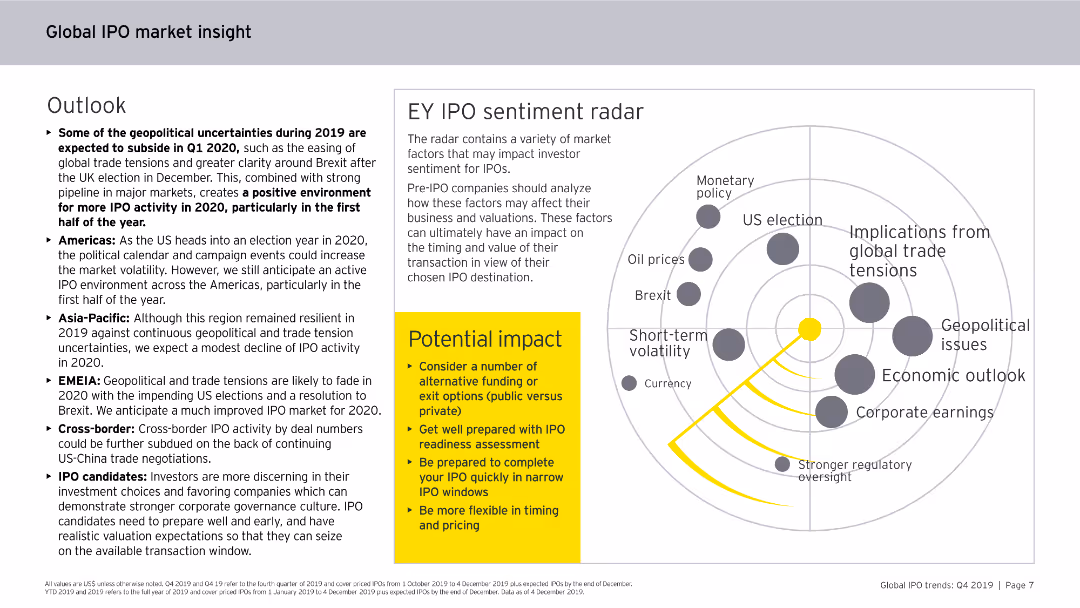
Features a circular diagram with segments highlighting various factors affecting IPO candidates.
Strategic Planning
Financial Services
The slide identifies key factors like market volatility, regulatory changes, and geopolitical tensions that IPO candidates should consider.
IPO candidates, market volatility, regulatory changes, geopolitical tensions, strategic planning
false
Strategic Planning
Financial Services financial-services
Diagram
EY
View slide
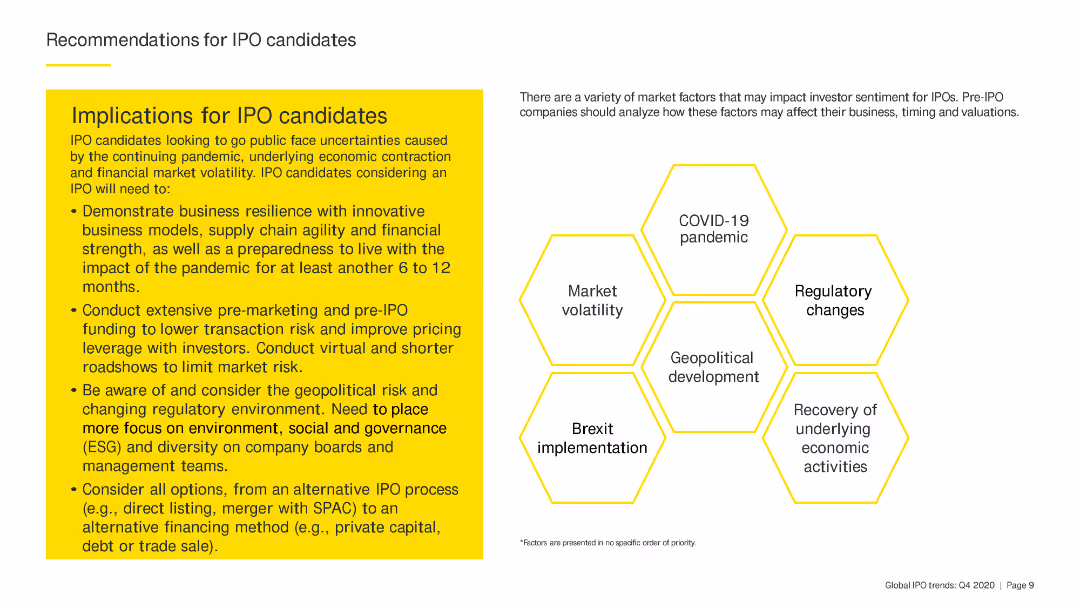
The slide has a yellow text box with bullet points providing recommendations for IPO candidates. There are hexagon shapes with key factors such as COVID-19 pandemic and regulatory changes.
Strategic Planning
Financial Services
The slide gives detailed recommendations for IPO candidates, emphasizing the need for business resilience, pre-marketing efforts, and consideration of geopolitical and regulatory risks.
IPO candidates, resilience, pre-marketing, geopolitical, regulatory
false
Strategic Planning
Financial Services financial-services
Header Horizontal
EY
View slide
Diagram outlining the roles and relationships between different stakeholders in an IPO, including issuers, investment banks, and advisors. The design is structured and uses icons for clarity.
Organizational Structure and Change
Financial Services
This slide elaborates on the various parties involved in an IPO, detailing their responsibilities and interactions to ensure a smooth public offering process.
IPO execution, investment banks, stakeholders, organizational roles, financial services, public offering, strategic planning
false
Organizational Structure and Change
Financial Services financial-services
Diagram
PwC/Strategy&
View slide
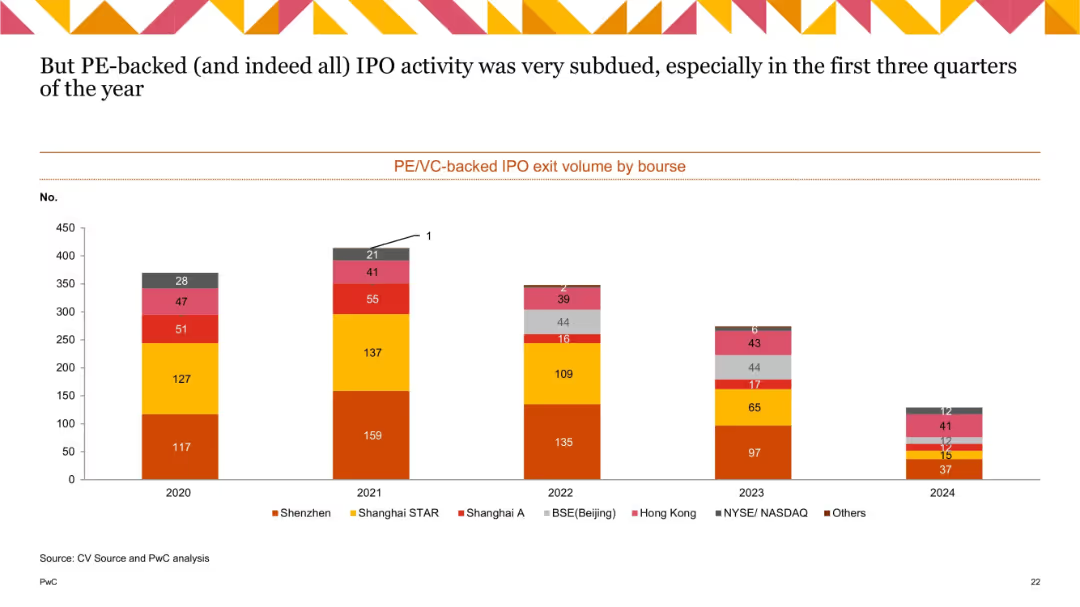
Stacked bar chart showing IPO exit volumes by bourse (2020–2024), categorized by regions like Shenzhen, Hong Kong, NASDAQ, etc.
Mergers and Acquisitions
Financial Services
This slide presents the volume of IPO exits by stock exchange for PE/VC-backed companies. It shows a broad decline over time, particularly notable in 2023–2024, with Shenzhen and Shanghai STAR remaining relatively strong. The subdued IPO activity suggests ongoing market caution and valuation concerns.
IPO exits, PE-backed IPO, VC-backed IPO, bourse, Shenzhen, Hong Kong, NASDAQ, trend
false
Mergers and Acquisitions
Financial Services financial-services
Single Chart
PwC/Strategy&
View slide
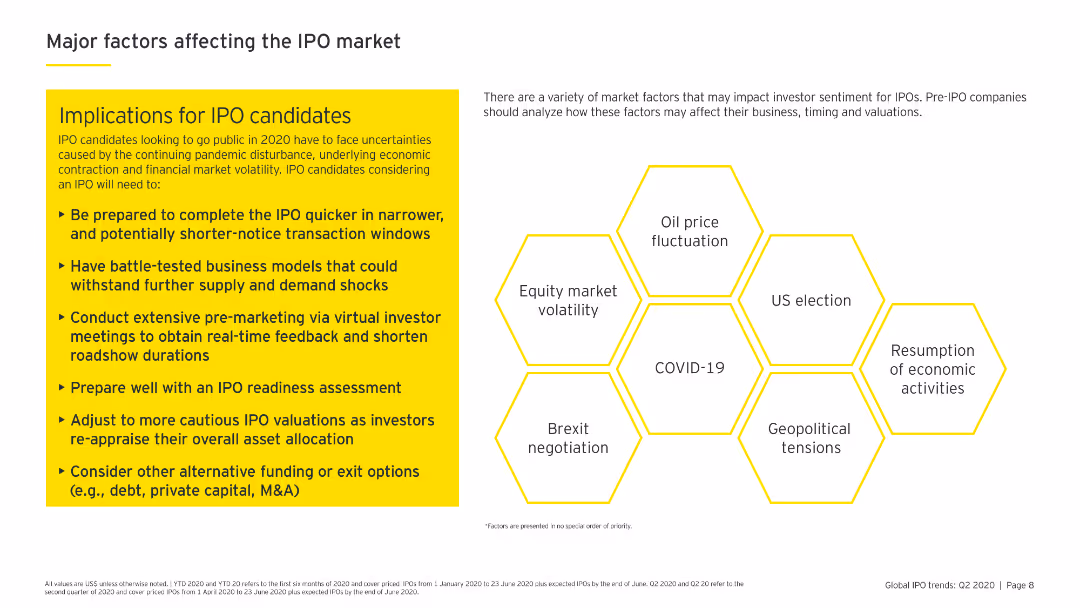
This slide features a text box with a list of implications for IPO candidates, accompanied by a hexagonal diagram highlighting factors affecting the IPO market.
Market Analysis and Trends
Financial Services
Discusses the various market factors impacting IPO candidates, with practical advice on readiness and market conditions, particularly in the context of COVID-19.
IPO factors, market impact, COVID-19, readiness, financial services
false
Market Analysis and Trends
Financial Services financial-services
Header Horizontal
EY
View slide
Features a combination of column chart, scatter plot chart and a pie chart depicting the relationship between IPO sizes and bank fees in Germany, including individual data points and trends. Text explanations supplement the graphs.
Financial Performance
Financial Services
Analyzes the fee structures associated with German IPOs, providing insights into base fees, incentive fees, and variations based on IPO size, along with strategic implications for financial planning.
IPO fees, financial analysis, German IPOs, fee structure, bank fees, incentive fees, market analysis, regulatory compliance
false
Financial Performance
Financial Services financial-services
Multiple Chart
PwC/Strategy&
View slide
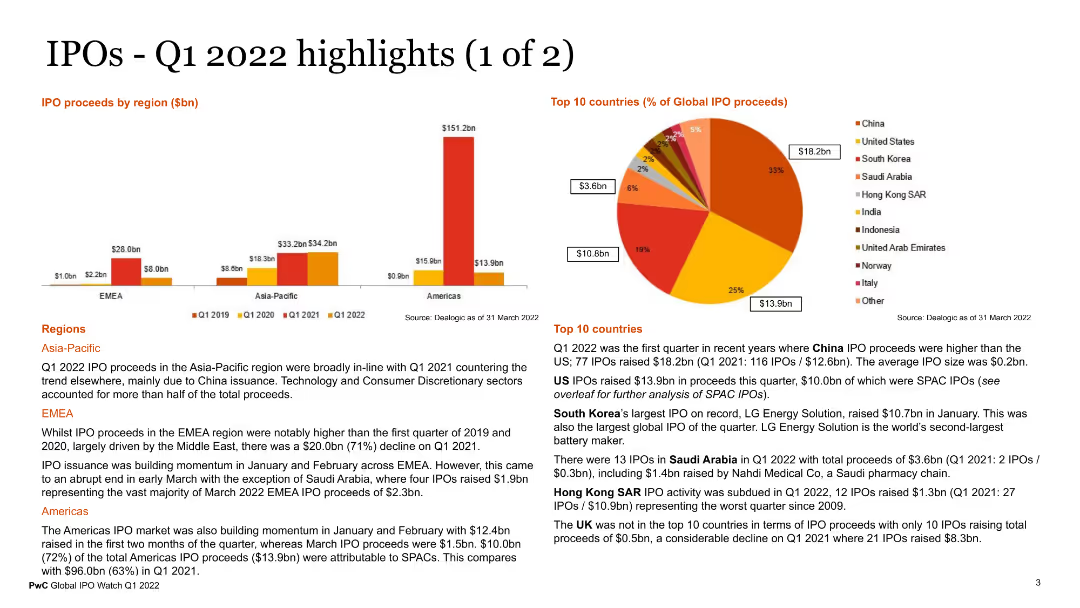
The slide features multiple visual elements, including a column chart for IPO proceeds by region, a pie chart for the top 10 countries by global IPO proceeds, and text sections detailing regional IPO activities in Asia-Pacific, EMEA, and the Americas. The charts use various colors to represent different data points.
Market Analysis and Trends
Financial Services
This slide presents key highlights of IPO activities in Q1 2022, with detailed regional analysis and top countries contributing to IPO proceeds. It provides a clear picture of global IPO trends and regional performance, useful for investors and market analysts.
IPO highlights, Q1 2022, regional analysis, global IPOs, financial trends
false
Market Analysis and Trends
Financial Services financial-services
Multiple Chart
PwC/Strategy&
View slide
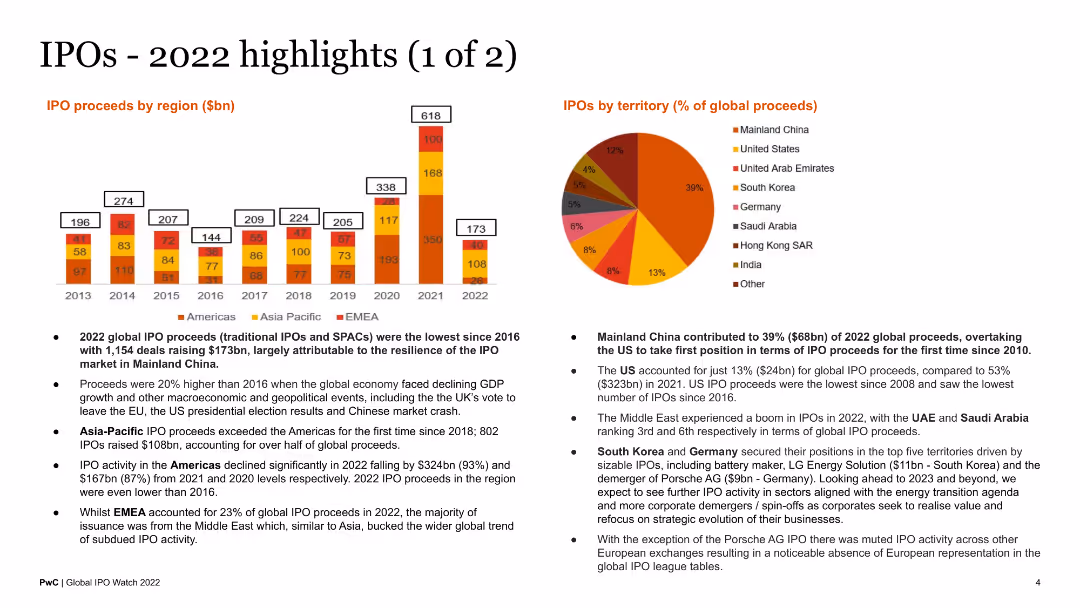
The slide showcases a column chart of IPO proceeds by region from 2013 to 2022 and a pie chart of IPO proceeds by territory for 2022. It is visually dense with a mix of charts and bullet points summarizing the highlights.
Market Analysis and Trends
Financial Services
This slide highlights key data points and trends in global IPO activity for 2022, breaking down proceeds by region and territory. It serves as an informative summary for investors and financial professionals.
IPO highlights, global proceeds, 2022, regional analysis, territory
false
Market Analysis and Trends
Financial Services financial-services
Multiple Chart
PwC/Strategy&
View slide
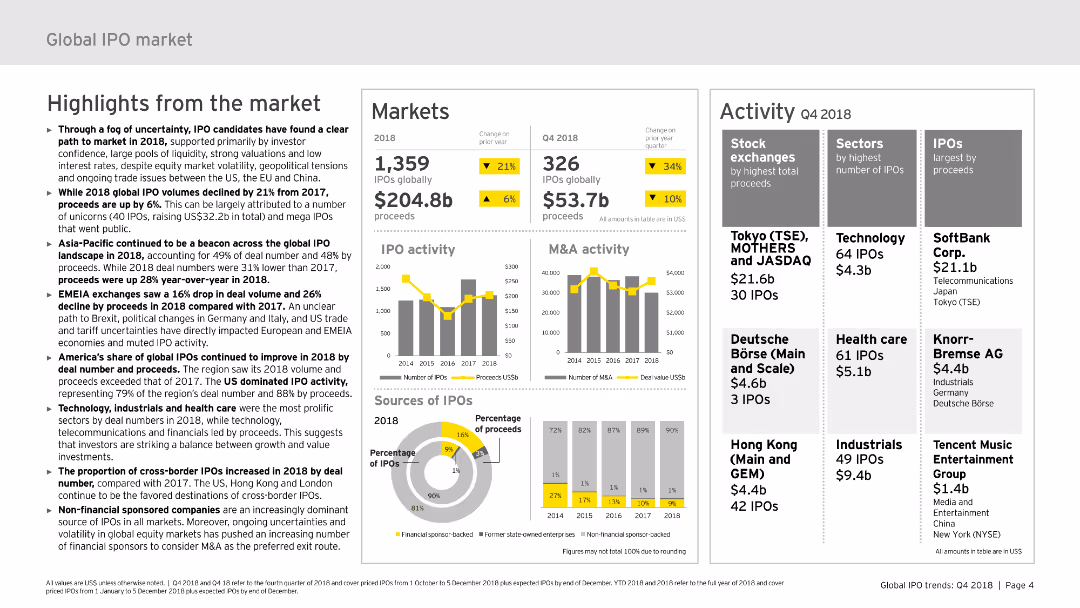
The slide includes text summaries, column charts, and pie charts presenting highlights from the global IPO market, focusing on trends and key metrics for 2018 and Q4 2018.
Market Analysis and Trends
Financial Services
This slide provides an overview of the global IPO market in 2018, discussing key trends, regional performances, and notable IPO activities across various sectors.
IPO market, 2018, trends, highlights, key metrics
false
Market Analysis and Trends
Financial Services financial-services
Multiple Chart
EY
View slide
Light background with yellow title banner, text-heavy content, and a bubble chart comparing 2023 IPO markets with the 5-year average.
Market Analysis and Trends
Financial Services
This slide examines the rise of new IPO markets like Indonesia, Malaysia, and Turkey, while traditional markets like Hong Kong face challenges. It includes a bubble chart visualizing IPO market performance relative to the 5-year average.
IPO markets, high-growth, traditional markets, performance, 2023
false
Market Analysis and Trends
Financial Services financial-services
Mixed Chart
EY
View slide
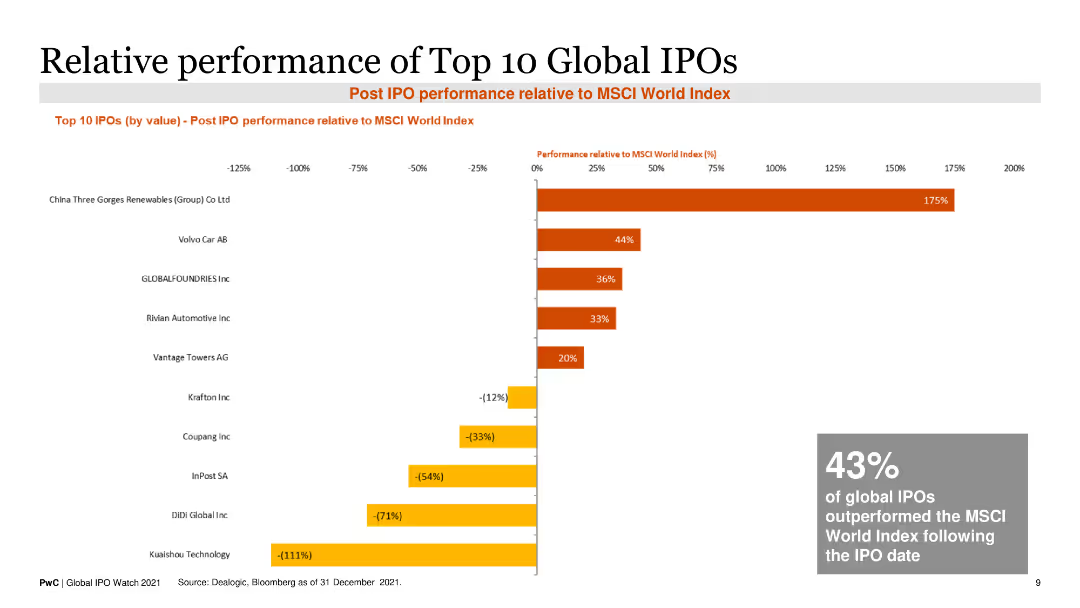
This slide includes a horizontal bar chart displaying the post-IPO performance of the top 10 global IPOs relative to the MSCI World Index as of December 2021.
Market Analysis and Trends
Financial Services
It highlights the performance of major IPOs, showing the percentage change in value compared to a global market index, useful for investment analysis.
IPO performance, MSCI World Index, investment analysis, top IPOs, post-IPO performance
false
Market Analysis and Trends
Financial Services financial-services
Single Chart
PwC/Strategy&
View slide
Light background with yellow title banner, text-heavy content, and two line charts comparing IPO activity with major indices.
Financial Performance
Financial Services
This slide discusses the underperformance of IPOs in 2023 despite strong equity markets, highlighting various factors such as monetary policies, investor sentiment, and after-market performance. Line charts compare US IPO activity vs. S&P 500 and European IPO activity vs. STOXX Europe 600.
IPO performance, equity markets, 2023, financial trends, monetary policies
false
Financial Performance
Financial Services financial-services
Multiple Chart
EY
View slide
This slide includes a detailed process diagram of the IPO stages, with icons and text explaining each phase from pre-kickoff to post-IPO. The layout is clear and structured, enhancing comprehension.
Strategic Planning
Financial Services
Provides a comprehensive overview of the IPO process, detailing each phase including preparation, execution, and post-IPO activities, emphasizing transparency and structural needs of the company.
IPO process, public offering, preparation, execution, post-IPO, company structure, investment, financial planning
false
Strategic Planning
Financial Services financial-services
Linear Flow
PwC/Strategy&
View slide
The slide features a mix of text boxes and images. It outlines the steps and modules of the EY IPO readiness assessment program. The layout is structured with numbered sections and highlighted key points.
Strategic Planning
Professional Services
This slide explains the EY IPO readiness assessment, detailing the steps and modules involved in preparing companies for an IPO. It includes strategic planning, structure, taxes, financial preparation, and more, providing a comprehensive guide for businesses looking to go public.
IPO readiness, professional services, strategic planning, assessment program, preparation steps, EY, business planning, public listing
false
Strategic Planning
Professional Services professional-services
Header Vertical
EY
View slide
Light background with yellow title banner, text-heavy content, and a column chart comparing IPO returns vs. offer prices by market cap.
Financial Performance
Financial Services
The slide analyzes how large-cap IPOs have trailed smaller deals in returns within a volatile environment. It includes a column chart showing weighted average IPO returns vs. offer prices by market cap for 2022 and 2023.
IPO returns, large-cap, market volatility, 2023, financial analysis
false
Financial Performance
Financial Services financial-services
Multiple Chart
EY
View slide
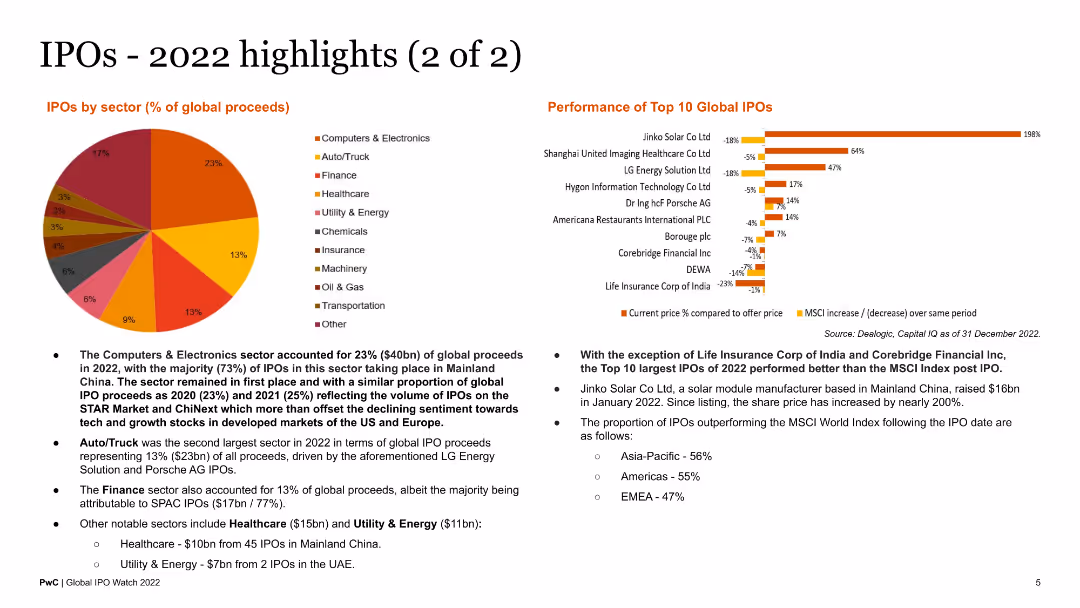
This slide includes a pie chart showing IPOs by sector and a bar chart of the performance of the top 10 global IPOs. Text blocks provide additional context and analysis of the data presented.
Market Analysis and Trends
Financial Services
The slide provides an analysis of IPO activity by sector and evaluates the performance of the top IPOs globally in 2022. It is useful for financial analysts reviewing sector-specific IPO performance and investment opportunities.
IPO sectors, top IPOs, global performance, 2022 analysis
false
Market Analysis and Trends
Financial Services financial-services
Multiple Chart
PwC/Strategy&
View slide
Features a radar chart, bullet points, and a callout box. The slide is visually engaging, focusing on IPO sentiment and potential impacts on the market.
Market Analysis and Trends
Financial Services
Examines the geopolitical uncertainties and their effects on IPO activities, with a detailed sentiment analysis radar chart and strategic insights for IPO candidates.
IPO sentiment, geopolitical, market impact, 2020, trends
false
Market Analysis and Trends
Financial Services financial-services
Boxed
EY
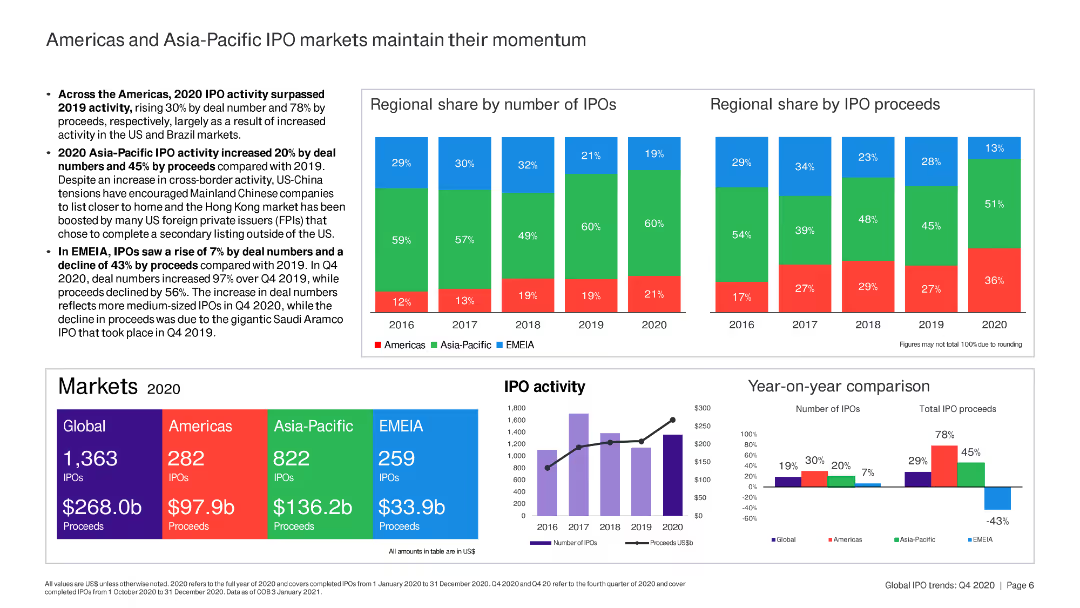
View slide
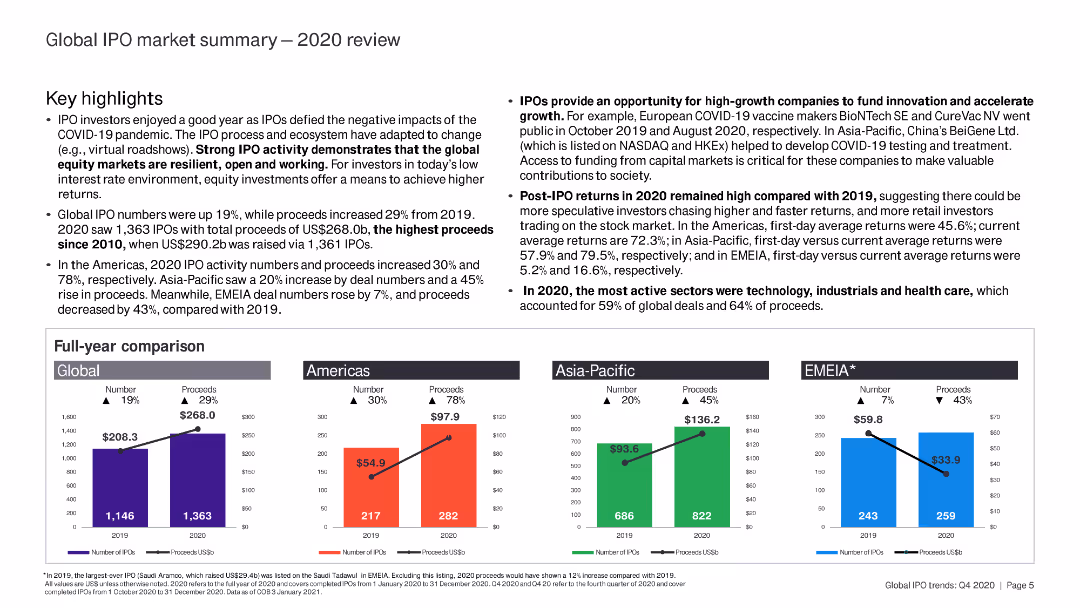
The slide contains detailed text with key highlights and a full-year comparison of IPO activities. It includes small bar charts for regional comparisons.
Market Analysis and Trends
Financial Services
This slide reviews the global IPO market in 2020, summarizing annual performance, key highlights, and regional breakdowns.
IPO, 2020 review, global market, key highlights, annual performance
false
Market Analysis and Trends
Financial Services financial-services
Multiple Chart
EY
View slide
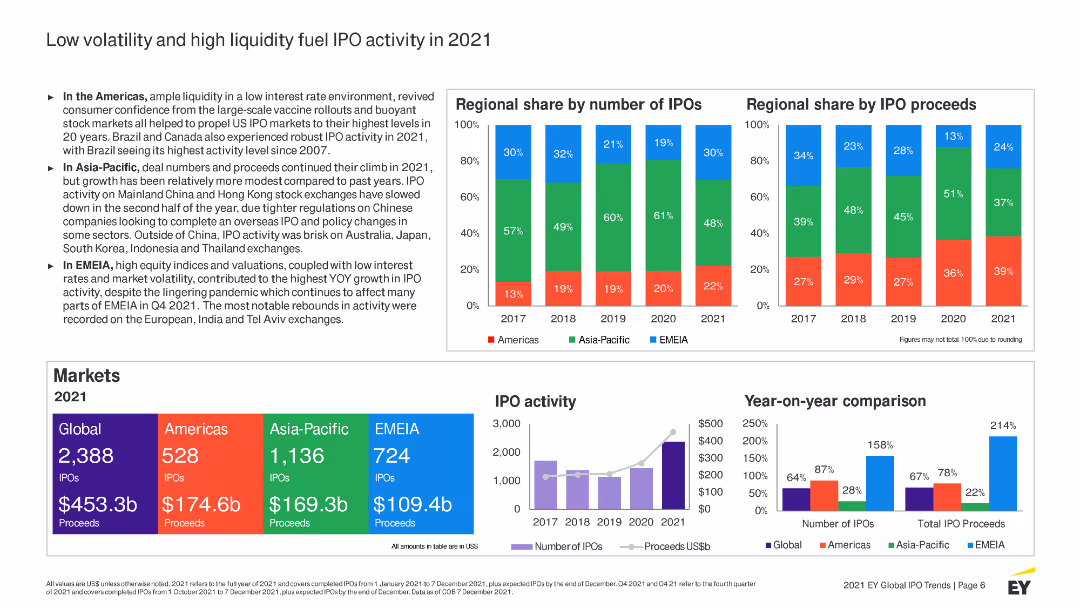
The slide features bar charts showing regional share of IPOs and proceeds from 2017 to 2021, along with a line chart of IPO activity over time. Text sections discuss factors driving IPO activity in 2021.
Market Analysis and Trends
Financial Services
Discusses the impact of low volatility and high liquidity on IPO activity in 2021. Highlights regional differences and key drivers behind the surge in IPOs, including market conditions and investor sentiment.
IPO, 2021, market conditions, volatility, liquidity, regional analysis, financial services
false
Market Analysis and Trends
Financial Services financial-services
Multiple Chart
EY
View slide
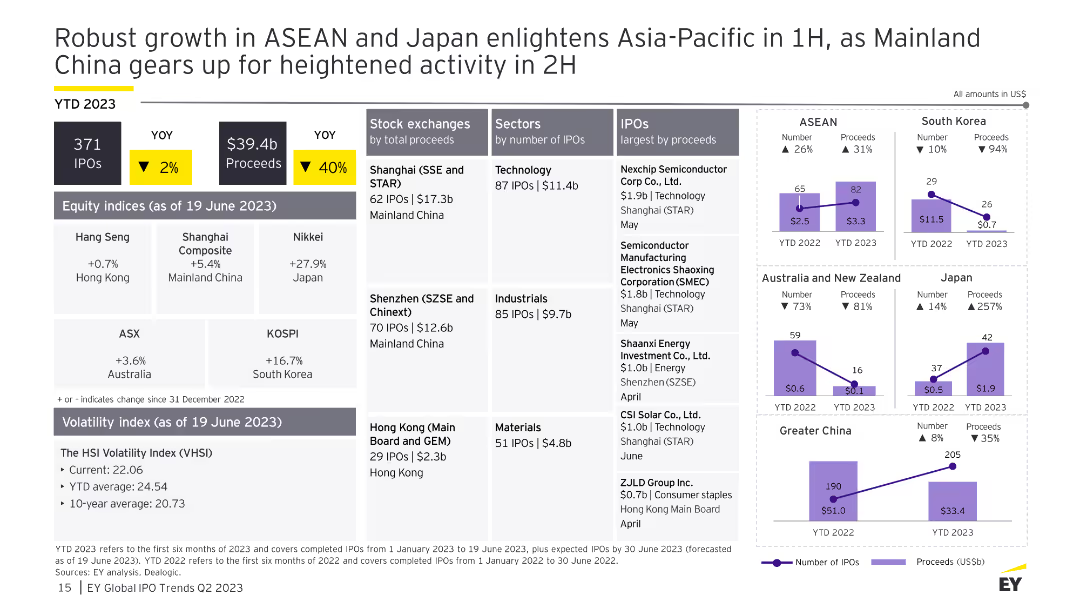
The slide includes multiple charts: a column chart for IPO performance by region, a table for stock exchanges and sectors, and line charts for IPO activity in specific regions.
Market Analysis and Trends
Financial Services
This slide analyzes IPO activities in ASEAN, Japan, and other Asia-Pacific regions, providing detailed statistics on exchanges, sectors, volatility indices, and largest IPOs by proceeds.
IPO, ASEAN, Japan, Asia-Pacific, growth
false
Market Analysis and Trends
Financial Services financial-services
Multiple Chart
EY
View slide
The slide combines text and bar charts to compare IPO market activities and proceeds in the Americas and Asia-Pacific regions.
Market Analysis and Trends
Financial Services
This slide analyzes the momentum of IPO markets in the Americas and Asia-Pacific, comparing deal numbers and proceeds over time.
IPO, Americas, Asia-Pacific, market momentum, deal numbers, proceeds
false
Market Analysis and Trends
Financial Services financial-services
Multiple Chart
EY
View slide
A detailed slide with charts showing the number and proceeds of IPOs in the Americas, along with sector and exchange breakdowns. The visual complexity is advanced, with multiple data points and comparisons.
Market Analysis and Trends
Financial Services
The slide discusses the resurgence of IPOs in the Americas, driven by bullish equities sentiment. It provides detailed data on the number of IPOs, proceeds, and sector-specific performances, highlighting the strong market activity and the role of major stock exchanges in the US.
IPO, Americas, Resurgence, Market, Equities, Sentiment
false
Market Analysis and Trends
Financial Services financial-services
Multiple Chart
EY
View slide
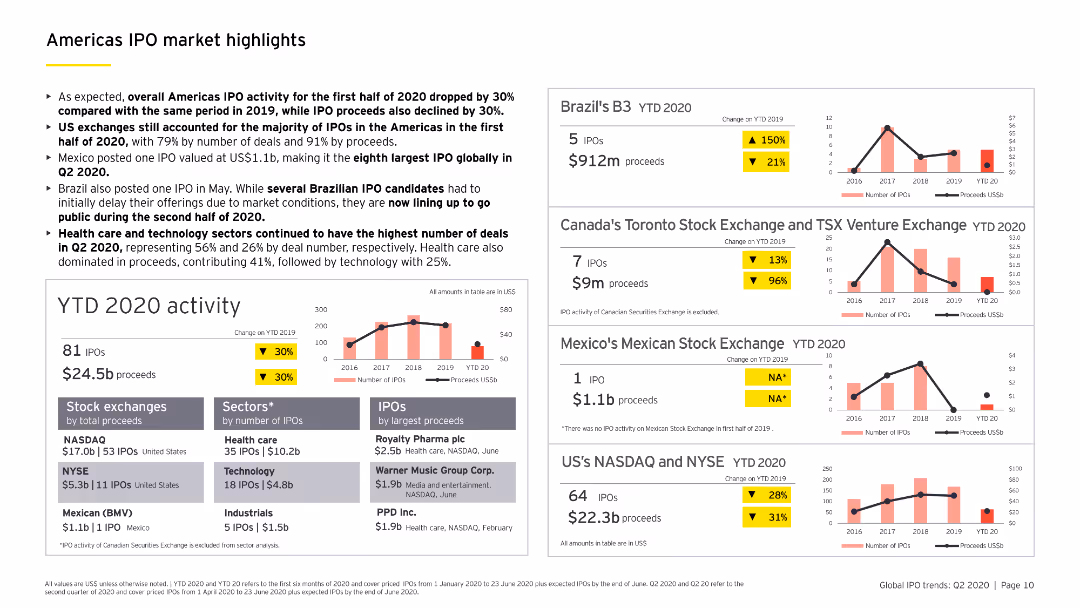
Contains multiple column charts and a bar chart detailing YTD 2020 IPO activity in the Americas, including sector-specific analysis and major stock exchanges.
Market Analysis and Trends
Financial Services
Highlights key IPO market trends in the Americas for the first half of 2020, including a breakdown by sectors, stock exchanges, and notable IPOs.
IPO, Americas, YTD 2020, sector analysis, stock exchanges
false
Market Analysis and Trends
Financial Services financial-services
Multiple Chart
EY
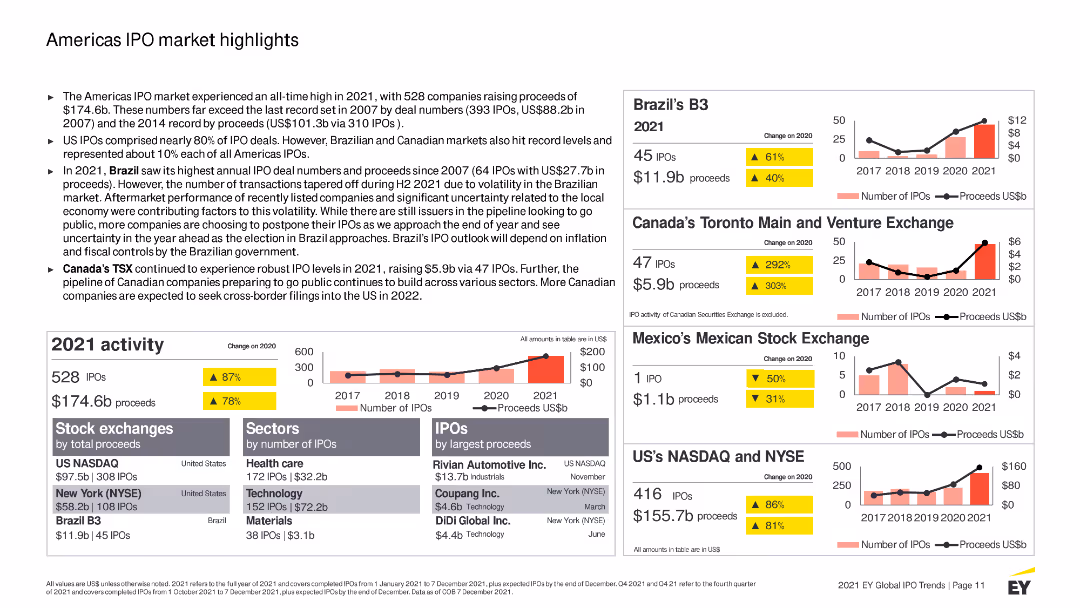
View slide
The slide includes a mix of text, column charts, and data tables. It uses color coding to differentiate data across different regions and time periods.
Market Analysis and Trends
Financial Services
Summarizes the 2021 IPO market performance in the Americas, highlighting key statistics and trends across major stock exchanges, sectors, and IPO activity levels.
IPO, Americas, financial performance, trends, sectors, stock exchanges, proceeds, 2021 activity, market highlights, outlook
false
Market Analysis and Trends
Financial Services financial-services
Multiple Chart
EY
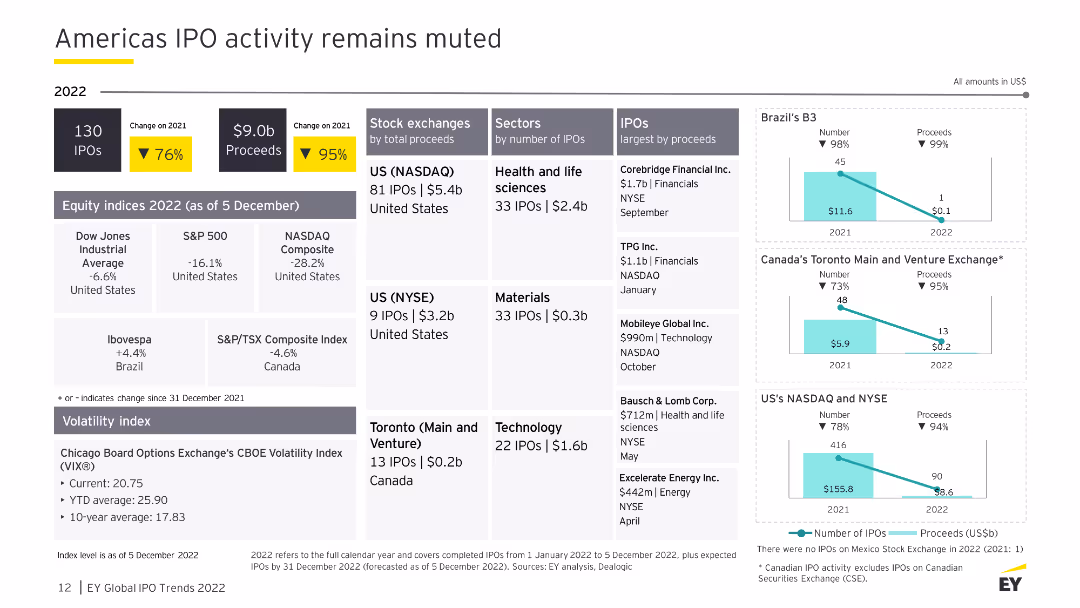
View slide
This slide uses multiple data points and small bar charts to summarize IPO activities, proceeds, and sector distributions for the Americas in 2022. The layout is data-heavy but organized clearly.
Market Analysis and Trends
Financial Services
The slide provides an overview of IPO activity in the Americas for 2022, showing a significant decline in the number of IPOs and proceeds compared to 2021. It includes detailed breakdowns by stock exchanges and sectors.
IPO, Americas, stock exchange, proceeds, 2022
false
Market Analysis and Trends
Financial Services financial-services
Multiple Chart
EY
View slide
A slide with multiple charts showing the number and proceeds of IPOs in the Asia-Pacific region, along with exchange and sector breakdowns. The visual complexity is advanced, with detailed financial data and trends.
Market Analysis and Trends
Financial Services
The slide provides an analysis of IPO activity in the Asia-Pacific region, noting a slow start to the year but moderate growth in Japan. It includes detailed charts on the number and proceeds of IPOs by country and sector, highlighting the performance of major exchanges and the overall market trends.
IPO, Asia-Pacific, Japan, Growth, Market, Trends
false
Market Analysis and Trends
Financial Services financial-services
Multiple Chart
EY
View slide
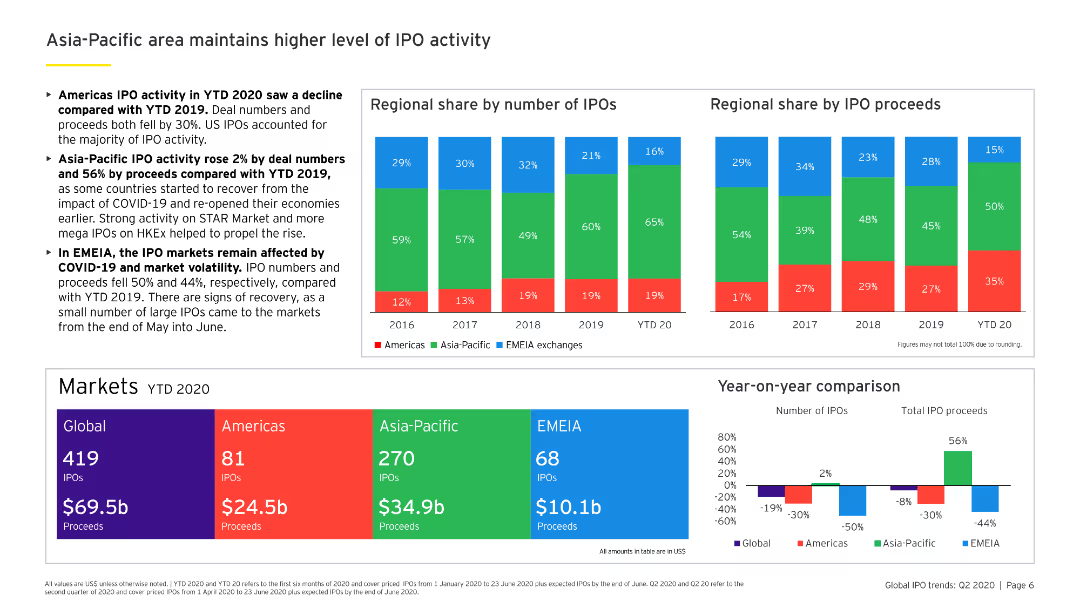
This slide features two bar charts, showing regional share by the number of IPOs and proceeds from 2016 to YTD 2020.
Market Analysis and Trends
Financial Services
Highlights the superior performance of the Asia-Pacific region in IPO activities, with detailed statistics on IPO numbers and proceeds compared to other regions.
IPO, Asia-Pacific, market share, proceeds, regional comparison
false
Market Analysis and Trends
Financial Services financial-services
Multiple Chart
EY
View slide
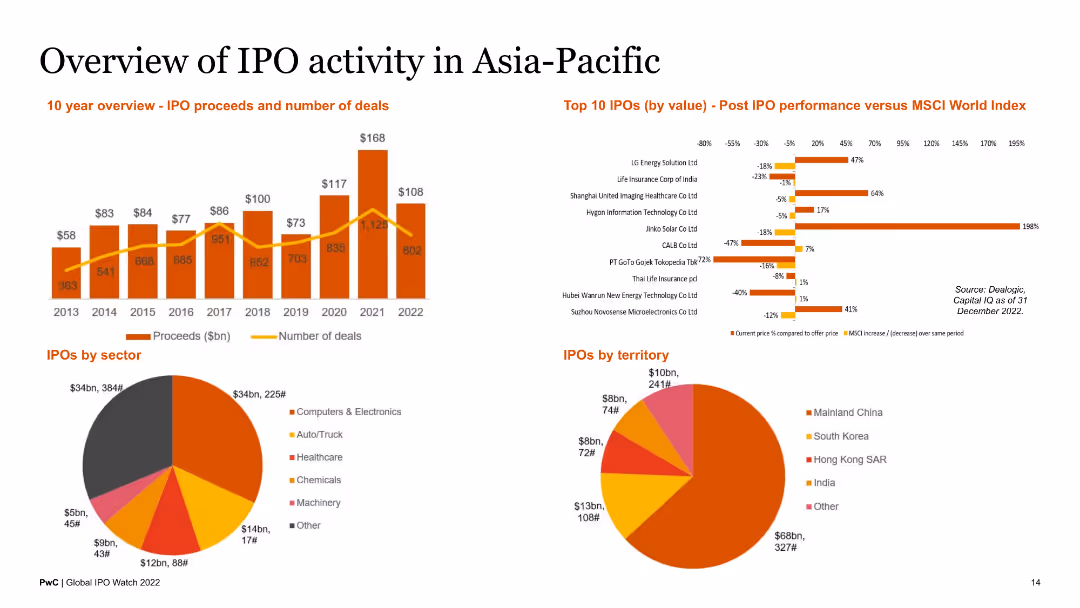
This slide includes a column chart depicting IPO proceeds and number of deals over 10 years, a pie chart for IPOs by sector, another pie chart for IPOs by territory, and a bar chart comparing post IPO performance of top 10 IPOs by value.
Market Analysis and Trends
Financial Services
The slide provides an overview of IPO activities in the Asia-Pacific region, detailing proceeds, number of deals, sector distribution, and geographical distribution. It also highlights post IPO performance.
IPO, Asia-Pacific, proceeds, deals, sector, territory, performance, financial, market
false
Market Analysis and Trends
Financial Services financial-services
Multiple Chart
PwC/Strategy&
View slide
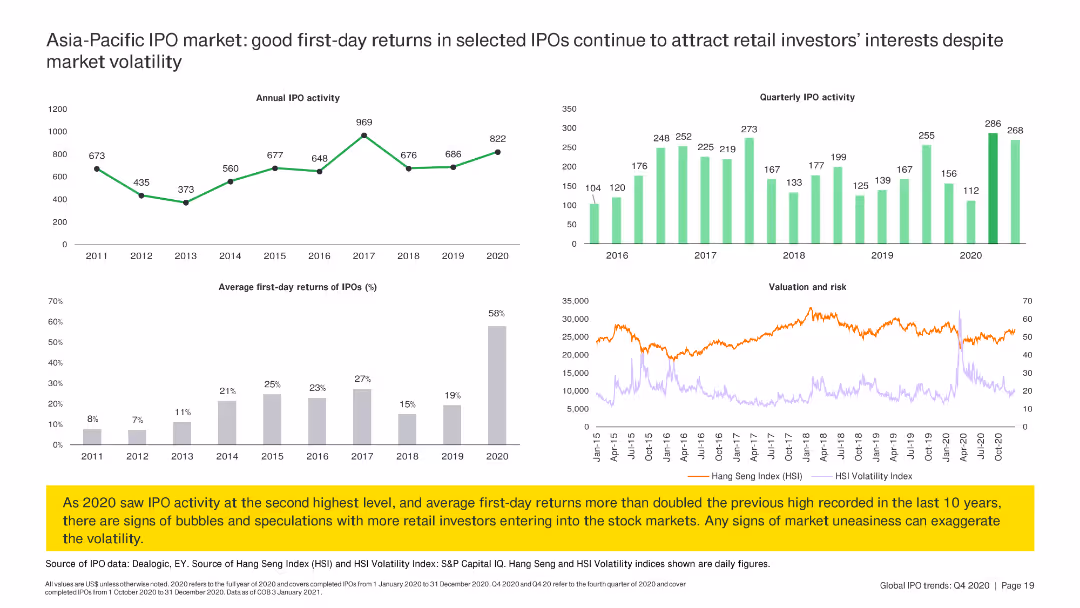
The slide includes line charts and column charts summarizing annual IPO activity, first-day returns, and quarterly IPO activity in the Asia-Pacific region.
Market Analysis and Trends
Financial Services
The slide reviews IPO activity in the Asia-Pacific region, focusing on good first-day returns and quarterly IPO trends, despite market volatility.
IPO, Asia-Pacific, returns, trends, volatility
false
Market Analysis and Trends
Financial Services financial-services
Multiple Chart
EY
View slide
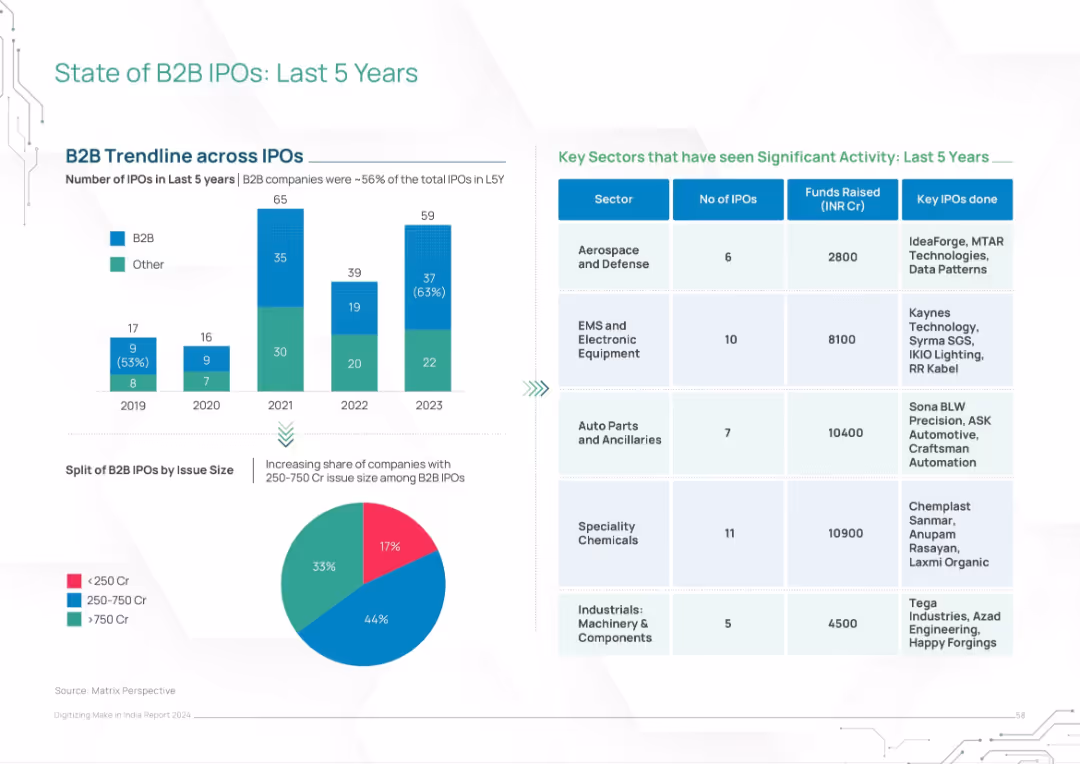
Split layout with bar chart (IPO trends), pie chart (issue size distribution), and table (key sectors)
Financial Performance
Financial Services
This slide reviews the state of B2B IPOs in India over the last five years, showing increasing activity and larger deal sizes. Key sectors and IPO examples are listed, along with funds raised. Visuals show a rising share of mid-to-large IPOs.
IPO, B2B, financial performance, India, sectors, funds raised, capital markets, growth, trends
false
Financial Performance
Financial Services financial-services
Multiple Chart
BCG
Previous
Loading...
Hold On!
We are searching in our database
If nothing, comes up, please try different filters!
Column Chart
Heatmap
Chevron
Org Chart
Infographic
Callouts
Timeline
List
Graphic
Picture
Process Flow
Diagram
Paragraph
Map
Table
Framework
Subtitle
Takeaway Box
Icon
Other Chart
Radar Chart
Waterfall Chart
Mekko Chart
Pie Chart
Scatter Plot
Line Chart
Bar chart
Bullet points
Create a FREE account to continue browsing
Receive Instant Access to 1,000+ slides from companies like McKinsey, Google, and Goldman Sachs
First Name
Last Name
Email
Password
I agree to all
Terms & Privacy Policy
Thank you! Your submission has been received!
Oops! Something went wrong while submitting the form.
Have an account?
Sign in
Upgrade to PRO to Save slides
Advanced Search and Filters
Access to 15,000+ slides
Access to Category Pages
Save/Bookmark Slides
PowerPoint Template Library
Pick a Plan
MONTHLY
$12/month
Billed every month, Cancel anytime.
YEARLY
$9/year
Billed $108 annually, Cancel anytime.
Checkout for $12/month
Checkout for $108/yr
Secured by Stripe | AES-256 bit encryption