My Account
My Slides
Search by Category
Templates
Leave Feedback
Login
Logout
Get Started
Browse all Slides
Browse all Slides
Create a FREE Account
Instant access to 1,000+ real slides from top companies like McKinsey, BCG, Goldman Sachs, Google and many more!
First Name
Last Name
Email
Password
I agree to all
Terms & Privacy Policy
Thank you! Your submission has been received!
Oops! Something went wrong while submitting the form.
Have an account?
Sign in
📢 Ready to start building slides? Check out our new template library
VIEW TEMPLATES
Welcome,
Welcome
PRO
Show Featured Only
Checkbox 8
Companies
Mckinsey
Bain
BCG
EY
Deloitte
Accenture
PwC/Strategy&
JP Morgan
Goldman Sachs
Morgan Stanley
Citigroup
Deutsche Bank
Barclays
LEK
KPMG
Kearney
Oliver Wyman
Booz Allen Hamilton
Gartner
IPSOS
Nielsen
Slide type
Text Only
Linear Flow
Vertical Flow
Single Chart
Header Horizontal
Mixed Chart
Header Vertical
Pillar
Multiple Chart
Graphic
Agenda
Title
Table
Framework
Industry
Technology & Software
Artificial Intelligence
Financial Services
Retail & E-commerce
Consumer Goods
Industrial & Manufacturing
Transportation & Logistics
Telecommunications
Real Estate & Construction
Hospitality & Tourism
Professional Services
Education & Training
Media & Entertainment
Agriculture & Food Production
Healthcare & Pharmaceuticals
Environmental Services & Sustainability
Government & Public Sector
Use Case
Mergers and Acquisitions
Performance Metrics and KPIs
Client Case Studies
Competitive Landscape
Corporate Finance and Valuation
Product and Service Analysis
Customer and Market Segmentation
Organizational Structure and Change
Industry Overview
Regulatory and Compliance
Risk Assessment and Management
Investment Analysis
Organizational Structure and Change
Human Resources and Talent Management
Financial Performance
Market Analysis and Trends
Sales and Business Development
Human Resources and Talent Management
Clear all
Thank you! Your submission has been received!
Oops! Something went wrong while submitting the form.
Tag
View slide
The slide shows comparative column charts for the Shanghai, Shenzhen, Beijing, and Hong Kong Stock Exchanges, detailing the number of IPOs and proceeds from 2019 to YTD 2023.
Market Analysis and Trends
Financial Services
This slide highlights the IPO market performance of Mainland China and Hong Kong, breaking down the data by stock exchange and sector, including the top sectors by number of IPOs and proceeds.
IPO, China, Hong Kong, stock exchange
false
Market Analysis and Trends
Financial Services financial-services
Multiple Chart
EY
View slide
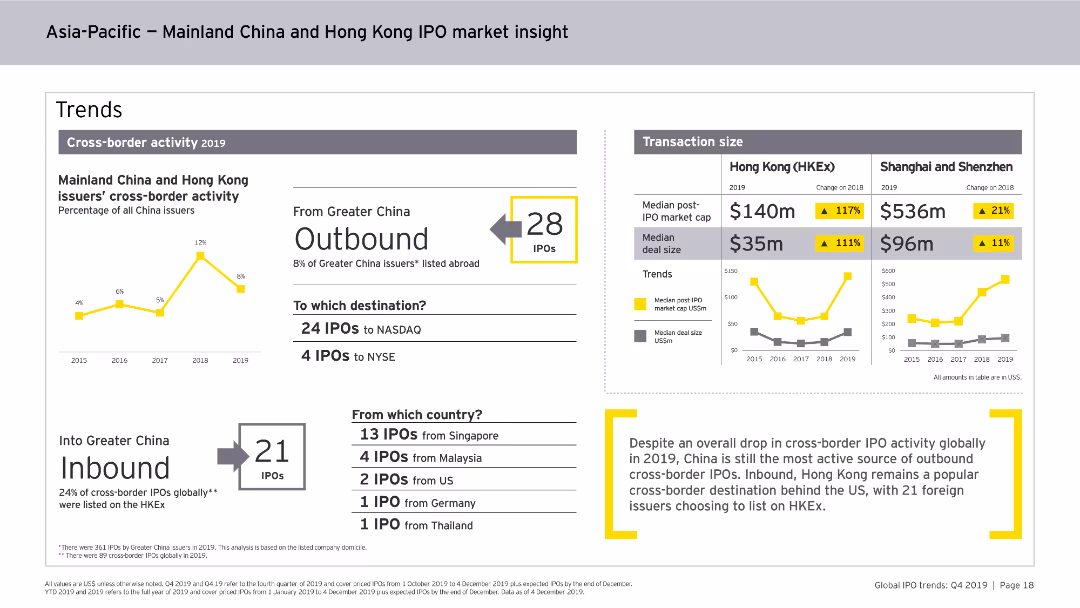
This slide includes line charts, column charts, and numerical data points. It visually represents the trends in cross-border IPO activity from Mainland China and Hong Kong, transaction sizes, and outbound/inbound IPO statistics.
Market Analysis and Trends
Financial Services
The slide provides insights into the cross-border IPO activity of Mainland China and Hong Kong issuers in 2019, highlighting outbound and inbound IPO numbers, transaction sizes, and notable trends in the region's IPO market.
IPO, Cross-border, Mainland China, Hong Kong, Market Trends, Transaction Size, Financial Services, Outbound, Inbound
false
Market Analysis and Trends
Financial Services financial-services
Multiple Chart
EY
View slide
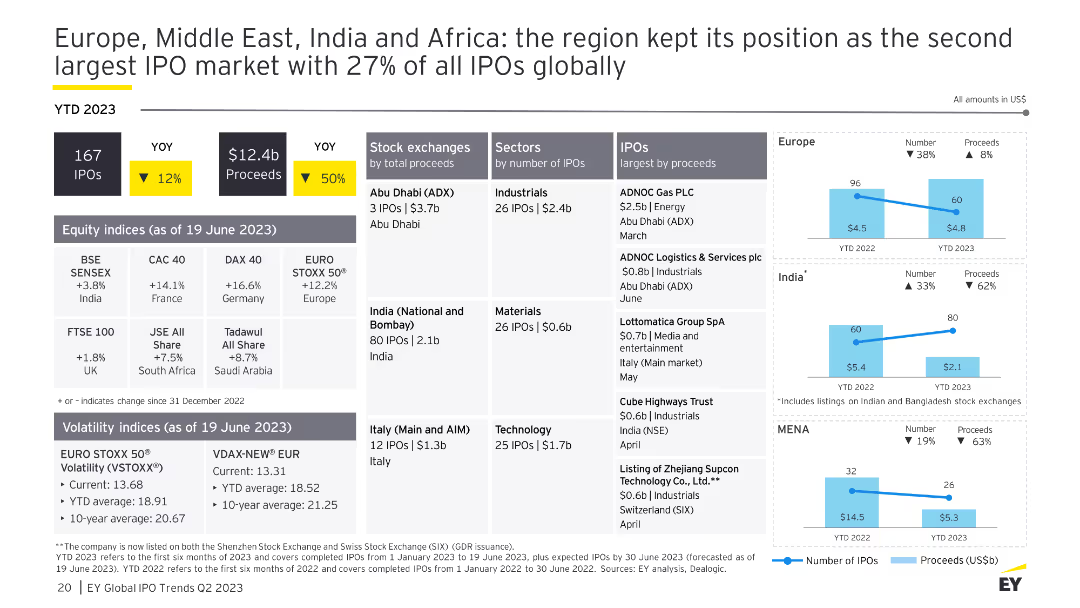
The slide features column charts for the number of IPOs and proceeds, tables for stock exchanges and sectors, and line charts for regional IPO activity in Europe, India, and MENA.
Market Analysis and Trends
Financial Services
This slide provides an overview of IPO activities in Europe, the Middle East, India, and Africa, emphasizing their position as the second-largest IPO market globally with detailed regional breakdowns.
IPO, EMEIA, Europe, Middle East, Africa
false
Market Analysis and Trends
Financial Services financial-services
Multiple Chart
EY
View slide
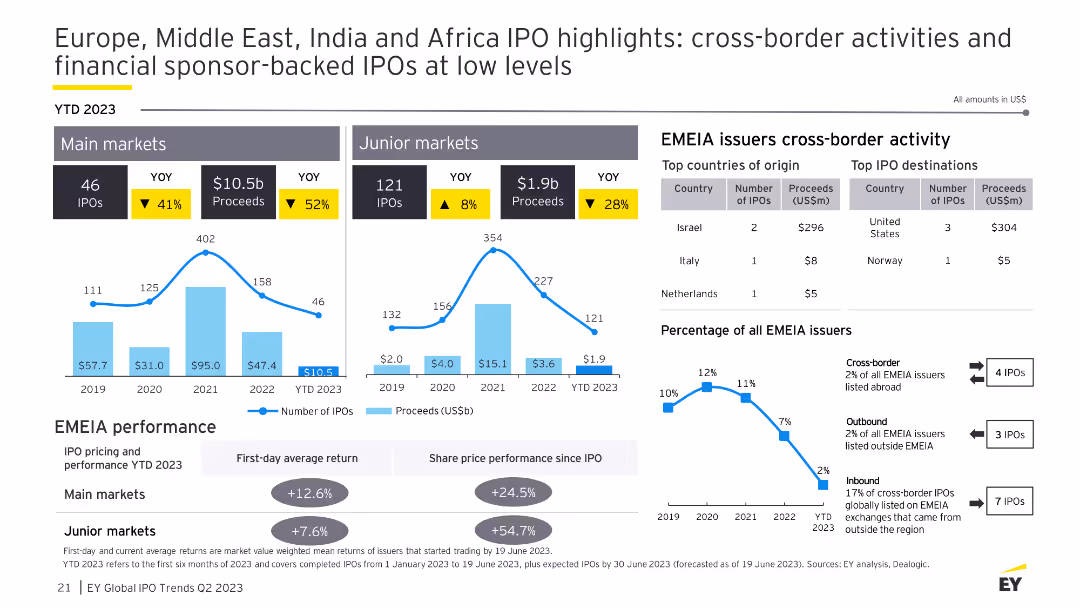
The slide presents column charts for the number of IPOs and proceeds in main and junior markets, a table for cross-border activity by country, and percentage trends.
Market Analysis and Trends
Financial Services
This slide discusses the IPO performance in EMEIA, noting the decline in cross-border activities and highlighting key statistics for main and junior markets, and top countries of origin and destinations.
IPO, EMEIA, cross-border, financial, trends
false
Market Analysis and Trends
Financial Services financial-services
Multiple Chart
EY
View slide
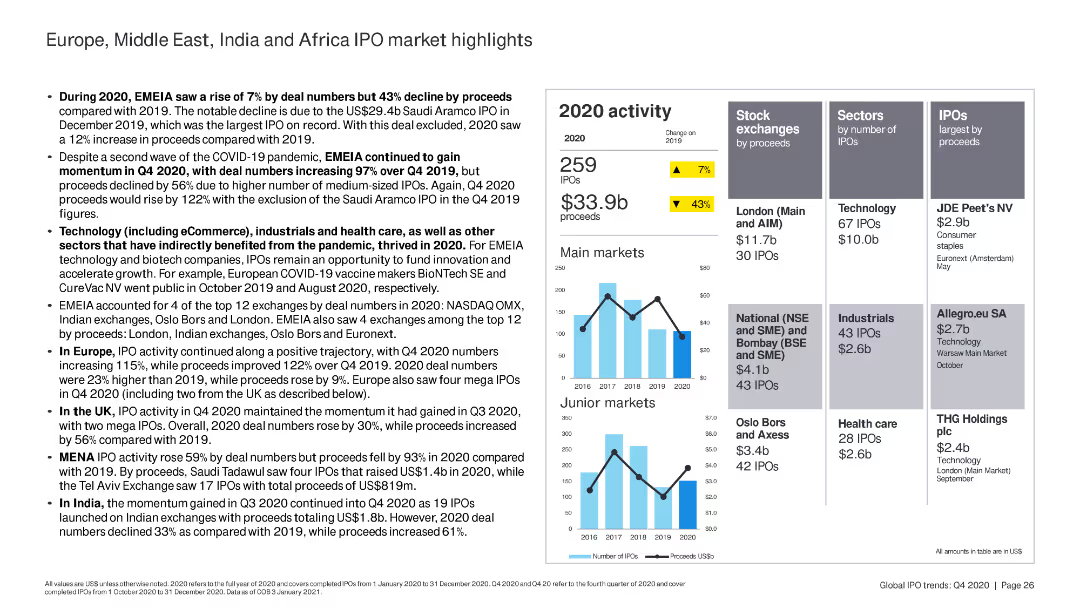
The slide features a column chart with data on 2020 IPO activity in main and junior markets. It also includes a text section summarizing IPO trends across EMEIA regions, with key statistics and sector analysis.
Market Analysis and Trends
Financial Services
Provides an overview of IPO market trends in EMEIA for 2020, noting a decline in proceeds despite an increase in deal numbers. Highlights sector performance and regional market activities.
IPO, EMEIA, market trends, sectors, 2020, financial services, Europe, Middle East, India, Africa
false
Market Analysis and Trends
Financial Services financial-services
Multiple Chart
EY
View slide
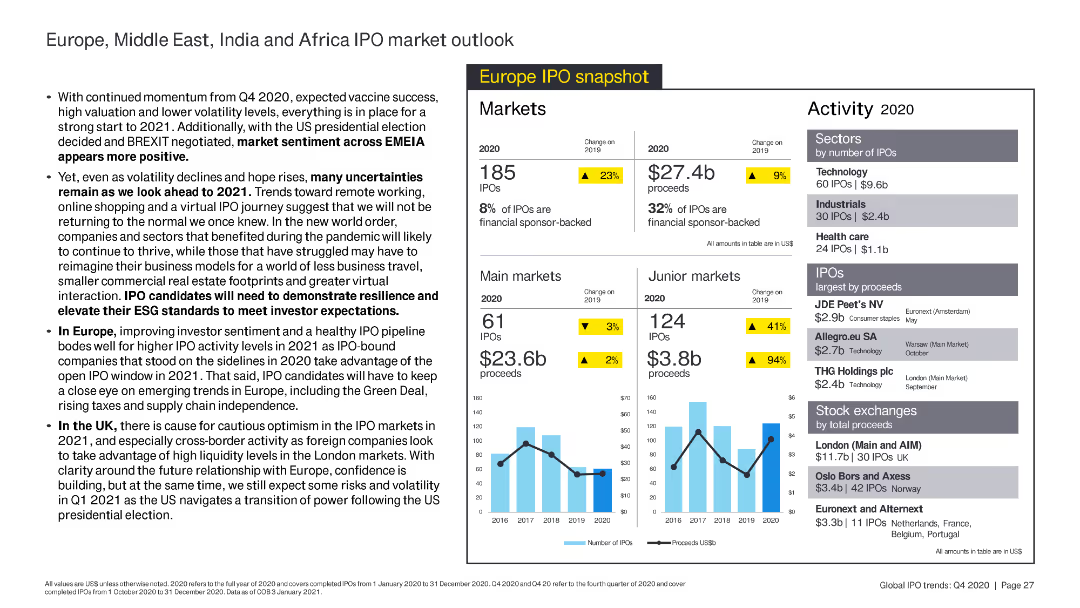
The slide presents a column chart comparing the number and proceeds of IPOs in main and junior markets from 2016 to 2020. It includes a text section discussing the market outlook and expected trends for 2021.
Market Analysis and Trends
Financial Services
Discusses expected market sentiment and IPO activity trends for EMEIA in 2021, with a focus on technology, healthcare, and industrial sectors. Highlights potential risks and opportunities post-Brexit.
IPO, EMEIA, outlook, 2021, market trends, technology, healthcare, industrial, Brexit
false
Market Analysis and Trends
Financial Services financial-services
Multiple Chart
EY
View slide
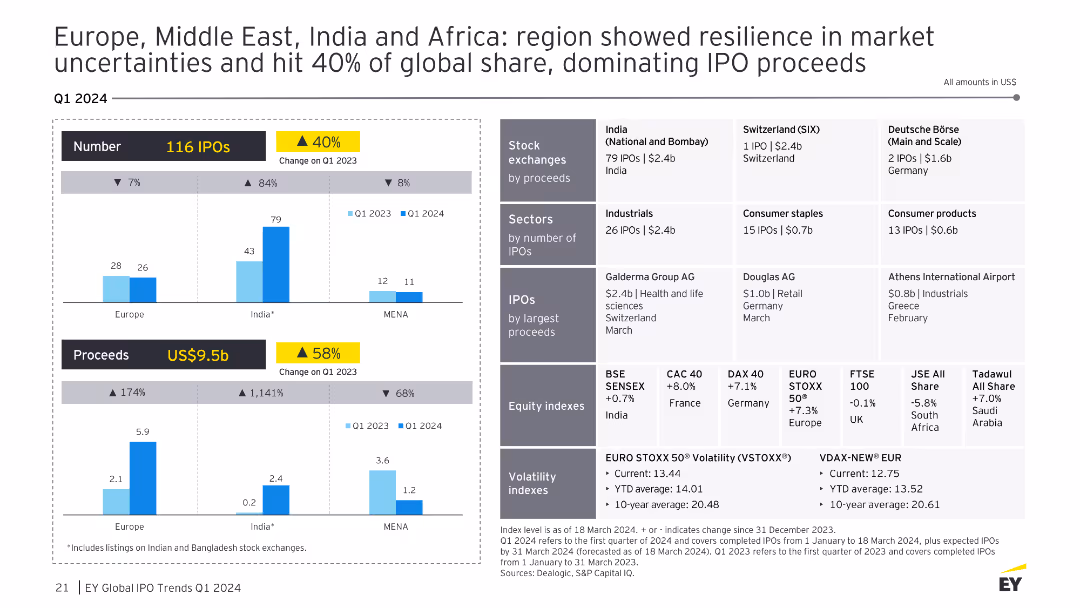
A slide with multiple charts showing the number and proceeds of IPOs in Europe, Middle East, India, and Africa, with detailed exchange and sector breakdowns. The visual complexity is advanced, with comprehensive data.
Market Analysis and Trends
Financial Services
The slide highlights the resilience of the Europe, Middle East, India, and Africa regions in market uncertainties, capturing 40% of the global IPO proceeds. It provides detailed data on the number of IPOs and proceeds by region, along with sector-specific performances and notable IPOs in each region.
IPO, Europe, Middle East, India, Africa, Resilience
false
Market Analysis and Trends
Financial Services financial-services
Multiple Chart
EY
View slide
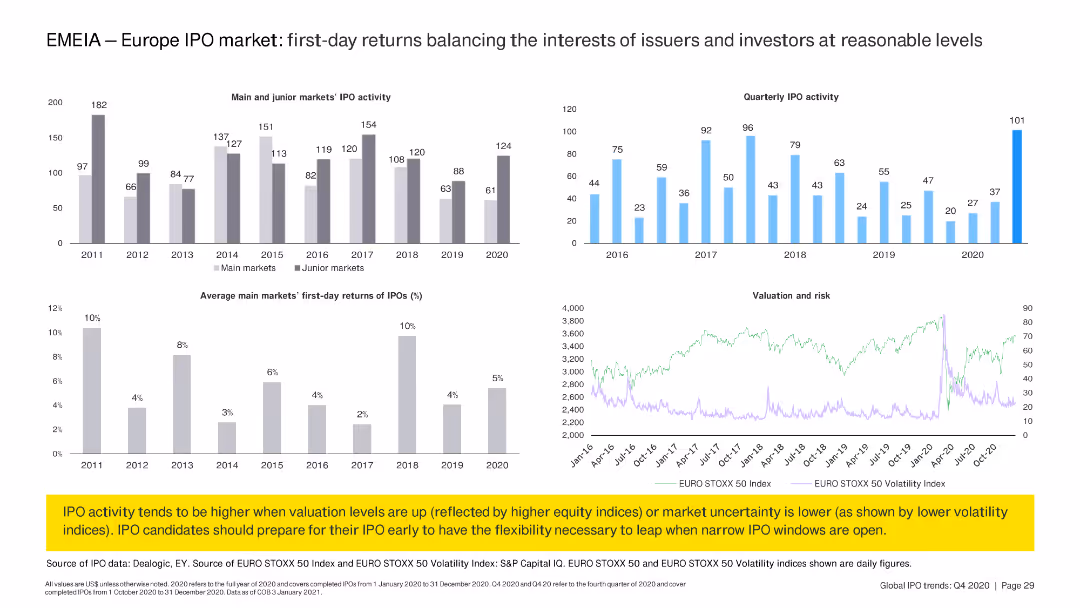
The slide includes two column charts displaying IPO activity and first-day returns in main and junior markets from 2011 to 2020. A line chart shows valuation and risk trends over time.
Market Analysis and Trends
Financial Services
Analyzes first-day returns of IPOs in Europe's main and junior markets, showing trends from 2011 to 2020. Highlights the relationship between IPO activity, valuation, and market risk.
IPO, Europe, first-day returns, market trends, valuation, risk, financial services, EMEIA
false
Market Analysis and Trends
Financial Services financial-services
Multiple Chart
EY
View slide
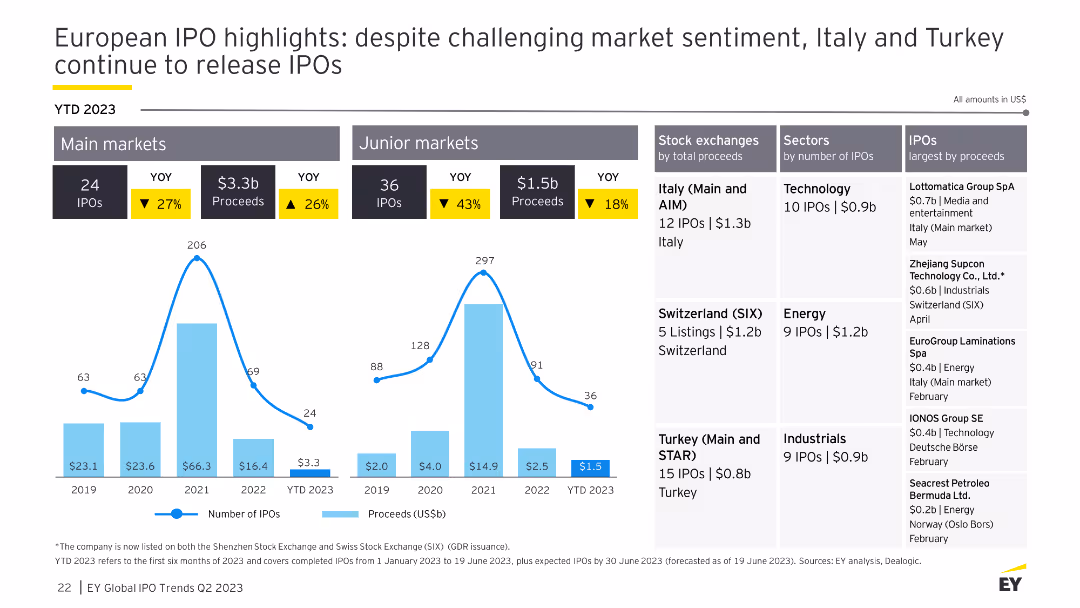
The slide includes column charts for IPO performance in main and junior markets, tables for stock exchanges and sectors, and highlights of the largest IPOs by proceeds.
Market Analysis and Trends
Financial Services
This slide examines the European IPO market, focusing on the challenging market sentiment and the performance of main and junior markets, with details on top exchanges, sectors, and notable IPOs.
IPO, Europe, market sentiment, financial
false
Market Analysis and Trends
Financial Services financial-services
Multiple Chart
EY
View slide
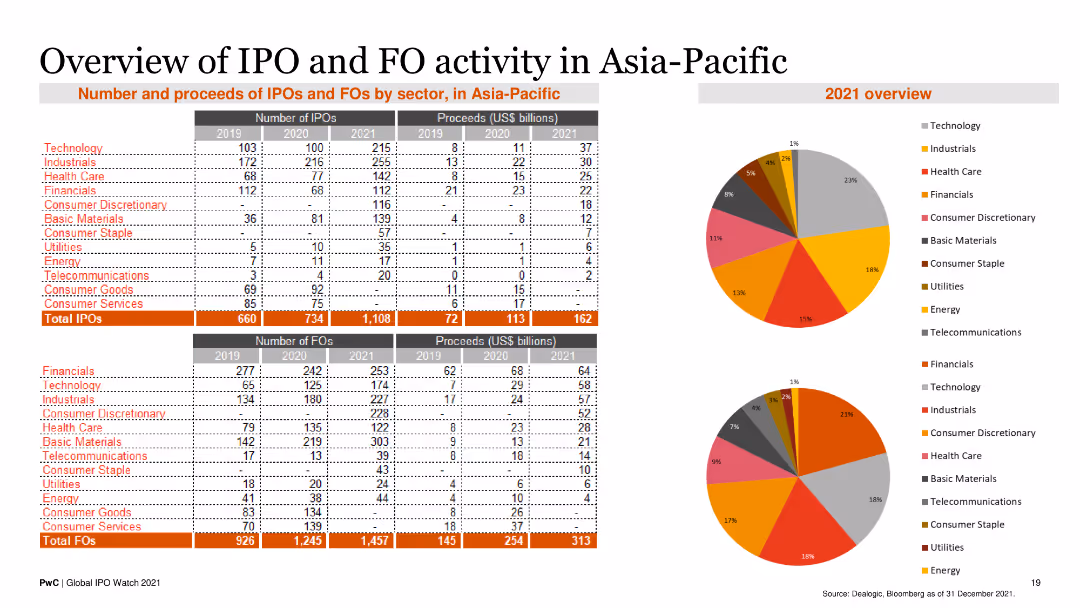
The slide contains two tables displaying the number and proceeds of IPOs and FOs by sector from 2019 to 2021. Two pie charts illustrate the sector distribution for 2021.
Market Analysis and Trends
Financial Services
This slide provides an overview of IPO and FO activities in the Asia-Pacific region, detailing the number and proceeds by sector, and highlighting key trends for 2021.
IPO, FO, Asia-Pacific, Financial Services, Market Trends
false
Market Analysis and Trends
Financial Services financial-services
Multiple Chart
PwC/Strategy&
View slide
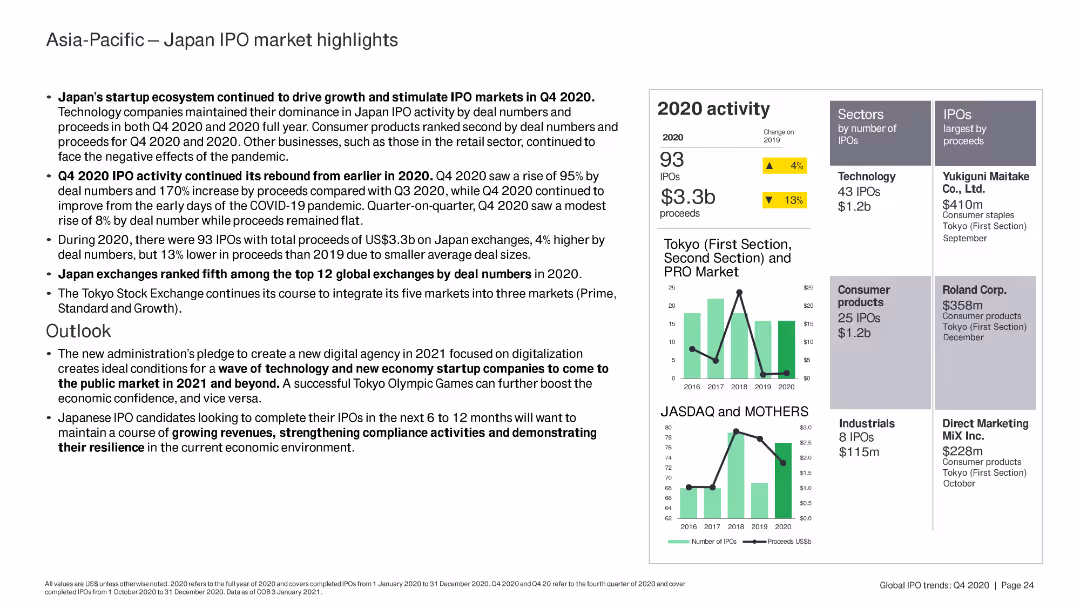
The slide includes multiple sections with text, bullet points, and a right-side panel featuring a column chart comparing Tokyo and JASDAQ/MOTHERS IPO activity from 2016 to 2020. It also has data points on the number of IPOs and proceeds.
Market Analysis and Trends
Financial Services
Discusses Japan's IPO market in Q4 2020, highlighting growth driven by the startup ecosystem, the rebound of IPO activity, and Japan's global ranking. Forecasts technology and digital economy trends for 2021.
IPO, Japan, market, trends, technology, digital economy, startups, Q4 2020, financial services, Asia-Pacific
false
Market Analysis and Trends
Financial Services financial-services
Multiple Chart
EY
View slide
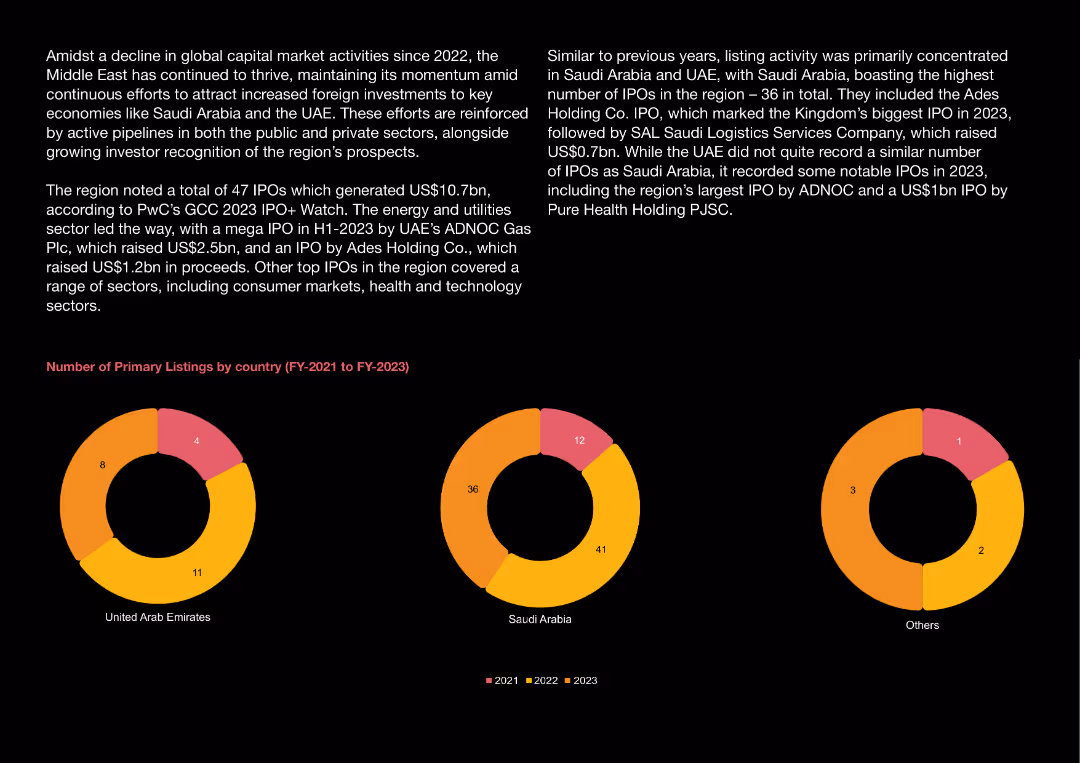
Donut charts showing the number of primary listings in UAE, Saudi Arabia, and Others from FY-2021 to FY-2023, with each year color-coded.
Market Analysis and Trends
Financial Services
Discusses the number of primary listings by country in the Middle East, highlighting key IPOs and their impact on market activity.
IPO, Listings, UAE, Saudi Arabia, Market Activity
false
Market Analysis and Trends
Financial Services financial-services
Multiple Chart
PwC/Strategy&
View slide
The slide features multiple column charts illustrating MENA IPO activity from Q1 2018 to Q4 2022, GCC IPOs, and non-GCC IPOs. The charts use purple and red to distinguish between proceeds and the number of IPOs.
Market Analysis and Trends
Financial Services
This slide provides a comprehensive snapshot of MENA IPO market activity from Q1 2018 to Q4 2022, including a breakdown of GCC and non-GCC IPOs. It presents trends in the number of IPOs and proceeds, highlighting significant fluctuations and market dynamics over the years.
IPO, MENA markets, financial services, market trends, GCC, non-GCC, market snapshot, financial data, proceeds, number of IPOs
false
Market Analysis and Trends
Financial Services financial-services
Multiple Chart
EY
View slide
The slide has a detailed summary text on the left, with two small bar charts on the right showing IPO proceeds and activity in Q4 2022. The layout is text-heavy with supporting visuals in grey and red for data highlights.
Market Analysis and Trends
Financial Services
This slide summarizes the record IPO activity in the MENA markets during Q4 2022. It highlights key IPOs, total proceeds, and changes compared to previous quarters. It includes a detailed narrative of notable IPOs and market performance, supported by visual data on proceeds and activity.
IPO, MENA markets, financial services, market trends, quarterly summary, IPO activity, proceeds, financial data, market analysis, investment
false
Market Analysis and Trends
Financial Services financial-services
Mixed Chart
EY
View slide
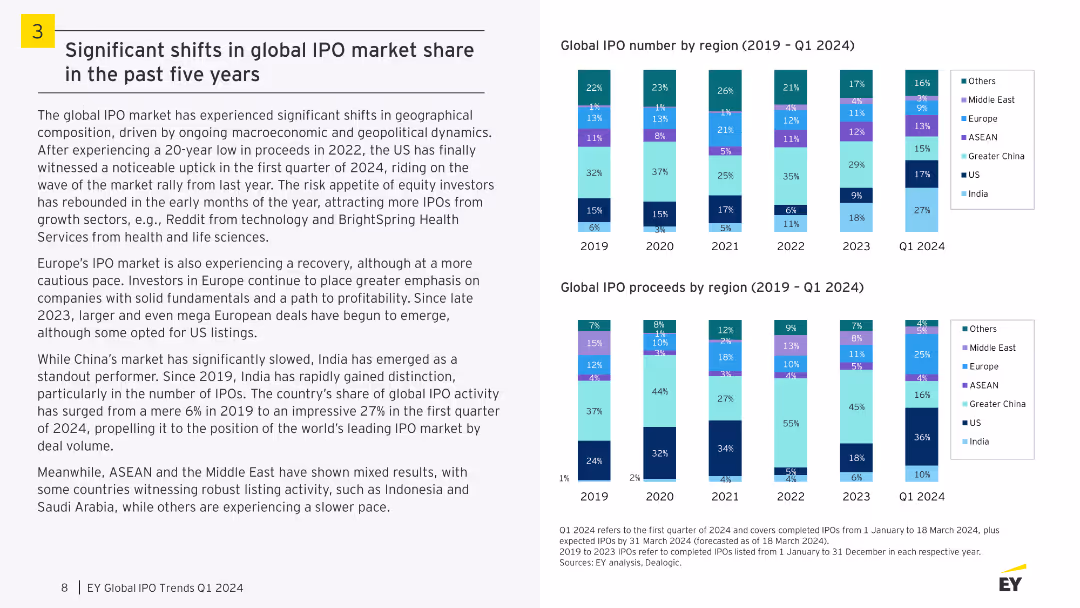
A slide featuring two bar charts showing global IPO numbers and proceeds by region over five years. The visual complexity is moderate, focusing on trends and geographical shifts.
Market Analysis and Trends
Financial Services
The slide analyzes significant geographical shifts in the global IPO market, with detailed statistics on IPO numbers and proceeds by region. It highlights the increasing market share of regions like India and the US, while noting the mixed results in regions like ASEAN and the Middle East.
IPO, Market Share, Global, Trends, Regions, Shifts
false
Market Analysis and Trends
Financial Services financial-services
Multiple Chart
EY
View slide
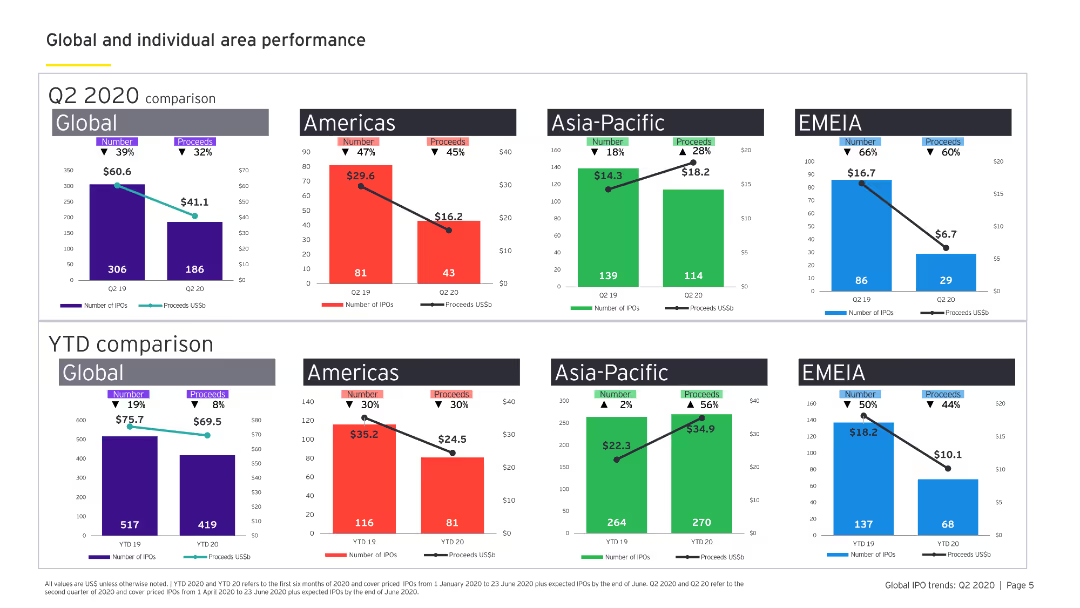
The slide contains two sets of column charts comparing Q2 2020 and YTD performance across Global, Americas, Asia-Pacific, and EMEIA. Each region is color-coded.
Market Analysis and Trends
Financial Services
The slide provides a visual comparison of the number of IPOs and proceeds across different regions globally, comparing the second quarter and year-to-date performance.
IPO, Q2 2020, YTD, global performance, financial services, Americas, Asia-Pacific, EMEIA
false
Market Analysis and Trends
Financial Services financial-services
Multiple Chart
EY
View slide
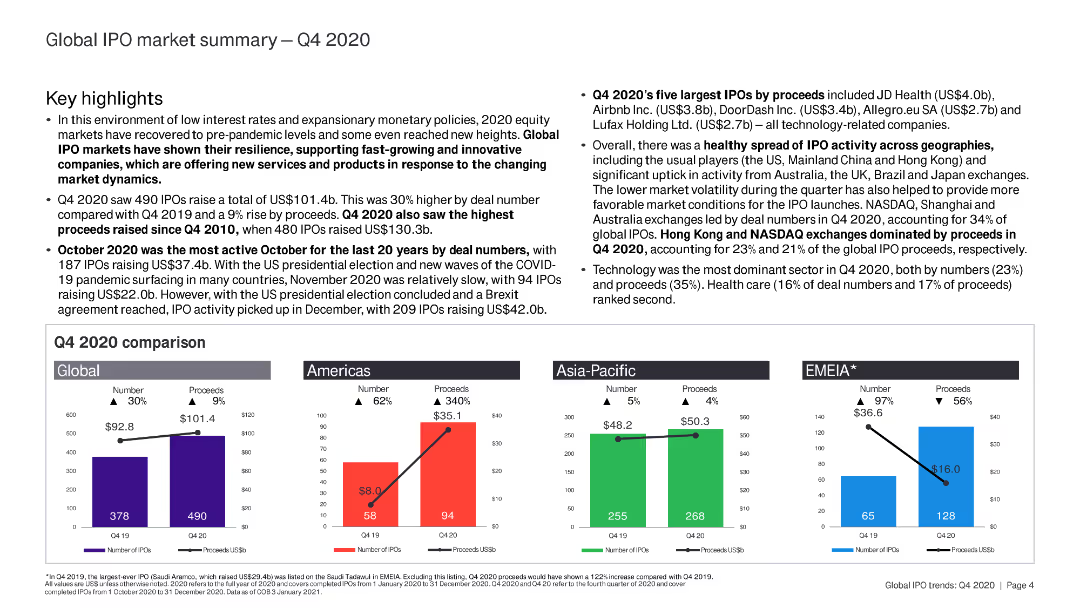
The slide is text-heavy with key highlights and comparative analysis of IPO markets in Q4 2020. It includes small bar charts for regional comparisons.
Market Analysis and Trends
Financial Services
This slide summarizes the global IPO market in Q4 2020, covering key highlights, largest IPOs, and regional analysis.
IPO, Q4 2020, global market, key highlights, regional analysis
false
Market Analysis and Trends
Financial Services financial-services
Multiple Chart
EY
View slide
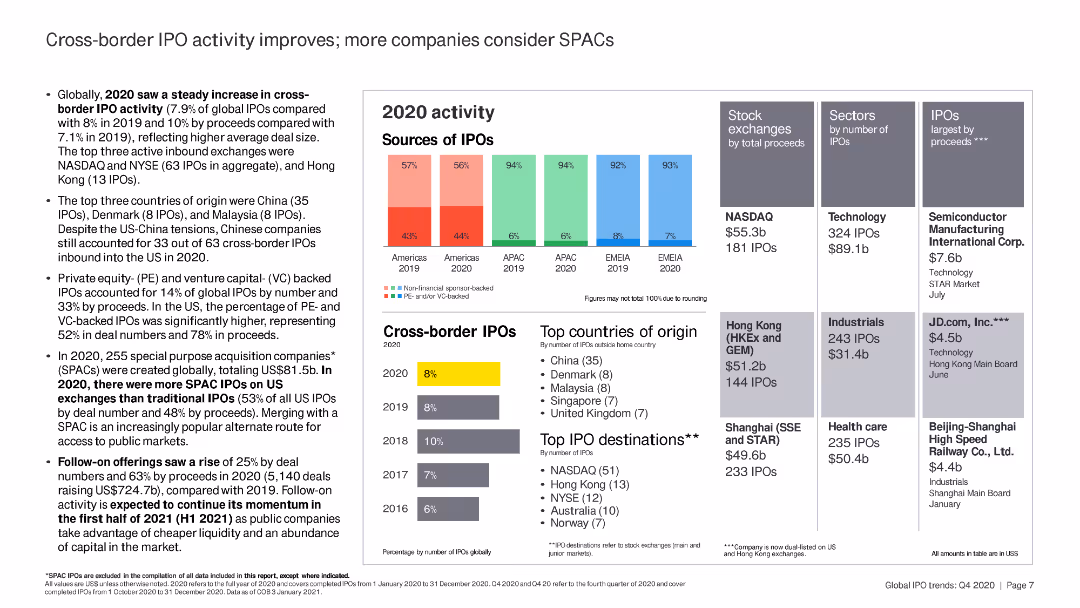
This slide includes column charts and bar charts detailing 2020 IPO activity by region and stock exchange. There are several highlighted text boxes summarizing key figures and top companies by IPO proceeds.
Market Analysis and Trends
Financial Services
The slide provides an overview of cross-border IPO activity in 2020, with a focus on the increasing popularity of SPACs. Key statistics on IPO numbers, proceeds, and top stock exchanges are presented.
IPO, SPAC, stock exchange, proceeds, 2020
false
Market Analysis and Trends
Financial Services financial-services
Multiple Chart
EY
View slide
Contains a comparative analysis layout, contrasting traditional IPO processes with SPAC merger processes using a timeline format.
Strategic Planning
Financial Services
Compares traditional IPO and SPAC timelines, highlighting the efficiencies and shorter timelines associated with SPACs.
IPO, SPAC, timeline, traditional, comparison, process, planning
false
Strategic Planning
Financial Services financial-services
Linear Flow
PwC/Strategy&
View slide
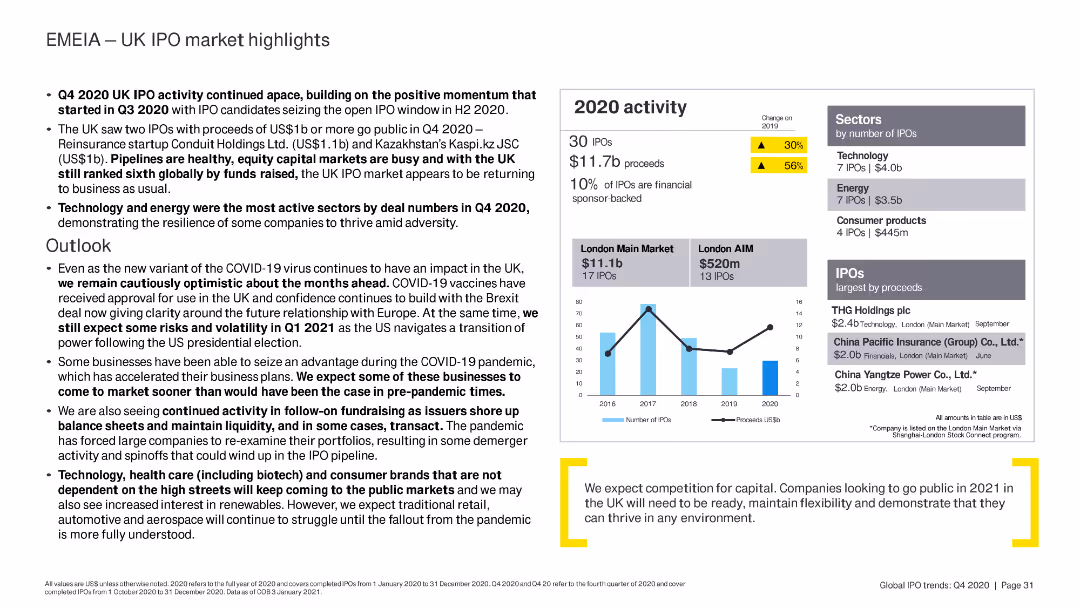
The slide features a column chart comparing the number and proceeds of IPOs in the London Main Market and AIM from 2016 to 2020. Text sections provide highlights of the UK IPO market in Q4 2020.
Market Analysis and Trends
Financial Services
Summarizes the UK IPO market's performance in Q4 2020, noting significant deals, sector activity, and market trends. Discusses outlook and expected competition for capital in 2021.
IPO, UK, market highlights, Q4 2020, financial services, London Main Market, AIM
false
Market Analysis and Trends
Financial Services financial-services
Mixed Chart
EY
View slide
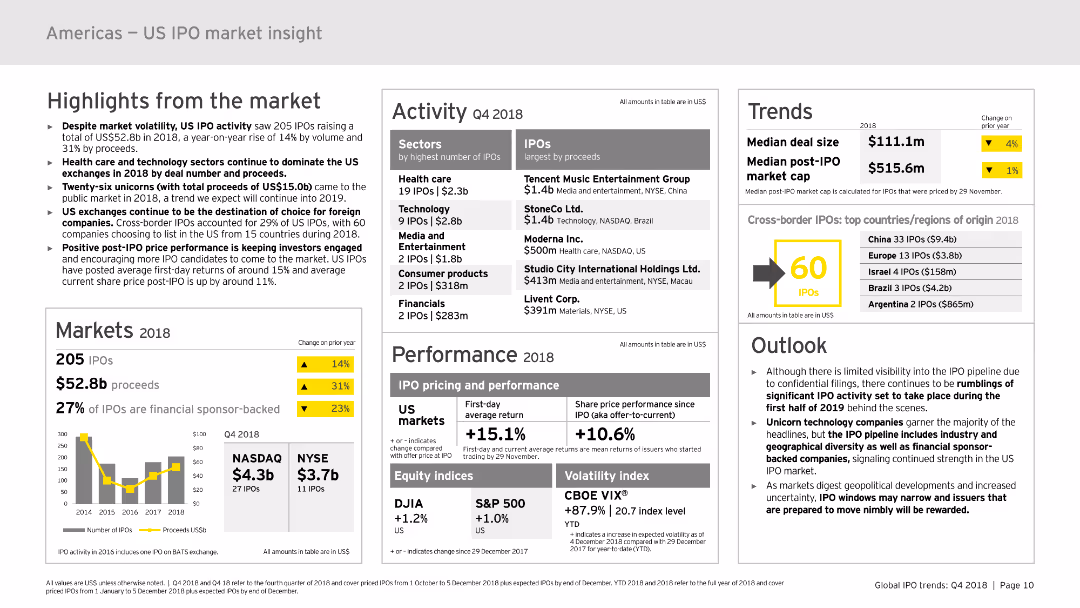
The slide contains multiple sections with various charts and graphs, including column charts, data tables, and infographic elements. Key areas include highlights, markets, activity, performance, trends, and outlook. The layout is dense, presenting a comprehensive overview of the US IPO market in 2018.
Market Analysis and Trends
Financial Services
Provides an in-depth analysis of the US IPO market in 2018, highlighting market volatility, activity, performance, and trends. It includes detailed statistics and predictions for future trends, making it suitable for financial analysis and strategic planning.
IPO, US market, trends, performance, 2018, financial analysis
false
Market Analysis and Trends
Financial Services financial-services
Mixed Chart
EY
View slide
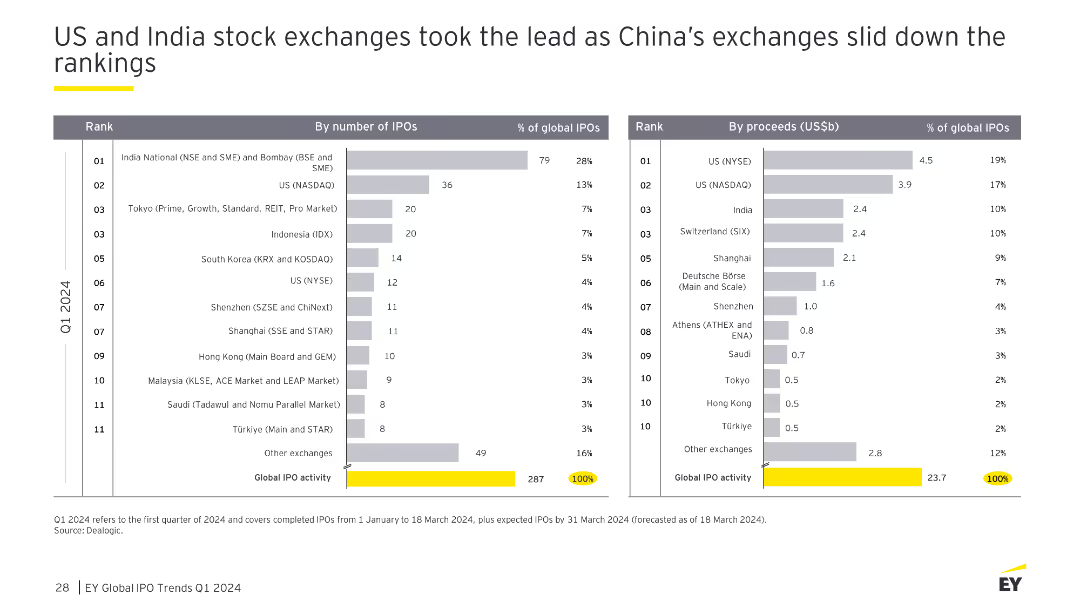
A slide with two comparative column charts showing the number and proceeds of IPOs by stock exchange in the first quarter of 2024. The visual complexity is moderate, focusing on comparative data across major exchanges.
Market Analysis and Trends
Financial Services
The slide analyzes the performance of global stock exchanges in the first quarter of 2024, noting the lead taken by US and India exchanges while China's exchanges experienced a decline. It provides comparative data on the number and proceeds of IPOs, highlighting the top-performing exchanges and their market shares.
IPO, US, India, China, Stock Exchanges, Rankings
false
Market Analysis and Trends
Financial Services financial-services
Multiple Chart
EY
View slide
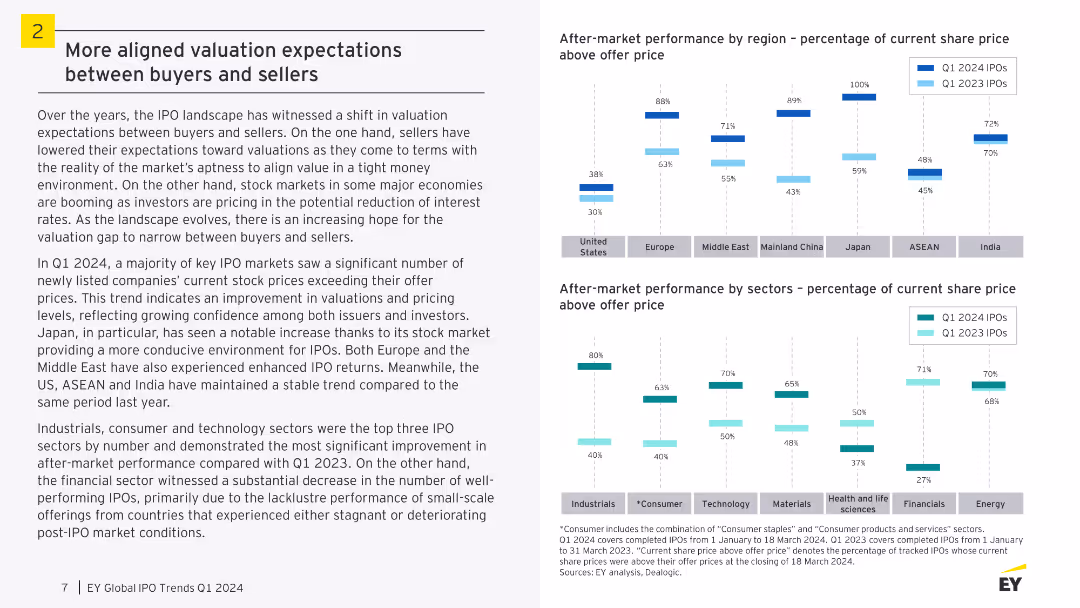
A slide with two column charts comparing after-market performance by region and sectors. The visual complexity is moderate, focusing on column charts with comparative data.
Market Analysis and Trends
Financial Services
The slide discusses the shift in valuation expectations in the IPO landscape, with improved confidence among issuers and investors. It highlights the after-market performance of IPOs in different regions and sectors, showing significant improvements in specific areas.
IPO, Valuation, Buyers, Sellers, Performance, Market
false
Market Analysis and Trends
Financial Services financial-services
Multiple Chart
EY
View slide
Features box plots comparing returns of different half-year venture-backed IPO cohorts, and a multi-line chart for EV/forward revenue multiple trends. Accompanied by textual analysis on trends and implications.
Investment Analysis
Financial Services
It evaluates the performance of venture-backed IPOs relative to established companies, signifying a trend of underperformance and potential repercussions on investment decisions.
IPO, Venture-Backed, Market Analysis, Performance
false
Investment Analysis
Financial Services financial-services
Multiple Chart
JP Morgan
View slide
The slide contains a line chart tracking IPO activity and volatility from July 2021 to June 2022, with annotations highlighting key trends.
Market Analysis and Trends
Financial Services
This slide analyzes the impact of rising volatility on IPO activity, showing a correlation between increased market volatility and a decline in the number of IPOs over the specified period.
IPO, Volatility, Market trends, Financial services, Analysis
false
Market Analysis and Trends
Financial Services financial-services
Single Chart
EY
View slide
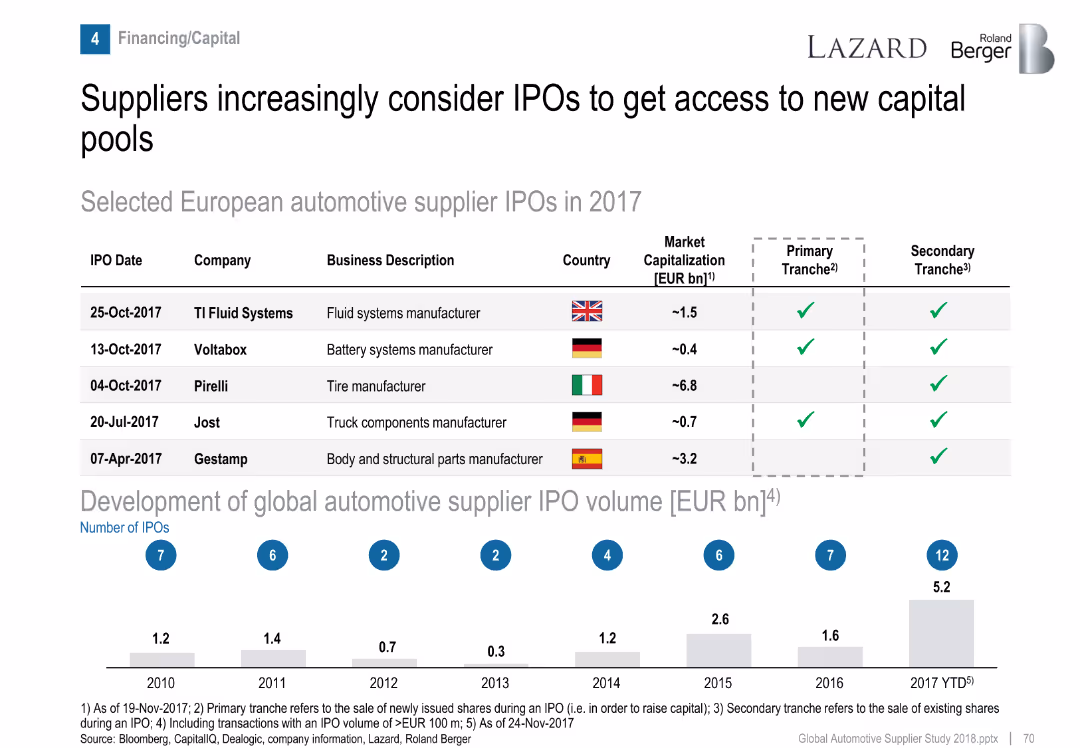
Table of IPOs and bar graph of historical IPO volumes.
Corporate Finance and Valuation
Industrial & Manufacturing
Highlights five European automotive supplier IPOs in 2017 and presents a trend in global IPO volume growth, indicating increased interest in capital markets by suppliers.
IPO, automotive suppliers, capital access, financing, market trends
false
Corporate Finance and Valuation
Industrial & Manufacturing industrial-and-manufacturing
Mixed Chart
Roland Berger
View slide
Contains a column chart showing global IPO proceeds from 2018 to 2022 with a focus on the strategic and regulatory factors affecting the market. The slide also features quotes and textual insights on market trends.
Investment Analysis
Financial Services
Discusses the performance and expectations of the global IPO market, noting significant activities such as Porsche's IPO and others, with future projections and strategic considerations.
IPO, capital market, global transactions, 2022, Porsche, regulatory impact, market slowdown, financial trends
false
Investment Analysis
Financial Services financial-services
Mixed Chart
PwC/Strategy&
View slide
The slide outlines a client case study with sections for opportunity, client, need, offered solutions, and a timeline showing the progression over years.
Client Case Studies
Financial Services
This case study describes a successful IPO leading to repeat business, detailing the client's needs, offered solutions, and the outcomes over a five-year timeline.
IPO, case study, client solutions, succession planning, repeat business
false
Client Case Studies
Financial Services financial-services
Linear Flow
Credit Suisse
View slide
The slide features a column chart displaying the number of IPOs and proceeds from 2019 to YTD 2023, a table of cross-border IPOs by country, and line charts for percentage trends.
Market Analysis and Trends
Financial Services
This slide presents data on US IPO performance, highlighting cross-border deals, their origin countries, and their percentage of total US IPOs, along with pricing and performance metrics.
IPO, cross-border, US, financial, trends
false
Market Analysis and Trends
Financial Services financial-services
Multiple Chart
EY
View slide
This slide presents a central circle diagram surrounded by associated elements in a balanced layout with red and gray color accents.
Market Analysis and Trends
Financial Services
Discusses the importance of a reliable equity story in IPOs, focusing on investor considerations and integrating business strategy with reproducible data and KPIs.
IPO, equity story, investors, KPIs, business strategy, data reliability
false
Market Analysis and Trends
Financial Services financial-services
Linear Flow
PwC/Strategy&
Previous
Loading...
Hold On!
We are searching in our database
If nothing, comes up, please try different filters!
Column Chart
Heatmap
Chevron
Org Chart
Infographic
Callouts
Timeline
List
Graphic
Picture
Process Flow
Diagram
Paragraph
Map
Table
Framework
Subtitle
Takeaway Box
Icon
Other Chart
Radar Chart
Waterfall Chart
Mekko Chart
Pie Chart
Scatter Plot
Line Chart
Bar chart
Bullet points
Create a FREE account to continue browsing
Receive Instant Access to 1,000+ slides from companies like McKinsey, Google, and Goldman Sachs
First Name
Last Name
Email
Password
I agree to all
Terms & Privacy Policy
Thank you! Your submission has been received!
Oops! Something went wrong while submitting the form.
Have an account?
Sign in
Upgrade to PRO to Save slides
Advanced Search and Filters
Access to 15,000+ slides
Access to Category Pages
Save/Bookmark Slides
PowerPoint Template Library
Pick a Plan
MONTHLY
$12/month
Billed every month, Cancel anytime.
YEARLY
$9/year
Billed $108 annually, Cancel anytime.
Checkout for $12/month
Checkout for $108/yr
Secured by Stripe | AES-256 bit encryption