My Account
My Slides
Search by Category
Templates
Leave Feedback
Login
Logout
Get Started
Browse all Slides
Browse all Slides
Create a FREE Account
Instant access to 1,000+ real slides from top companies like McKinsey, BCG, Goldman Sachs, Google and many more!
First Name
Last Name
Email
Password
I agree to all
Terms & Privacy Policy
Thank you! Your submission has been received!
Oops! Something went wrong while submitting the form.
Have an account?
Sign in
📢 Ready to start building slides? Check out our new template library
VIEW TEMPLATES
Welcome,
Welcome
PRO
Show Featured Only
Checkbox 8
Companies
Mckinsey
Bain
BCG
EY
Deloitte
Accenture
PwC/Strategy&
JP Morgan
Goldman Sachs
Morgan Stanley
Citigroup
Deutsche Bank
Barclays
LEK
KPMG
Kearney
Oliver Wyman
Booz Allen Hamilton
Gartner
IPSOS
Nielsen
Slide type
Text Only
Linear Flow
Vertical Flow
Single Chart
Header Horizontal
Mixed Chart
Header Vertical
Pillar
Multiple Chart
Graphic
Agenda
Title
Table
Framework
Industry
Technology & Software
Artificial Intelligence
Financial Services
Retail & E-commerce
Consumer Goods
Industrial & Manufacturing
Transportation & Logistics
Telecommunications
Real Estate & Construction
Hospitality & Tourism
Professional Services
Education & Training
Media & Entertainment
Agriculture & Food Production
Healthcare & Pharmaceuticals
Environmental Services & Sustainability
Government & Public Sector
Use Case
Mergers and Acquisitions
Performance Metrics and KPIs
Client Case Studies
Competitive Landscape
Corporate Finance and Valuation
Product and Service Analysis
Customer and Market Segmentation
Organizational Structure and Change
Industry Overview
Regulatory and Compliance
Risk Assessment and Management
Investment Analysis
Organizational Structure and Change
Human Resources and Talent Management
Financial Performance
Market Analysis and Trends
Sales and Business Development
Human Resources and Talent Management
Clear all
Thank you! Your submission has been received!
Oops! Something went wrong while submitting the form.
Tag
View slide
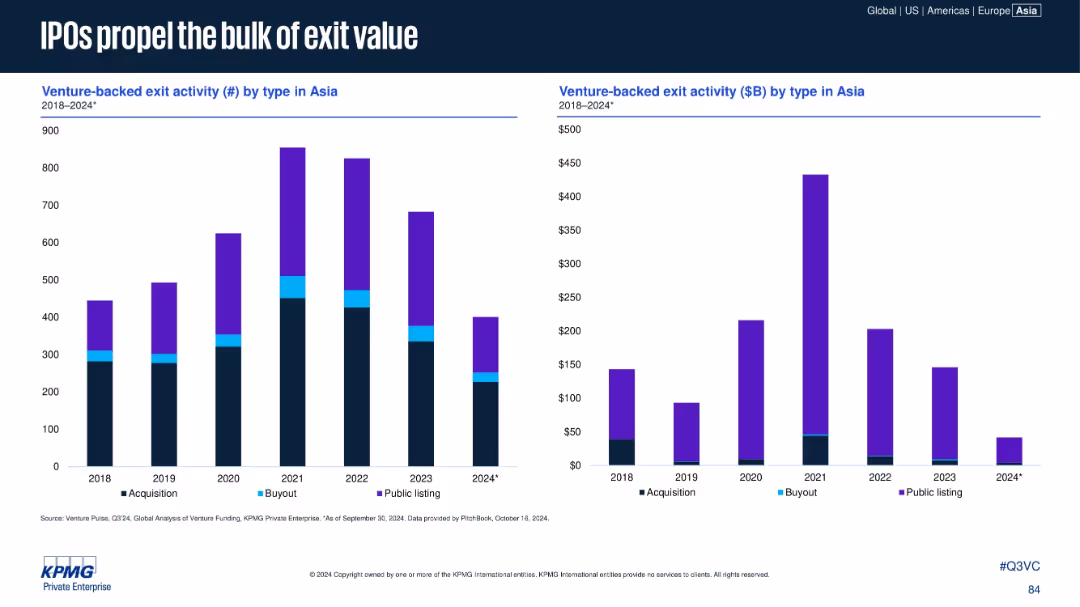
Two side-by-side bar charts comparing venture-backed exit activity in Asia (2018–2024) by type: number of exits and dollar value, color-coded for acquisitions, buyouts, and public listings.
Financial Performance
Financial Services
The slide highlights the dominance of IPOs in exit value among venture-backed companies in Asia, despite fluctuations in exit count. Public listings drive most exit value, peaking in 2021, while acquisitions dominate exit count. 2024 projections show a steep decline across all categories.
IPO, exit value, venture capital, Asia, public listing, acquisition, buyout, KPMG
false
Financial Performance
Financial Services financial-services
Multiple Chart
KPMG
View slide
Contains multiple sections comparing internal and external factors in IPO setups, using an orange and gray color scheme for clear differentiation.
Risk Assessment and Management
Financial Services
Explores the internal and external factors crucial in the IPO process, like timing, deal size, and choice of listing venue.
IPO, factors, internal, external, timing, deal size, listing venue
false
Risk Assessment and Management
Financial Services financial-services
Pillar
PwC/Strategy&
View slide
The slide features multiple pie charts, a stacked bar chart, and a data table. The layout is informative with a red and black color scheme emphasizing key data points.
Industry Overview
Financial Services
The slide provides empirical data on IPO costs from German IPOs, highlighting the major cost components such as bank fees and syndicate fees.
IPO, finance, banking, Germany, costs, empirical data, syndicate fees, bank fees
false
Industry Overview
Financial Services financial-services
Multiple Chart
PwC/Strategy&
View slide
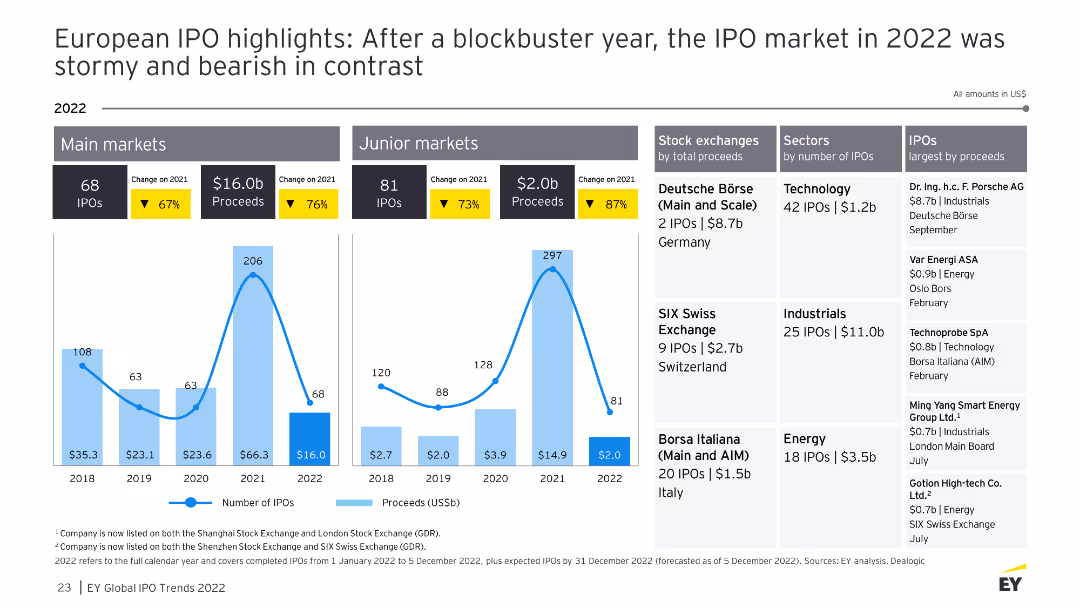
The slide features column charts comparing the number and proceeds of IPOs from 2018 to 2022 for main and junior markets. Additional tables provide details about stock exchanges, sectors, and notable IPOs.
Market Analysis and Trends
Financial Services
Highlights the significant decline in IPOs and proceeds in 2022 compared to 2021, with detailed data on market performance, stock exchanges, and sector contributions.
IPO, financial markets, Europe, trends, 2022
false
Market Analysis and Trends
Financial Services financial-services
Multiple Chart
EY
View slide
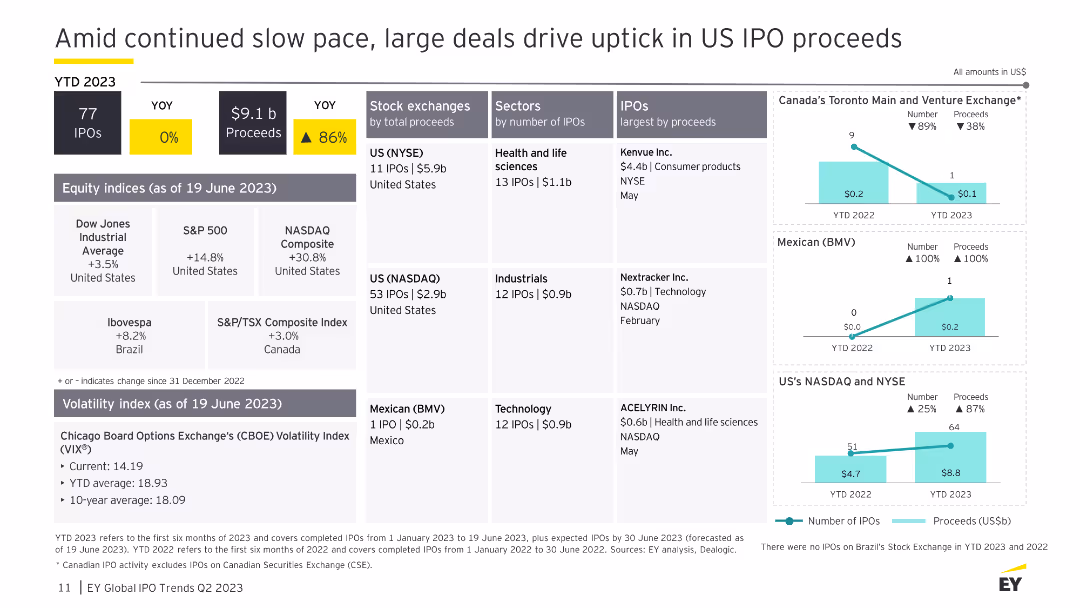
The slide contains a variety of data visualizations, including bar charts and tables, showing IPO activity and proceeds in the US for 2023. It uses yellow and black for highlighting key data points and includes multiple sections with detailed financial data. The layout is advanced, presenting a comprehensive data analysis.
Financial Performance
Financial Services
The slide provides an analysis of US IPO proceeds in 2023, highlighting the impact of large deals amid a slow overall pace. It includes detailed financial data, comparisons with previous years, and insights into various sectors and stock exchanges, offering a thorough review of the financial performance and trends in the IPO market.
IPO, financial performance, US, 2023, analysis
false
Financial Performance
Financial Services financial-services
Multiple Chart
EY
View slide
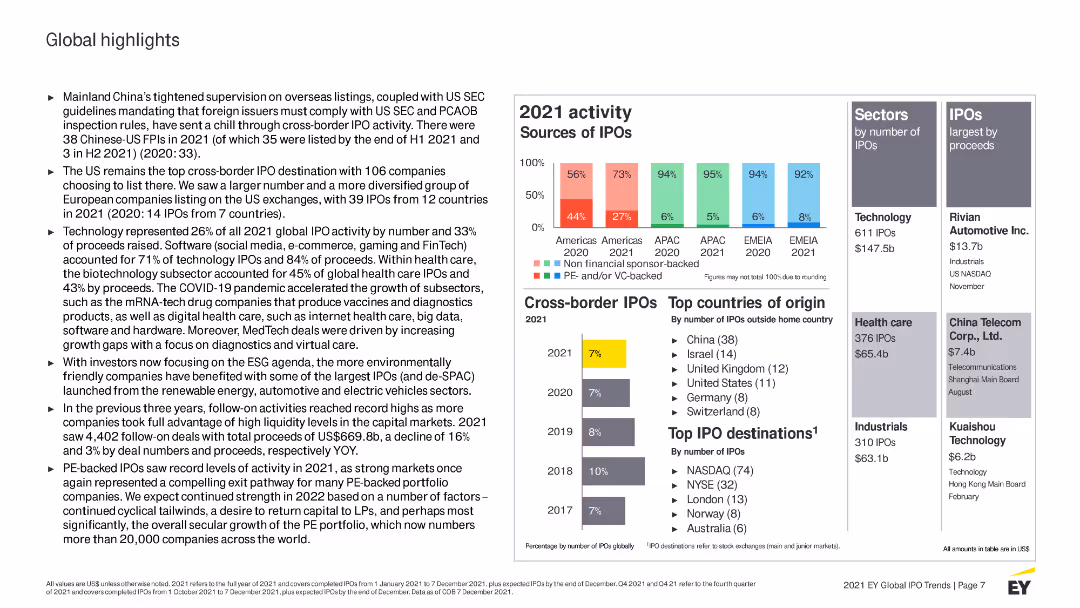
The slide includes bar charts and text sections summarizing key global IPO statistics for 2021, including sources of IPOs and top sectors. Highlights cross-border IPO activity and sector performance.
Market Analysis and Trends
Financial Services
Provides an overview of global IPO highlights in 2021, including major trends, sector performance, and cross-border activity. Emphasizes the role of technology and healthcare in driving market activity.
IPO, global, 2021 highlights, market trends, cross-border, technology, healthcare
false
Market Analysis and Trends
Financial Services financial-services
Multiple Chart
EY
View slide
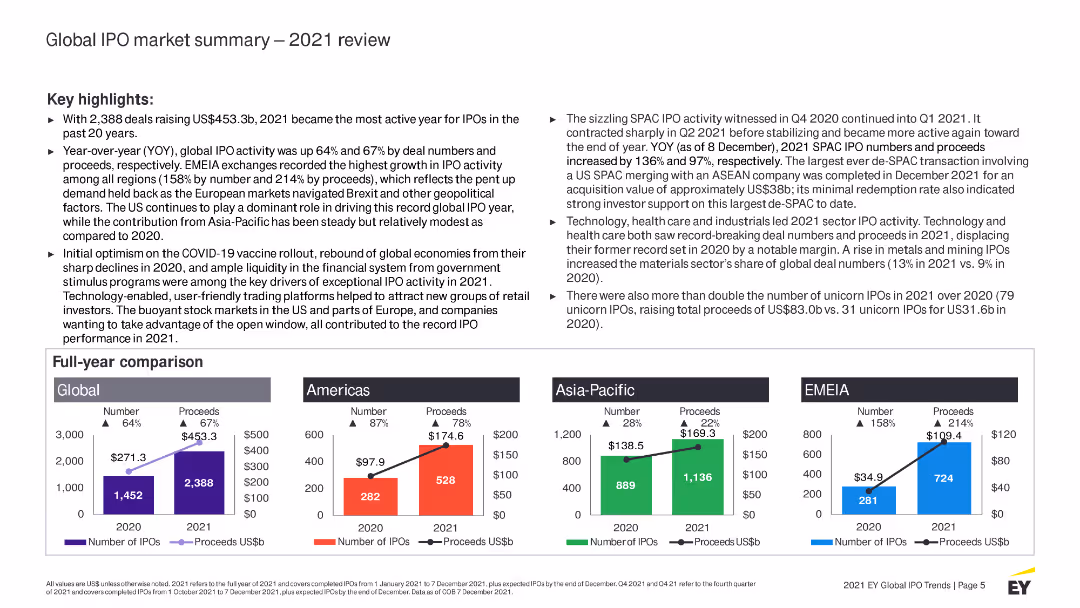
The slide presents a column chart comparing full-year IPO activity in 2020 and 2021 across global, Americas, Asia-Pacific, and EMEIA regions. Text sections review key highlights and sector performance.
Market Analysis and Trends
Financial Services
Reviews global IPO market performance in 2021, noting significant growth compared to 2020. Highlights key trends, sector performance, and the impact of SPACs on the market.
IPO, global, 2021 review, market summary, trends, financial services, SPACs, sector performance
false
Market Analysis and Trends
Financial Services financial-services
Multiple Chart
EY
View slide
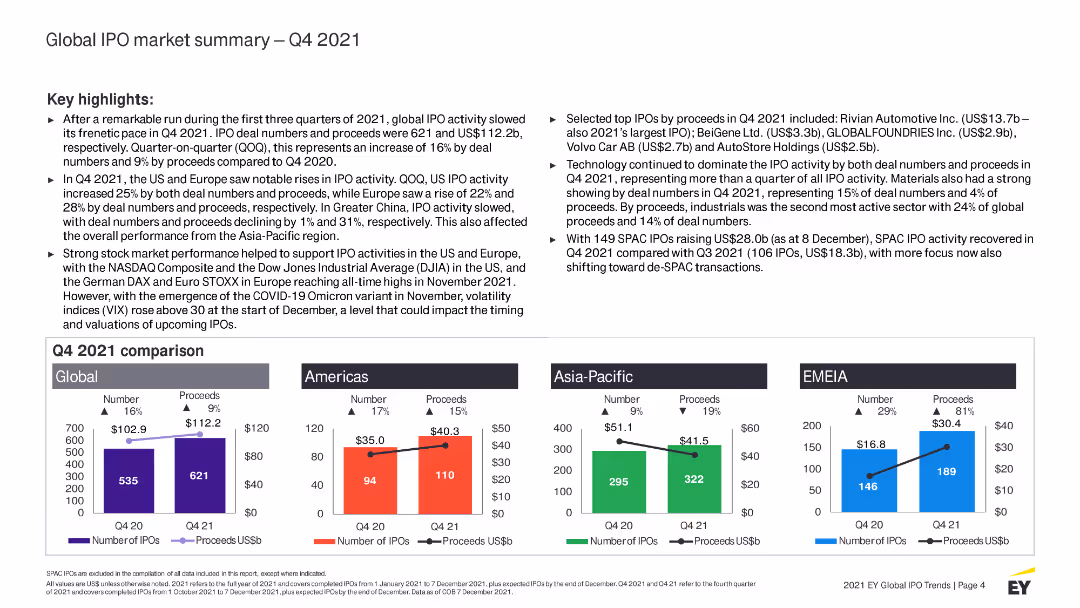
The slide includes a column chart comparing global, Americas, Asia-Pacific, and EMEIA IPO activity in Q4 2021. It also has text sections highlighting key trends and top IPOs by proceeds.
Market Analysis and Trends
Financial Services
Provides a summary of global IPO activity in Q4 2021, comparing regions and highlighting key trends. Discusses notable IPOs and sector performance, including technology and industrial sectors.
IPO, global, Q4 2021, market summary, trends, financial services, technology, industrial
false
Market Analysis and Trends
Financial Services financial-services
Multiple Chart
EY
View slide
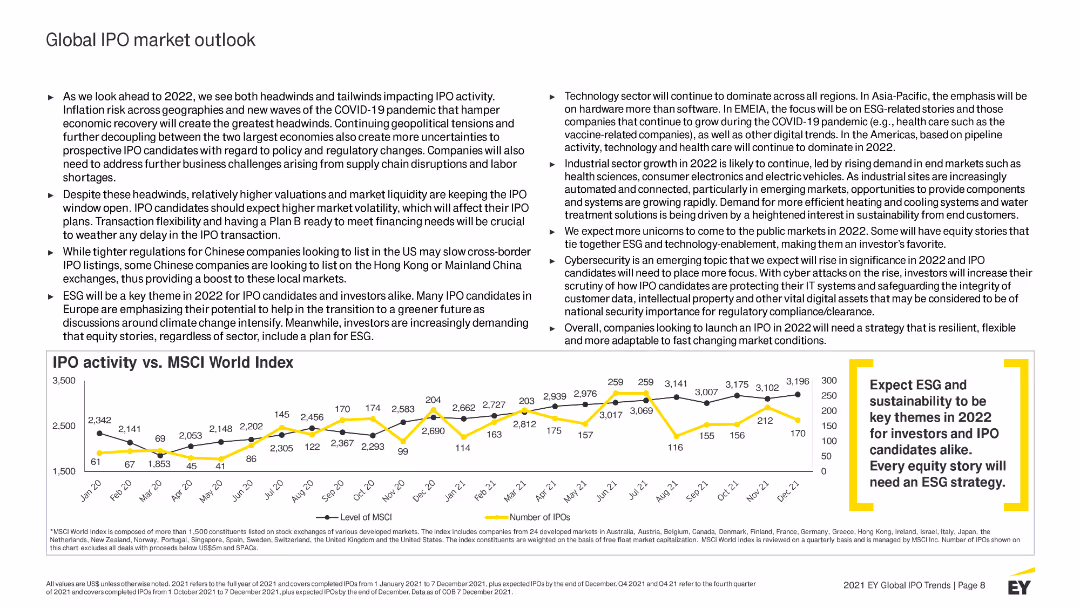
The slide features a line chart comparing IPO activity with the MSCI World Index from 2010 to 2022. Text sections discuss the outlook for global IPO markets, highlighting key trends and expected challenges.
Market Analysis and Trends
Financial Services
Analyzes the outlook for global IPO markets, noting potential headwinds and tailwinds. Discusses the impact of inflation, geopolitical tensions, and ESG considerations on future IPO activity.
IPO, global, market outlook, 2022, trends, challenges, financial services, ESG
false
Market Analysis and Trends
Financial Services financial-services
Mixed Chart
EY
View slide
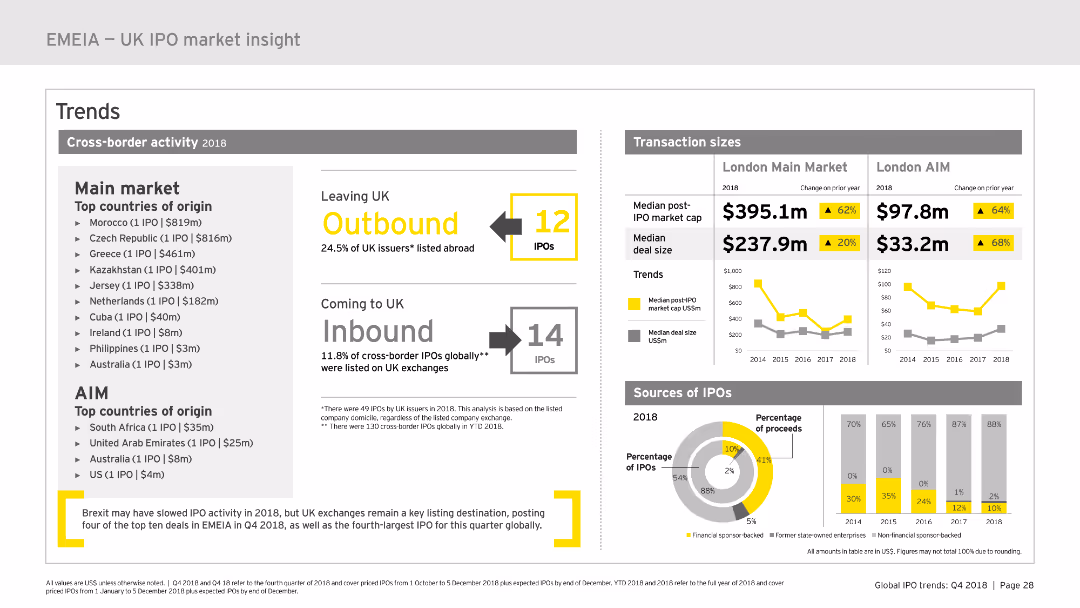
The slide features various charts including a column chart and a pie chart, highlighting cross-border IPO activity, transaction sizes, and sources of IPOs in 2018.
Market Analysis and Trends
Financial Services
Provides insights into cross-border IPO activity in the UK for 2018, highlighting outbound and inbound IPOs, transaction sizes, and IPO sources.
IPO, market cap, outbound, inbound, transaction size, median, deal size, percentage, financial services, 2018
false
Market Analysis and Trends
Financial Services financial-services
Multiple Chart
EY
View slide
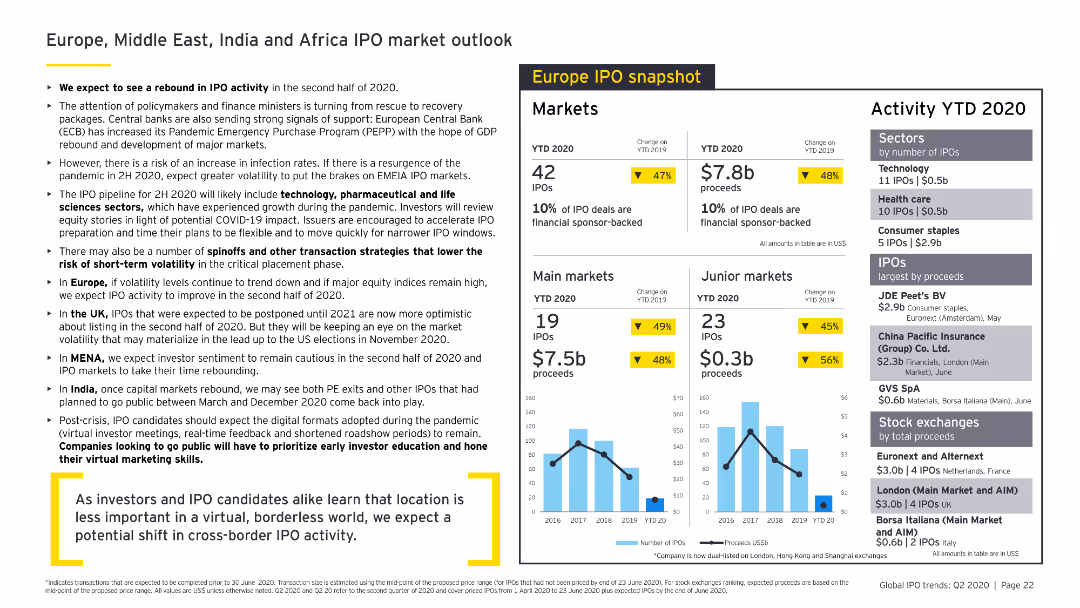
Contains a mix of bullet points, column charts, and data tables. The slide is densely packed with information, featuring various sections for different regions and industries.
Market Analysis and Trends
Financial Services
Provides an outlook on IPO markets in Europe, Middle East, India, and Africa for 2020, highlighting expected trends, market activities, and sector performance in various regions.
IPO, market outlook, Europe, Middle East, India, Africa
false
Market Analysis and Trends
Financial Services financial-services
Multiple Chart
EY
View slide
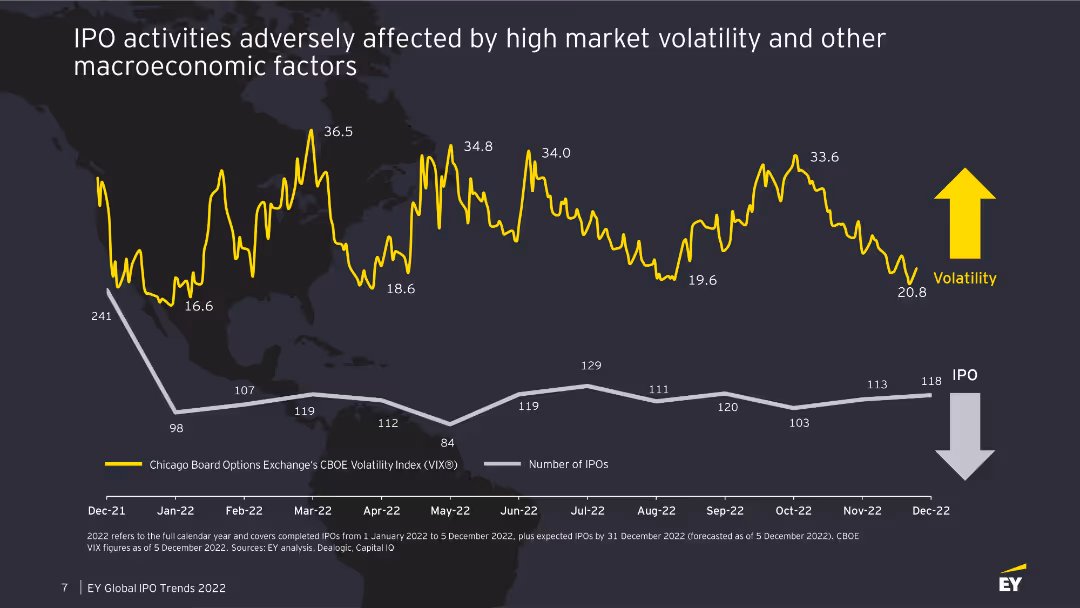
The slide features a line chart tracking the volatility index and the number of IPOs over time, with key data points highlighted. The background is a world map, adding a global context.
Market Analysis and Trends
Financial Services
The slide examines how high market volatility and macroeconomic factors have adversely affected IPO activities, showing a correlation between the volatility index and the number of IPOs from December 2021 to December 2022.
IPO, market volatility, VIX, macroeconomic factors
false
Market Analysis and Trends
Financial Services financial-services
Single Chart
EY
View slide
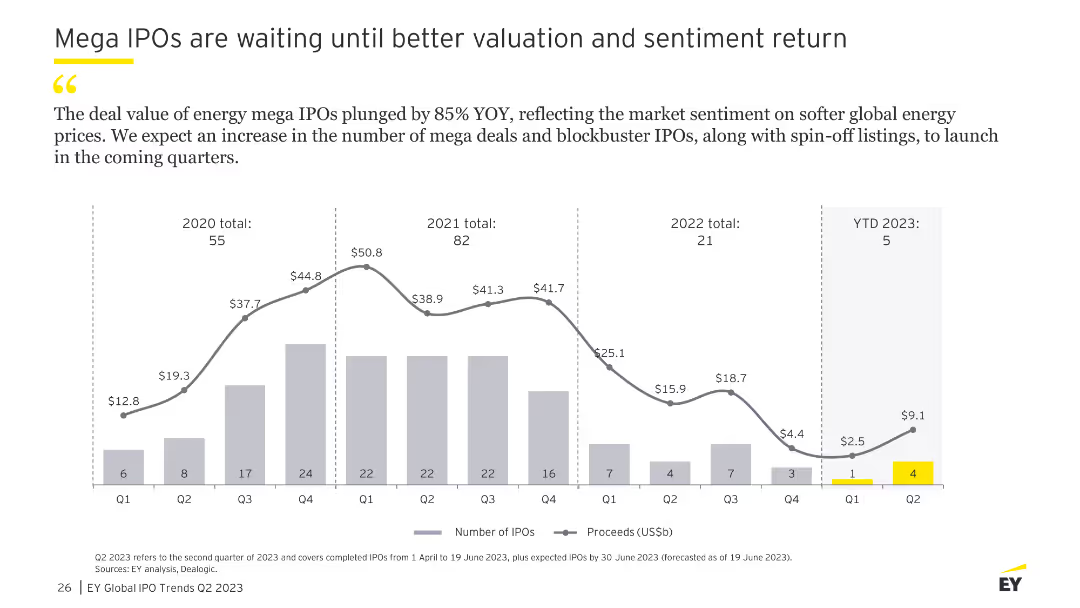
The slide features a column chart showing the number of mega IPOs and their proceeds from Q1 2020 to YTD 2023, with a focus on energy sector IPOs.
Market Analysis and Trends
Financial Services
This slide analyzes the trend of mega IPOs, particularly in the energy sector, noting a significant decline in deal value and an expectation for future increases as market sentiment improves.
IPO, mega deals, valuation, sentiment, energy
false
Market Analysis and Trends
Financial Services financial-services
Single Chart
EY
View slide
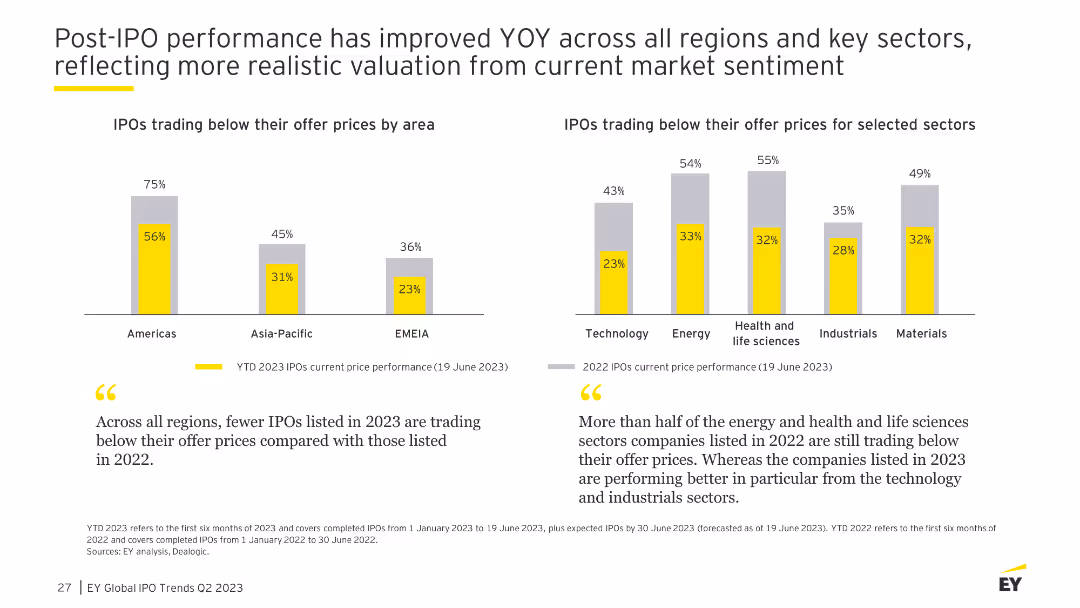
The slide includes bar charts showing the percentage of IPOs trading below their offer prices by region and sector, highlighting improvements in post-IPO performance.
Market Analysis and Trends
Financial Services
This slide discusses the year-over-year improvement in post-IPO performance across various regions and sectors, with detailed statistics on trading performance relative to offer prices.
IPO, performance, YOY, financial, regions
false
Market Analysis and Trends
Financial Services financial-services
Multiple Chart
EY
View slide
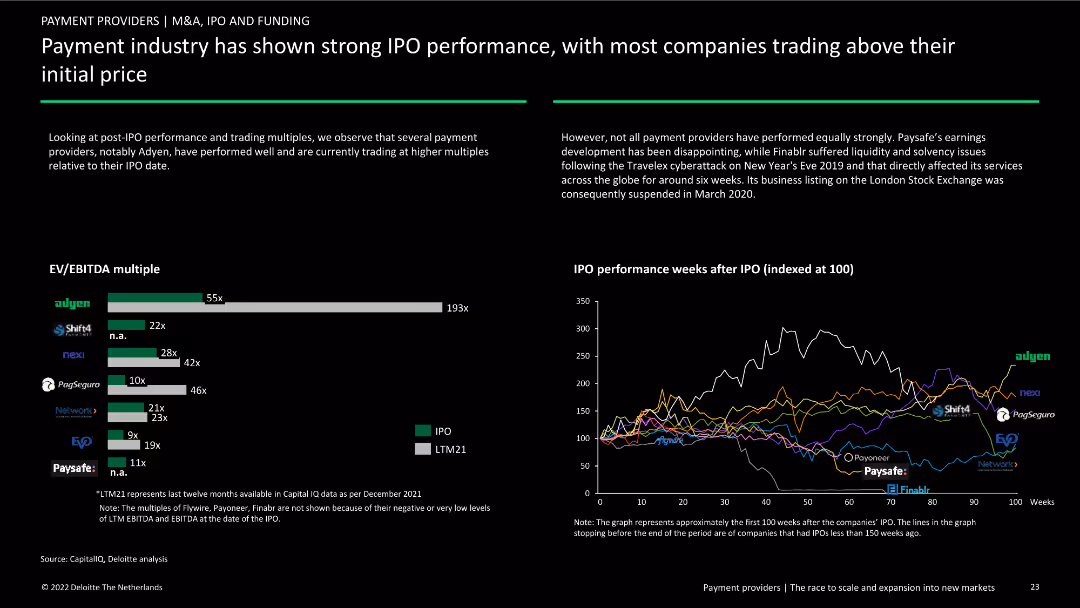
This slide features a horizontal bar chart (EV/EBITDA multiple) and a line chart (IPO performance weeks after IPO). The layout is dense with data visualizations and text sections on both sides.
Financial Performance
Financial Services
The slide analyzes the post-IPO performance and trading multiples of payment providers, highlighting companies like Adyen that are performing well, and discussing issues faced by others like Paysafe and Finablr.
IPO, performance, trading multiples, payment, analysis, Adyen, Paysafe, Finablr, EV/EBITDA, financial
false
Financial Performance
Financial Services financial-services
Multiple Chart
Deloitte
View slide
The slide features bar charts ranking stock exchanges by the number of IPOs and proceeds for YTD 2023, with a focus on Mainland China and India leading in global fundraising.
Market Analysis and Trends
Financial Services
This slide provides a comparative analysis of global stock exchanges, highlighting Mainland China's dominance in fundraising and India's leading position in deal count for YTD 2023.
IPO, stock exchange, China, India, fundraising
false
Market Analysis and Trends
Financial Services financial-services
Multiple Chart
EY
View slide
The slide presents column charts comparing the number and proceeds of IPOs by sector for YTD 2023 and YTD 2022, emphasizing technology and energy sectors.
Market Analysis and Trends
Financial Services
This slide highlights the leading role of technology companies in global IPO activities, while also noting a decline in energy sector deals due to softer global energy prices.
IPO, technology, global, energy, trends
false
Market Analysis and Trends
Financial Services financial-services
Multiple Chart
EY
View slide
This slide shows a detailed timeline with various phases of the IPO process, highlighted in orange and red, making significant milestones clear.
Strategic Planning
Financial Services
Provides a detailed IPO timeline, marking key activities and workstreams from preparation to the public phase, emphasizing the structured timeline of events.
IPO, timeline, activities, preparation, public phase
false
Strategic Planning
Financial Services financial-services
Table
PwC/Strategy&
View slide
The slide utilizes a clean layout with icons and text to discuss key factors like Equity Story and Financial Reporting in IPO processes.
Strategic Planning
Financial Services
This slide discusses the key elements that maximize value in an IPO, including equity stories, financial reporting, and the importance of internal setup and partners.
IPO, value, equity, financial reporting, partners, transparency, control
false
Strategic Planning
Financial Services financial-services
Pillar
PwC/Strategy&
View slide
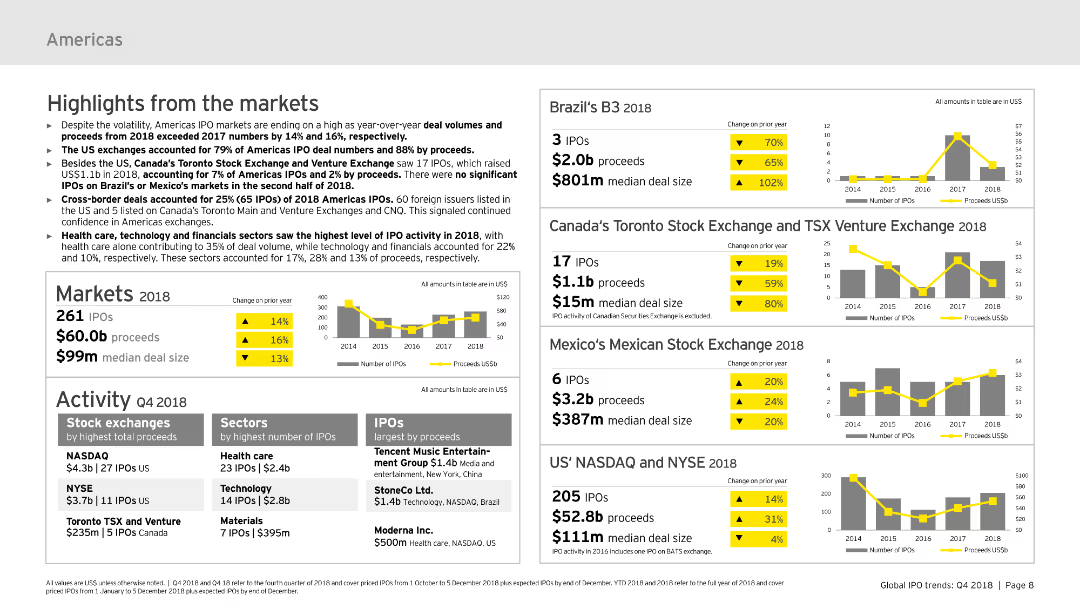
The slide includes text summaries and column charts showing market highlights for the Americas in 2018, focusing on IPO volumes, proceeds, and notable exchanges and sectors.
Market Analysis and Trends
Financial Services
This slide summarizes IPO market highlights for the Americas in 2018, discussing key market metrics, performance by stock exchanges, and sectors with the highest IPO activity.
IPOs, Americas, 2018, market highlights, sectors
false
Market Analysis and Trends
Financial Services financial-services
Multiple Chart
EY
View slide
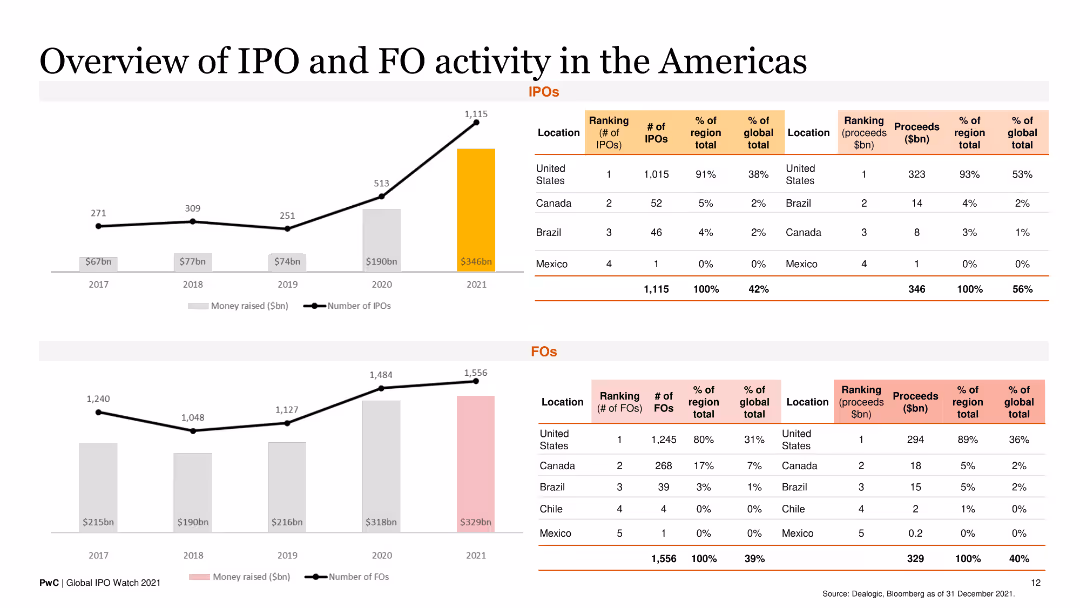
This slide has a combination of line charts and bar charts detailing the number and proceeds of IPOs and FOs in the Americas from 2017 to 2021, with a regional breakdown.
Market Analysis and Trends
Financial Services
It offers insights into the IPO and FO activities specific to the Americas, including regional rankings and proceeds, beneficial for market analysis.
IPOs, FOs, Americas, regional trends, financial analysis
false
Market Analysis and Trends
Financial Services financial-services
Multiple Chart
PwC/Strategy&
View slide
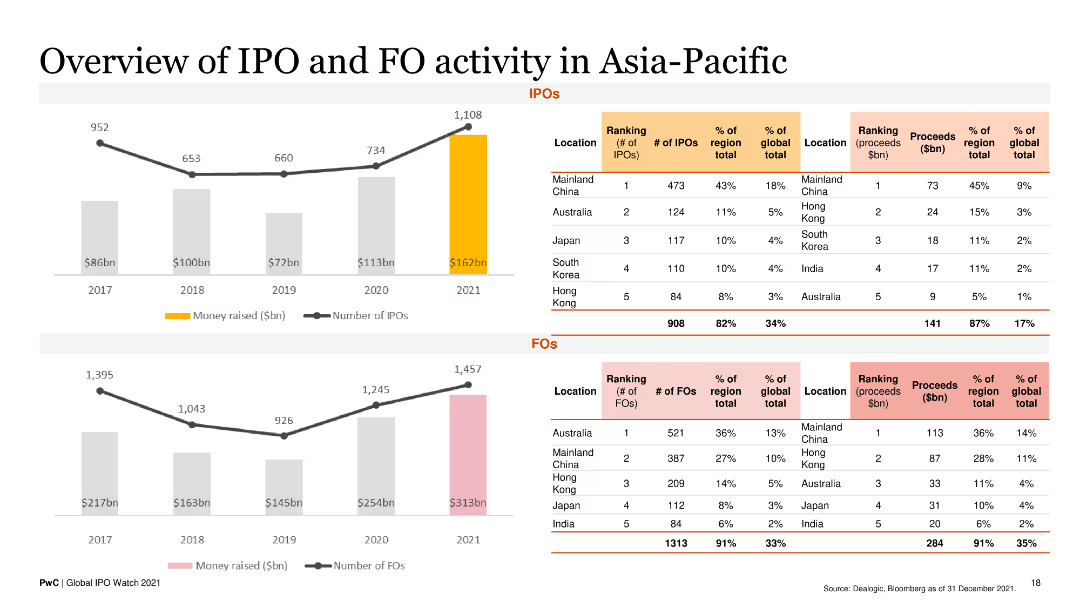
This slide contains line and column charts showing the number and proceeds of IPOs and FOs in the Asia-Pacific region from 2017 to 2021, with a regional breakdown.
Market Analysis and Trends
Financial Services
It offers insights into IPO and FO activities in the Asia-Pacific region, highlighting key countries and financial performance, useful for market analysis.
IPOs, FOs, Asia-Pacific, regional trends, financial analysis
false
Market Analysis and Trends
Financial Services financial-services
Multiple Chart
PwC/Strategy&
View slide
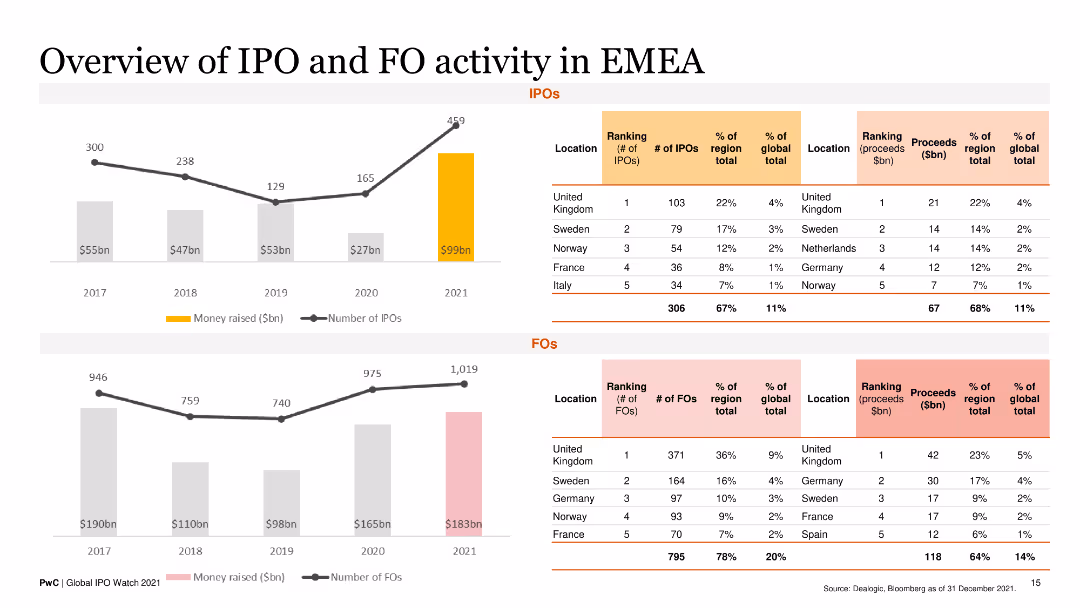
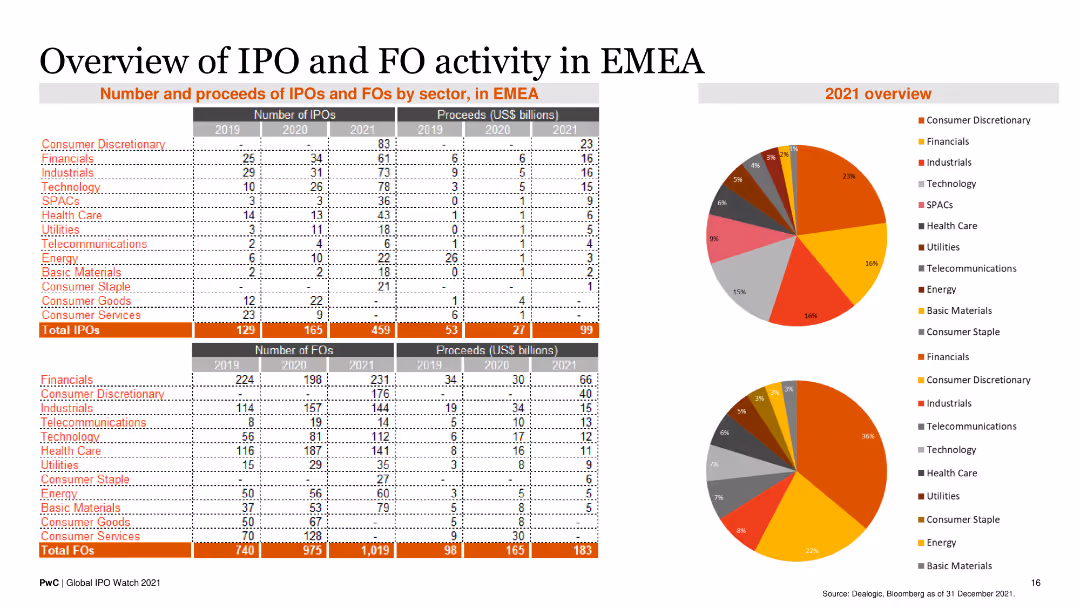
This slide presents line charts and column charts showing the number and proceeds of IPOs and FOs in EMEA from 2017 to 2021, with a regional ranking breakdown.
Market Analysis and Trends
Financial Services
It offers a detailed analysis of IPO and FO activities in the EMEA region, highlighting key countries and financial performance over the years.
IPOs, FOs, EMEA, regional trends, financial analysis
false
Market Analysis and Trends
Financial Services financial-services
Multiple Chart
PwC/Strategy&
View slide
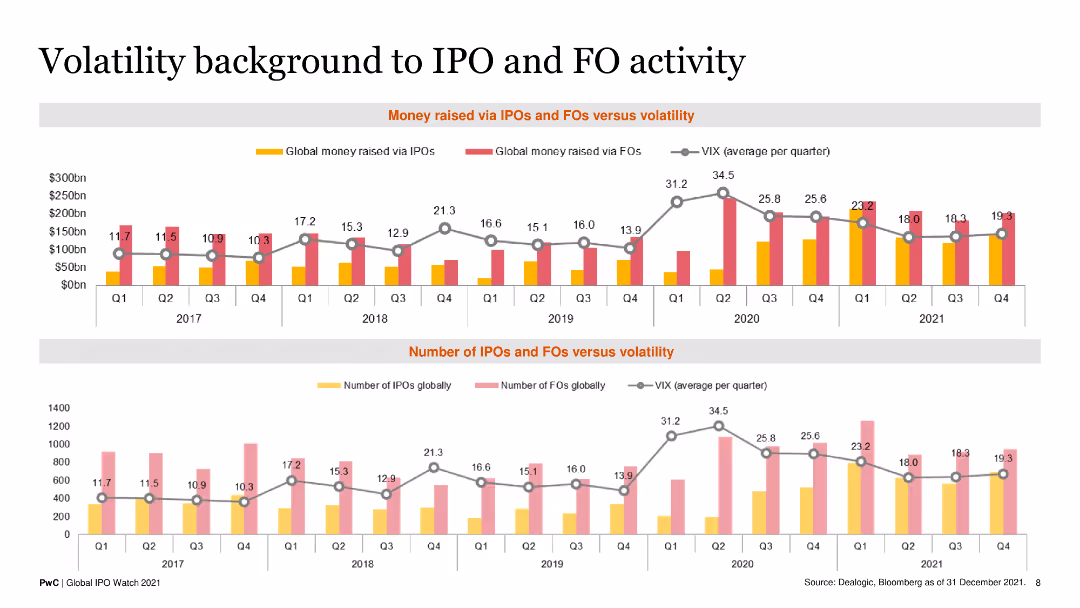
The slide features two line and column combination charts showing global money raised via IPOs and FOs against the VIX index from Q1 2017 to Q4 2021.
Risk Assessment and Management
Financial Services
This slide correlates the volatility index (VIX) with the number of IPOs and FOs, providing insights into market stability and investment trends.
IPOs, FOs, VIX index, market volatility, financial performance
false
Risk Assessment and Management
Financial Services financial-services
Multiple Chart
PwC/Strategy&
View slide
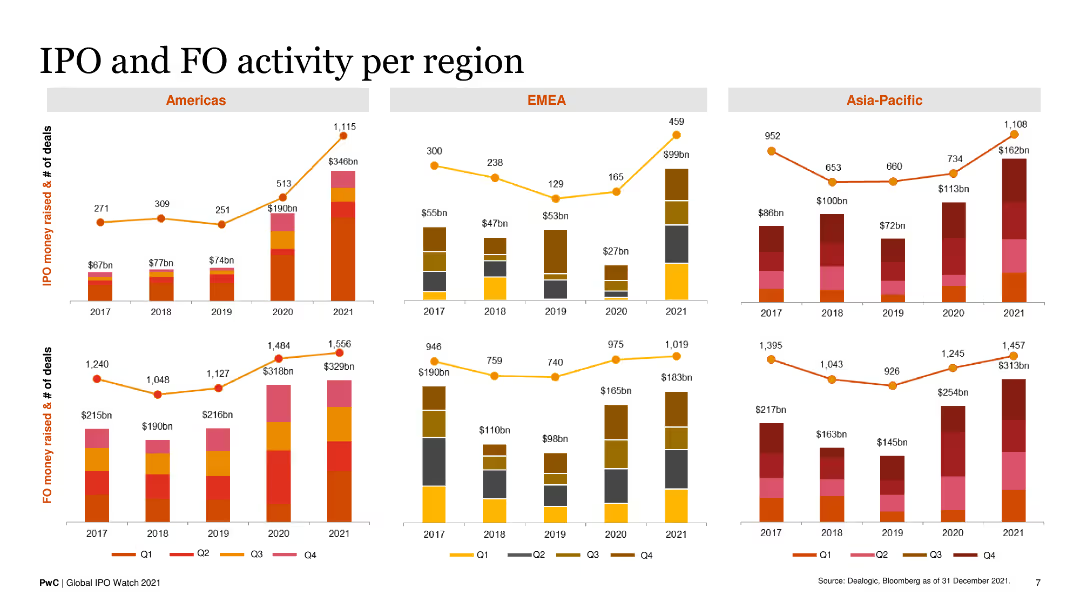
The slide has three sets of column charts, each representing IPO and FO activities by quarter in the Americas, EMEA, and Asia-Pacific regions from 2017 to 2021.
Market Analysis and Trends
Financial Services
It offers a detailed analysis of IPO and FO trends across three major regions, illustrating money raised and number of deals over the years.
IPOs, FOs, regional trends, financial data, quarterly analysis
false
Market Analysis and Trends
Financial Services financial-services
Multiple Chart
PwC/Strategy&
View slide
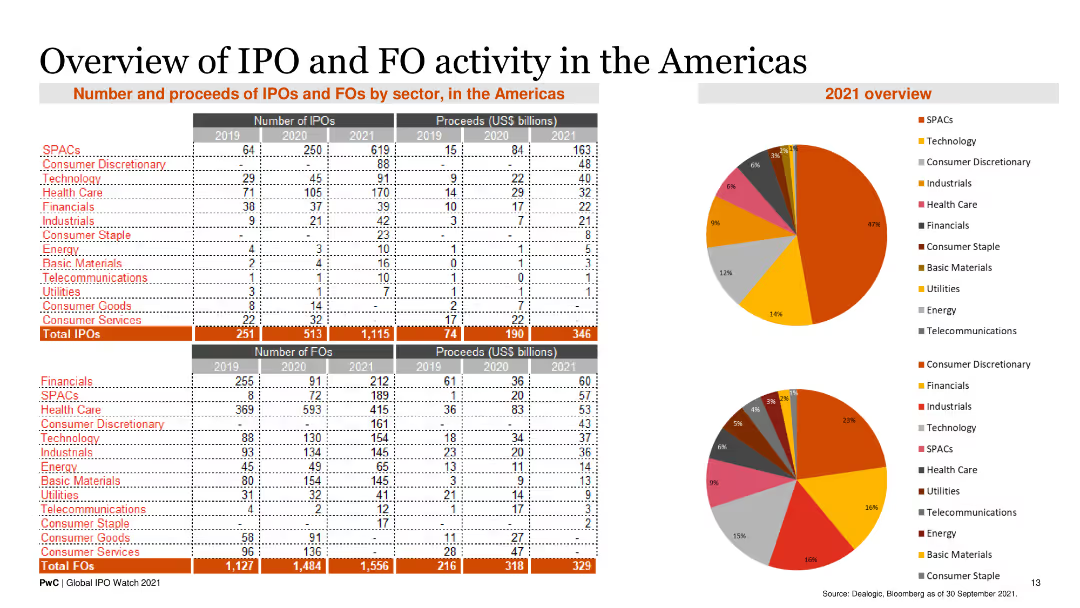
The slide includes tables and pie charts detailing the number and proceeds of IPOs and FOs by sector in the Americas for 2019, 2020, and 2021, along with sector breakdowns.
Market Analysis and Trends
Financial Services
It provides detailed data on IPO and FO activities in the Americas, broken down by sector, helping to understand market dynamics and sector performance.
IPOs, FOs, sector analysis, Americas, financial data
false
Market Analysis and Trends
Financial Services financial-services
Multiple Chart
PwC/Strategy&
View slide
The slide includes tables and pie charts displaying the number and proceeds of IPOs and FOs by sector in the EMEA region for 2019, 2020, and 2021, along with sector breakdowns.
Market Analysis and Trends
Financial Services
It provides a comprehensive overview of IPO and FO activities in EMEA by sector, useful for understanding market trends and sector-specific performance.
IPOs, FOs, sector analysis, EMEA, financial data
false
Market Analysis and Trends
Financial Services financial-services
Multiple Chart
PwC/Strategy&
View slide
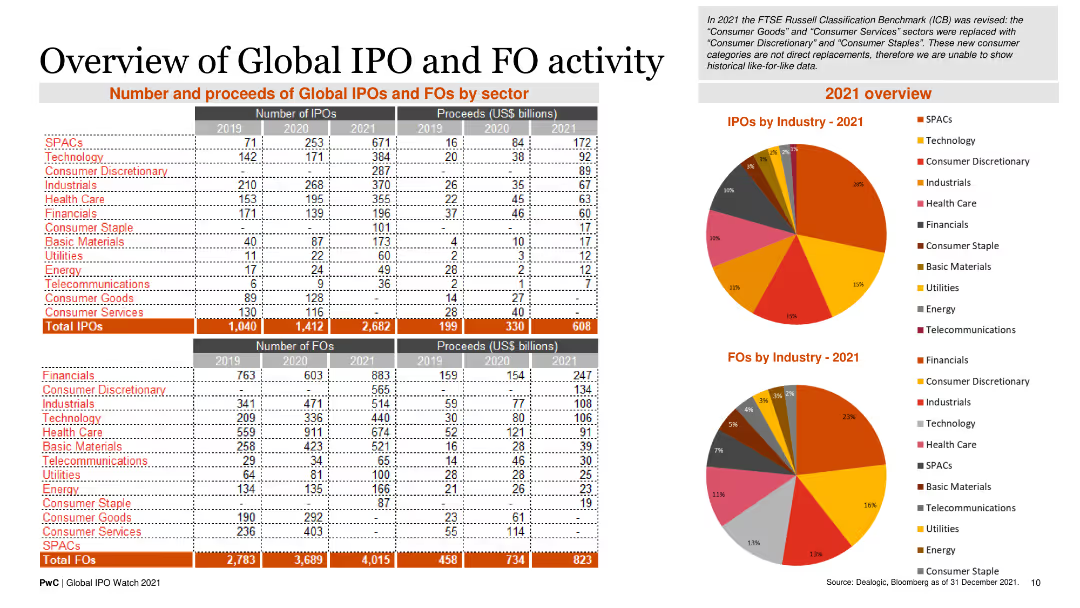
The slide comprises tables and pie charts showing the number and proceeds of global IPOs and FOs by sector for the years 2019, 2020, and 2021, along with sector breakdowns.
Market Analysis and Trends
Financial Services
It provides a comprehensive overview of IPO and FO activities by sector, including total numbers and proceeds, along with sector-specific insights.
IPOs, FOs, sector analysis, global trends, financial data
false
Market Analysis and Trends
Financial Services financial-services
Multiple Chart
PwC/Strategy&
View slide
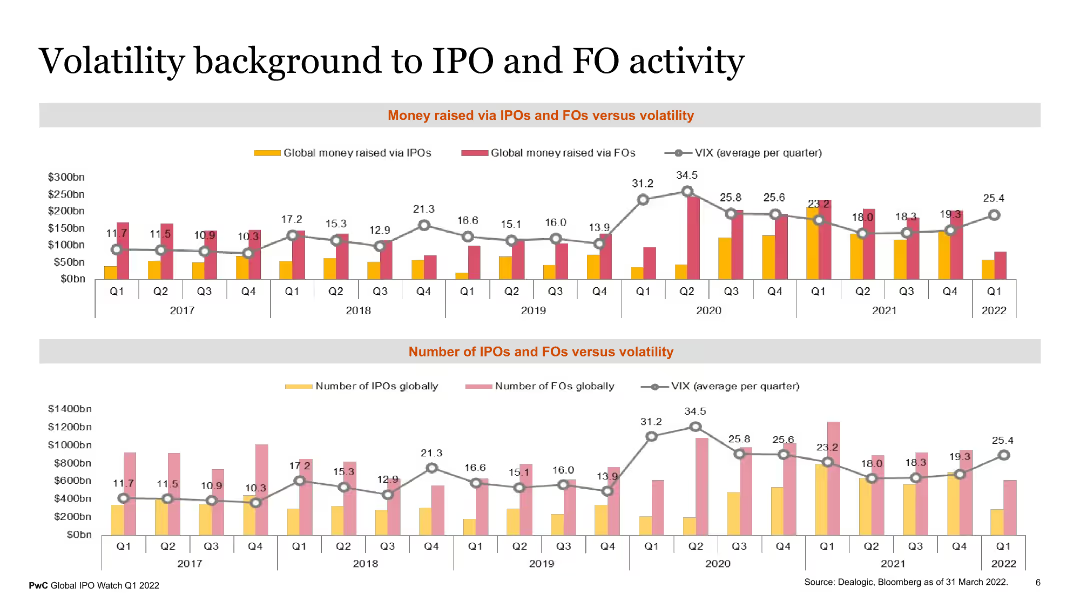
The slide features two column charts comparing money raised via IPOs and FOs versus volatility and the number of IPOs and FOs versus volatility from 2017 to Q1 2022. Each chart uses colored bars and a line graph to depict data points.
Market Analysis and Trends
Financial Services
This slide shows the relationship between market volatility and the financial activities of IPOs and FOs over several years. It highlights trends in capital raised and number of deals, providing insights for financial analysts and investors.
IPOs, FOs, volatility, financial trends, capital raised
false
Market Analysis and Trends
Financial Services financial-services
Multiple Chart
PwC/Strategy&
View slide
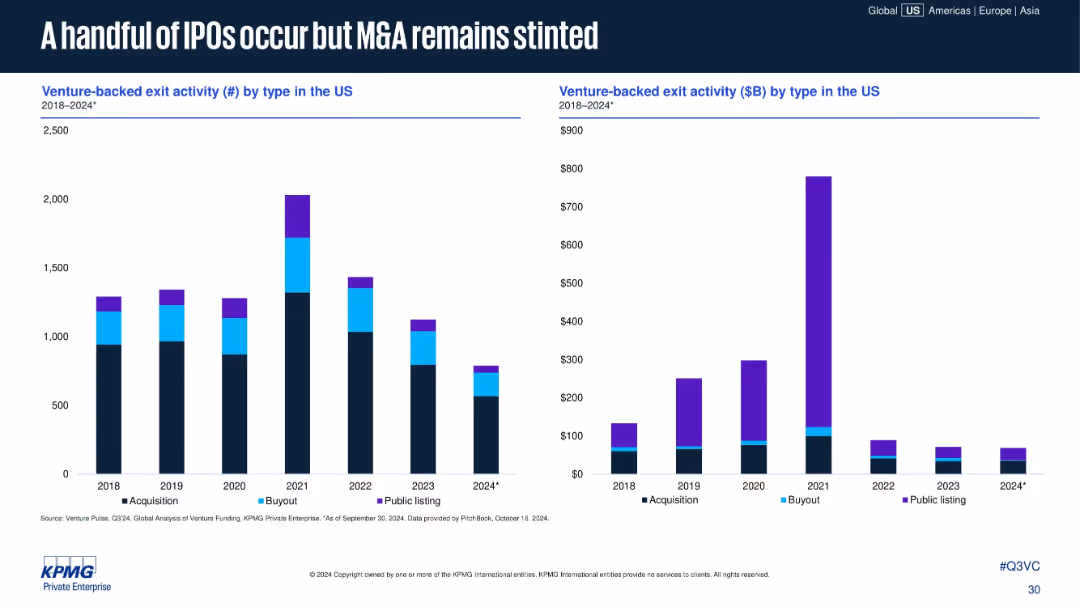
Two vertical bar charts: left shows number of exits by type; right shows exit value ($B) by type. Color-coded by acquisition, buyout, and public listing.
Mergers and Acquisitions
Financial Services
Public listings have dropped significantly since 2021, with M&A dominating exit types. Total exit values are down across the board, showing limited liquidity events and a slowdown in large-scale buyouts and IPOs.
IPOs, M&A, buyouts, exit activity, venture exits, liquidity events, public listing decline, 2024 exits
false
Mergers and Acquisitions
Financial Services financial-services
Multiple Chart
KPMG
Previous
Loading...
Hold On!
We are searching in our database
If nothing, comes up, please try different filters!
Column Chart
Heatmap
Chevron
Org Chart
Infographic
Callouts
Timeline
List
Graphic
Picture
Process Flow
Diagram
Paragraph
Map
Table
Framework
Subtitle
Takeaway Box
Icon
Other Chart
Radar Chart
Waterfall Chart
Mekko Chart
Pie Chart
Scatter Plot
Line Chart
Bar chart
Bullet points
Create a FREE account to continue browsing
Receive Instant Access to 1,000+ slides from companies like McKinsey, Google, and Goldman Sachs
First Name
Last Name
Email
Password
I agree to all
Terms & Privacy Policy
Thank you! Your submission has been received!
Oops! Something went wrong while submitting the form.
Have an account?
Sign in
Upgrade to PRO to Save slides
Advanced Search and Filters
Access to 15,000+ slides
Access to Category Pages
Save/Bookmark Slides
PowerPoint Template Library
Pick a Plan
MONTHLY
$12/month
Billed every month, Cancel anytime.
YEARLY
$9/year
Billed $108 annually, Cancel anytime.
Checkout for $12/month
Checkout for $108/yr
Secured by Stripe | AES-256 bit encryption