My Account
My Slides
Search by Category
Templates
Leave Feedback
Login
Logout
Get Started
Browse all Slides
Browse all Slides
Create a FREE Account
Instant access to 1,000+ real slides from top companies like McKinsey, BCG, Goldman Sachs, Google and many more!
First Name
Last Name
Email
Password
I agree to all
Terms & Privacy Policy
Thank you! Your submission has been received!
Oops! Something went wrong while submitting the form.
Have an account?
Sign in
📢 Ready to start building slides? Check out our new template library
VIEW TEMPLATES
Welcome,
Welcome
PRO
Show Featured Only
Checkbox 8
Companies
Mckinsey
Bain
BCG
EY
Deloitte
Accenture
PwC/Strategy&
JP Morgan
Goldman Sachs
Morgan Stanley
Citigroup
Deutsche Bank
Barclays
LEK
KPMG
Kearney
Oliver Wyman
Booz Allen Hamilton
Gartner
IPSOS
Nielsen
Slide type
Text Only
Linear Flow
Vertical Flow
Single Chart
Header Horizontal
Mixed Chart
Header Vertical
Pillar
Multiple Chart
Graphic
Agenda
Title
Table
Framework
Industry
Technology & Software
Artificial Intelligence
Financial Services
Retail & E-commerce
Consumer Goods
Industrial & Manufacturing
Transportation & Logistics
Telecommunications
Real Estate & Construction
Hospitality & Tourism
Professional Services
Education & Training
Media & Entertainment
Agriculture & Food Production
Healthcare & Pharmaceuticals
Environmental Services & Sustainability
Government & Public Sector
Use Case
Mergers and Acquisitions
Performance Metrics and KPIs
Client Case Studies
Competitive Landscape
Corporate Finance and Valuation
Product and Service Analysis
Customer and Market Segmentation
Organizational Structure and Change
Industry Overview
Regulatory and Compliance
Risk Assessment and Management
Investment Analysis
Organizational Structure and Change
Human Resources and Talent Management
Financial Performance
Market Analysis and Trends
Sales and Business Development
Human Resources and Talent Management
Clear all
Thank you! Your submission has been received!
Oops! Something went wrong while submitting the form.
Tag
View slide
Features a bar graph with different industries represented by colored bars, indicating the percentage breakdown of survey respondents.
Market Analysis and Trends
Media & Entertainment
Provides an industry breakdown of survey participants, which can be used for analyzing market distribution and consumer segments.
Industry Breakdown, Survey Respondents, Market Distribution, Consumer Segments, Percentage Breakdown
false
Market Analysis and Trends
Media & Entertainment media-and-entertainment
Single Chart
Kearney
View slide
The slide shows a stacked bar graph comparing the office dependency of various industries. The green shades represent different work models from fully remote to fully office-based.
Market Analysis and Trends
Professional Services
This analysis is critical for understanding industry-specific work patterns, potentially used by managers to benchmark their own company's remote work policies.
Industry Comparison, Office Dependency, Work Patterns, Benchmarking, Remote Work
false
Market Analysis and Trends
Professional Services professional-services
Single Chart
EY
View slide
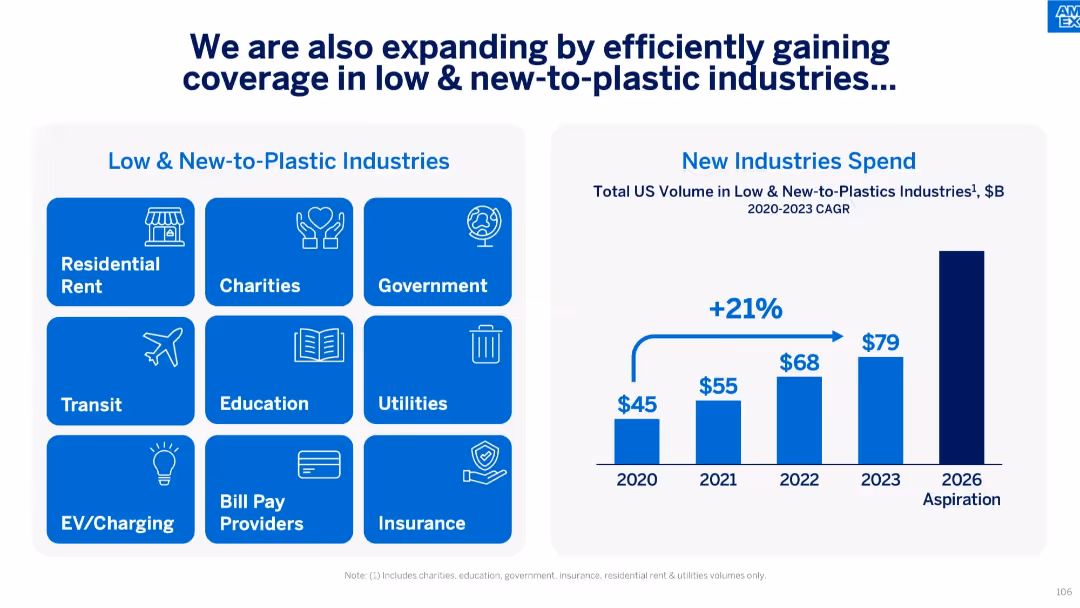
Left: grid of icons and industries; Right: bar chart showing industry volume growth from 2020 to 2023 and aspiration for 2026.
Market Analysis and Trends
Financial Services
The slide details expansion into low and new-to-plastic industries such as rent, education, and utilities. It shows a 21% CAGR in volume from 2020–2023, with expectations of further growth by 2026.
Industry Expansion, Low-to-Plastic, Growth, Volume, Education, Rent, Utilities, Spend
false
Market Analysis and Trends
Financial Services financial-services
Mixed Chart
McKinsey
View slide
A mixed format slide, combining column chart, pie charts, and iconographic bullets. The colors are muted tones of gray, green, and blue, highlighting specific metrics and stats.
Market Analysis and Trends
Financial Services
It presents the financial industry's challenges and the strategies to maintain performance, growth in ETFs, and value beyond products, emphasizing strong investment and client experience.
Industry Headwinds, Investment Performance, ETF Growth, Client Experience, Financial Services, Strategy, Value, Solutions
false
Market Analysis and Trends
Financial Services financial-services
Multiple Chart
JP Morgan
View slide
This slide uses a table format to present examples of industry players in Web3, with a column for industry, example, and description. The design is straightforward with a white background and colored icons for visual differentiation.
Industry Overview
Technology & Software
Provides examples of influential companies and initiatives within various industries that are leveraging Web3 technologies, such as the USDF consortium in financial services and Nike's acquisition in gaming.
Industry Players, Web3, Innovation, Case Studies
false
Industry Overview
Technology & Software technology-and-software
Header Vertical
McKinsey
View slide
Stacked bar graph showing the expected personalization approach across industries, with a focus on the move away from mass production.
Market Analysis and Trends
Retail & E-commerce
Details the shift towards personalization in industry product strategies by 2026, signaling a move away from solely mass-produced goods.
Industry Trends, Personalization, Mass Production, Strategic Planning, Bar Graph
false
Market Analysis and Trends
Retail & E-commerce retail-and-e-commerce
Single Chart
Kearney
View slide
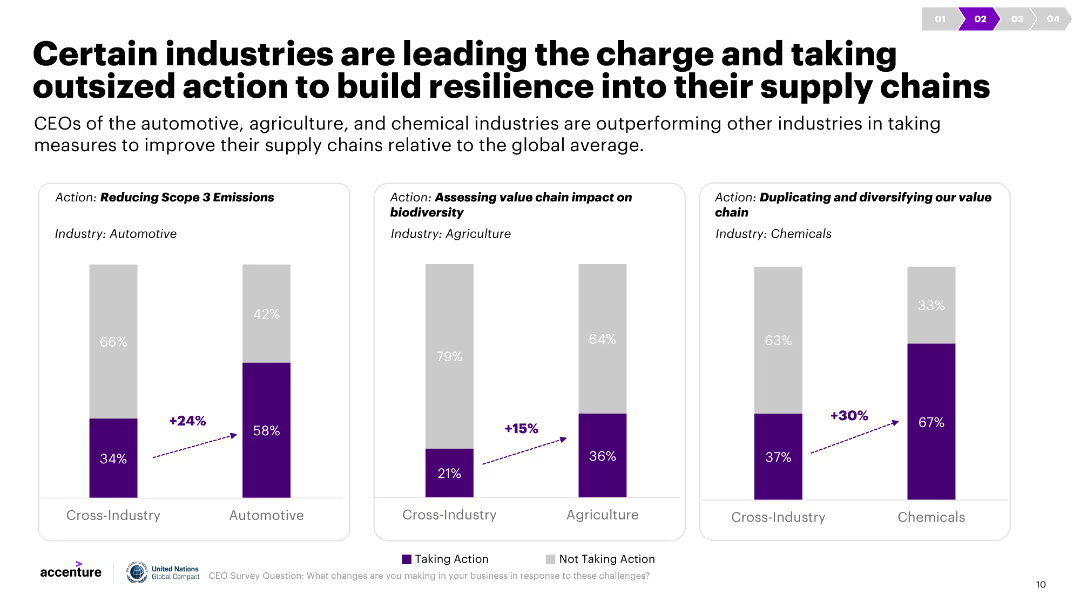
Three column charts illustrate actions taken by different industries to improve supply chain resilience, with cross-industry comparisons. Commentary explains the data.
Strategic Planning
Transportation & Logistics
The slide compares the automotive, agriculture, and chemical industries' efforts to improve supply chain resilience, highlighting measures like emissions reduction and biodiversity assessments.
Industry actions, supply chain, resilience, automotive, agriculture, chemicals
false
Strategic Planning
Transportation & Logistics transportation-and-logistics
Multiple Chart
Accenture
View slide
Moderate visual complexity, the slide displays a matrix linking key industry sectors with specific automation applications that address the megatrends discussed earlier. It includes icons and a clear layout to illustrate these connections.
Technology and Digital Transformation
Industrial & Manufacturing
The slide delves into how new process automation applications are being deployed across various industry sectors in response to overarching megatrends. It explores specific examples within sectors, providing insights into the operational applications of these technologies.
Industry applications, Process automation, Sector-specific, Deployment
false
Technology and Digital Transformation
Industrial & Manufacturing industrial-and-manufacturing
Table
LEK
View slide
Bar chart showing industry growth expectations and inflation sentiment. Majority bars are green and blue indicating positive/accurate sentiment.
Market Analysis and Trends
Financial Services
This slide presents industry growth expectations for 2023 and respondents' sentiments on inflation rates, suggesting that most expect growth despite low reported inflation.
Industry growth, inflation, expectations, sentiment, 2023, survey, respondents, positive, accuracy
false
Market Analysis and Trends
Financial Services financial-services
Multiple Chart
EY
View slide
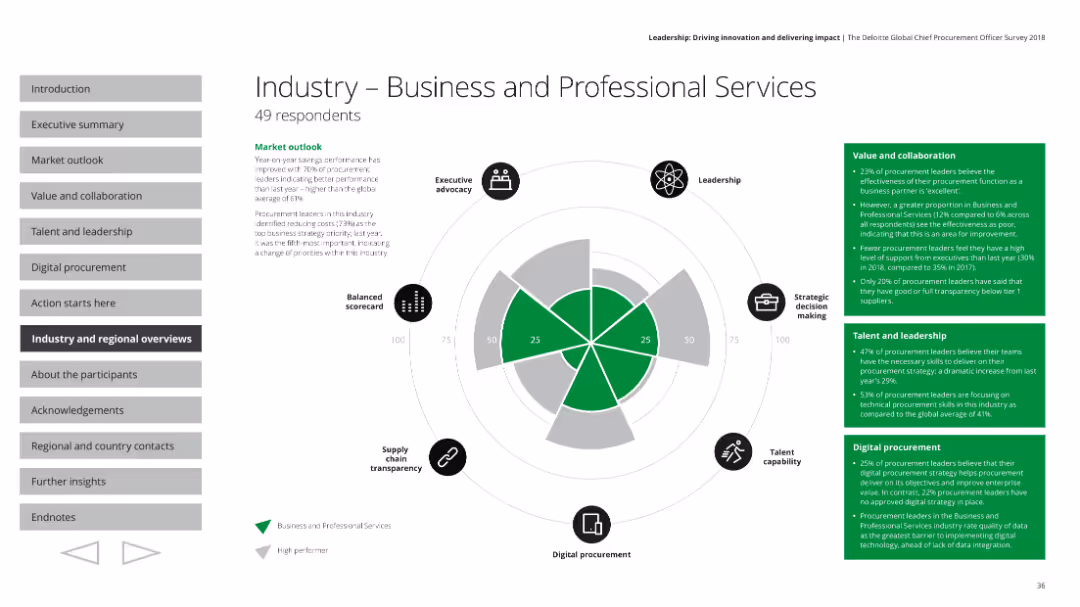
Includes a radar chart and text blocks summarizing key performance areas like market outlook, value and collaboration, and leadership in the industry.
Industry Overview
Professional Services
Provides an overview of the business and professional services industry, detailing performance metrics, strategic priorities, and leadership challenges.
Industry overview, performance, strategy, leadership
false
Industry Overview
Professional Services professional-services
Mixed Chart
Deloitte
View slide
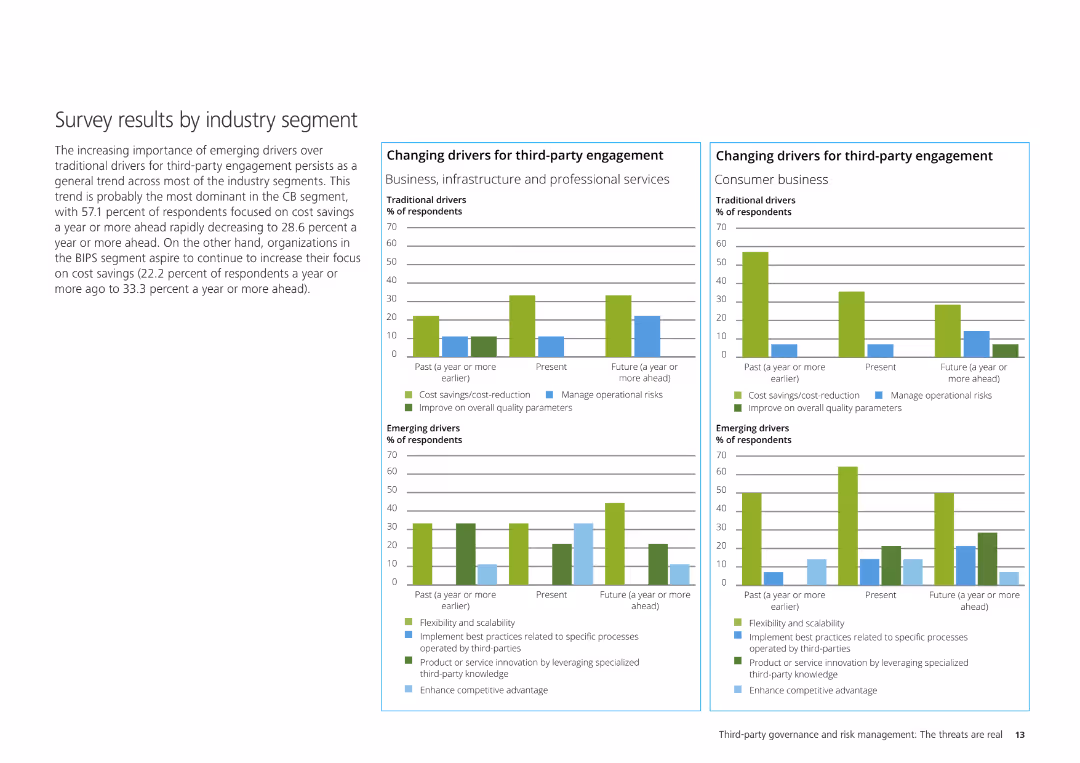
The slide contains three column charts displaying the changing drivers for third-party engagement across Business, Infrastructure & Professional Services, and Consumer.
Market Analysis and Trends
Professional Services
It shows survey results segmented by industry, analyzing traditional and emerging drivers for third-party engagement within specific industry segments.
Industry segment, third-party engagement, survey results, traditional drivers, emerging drivers
false
Market Analysis and Trends
Professional Services professional-services
Multiple Chart
Deloitte
View slide
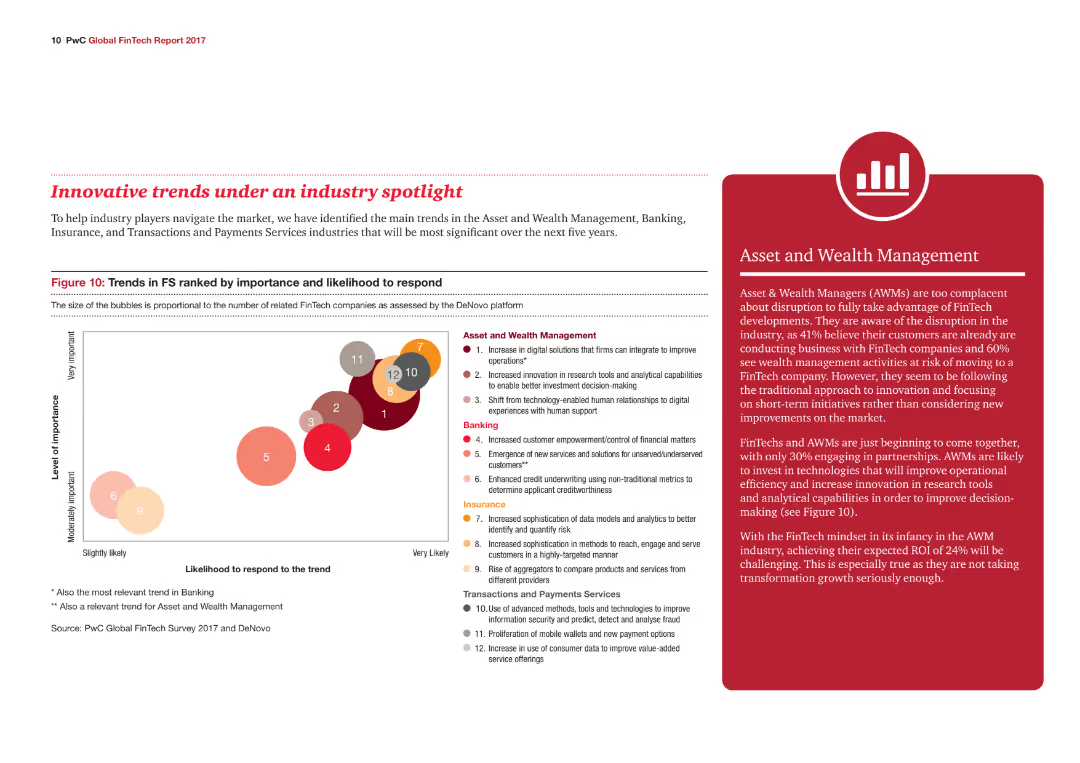
A bubble chart ranks trends in the financial services industry by importance and likelihood to respond, with different colored bubbles representing various industry trends.
Market Analysis and Trends
Financial Services
The slide outlines key trends in Asset and Wealth Management, Banking, Insurance, and Transactions and Payments Services, highlighting their importance and response likelihood.
Industry trends, Financial Services, Wealth Management, Banking, Insurance
false
Market Analysis and Trends
Financial Services financial-services
Mixed Chart
PwC/Strategy&
View slide
The slide features a column chart on the left side, text with icons in the middle, and a list of priorities on the right. The background shows shipping containers.
Market Analysis and Trends
Professional Services
It compares 3PE maturity across industries, expectations versus surprises in the 2022 study, and top priorities for 2022. It is used for highlighting industry trends.
Industry trends, procurement, priorities, maturity, expectations, surprises, collaboration, resilience
false
Market Analysis and Trends
Professional Services professional-services
Mixed Chart
Kearney
View slide
The slide features a column chart on the left side, text with icons in the middle, and a list of priorities on the right. The background shows shipping containers.
Market Analysis and Trends
Professional Services
It compares 3PE maturity across industries, expectations versus surprises in the 2022 study, and top priorities for 2022. It is used for highlighting industry trends.
Industry trends, procurement, priorities, maturity, expectations, surprises, collaboration, resilience
false
Market Analysis and Trends
Professional Services professional-services
Multiple Chart
Kearney
View slide
Column charts for portfolio loans and line graph for utilization trend, accompanied by a small pie chart and key statistics in a tabular format. Clear segmentation of data.
Financial Performance
Industrial & Manufacturing
Focuses on commercial and industrial loan portfolio details with trends and key statistics. It can be used to track the performance and risk of loans in the industrial sector, helping stakeholders make informed decisions about lending and financial management.
Industry, Loans, Risk, Performance, Trends
false
Financial Performance
Industrial & Manufacturing industrial-and-manufacturing
Multiple Chart
Morgan Stanley
View slide
Uses icons and bullet points to represent 18 focus industries, with side panels discussing market strategies related to the innovation and green economy.
Industry Overview
Financial Services
Highlights the benefits of JPMorgan’s industry-specific coverage model, which enhances client value and risk management through specialized knowledge and sector-specific solutions.
Industry-Specific, Risk Management, Banking, Client Value, Innovation, Green Economy
false
Industry Overview
Financial Services financial-services
Table
JP Morgan
View slide
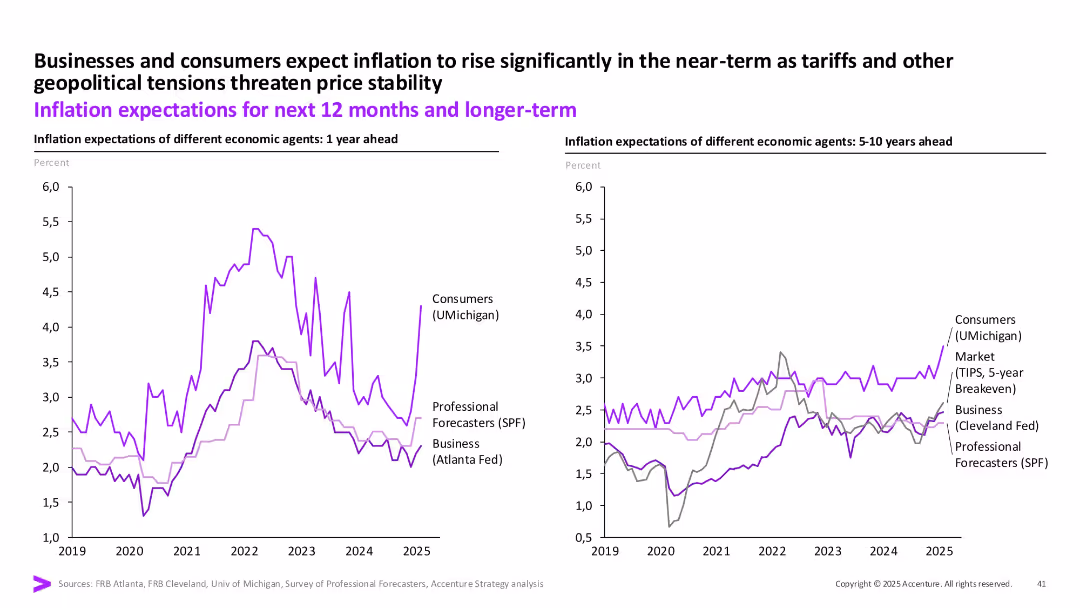
Two line charts comparing 1-year and 5–10-year inflation expectations from consumers, businesses, and forecasters from 2019 to 2025.
Risk Assessment and Management
Financial Services
This slide outlines inflation expectations across different time horizons and agent types. Near-term expectations rise due to geopolitical pressures, while long-term forecasts show more stability across groups.
Inflation Expectations, Forecasting, Risk, Short-term vs Long-term, Consumers, Businesses, 2025
false
Risk Assessment and Management
Financial Services financial-services
Multiple Chart
Accenture
View slide
The slide has a dual-axis line chart showing the University of Michigan survey inflation expectations for one-year ahead (in blue) and five to ten years ahead (in orange) from 2012 to 2022. The chart exhibits upward trends, especially in the one-year ahead predictions.
Market Analysis and Trends
Financial Services
This slide depicts the short-term and medium-term inflation expectations based on survey data, useful for discussing consumer sentiment, economic outlook, and monetary policy considerations. It highlights the importance of inflation expectations in economic forecasting and strategy formulation.
Inflation Expectations, Survey Data, Economic Forecasting, Short-term, Medium-term, Consumer Sentiment, Michigan Survey
false
Market Analysis and Trends
Financial Services financial-services
Single Chart
JP Morgan
View slide
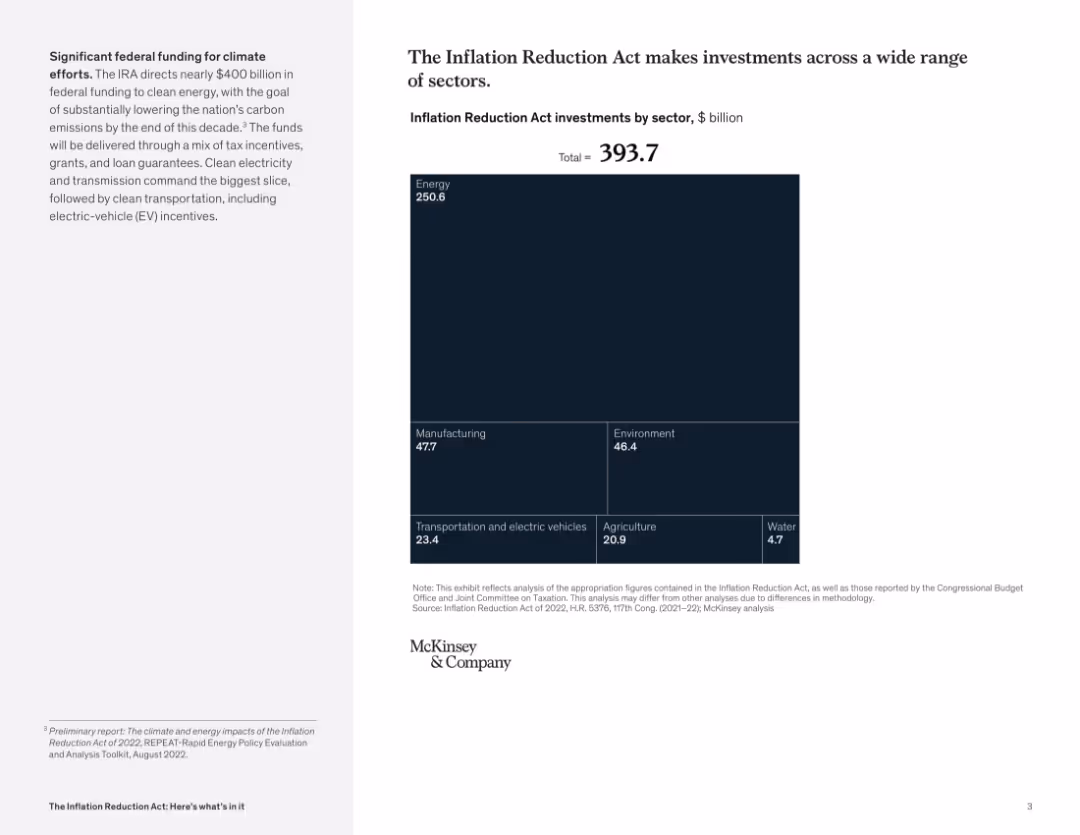
Right-aligned slide with a large square treemap chart showing $393.7B in IRA investments by sector; small text explanation on the left panel. Dark blue color scheme.
Strategic Planning
Government & Public Sector
The slide illustrates the allocation of nearly $400B from the Inflation Reduction Act across multiple sectors, with the majority directed toward energy, manufacturing, environment, and transportation. It visually emphasizes the energy sector as the largest recipient.
Inflation Reduction Act, funding, sectors, energy, manufacturing, environment, EV, investment, climate
false
Strategic Planning
Government & Public Sector government-and-public-sector
Mixed Chart
McKinsey
View slide
The slide displays a dual-axis line chart of US and Euro area 5yr/5yr inflation swaps from 2005 to 2021. The US is depicted in blue and the Euro area in orange, with both lines fluctuating over time and providing a comparative view of market expectations for inflation.
Investment Analysis
Financial Services
The slide examines market perceptions of inflation through the lens of US and Euro area inflation swaps, suggesting a view of recent increases as mainly transitory. It could be used to inform discussions on investment risk, market sentiment, and long-term economic projections.
Inflation Swaps, Market Sentiment, US, Euro Area, Investment Risk, Economic Projections, Transitory Inflation
false
Investment Analysis
Financial Services financial-services
Single Chart
JP Morgan
View slide
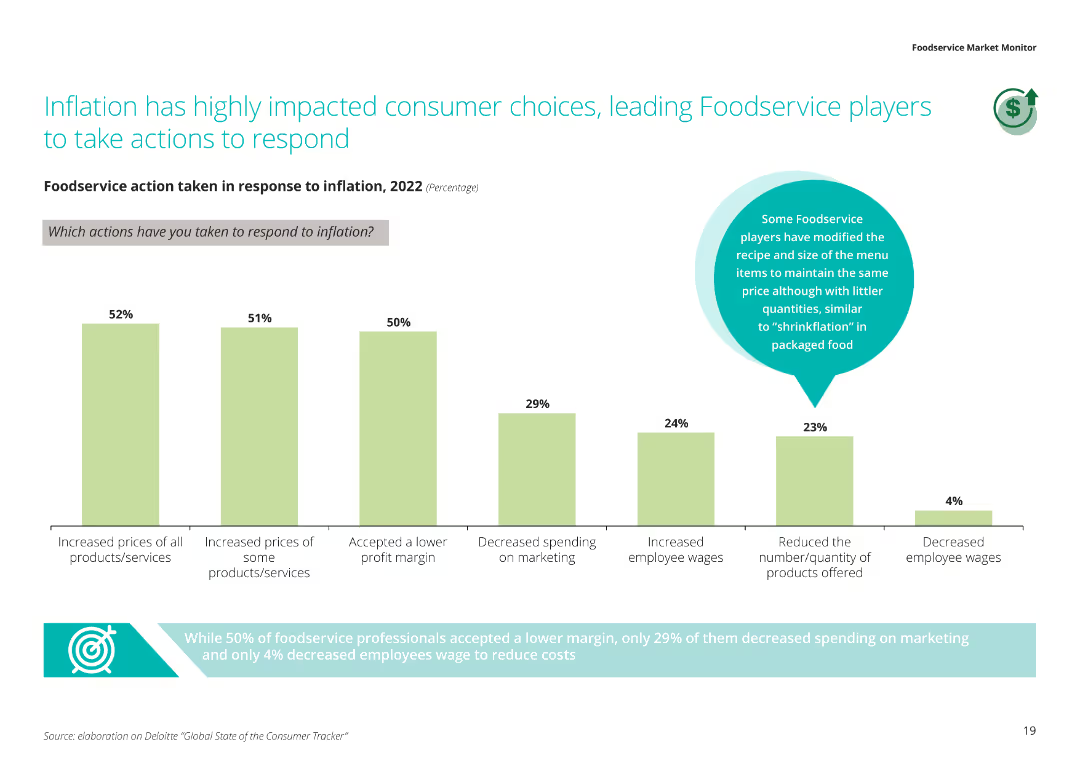
The slide shows a column chart detailing the actions taken by foodservice providers in response to inflation, including price increases, lower profit margins, and changes in marketing and wages.
Market Analysis and Trends
Hospitality & Tourism
This slide analyzes the impact of inflation on consumer choices and the subsequent actions taken by foodservice providers, such as increasing prices and accepting lower profit margins.
Inflation impact, consumer choices, foodservice actions, price increases, lower profit margins
false
Market Analysis and Trends
Hospitality & Tourism hospitality-and-tourism
Single Chart
Deloitte
View slide
The slide lists seven strategies for managing inflation with icons and brief descriptions for each rule. The background is segmented into 'Fight,' 'Manage,' and 'Leverage.'
Operational Efficiency
Consumer Goods
It provides seven strategies for tackling inflation, emphasizing competitive sourcing, supply availability, commodity price risk management, and supply chain optimization.
Inflation management, competitive sourcing, supply availability, price risk, supply chain, strategies, cost structure
false
Operational Efficiency
Consumer Goods consumer-goods
Multiple Chart
Kearney
View slide
The slide lists seven strategies for managing inflation with icons and brief descriptions for each rule. The background is segmented into 'Fight,' 'Manage,' and 'Leverage.'
Operational Efficiency
Consumer Goods
It provides seven strategies for tackling inflation, emphasizing competitive sourcing, supply availability, commodity price risk management, and supply chain optimization.
Inflation management, competitive sourcing, supply availability, price risk, supply chain, strategies, cost structure
false
Operational Efficiency
Consumer Goods consumer-goods
Table
Kearney
View slide
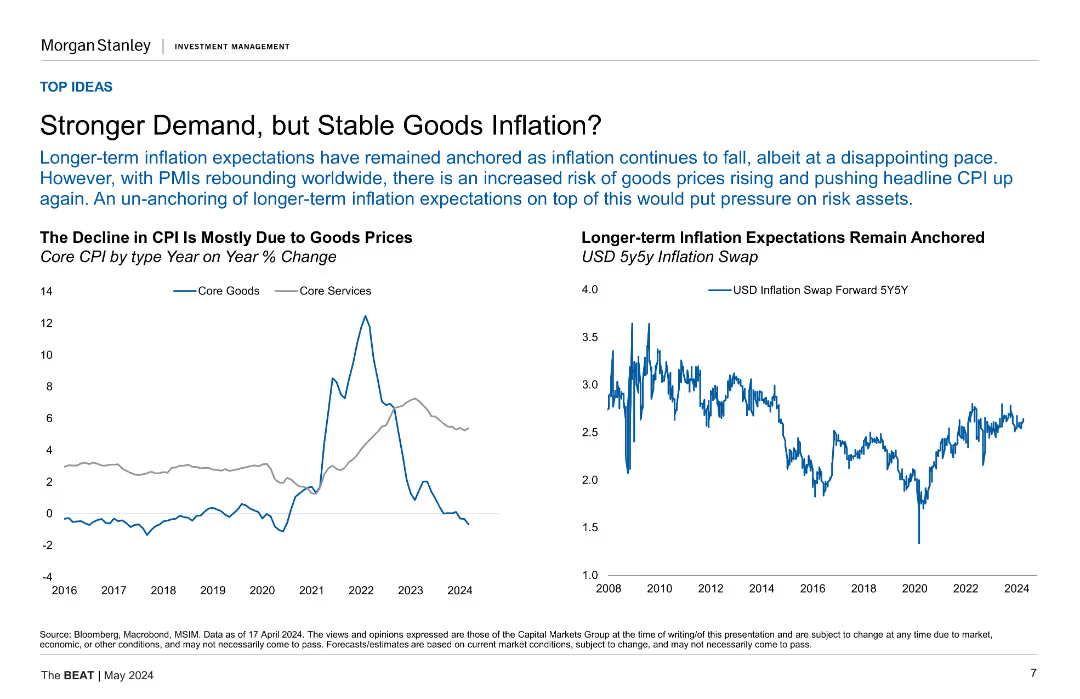
The slide features two line charts side by side. The left chart shows Core CPI by type (Goods and Services) over time, with data points from 2016 to 2024. The right chart displays USD 5y5y Inflation Swap rates from 2008 to 2024.
Market Analysis and Trends
Financial Services
The slide discusses how long-term inflation expectations have remained anchored despite recent CPI declines due to stable goods prices, while also highlighting the risks of rising goods prices amid rebounding PMIs.
Inflation, CPI, Core Goods, Core Services, USD, 5y5y, Inflation Swap, PMIs, Market Trends
false
Market Analysis and Trends
Financial Services financial-services
Multiple Chart
Morgan Stanley
View slide
This slide displays a line chart of CPI inflation in developed markets over a period spanning from the 1970s to the 2020s. The x-axis marks the years while the y-axis shows the percentage change. The chart shows significant fluctuations, with notable peaks and troughs.
Market Analysis and Trends
Financial Services
The slide presents historical data of CPI inflation in developed markets, with an emphasis on the trends over the past five decades. This could be used to analyze economic patterns, predict future inflation trends, and inform investment strategies.
Inflation, CPI, Developed Markets, Economic History, Trends, Data Analysis, Fluctuations
false
Market Analysis and Trends
Financial Services financial-services
Single Chart
JP Morgan
View slide
The slide is split into two line charts. The left chart shows CPI inflation rates for developed markets (Eurozone, U.S., Australia, Japan), while the right chart depicts CPI inflation for emerging markets (Brazil, India, Korea, China) from 2018 to 2024.
Market Analysis and Trends
Financial Services
This slide compares year-over-year CPI inflation rates between developed and emerging markets, providing insights into inflation trends across different economies. It is useful for economic analysis and policy assessment.
Inflation, CPI, Developed, Emerging, Markets
false
Market Analysis and Trends
Financial Services financial-services
Multiple Chart
JP Morgan
View slide
A line chart showing the Consumer Price Index (CPI) for different regions, including the US, China, EU, ASEAN, Japan, and the Target. It uses various colors to distinguish between regions.
Market Analysis and Trends
Financial Services
The slide presents a comparative analysis of inflation trends across different regions from 2019 to 2023. It is used to understand regional inflation trends and economic conditions.
Inflation, CPI, Financial Trends, Regional Analysis, Economic Conditions
false
Market Analysis and Trends
Financial Services financial-services
Single Chart
Gartner
View slide
A historical chart comparing CPI growth rates across different decades, annotated with tenure markers for investment roles.
Investment Analysis
Financial Services
Examines historical inflation trends and their impact on investment, emphasizing the experience of investors during various economic periods.
Inflation, CPI, Investment, Historical Trends, Economic Periods, Senior Partner, Market Stability, Financial History
false
Investment Analysis
Financial Services financial-services
Mixed Chart
Bain
View slide
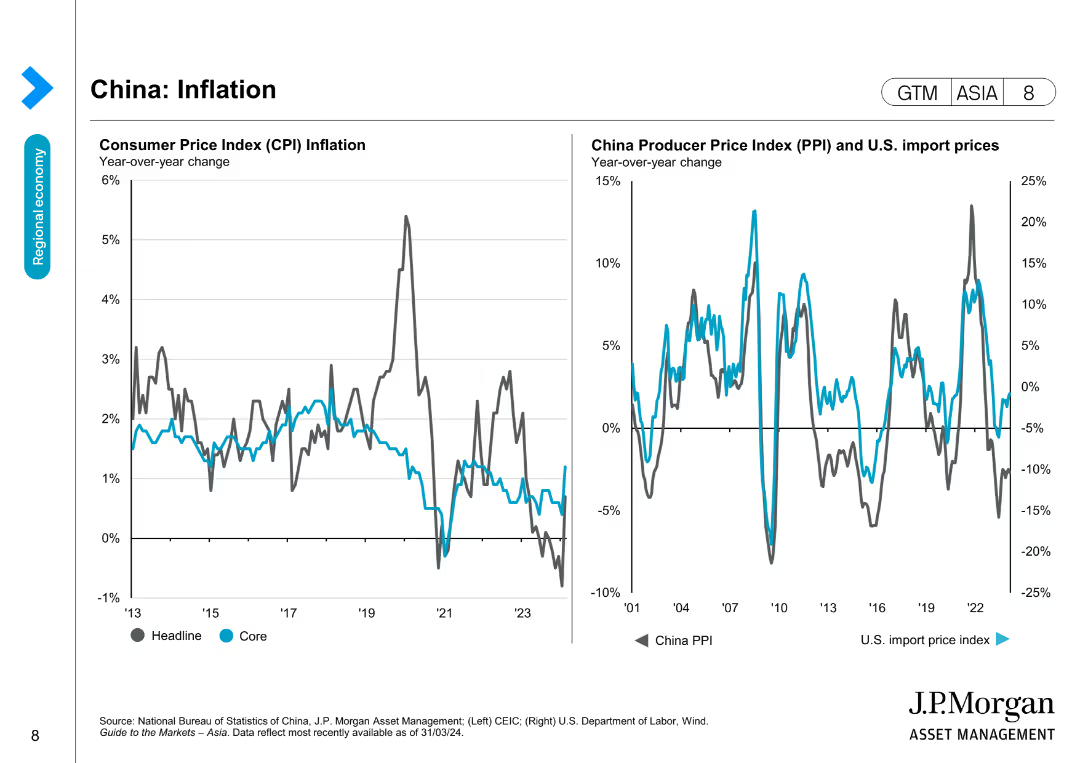
The slide presents two line charts: one for Consumer Price Index (CPI) inflation and another for Producer Price Index (PPI) and U.S. import prices, showing year-over-year changes.
Market Analysis and Trends
Financial Services
Shows inflation trends in China by analyzing CPI and PPI, useful for forecasting economic conditions and inflation impacts on the economy.
Inflation, CPI, PPI, China, Economic trends, Prices, Forecasting, Financial analysis, Import prices
false
Market Analysis and Trends
Financial Services financial-services
Multiple Chart
JP Morgan
View slide
This slide includes three distinct line charts, plotted over time to illustrate the trend in headline inflation numbers across China, the United States, and the Euro Area. The layout is simple and focused.
Regulatory and Compliance
Financial Services
The slide compares inflation trends, essential for financial and economic analysts assessing monetary policy implications and market strategies. It visualizes inflation data in a way that is likely to impact investment and regulatory decisions within the financial services industry.
Inflation, CPI, Trends, Economic
false
Regulatory and Compliance
Financial Services financial-services
Single Chart
Morgan Stanley
Previous
Loading...
Hold On!
We are searching in our database
If nothing, comes up, please try different filters!
Column Chart
Heatmap
Chevron
Org Chart
Infographic
Callouts
Timeline
List
Graphic
Picture
Process Flow
Diagram
Paragraph
Map
Table
Framework
Subtitle
Takeaway Box
Icon
Other Chart
Radar Chart
Waterfall Chart
Mekko Chart
Pie Chart
Scatter Plot
Line Chart
Bar chart
Bullet points
Create a FREE account to continue browsing
Receive Instant Access to 1,000+ slides from companies like McKinsey, Google, and Goldman Sachs
First Name
Last Name
Email
Password
I agree to all
Terms & Privacy Policy
Thank you! Your submission has been received!
Oops! Something went wrong while submitting the form.
Have an account?
Sign in
Upgrade to PRO to Save slides
Advanced Search and Filters
Access to 15,000+ slides
Access to Category Pages
Save/Bookmark Slides
PowerPoint Template Library
Pick a Plan
MONTHLY
$12/month
Billed every month, Cancel anytime.
YEARLY
$9/year
Billed $108 annually, Cancel anytime.
Checkout for $12/month
Checkout for $108/yr
Secured by Stripe | AES-256 bit encryption