My Account
My Slides
Search by Category
Templates
Leave Feedback
Login
Logout
Get Started
Browse all Slides
Browse all Slides
Create a FREE Account
Instant access to 1,000+ real slides from top companies like McKinsey, BCG, Goldman Sachs, Google and many more!
First Name
Last Name
Email
Password
I agree to all
Terms & Privacy Policy
Thank you! Your submission has been received!
Oops! Something went wrong while submitting the form.
Have an account?
Sign in
📢 Ready to start building slides? Check out our new template library
VIEW TEMPLATES
Welcome,
Welcome
PRO
Show Featured Only
Checkbox 8
Companies
Mckinsey
Bain
BCG
EY
Deloitte
Accenture
PwC/Strategy&
JP Morgan
Goldman Sachs
Morgan Stanley
Citigroup
Deutsche Bank
Barclays
LEK
KPMG
Kearney
Oliver Wyman
Booz Allen Hamilton
Gartner
IPSOS
Nielsen
Slide type
Text Only
Linear Flow
Vertical Flow
Single Chart
Header Horizontal
Mixed Chart
Header Vertical
Pillar
Multiple Chart
Graphic
Agenda
Title
Table
Framework
Industry
Technology & Software
Artificial Intelligence
Financial Services
Retail & E-commerce
Consumer Goods
Industrial & Manufacturing
Transportation & Logistics
Telecommunications
Real Estate & Construction
Hospitality & Tourism
Professional Services
Education & Training
Media & Entertainment
Agriculture & Food Production
Healthcare & Pharmaceuticals
Environmental Services & Sustainability
Government & Public Sector
Use Case
Mergers and Acquisitions
Performance Metrics and KPIs
Client Case Studies
Competitive Landscape
Corporate Finance and Valuation
Product and Service Analysis
Customer and Market Segmentation
Organizational Structure and Change
Industry Overview
Regulatory and Compliance
Risk Assessment and Management
Investment Analysis
Organizational Structure and Change
Human Resources and Talent Management
Financial Performance
Market Analysis and Trends
Sales and Business Development
Human Resources and Talent Management
Clear all
Thank you! Your submission has been received!
Oops! Something went wrong while submitting the form.
Tag
View slide
Features two graphs comparing inflation metrics, such as core services and employment cost, against the backdrop of economic cycles. Text-heavy with detailed annotations.
Risk Assessment and Management
Financial Services
Discusses central bank strategies on inflation, comparing various economic indicators to provide insights into future monetary policies.
Inflation, Central Banks, Economic Indicators, Monetary Policy, Employment Cost, Services
false
Risk Assessment and Management
Financial Services financial-services
Multiple Chart
Citigroup
View slide
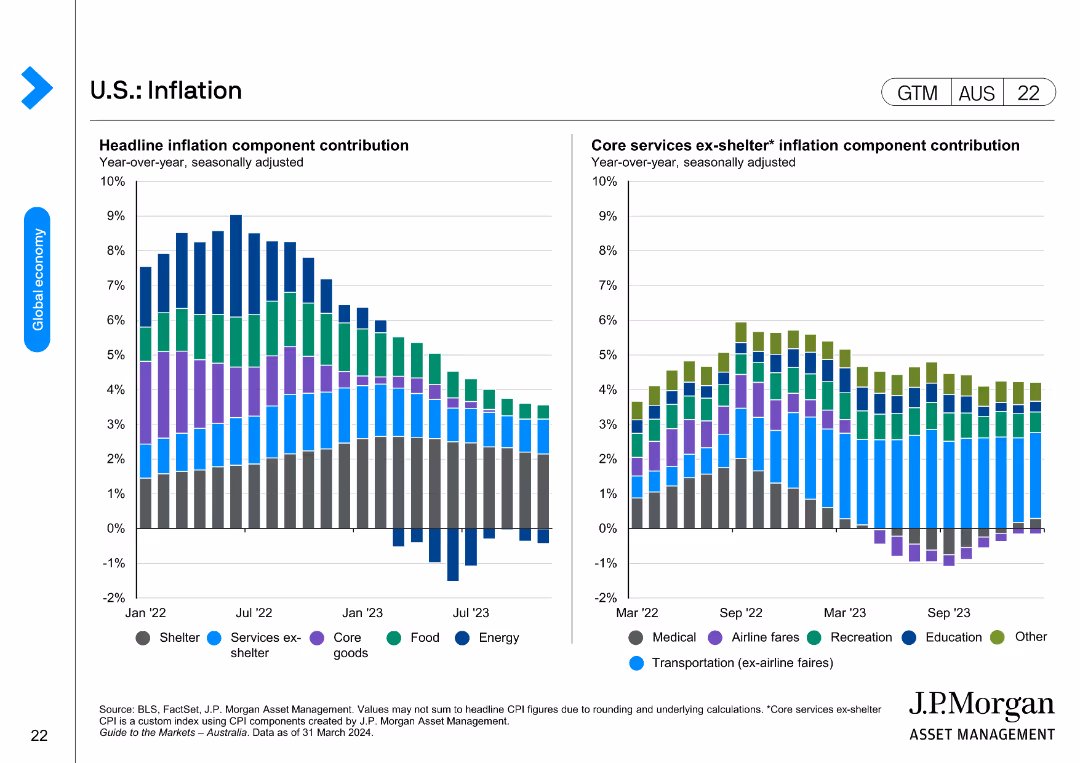
The slide features two bar charts. The left chart shows headline inflation component contributions (shelter, services ex-shelter, core goods, food, energy) year-over-year from Jan 2022 to Jul 2023. The right chart shows core services ex-shelter inflation component contributions.
Market Analysis and Trends
Financial Services
This slide breaks down the components of U.S. inflation, offering a detailed view of what drives inflation rates. It is useful for economic analysis and understanding inflation dynamics.
Inflation, Components, U.S., Headline, Core
false
Market Analysis and Trends
Financial Services financial-services
Multiple Chart
JP Morgan
View slide
The slide is a simple text-based title slide with black text on a white background and a gold stripe on the left. It provides contact information for a lead economist.
Industry Overview
Financial Services
This closing slide offers contact details for further discussion on inflation, serving as an open invitation for dialogue regarding the transitory or persistent nature of current inflation trends. It concludes a financial presentation, allowing for audience follow-up with the expert for deeper insights.
Inflation, Contact, Economics, Discussion, Expert, Finance, Research
false
Industry Overview
Financial Services financial-services
Title
JP Morgan
View slide
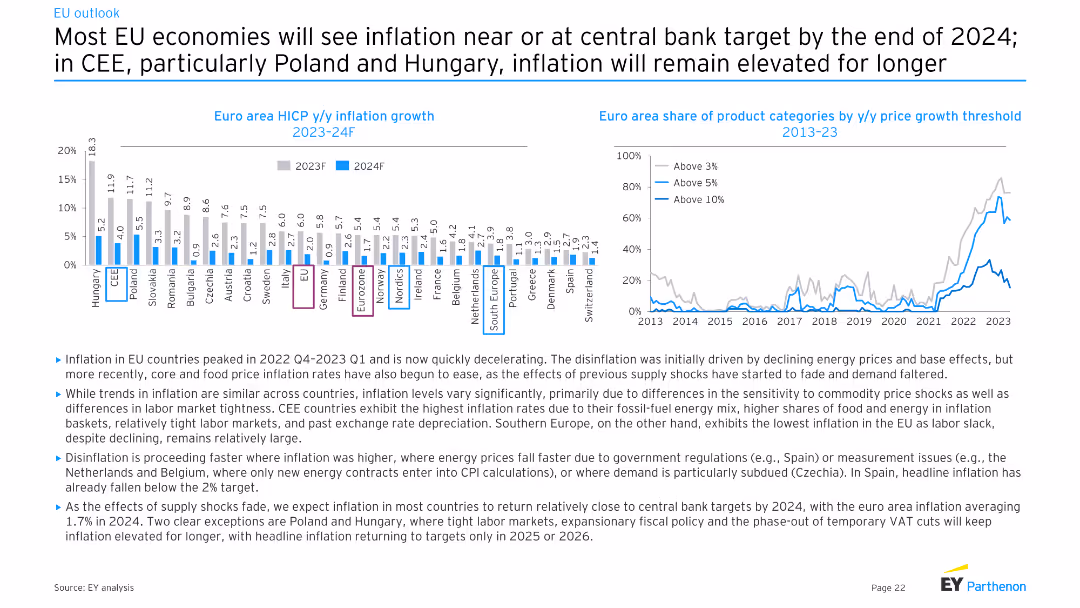
Column chart showing Euro area HICP y/y inflation growth for 2023-24F and a line chart showing Euro area share of product categories by y/y price growth threshold from 2013-23. Moderate complexity, suitable for audiences with some prior knowledge of the topic.
Market Analysis and Trends
Financial Services
This slide analyzes the inflation trends in EU countries, highlighting the differences in inflation rates across countries and projecting future trends. It discusses disinflation processes, the impact of energy prices, and forecasts inflation returning to central bank targets by 2024.
Inflation, EU, HICP, disinflation, energy
false
Market Analysis and Trends
Financial Services financial-services
Multiple Chart
EY
View slide
Two graphs displaying goods consumption against services and raw material input prices, using line charts with recessions marked. Text annotations complement the data.
Investment Analysis
Financial Services
Evaluates the potential for long-term inflation considering the consumption patterns of goods vs. services and the cost of raw materials, useful for economic forecasting and strategy.
Inflation, Goods Consumption, Services, Raw Material Costs, Economic Forecasting, Market Strategy
false
Investment Analysis
Financial Services financial-services
Multiple Chart
Citigroup
View slide
The slide contains three charts. The top left line chart shows inflation and wage growth. The top right line chart shows nominal GDP. The bottom right line chart shows interest rate expectations based on 5y5y swaps.
Market Analysis and Trends
Financial Services
This slide examines Japan's economic indicators, including inflation, wage growth, nominal GDP, and interest rate expectations.
Inflation, Growth, Japan, GDP, Interest Rates
false
Market Analysis and Trends
Financial Services financial-services
Multiple Chart
JP Morgan
View slide
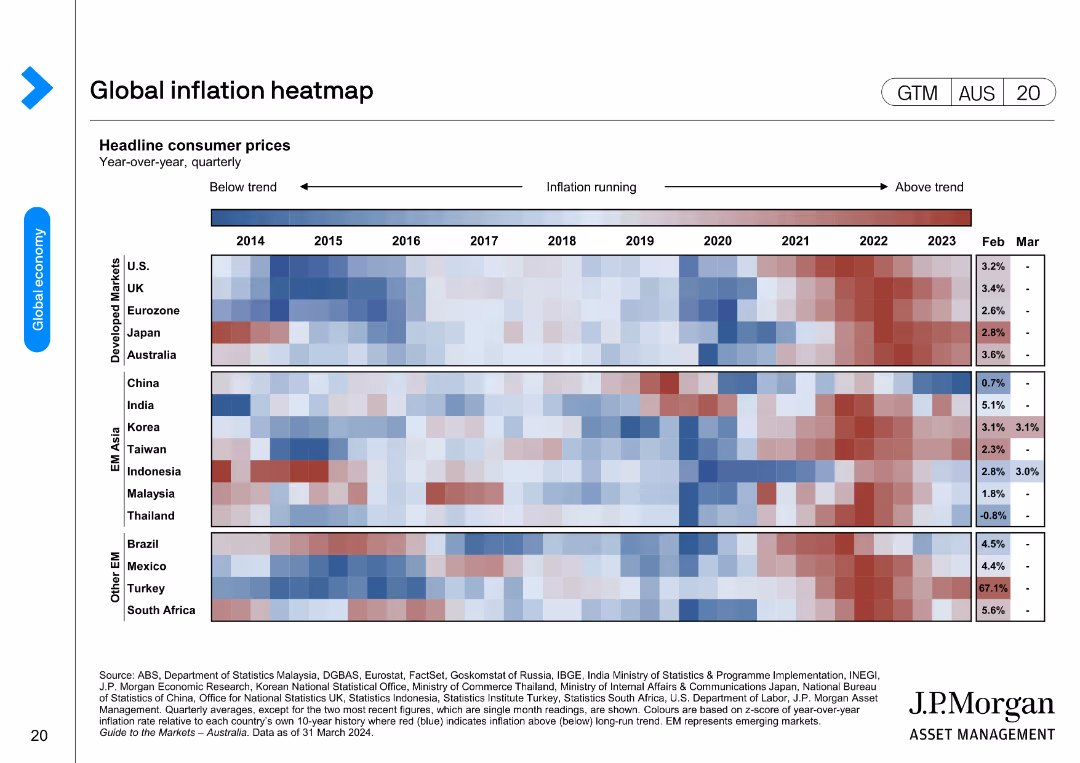
The slide features a heatmap showing headline consumer prices (CPI) year-over-year by quarter for multiple countries (U.S., Eurozone, Japan, China, India, Korea, Brazil, etc.) from 2014 to 2023. Colors indicate inflation running below or above trend.
Market Analysis and Trends
Financial Services
This slide visualizes inflation trends across various countries over time, highlighting periods of high and low inflation. It is useful for comparative analysis of inflationary pressures globally.
Inflation, Heatmap, Consumer Prices, Global, CPI
false
Market Analysis and Trends
Financial Services financial-services
Table
JP Morgan
View slide
The slide features two donut charts comparing 2023 and 2022 responses on inflation knowledge, with data annotations.
Market Analysis and Trends
Financial Services
It shows the percentage of Canadians who correctly answered a question about inflation, comparing results from 2022 to 2023.
Inflation, Knowledge, Canadians, Percentage, 2023, 2022, Chart, Financial, Trends
false
Market Analysis and Trends
Financial Services financial-services
Multiple Chart
IPSOS
View slide
Three line charts display LatAm y/y CPI, interest rate, and y/y wage growth from 2015-2025F for Brazil, Mexico, and Chile. Text provides detailed explanations.
Market Analysis and Trends
Financial Services
Focuses on inflation trends in Latin America, the impact of monetary policies, and forecasts for future economic conditions.
Inflation, Latin America, CPI, Interest Rate, Wage Growth
false
Market Analysis and Trends
Financial Services financial-services
Multiple Chart
EY
View slide
The slide is organized into three main columns, each representing how companies within different sectors are responding to inflation—either by reducing, increasing, or maintaining marketing spend. The use of contrasting colors facilitates easy comparison.
Market Analysis and Trends
Professional Services
This slide categorizes how different industry sectors are reacting to inflation in terms of their marketing spend. It provides a nuanced view of economic strategies, highlighting which sectors are more resilient or vulnerable to market changes. This information is crucial for cross-sector analysis and strategic adjustments.
Inflation, Marketing Spend, Industry Comparison, Economic Strategy, Resilience
false
Market Analysis and Trends
Professional Services professional-services
Table
Deloitte
View slide
This slide features a pie chart showing the impact of inflation on marketing spending across three categories: no impact, increasing, and decreasing levels. The chart uses color differentiation to highlight these categories clearly.
Market Analysis and Trends
Professional Services
The slide explores the impact of inflation on marketing budgets, detailing how different sectors are either cutting back or increasing their spend in response to economic pressures. This can aid in strategic planning and budget allocation during inflationary periods.
Inflation, Marketing Spending, Economic Impact, Budget Planning, Strategy
false
Market Analysis and Trends
Professional Services professional-services
Single Chart
Deloitte
View slide
This slide contains a table showing the percentage of companies reporting various impacts of inflation on their marketing activities, such as changes in pricing and value propositions. The visual clarity and spacing between bars make the data easily digestible.
Market Analysis and Trends
Professional Services
The slide details the effects of inflation on marketing strategies, emphasizing how companies are adjusting their pricing and value propositions without affecting employment levels. This highlights the strategic responses to maintain market competitiveness and operational stability during inflationary periods.
Inflation, Marketing Strategy, Pricing, Value Proposition, Employment
false
Market Analysis and Trends
Professional Services professional-services
Table
Deloitte
View slide
The slide features three separate text boxes with icons, titled '1. Revenue growth management', '2. Assortment, innovation and design to value', and '3. Cost-based assessment'. Each section has bullet points below. On the right, there's an overlay of faint graphic elements.
Strategic Planning
Financial Services
Discusses strategic responses to inflation, offering three key strategies for businesses to manage revenue, redefine value propositions, and assess costs. These strategies are presented as practical measures to build resilience and prepare for future economic conditions. The slide provides a concise guide for businesses to proactively address inflation through revenue growth management, value proposition redesign, and cost-based assessments, focusing on areas like procurement, labor force, supply chain reinvention, and building resilience.
Inflation, Strategy, Revenue, Cost, Value, Resilience
false
Strategic Planning
Financial Services financial-services
Header Horizontal
Bain
View slide
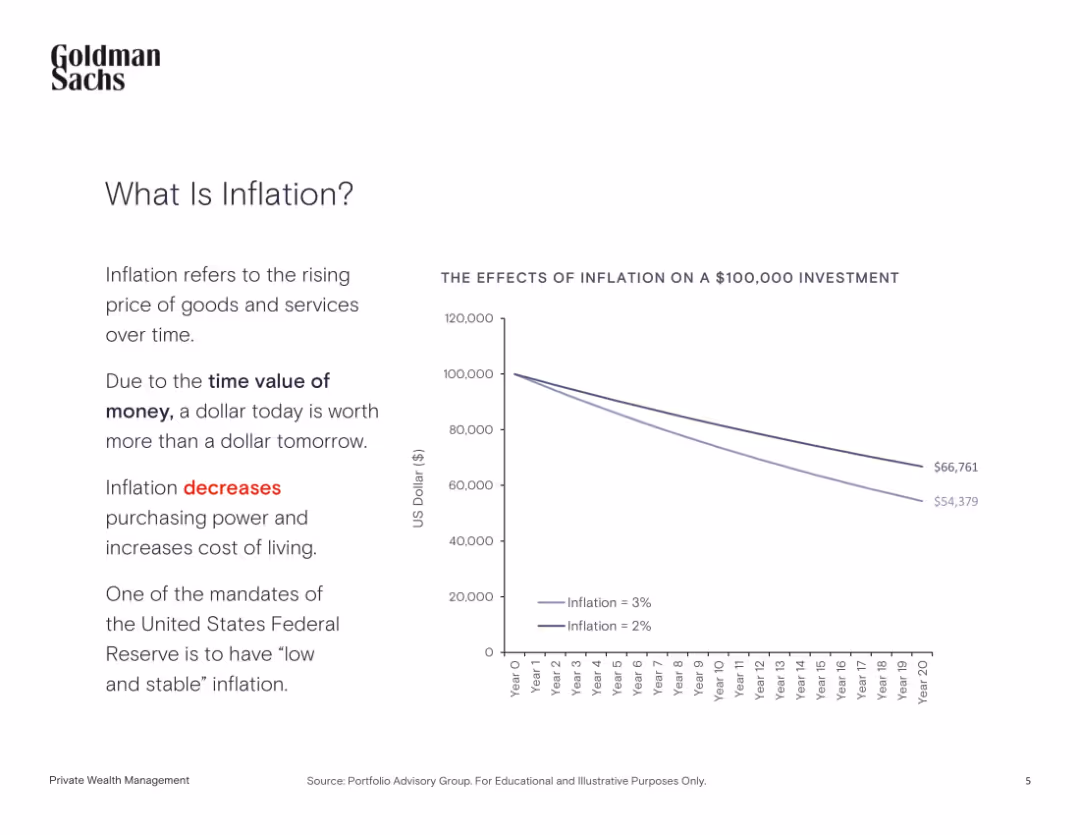
Simple left-text, right-line-chart layout; minimalistic design
Strategic Planning
Financial Services
This educational slide explains inflation, its impact on purchasing power, and how it affects investment value over time, using a chart comparing inflation scenarios.
Inflation, Time Value, Investment, Purchasing Power, Cost of Living
false
Strategic Planning
Financial Services financial-services
Mixed Chart
Goldman Sachs
View slide
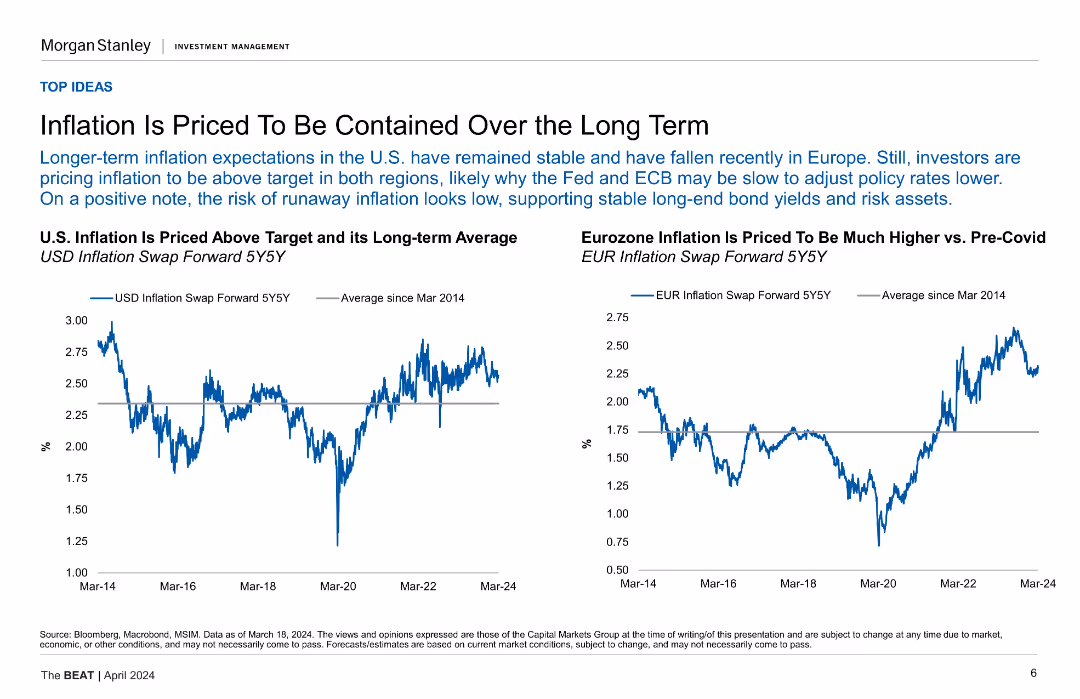
Two line charts comparing U.S. and Eurozone inflation against their long-term averages.
Market Analysis and Trends
Financial Services
This slide analyzes the long-term expectations for inflation in the U.S. and Eurozone, suggesting that inflation will remain stable and above target in both regions.
Inflation, U.S., Eurozone, Long-Term, Comparison, Containment
false
Market Analysis and Trends
Financial Services financial-services
Multiple Chart
Morgan Stanley
View slide
Two column charts showing UK headline inflation breakdown and UK goods and services inflation from Jan '21 to Jan '24 and 1989 to 2024 respectively. Different colors represent core services, core goods, food, alcohol, tobacco, etc.
Market Analysis and Trends
Financial Services
This slide provides a detailed analysis of UK inflation trends, showing the breakdown of headline inflation by various components and comparing goods and services inflation over time. Used for inflation trend analysis and forecasting.
Inflation, UK, headline, goods, services, trends
false
Market Analysis and Trends
Financial Services financial-services
Multiple Chart
JP Morgan
View slide
A column chart on the slide breaks down US headline inflation into components over time. Colored segments represent different inflation contributors with a trend line over the bars.
Financial Performance
Financial Services
This slide's column chart dissects US headline inflation by its various components, likely utilized in financial discussions to address inflationary pressures and their sources. It aids in comprehending the inflation trends and preparing for future fiscal or investment decisions.
Inflation, US, Headline, Components, Finance, Trends, Analysis, 2023
false
Financial Performance
Financial Services financial-services
Single Chart
JP Morgan
View slide
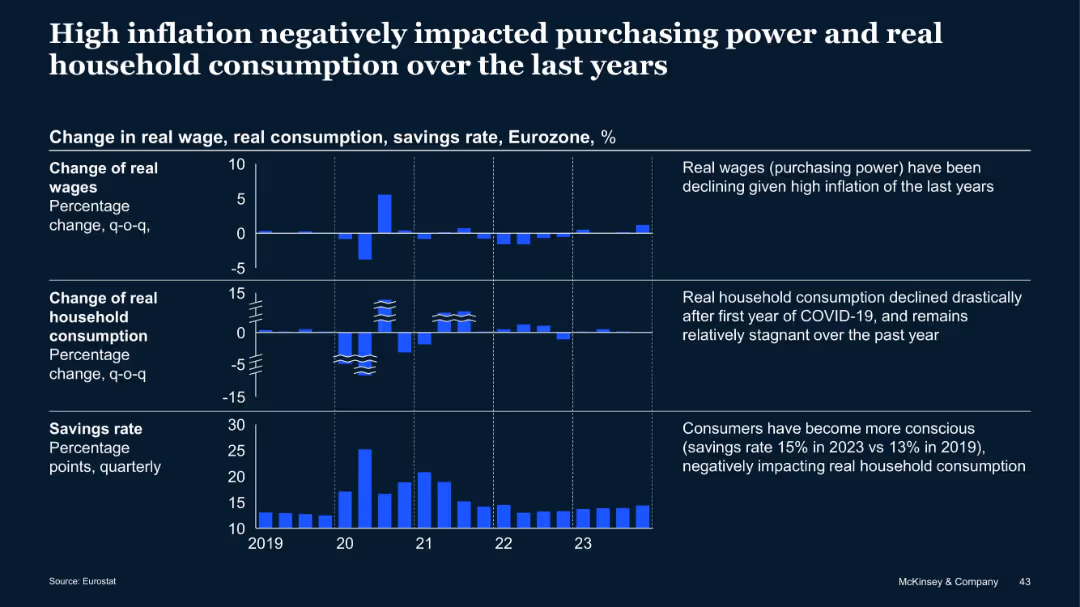
Three-tiered bar chart showing real wage, consumption, and savings trends in Eurozone from 2019–2023
Market Analysis and Trends
Financial Services
This slide demonstrates the impact of inflation on real wages, household consumption, and savings in the Eurozone. Wages declined, consumption dropped post-COVID, and savings rates increased, indicating cautious consumer behavior.
Inflation, Wages, Consumption, Savings, Eurozone, Consumer Trends
false
Market Analysis and Trends
Financial Services financial-services
Mixed Chart
McKinsey
View slide
The slide presents a segmented bar chart with text explanations on inflation impact responses and various cost increase management strategies.
Risk Assessment and Management
Consumer Goods
It explains how food & beverage companies manage inflation-driven cost increases through margin reduction, passing costs to customers, and other strategies.
Inflation, cost management, food & beverage, margin reduction, passing costs, supplier interventions, hedging, demand management
false
Risk Assessment and Management
Consumer Goods consumer-goods
Mixed Chart
Kearney
View slide
Two line charts showing inflation and interest rate expectations by country, and a bar chart of interest rate environments.
Market Analysis and Trends
Financial Services
Explores inflation and interest rate expectations in different countries, suggesting optimism in international investing.
Inflation, interest rates, international investing, expectations, analysis, optimism, countries, trends
false
Market Analysis and Trends
Financial Services financial-services
Multiple Chart
JP Morgan
View slide
The slide has two line charts, one showing core inflation rates and the other displaying shipping costs and global PMI supplier delivery times. The visualizations use different colors to distinguish between the US, Eurozone, and UK data.
Market Analysis and Trends
Financial Services
This slide highlights core inflation trends and their impact on shipping costs and supplier delivery times, providing insights into global inflationary pressures and supply chain challenges.
Inflation, shipping costs, supplier delivery, core inflation, global economy
false
Market Analysis and Trends
Financial Services financial-services
Multiple Chart
JP Morgan
View slide
The slide includes two vertical bar charts showing where businesses receive information about Greece's attractiveness, along with a donut chart displaying investment intentions.
Market Analysis and Trends
Government & Public Sector
Shows survey results on where businesses get information about Greece and their willingness to invest if certain issues are addressed.
Information sources, investment, Greece, survey results, attractiveness
false
Market Analysis and Trends
Government & Public Sector government-and-public-sector
Multiple Chart
EY
View slide
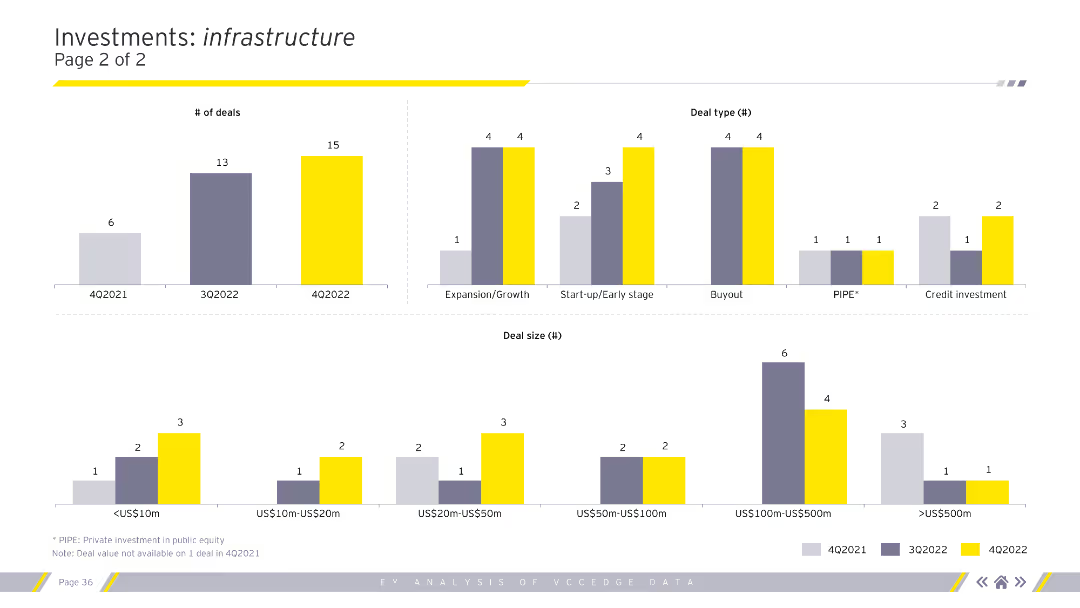
The slide includes column charts illustrating the number of deals, deal types, and deal sizes within the infrastructure sector across various quarters. Each chart is color-coded by quarter.
Market Analysis and Trends
Financial Services
This slide continues the infrastructure investment analysis, highlighting the number of deals and their types and sizes, enhancing the understanding of quarterly investment patterns in infrastructure.
Infrastructure deals, number of deals, deal types
false
Market Analysis and Trends
Financial Services financial-services
Multiple Chart
EY
View slide
This slide features multiple images, icons, and a pie chart. It visually represents different sectors like energy, technology, and real estate through icons. The design is clear and informative with a focus on significant achievements.
Investment Analysis
Financial Services
Highlights financial contributions and key achievements of Macquarie Capital. It serves as an investment summary and a strategic overview of the company’s performance across various sectors, emphasizing their leading position in global infrastructure and energy financing.
Infrastructure, Investments, Energy, Real Estate, Financial Advising
false
Investment Analysis
Financial Services financial-services
Mixed Chart
Goldman Sachs
View slide
The slide displays multiple graphs: column charts showing expected investment areas and deal completions, and pie charts for planned divestments and competition expectations. It highlights key sectors like energy and transportation for future investments.
Market Analysis and Trends
Real Estate & Construction
This slide forecasts the outlook for the Italian infrastructure sector, including areas of expected investment, anticipated deal completions, and competition trends, focusing on energy and transportation as key investment sectors.
Infrastructure, Italy, investment outlook, energy, transportation
false
Market Analysis and Trends
Real Estate & Construction real-estate-and-construction
Multiple Chart
EY
View slide
The slide features a pie chart showing investment in the Italian infrastructure sector and a column chart displaying the average investment ticket size. Another column chart indicates the sectors with the highest investment.
Market Analysis and Trends
Real Estate & Construction
This slide analyzes the investment attractiveness of the Italian infrastructure sector, showing the distribution of investments and highlighting key sectors and average investment sizes. It indicates a strong investment interest in energy and transportation.
Infrastructure, Italy, investment, sector analysis, energy
false
Market Analysis and Trends
Real Estate & Construction real-estate-and-construction
Multiple Chart
EY
View slide
No charts; detailed text and images discussing port performance and logistics.
Market Analysis and Trends
Transportation & Logistics
Explores how improvements in infrastructure and port management in South Africa can enhance productivity and attract private investment.
Infrastructure, Ports, Logistics, Private Investment, Productivity
false
Market Analysis and Trends
Transportation & Logistics transportation-and-logistics
Mixed Chart
PwC/Strategy&
View slide
This slide features a timeline layout with icons and percentage bars. It uses blues and grays to show progress on infrastructure updates and cloud adoption.
Operational Efficiency
Technology & Software
Highlights the ongoing modernization of payment processing platforms and the transition of internal applications to the cloud.
Infrastructure, cloud migration, modernization, processing platforms, timeline, cloud adoption, technology upgrades
false
Operational Efficiency
Technology & Software technology-and-software
Mixed Chart
JP Morgan
View slide
The slide presents two column charts comparing reasons to invest in the Italian infrastructure sector and constraints faced. Key reasons include filling the infrastructure gap, while constraints involve political and regulatory uncertainty.
Market Analysis and Trends
Real Estate & Construction
This slide compares the benefits and challenges of investing in the Italian infrastructure sector, identifying key reasons like infrastructure needs and constraints such as political and regulatory challenges.
Infrastructure, investment, Italy, pros and cons, regulatory constraints
false
Market Analysis and Trends
Real Estate & Construction real-estate-and-construction
Multiple Chart
EY
Previous
Loading...
Hold On!
We are searching in our database
If nothing, comes up, please try different filters!
Column Chart
Heatmap
Chevron
Org Chart
Infographic
Callouts
Timeline
List
Graphic
Picture
Process Flow
Diagram
Paragraph
Map
Table
Framework
Subtitle
Takeaway Box
Icon
Other Chart
Radar Chart
Waterfall Chart
Mekko Chart
Pie Chart
Scatter Plot
Line Chart
Bar chart
Bullet points
Create a FREE account to continue browsing
Receive Instant Access to 1,000+ slides from companies like McKinsey, Google, and Goldman Sachs
First Name
Last Name
Email
Password
I agree to all
Terms & Privacy Policy
Thank you! Your submission has been received!
Oops! Something went wrong while submitting the form.
Have an account?
Sign in
Upgrade to PRO to Save slides
Advanced Search and Filters
Access to 15,000+ slides
Access to Category Pages
Save/Bookmark Slides
PowerPoint Template Library
Pick a Plan
MONTHLY
$12/month
Billed every month, Cancel anytime.
YEARLY
$9/year
Billed $108 annually, Cancel anytime.
Checkout for $12/month
Checkout for $108/yr
Secured by Stripe | AES-256 bit encryption