My Account
My Slides
Search by Category
Templates
Leave Feedback
Login
Logout
Get Started
Browse all Slides
Browse all Slides
Create a FREE Account
Instant access to 1,000+ real slides from top companies like McKinsey, BCG, Goldman Sachs, Google and many more!
First Name
Last Name
Email
Password
I agree to all
Terms & Privacy Policy
Thank you! Your submission has been received!
Oops! Something went wrong while submitting the form.
Have an account?
Sign in
📢 Ready to start building slides? Check out our new template library
VIEW TEMPLATES
Welcome,
Welcome
PRO
Show Featured Only
Checkbox 8
Companies
Mckinsey
Bain
BCG
EY
Deloitte
Accenture
PwC/Strategy&
JP Morgan
Goldman Sachs
Morgan Stanley
Citigroup
Deutsche Bank
Barclays
LEK
KPMG
Kearney
Oliver Wyman
Booz Allen Hamilton
Gartner
IPSOS
Nielsen
Slide type
Text Only
Linear Flow
Vertical Flow
Single Chart
Header Horizontal
Mixed Chart
Header Vertical
Pillar
Multiple Chart
Graphic
Agenda
Title
Table
Framework
Industry
Technology & Software
Artificial Intelligence
Financial Services
Retail & E-commerce
Consumer Goods
Industrial & Manufacturing
Transportation & Logistics
Telecommunications
Real Estate & Construction
Hospitality & Tourism
Professional Services
Education & Training
Media & Entertainment
Agriculture & Food Production
Healthcare & Pharmaceuticals
Environmental Services & Sustainability
Government & Public Sector
Use Case
Mergers and Acquisitions
Performance Metrics and KPIs
Client Case Studies
Competitive Landscape
Corporate Finance and Valuation
Product and Service Analysis
Customer and Market Segmentation
Organizational Structure and Change
Industry Overview
Regulatory and Compliance
Risk Assessment and Management
Investment Analysis
Organizational Structure and Change
Human Resources and Talent Management
Financial Performance
Market Analysis and Trends
Sales and Business Development
Human Resources and Talent Management
Clear all
Thank you! Your submission has been received!
Oops! Something went wrong while submitting the form.
Tag
View slide
The slide includes column charts rating investment performance, opportunities for improvement, and external risks. It shows investor sentiment on organic growth and consolidation, along with risks like economic slowdown and regulatory uncertainty.
Performance Metrics and KPIs
Real Estate & Construction
This slide reviews the performance of Italian infrastructure investments, highlighting opportunities for improvement and identifying significant external risks such as economic slowdown and regulatory uncertainty.
Infrastructure, investment, performance, Italy, risks
false
Performance Metrics and KPIs
Real Estate & Construction real-estate-and-construction
Multiple Chart
EY
View slide
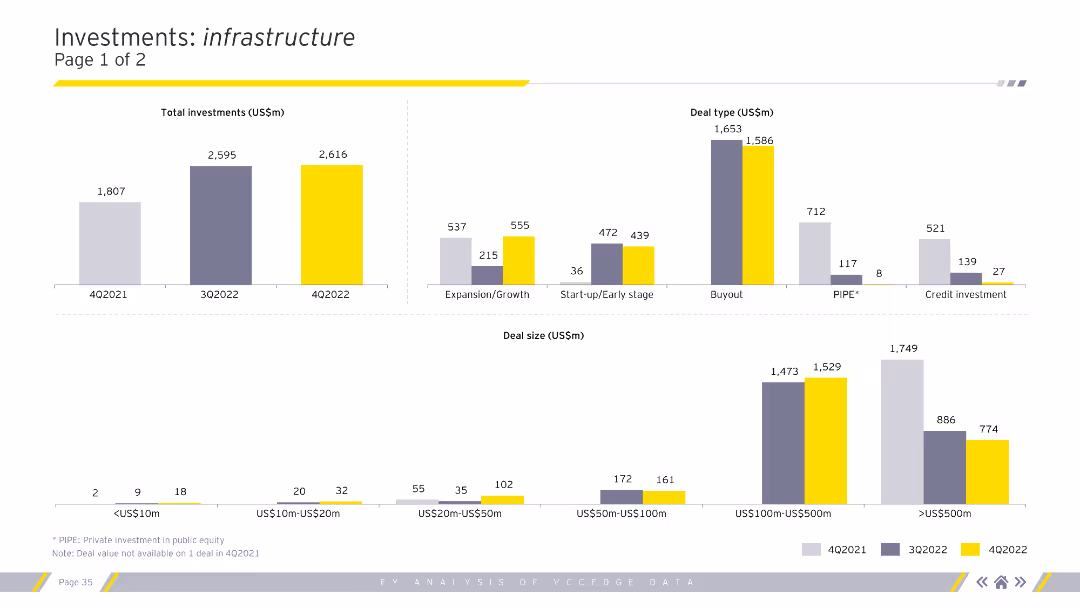
The slide contains column charts showing total investments, deal types, and deal sizes specifically for the infrastructure sector across different quarters. Charts are color-coded for clarity.
Market Analysis and Trends
Financial Services
This slide focuses on infrastructure investments, detailing the total amount invested, types of deals, and sizes, providing a comprehensive view of investment trends in this sector.
Infrastructure, investments, deal types, deal sizes
false
Market Analysis and Trends
Financial Services financial-services
Multiple Chart
EY
View slide
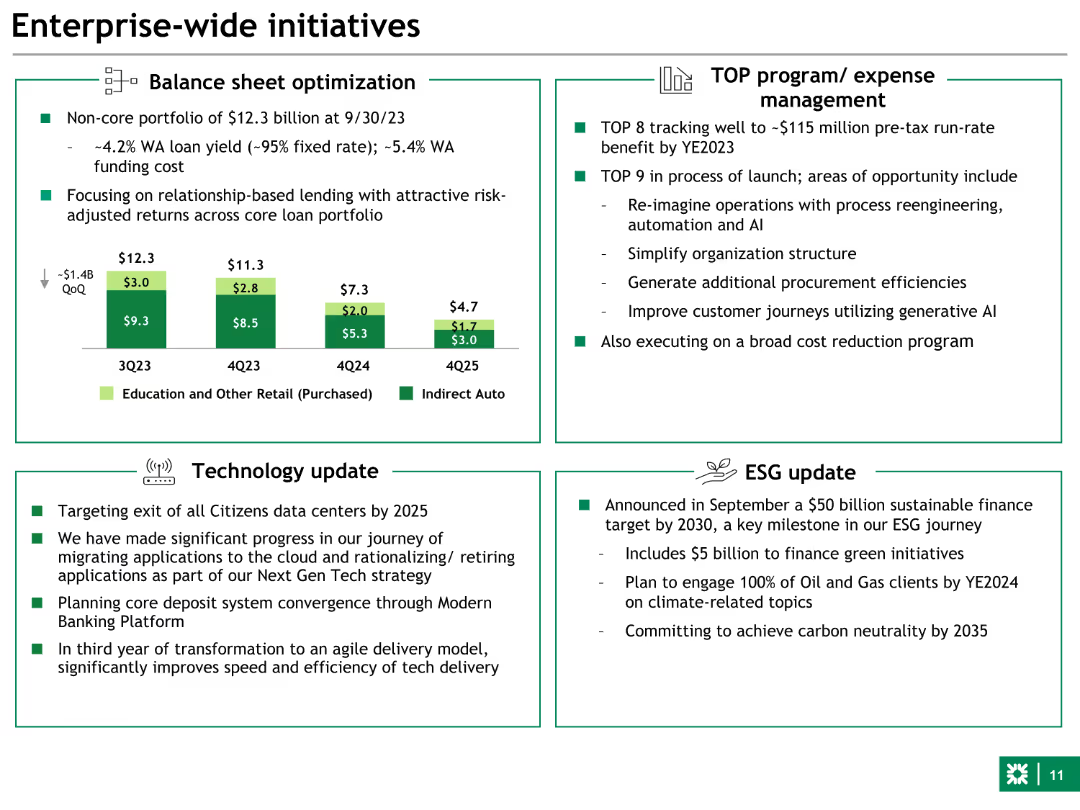
The slide contains a combination of text and a column chart. The layout is divided into four sections: Balance sheet optimization, TOP program/expense management, Technology update, and ESG update.
Strategic Planning
Financial Services
Provides an overview of key initiatives such as balance sheet optimization, expense management programs, technology updates, and ESG targets for the financial year.
Initiatives, balance sheet, ESG, technology, expense management
false
Strategic Planning
Financial Services financial-services
Mixed Chart
Goldman Sachs
View slide
Circular diagram representing the innovation cycle, with segments for inception, value creation, adoption & diffusion, and impacts. Text explains the dynamic process of innovation in economic and social contexts.
Technology and Digital Transformation
Technology & Software
The slide presents the innovation cycle, illustrating the stages from inception to wider impacts. It discusses the dynamic nature of innovation, emphasizing the importance of R&D, adoption, and diffusion for achieving significant economic and social benefits.
Innovation Cycle, R&D, Economic Impact
false
Technology and Digital Transformation
Technology & Software technology-and-software
Linear Flow
Roland Berger
View slide
A table listing the Global Innovation Index (GII) rankings of the top 10 innovative countries in 2021, with scores for various pillars like institutions, human capital, infrastructure, etc.
Market Analysis and Trends
Technology & Software
The slide displays the Global Innovation Index rankings for the top 10 countries in 2021, highlighting their strengths in institutions, human capital, infrastructure, market sophistication, business sophistication, and knowledge and technology outputs. It underscores the factors contributing to innovation leadership.
Innovation Index, Rankings, 2021, Top 10
false
Market Analysis and Trends
Technology & Software technology-and-software
Table
Roland Berger
View slide
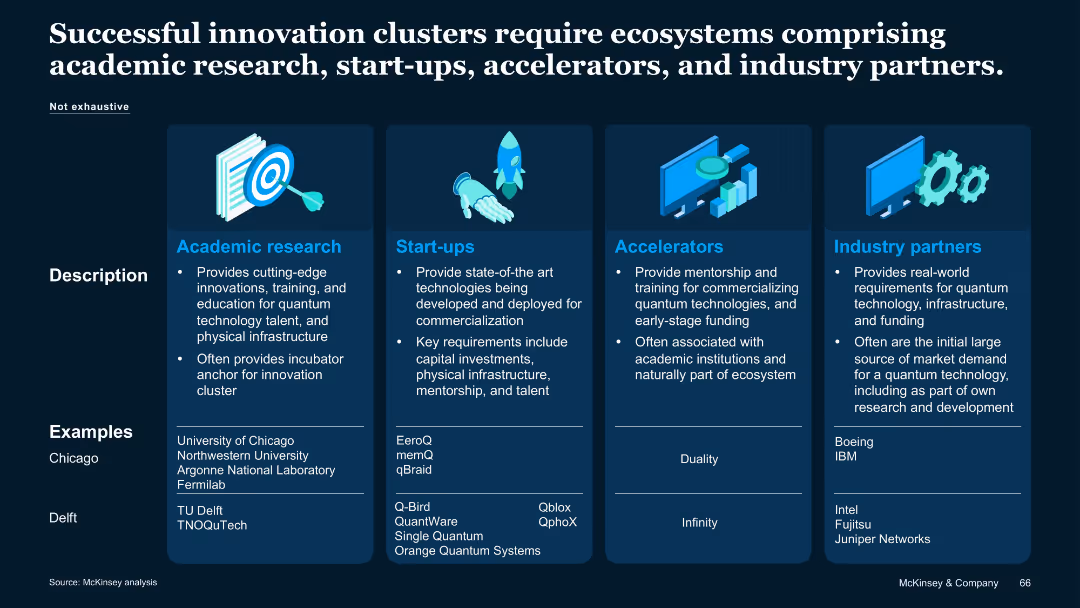
Four-column grid with icons, descriptions, and examples of institutions in Chicago and Delft; consistent color theme per section.
Client Case Studies
Artificial Intelligence
Examines innovation clusters in quantum tech, focusing on ecosystems with research institutions, start-ups, accelerators, and industry partners. Provides real-world examples from Chicago and Delft.
Innovation clusters, ecosystem, research, start-ups, accelerators
false
Client Case Studies
Artificial Intelligence artificial-intelligence
Table
McKinsey
View slide
Features a Venn diagram illustrating the intersection of Customer/Member, Technology, and Business Model with labels 'Desirability', 'Feasibility', and 'Viability'. The diagram is central with annotations explaining the importance of each component in innovation.
Strategic Planning
Professional Services
Explores the framework of innovation at the intersection of customer needs, technological capabilities, and viable business models. This conceptual slide is critical for understanding and applying innovation in business strategy, emphasizing the integration of these elements for successful innovation initiatives.
Innovation framework, business strategy, technology integration, customer needs
false
Strategic Planning
Professional Services professional-services
Diagram
McKinsey
View slide
Bar charts detailing the creation of new roles over the past year and within the next 12 months, alongside their executive/non-executive levels.
Organizational Structure and Change
Professional Services
This slide analyzes the trend of creating new innovation roles within organizations, highlighting the distribution between executive and non-executive levels.
Innovation roles, organizations, trends, creation, executive, non-executive, structure, analysis, 12 months
false
Organizational Structure and Change
Professional Services professional-services
Multiple Chart
EY
View slide
Moderate complexity with bullet points, icons, and text
Technology and Digital Transformation
Environmental Services & Sustainability
This slide showcases examples of companies and technologies that have made a significant impact on sustainable consumption. It is beneficial for discussing successful cases of innovation in sustainability, highlighting how various sectors are integrating green technology.
Innovation, Case Studies, Green Technology, Sustainability, Consumption
false
Technology and Digital Transformation
Environmental Services & Sustainability environmental-services-and-sustainability
Header Vertical
McKinsey
View slide
A simple title slide with the text "The Race for Innovation" over a background image of a winding road through a canyon at twilight.
Industry Overview
Technology & Software
Serves as an introductory slide to a presentation or section focused on innovation, competition, and technological advancements.
Innovation, Competition, Technology, Market Trends, Strategic Planning
false
Industry Overview
Technology & Software technology-and-software
Title
BCG
View slide
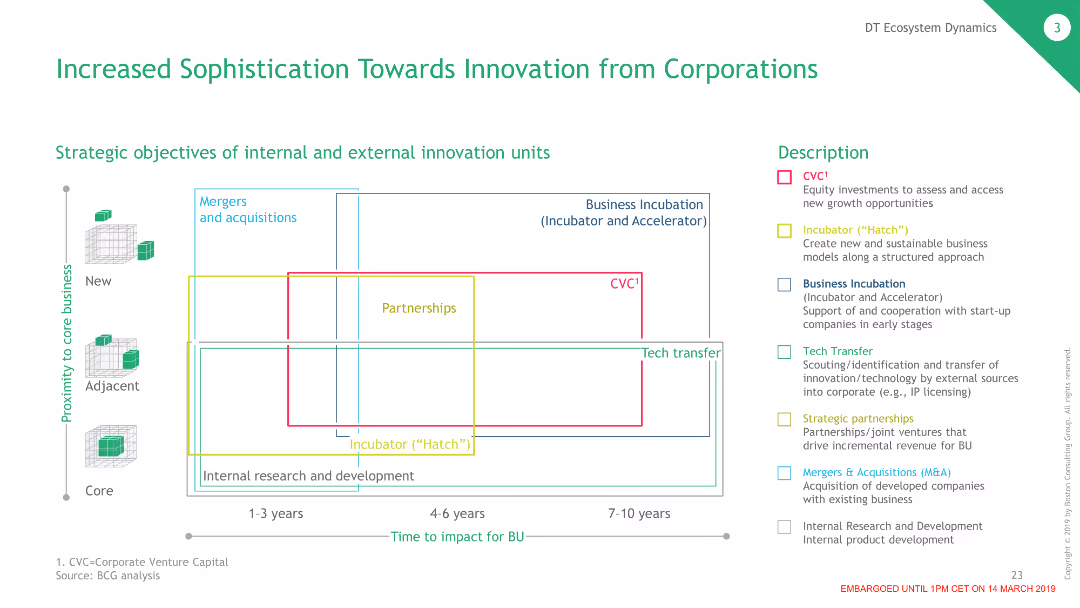
The slide contains a grid chart illustrating the strategic objectives of internal and external innovation units over different time frames and proximity to core business areas.
Strategic Planning
Technology & Software
This slide explains the strategic approaches corporations use for innovation, including mergers, partnerships, and incubators, highlighting their timelines and business impacts.
Innovation, Corporations, Strategy, Partnerships
false
Strategic Planning
Technology & Software technology-and-software
Header Horizontal
BCG
View slide
A blend of listed principles with a highlighted sidebar, it uses icons for visual emphasis and color coding for distinction between principles.
Human Resources and Talent Management
Technology & Software
It talks about fostering a culture of innovation by rewarding certain behaviors and principles within teams. Relevant for HR and corporate culture initiatives.
Innovation, Culture, Reward, Talent Management, Risk-taking, Ownership, Decision-making, Collaboration, Action Bias
true
Human Resources and Talent Management
Technology & Software technology-and-software
Text Only
BCG
View slide
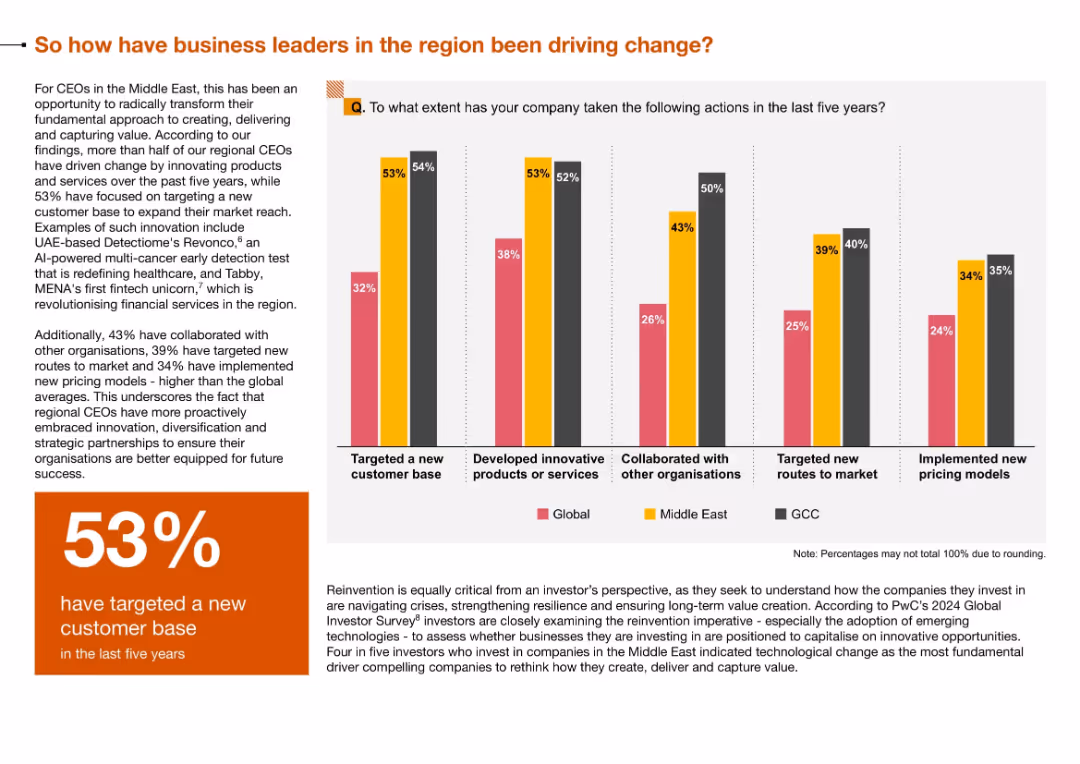
Vertical bar chart showing five innovation-related actions across Global, Middle East, and GCC; left text block and orange stat box highlight 53% customer targeting
Technology and Digital Transformation
Technology & Software
The slide demonstrates proactive innovation strategies by Middle East and GCC CEOs, including targeting new customer bases, product innovation, and partnerships. This underscores a regional shift toward agility and modernization.
Innovation, Customer Base, Strategic Partnerships, Pricing Models, Middle East, GCC, Transformation
false
Technology and Digital Transformation
Technology & Software technology-and-software
Mixed Chart
PwC/Strategy&
View slide
This slide features a three-column layout, each with a distinct category—Active to Passive, ESG, Digital Execution—presented with a mix of textual content and numerical data in a blue color scheme.
Financial Performance
Financial Services
It discusses the shift in client services towards passive strategies, ESG and impact investing, and improving digital execution capabilities. It includes AUS data, ETF count, and API connectivity as part of the service features.
Innovation, ESG, Digital, ETF, API
false
Financial Performance
Financial Services financial-services
Table
Goldman Sachs
View slide
Scatter plot comparing the Global Innovation Index with GDP per capita PPP for 2019, with emerging markets and advanced countries highlighted. Text discusses the relationship between innovation and prosperity.
Technology and Digital Transformation
Technology & Software
The slide illustrates the correlation between innovation capabilities and economic prosperity, showing how countries with higher Global Innovation Index scores tend to have higher GDP per capita. It highlights the importance of innovation for economic growth and development.
Innovation, GDP, Global Index, Prosperity
false
Technology and Digital Transformation
Technology & Software technology-and-software
Mixed Chart
Roland Berger
View slide
Featuring a circular graph with variously sized and colored bubbles, it visualizes data on innovation, interest, investment, and adoption by technology trend.
Technology and Digital Transformation
Professional Services
Continuation of the introduction, this slide provides quantitative data on technology trends using an innovative graph style.
Innovation, Investment, Technology, Trends, Data, Analysis, AI, Energy
false
Technology and Digital Transformation
Professional Services professional-services
Single Chart
McKinsey
View slide
This slide presents a matrix layout, comparing different strategic approaches to innovation within companies. It utilizes contrasting colors to differentiate between 'model', 'buy', and 'partner' approaches, and includes both text explanations and simple iconography.
Market Analysis and Trends
Technology & Software
The slide discusses various methods of building capabilities through partnerships and acquisitions, and how companies choose based on their focus on innovation. It's useful for strategic planning and investment decisions.
Innovation, Partnerships, Acquisition, Ecosystems, Venture Capital, Startups, Technology, Strategy, Investment, Engagement
false
Market Analysis and Trends
Technology & Software technology-and-software
Pillar
BCG
View slide
A side-by-side comparison of the current and vision model for the Interbank Information Network with bullet points, and details about JPM Coin on the right with an image of a coin and network connections.
Technology and Digital Transformation
Financial Services
This slide presents the Interbank Information Network and JPM Coin as innovations in wholesale payments, showing the transition from the current model to the future vision, useful for showcasing technology progress in financial services.
Innovation, Payments, Blockchain, JPM Coin, Efficiency, Network
false
Technology and Digital Transformation
Financial Services financial-services
Header Horizontal
JP Morgan
View slide
The slide uses a table and bar charts to present data on different innovation levers with activity levels and trends over time.
Sales and Business Development
Technology & Software
Discusses the optimization of innovation processes, highlighting key levers such as innovation strategy, new structures, and non-core innovations.
Innovation, Strategy, Optimization, Trends
false
Sales and Business Development
Technology & Software technology-and-software
Pillar
Roland Berger
View slide
Slide divided into two sections with multiple circular graphics and a bar chart in shades of blue showing growth in innovation economy revenue.
Technology and Digital Transformation
Financial Services
Showcases JPMorgan Chase & Co.'s strategy and unique assets designed to serve the venture capital ecosystem, with a focus on innovation and supporting startups.
Innovation, Strategy, Venture Capital, Financial Services, Growth
false
Technology and Digital Transformation
Financial Services financial-services
Mixed Chart
JP Morgan
View slide
This slide displays a combination of text blocks and data visualizations, including a growth multiplier and key investment areas. It's color-coded to distinguish between different technology focus areas.
Operational Efficiency
Technology & Software
It emphasizes the importance of leveraging technology for innovation, considering both existing and upcoming technological developments. This could aid in technology investment strategies.
Innovation, Technology, Investments, Digital Transformation, Deep Tech, Market Trends, Business Model, Development
false
Operational Efficiency
Technology & Software technology-and-software
Header Vertical
BCG
View slide
Circular diagram showing different types of innovation (Offering, Configuration, Experience) and their subtypes. Text describes how innovation combines inventions with market penetration.
Technology and Digital Transformation
Technology & Software
The slide categorizes different types of innovation, including product offering, configuration, and customer experience innovations. It emphasizes the importance of combining technological breakthroughs with successful market penetration to drive economic growth and competitive advantage.
Innovation, Technology, Market Penetration
false
Technology and Digital Transformation
Technology & Software technology-and-software
Diagram
Roland Berger
View slide
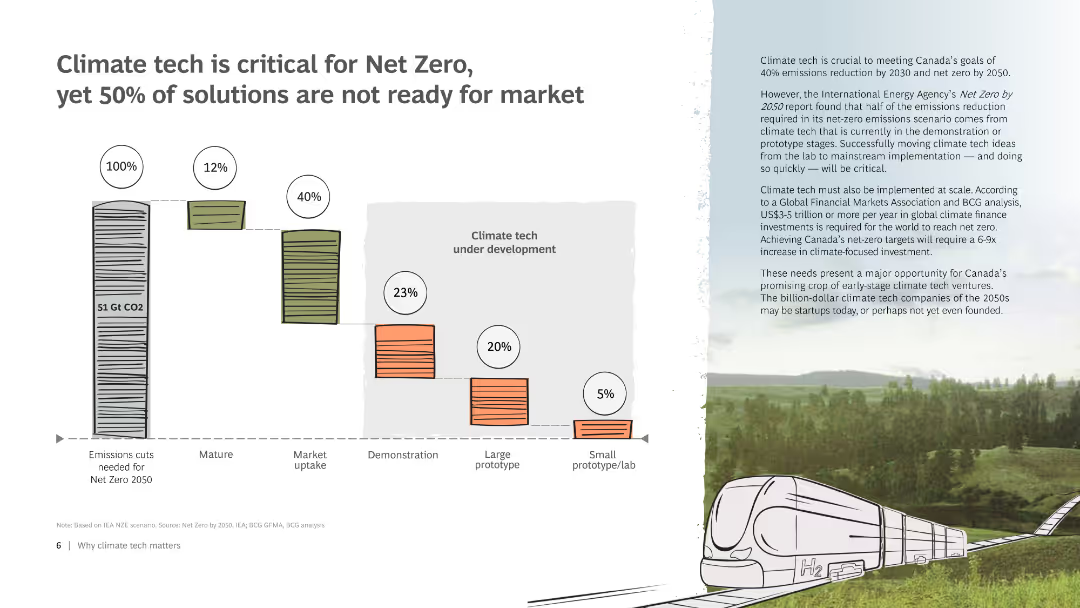
Bar chart comparing development cycles of past and current climate tech solutions. The chart shows the time from prototype to market for different technologies.
Technology and Digital Transformation
Environmental Services & Sustainability
Analyzes innovation cycles for climate tech, comparing historical and current examples to emphasize the need for faster development to meet emissions targets.
Innovation, climate tech, development, cycles, comparison
false
Technology and Digital Transformation
Environmental Services & Sustainability environmental-services-and-sustainability
Mixed Chart
BCG
View slide
This minimalistic slide displays three bullet points highlighting the session's main topics: How we define innovation, Innovation operating model, and Culture of innovation. It uses simple icons and text against a geometric background.
Strategic Planning
Professional Services
Introduces the key focus areas of the presentation on innovation. This slide sets the stage for discussions on defining innovation, exploring an innovation operating model, and fostering a culture of innovation within organizations. Useful for strategic sessions focused on organizational development and innovation management.
Innovation, strategic planning, organizational culture, innovation management
false
Strategic Planning
Professional Services professional-services
Agenda
McKinsey
View slide
Slide with headers and structured bullet points on one side and a flow diagram on the other, with a red and black design theme.
Financial Performance
Industrial & Manufacturing
Describes the Input-Output modeling used to assess the Tempest program's economic contribution to the UK supply chain.
Input-Output analysis, supply chain, GVA, employment, Tempest, economic contribution, UK
false
Financial Performance
Industrial & Manufacturing industrial-and-manufacturing
Diagram
PwC/Strategy&
View slide
The slide features a prominent table showing the relationship between different economic sectors and a header explaining the table's purpose.
Financial Performance
Industrial & Manufacturing
Illustrates how an Input-Output table can be used to understand sector requirements for producing output in an economy.
Input-Output table, economic sectors, agriculture, manufacturing, financial services, output, data analysis
false
Financial Performance
Industrial & Manufacturing industrial-and-manufacturing
Table
PwC/Strategy&
View slide
Column charts for revenue by reporting unit, bulleted lists, textual content
Financial Performance
Financial Services
Performance results for institutional clients, revenue and net income analysis
Institutional, Clients, Revenue, Column Chart, Performance, Financials
false
Financial Performance
Financial Services financial-services
Mixed Chart
Citigroup
View slide
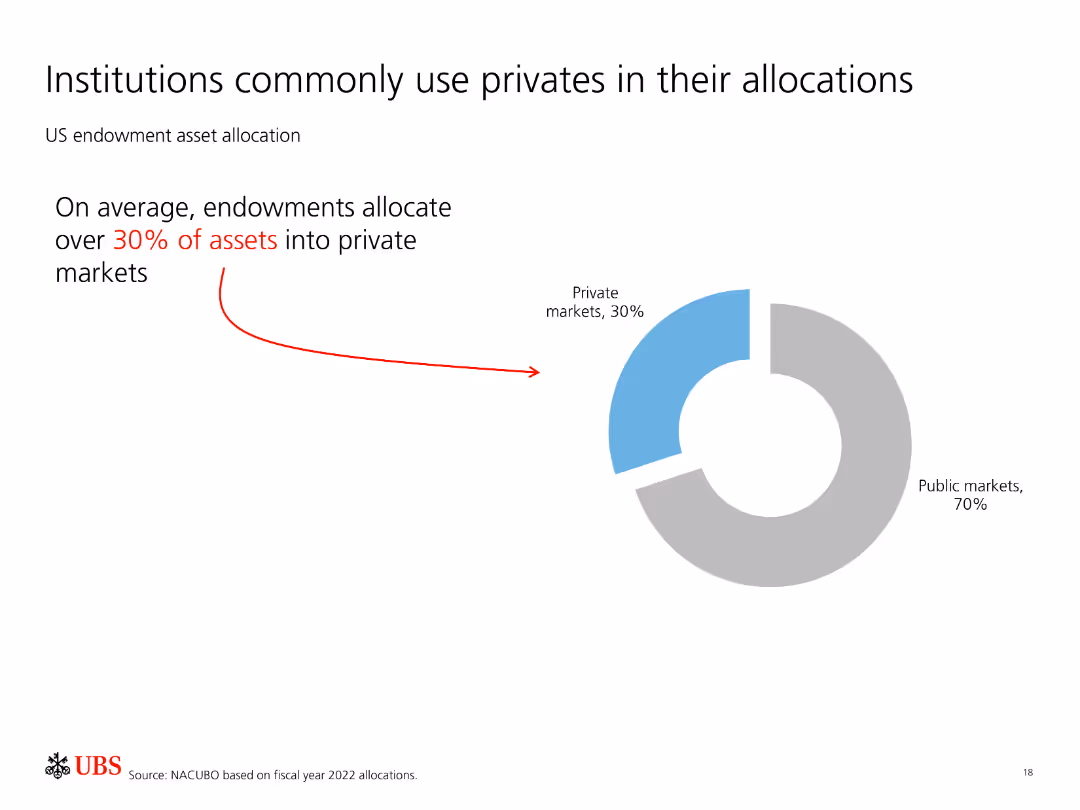
Features a pie chart showing US endowment asset allocation with 30% in private markets and 70% in public markets.
Investment Analysis
Financial Services
Indicates that institutions, particularly endowments, allocate a significant portion of their assets (30%) to private markets, demonstrating confidence in their performance.
Institutions, private markets, asset allocation, endowments, investment strategy
false
Investment Analysis
Financial Services financial-services
Mixed Chart
UBS
View slide
Features a process flow diagram illustrating the expected reductions in core insurance competencies and increased data science roles in hybrid teams.
Operational Efficiency
Financial Services
Discusses the medium-term expectations for insurance competencies, focusing on automation, data science roles, and hybrid teams.
Insurance competencies, Hybrid teams, Data science, Automation, Medium-term expectations
false
Operational Efficiency
Financial Services financial-services
Pillar
EY
View slide
A column and a pie chart analyzing consumer interest in purchasing insurance directly from vehicle manufacturers, presented in a clear and direct format.
Strategic Planning
Transportation & Logistics
This slide explores consumer interest in purchasing vehicle insurance directly from manufacturers, indicating potential market shifts and opportunities for OEMs to disrupt traditional insurance models.
Insurance purchasing, OEM strategy, consumer interest, market disruption
false
Strategic Planning
Transportation & Logistics transportation-and-logistics
Multiple Chart
Deloitte
Previous
Loading...
Hold On!
We are searching in our database
If nothing, comes up, please try different filters!
Column Chart
Heatmap
Chevron
Org Chart
Infographic
Callouts
Timeline
List
Graphic
Picture
Process Flow
Diagram
Paragraph
Map
Table
Framework
Subtitle
Takeaway Box
Icon
Other Chart
Radar Chart
Waterfall Chart
Mekko Chart
Pie Chart
Scatter Plot
Line Chart
Bar chart
Bullet points
Create a FREE account to continue browsing
Receive Instant Access to 1,000+ slides from companies like McKinsey, Google, and Goldman Sachs
First Name
Last Name
Email
Password
I agree to all
Terms & Privacy Policy
Thank you! Your submission has been received!
Oops! Something went wrong while submitting the form.
Have an account?
Sign in
Upgrade to PRO to Save slides
Advanced Search and Filters
Access to 15,000+ slides
Access to Category Pages
Save/Bookmark Slides
PowerPoint Template Library
Pick a Plan
MONTHLY
$12/month
Billed every month, Cancel anytime.
YEARLY
$9/year
Billed $108 annually, Cancel anytime.
Checkout for $12/month
Checkout for $108/yr
Secured by Stripe | AES-256 bit encryption