My Account
My Slides
Search by Category
Templates
Leave Feedback
Login
Logout
Get Started
Browse all Slides
Browse all Slides
Create a FREE Account
Instant access to 1,000+ real slides from top companies like McKinsey, BCG, Goldman Sachs, Google and many more!
First Name
Last Name
Email
Password
I agree to all
Terms & Privacy Policy
Thank you! Your submission has been received!
Oops! Something went wrong while submitting the form.
Have an account?
Sign in
📢 Ready to start building slides? Check out our new template library
VIEW TEMPLATES
Welcome,
Welcome
PRO
Show Featured Only
Checkbox 8
Companies
Mckinsey
Bain
BCG
EY
Deloitte
Accenture
PwC/Strategy&
JP Morgan
Goldman Sachs
Morgan Stanley
Citigroup
Deutsche Bank
Barclays
LEK
KPMG
Kearney
Oliver Wyman
Booz Allen Hamilton
Gartner
IPSOS
Nielsen
Slide type
Text Only
Linear Flow
Vertical Flow
Single Chart
Header Horizontal
Mixed Chart
Header Vertical
Pillar
Multiple Chart
Graphic
Agenda
Title
Table
Framework
Industry
Technology & Software
Artificial Intelligence
Financial Services
Retail & E-commerce
Consumer Goods
Industrial & Manufacturing
Transportation & Logistics
Telecommunications
Real Estate & Construction
Hospitality & Tourism
Professional Services
Education & Training
Media & Entertainment
Agriculture & Food Production
Healthcare & Pharmaceuticals
Environmental Services & Sustainability
Government & Public Sector
Use Case
Mergers and Acquisitions
Performance Metrics and KPIs
Client Case Studies
Competitive Landscape
Corporate Finance and Valuation
Product and Service Analysis
Customer and Market Segmentation
Organizational Structure and Change
Industry Overview
Regulatory and Compliance
Risk Assessment and Management
Investment Analysis
Organizational Structure and Change
Human Resources and Talent Management
Financial Performance
Market Analysis and Trends
Sales and Business Development
Human Resources and Talent Management
Clear all
Thank you! Your submission has been received!
Oops! Something went wrong while submitting the form.
Tag
View slide
Slide features a world map with colored regions depicting the percentage breakdown of Lloyd's business by region.
Market Analysis and Trends
Financial Services
This slide presents a regional breakdown of Lloyd's insurance business, detailing percentages across various global regions with specific focus on reinsurance, property, casualty, and other sectors.
Insurance, Global, Breakdown, Regions, Business
false
Market Analysis and Trends
Financial Services financial-services
Graphic
PwC/Strategy&
View slide
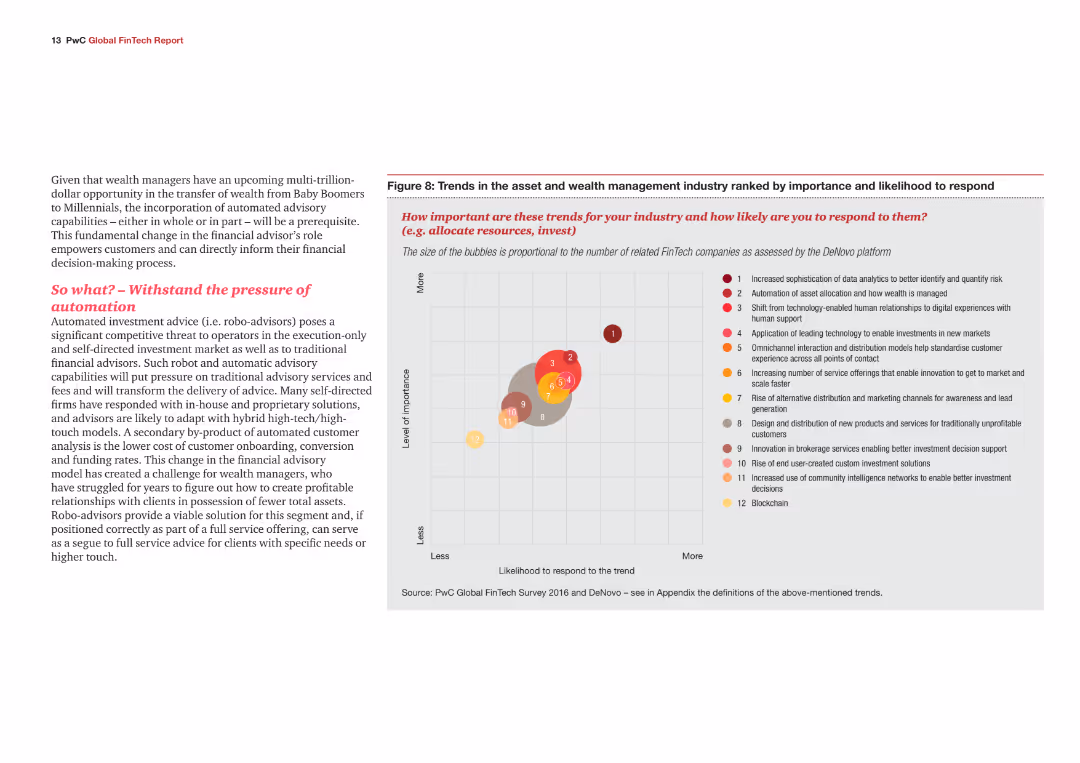
The slide features a bubble chart and text. The bubble chart shows trends ranked by importance and likelihood to respond.
Market Analysis and Trends
Financial Services
The slide highlights key trends in the insurance industry, including self-directed services and usage-based insurance.
Insurance, data analytics, trends, self-directed services, usage-based insurance
false
Market Analysis and Trends
Financial Services financial-services
Mixed Chart
PwC/Strategy&
View slide
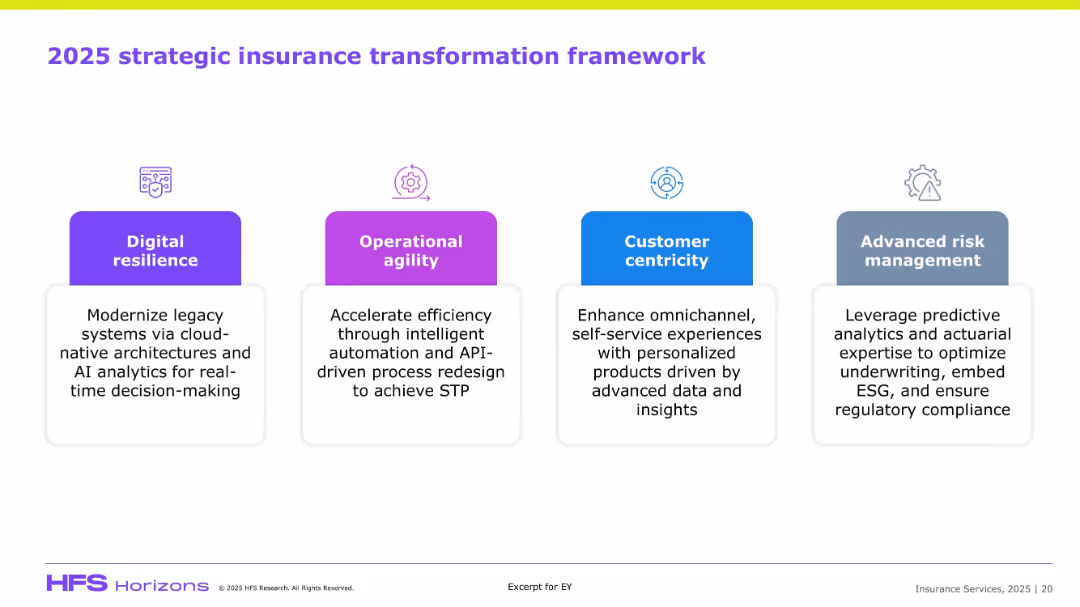
Horizontal flow of four colored blocks with icon headers and brief descriptions; simple, clean, and modern design.
Strategic Planning
Healthcare & Pharmaceuticals
The slide lays out a strategic framework for insurance transformation in 2025, identifying four pillars: digital resilience, operational agility, customer centricity, and advanced risk management. Each area is supported by enabling technologies such as cloud-native architectures, APIs, and predictive analytics, targeting efficiency and regulatory compliance.
Insurance, transformation, digital resilience, AI, automation, underwriting, ESG
false
Strategic Planning
Healthcare & Pharmaceuticals healthcare-and-pharmaceuticals
Pillar
EY
View slide
The slide showcases an integrated coverage model diagram with sectors like corporates, individuals, asset managers, and asset owners, alongside text boxes for areas of focus.
Operational Efficiency
Financial Services
The slide illustrates Morgan Stanley's integrated firm structure, highlighting key areas of focus such as corporate strategy, institutional capabilities, and public-private market ecosystem.
Integrated Coverage, Firm Structure, Morgan Stanley, Corporates, Individuals, Asset Managers, Areas of Focus, Diagram
false
Operational Efficiency
Financial Services financial-services
Diagram
Morgan Stanley
View slide
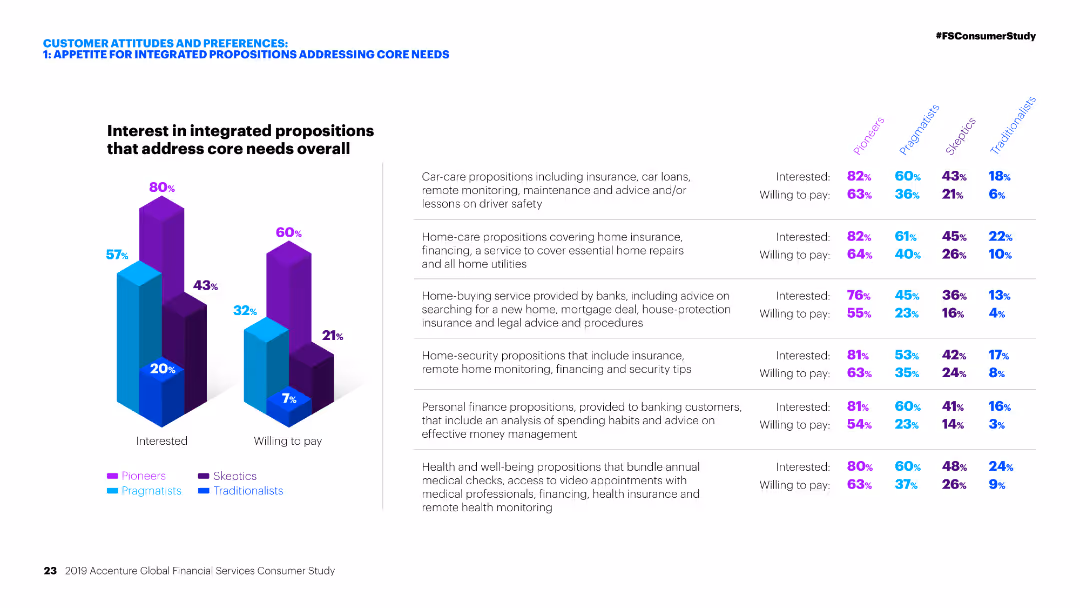
Column charts showing interest and willingness to pay for integrated propositions addressing core needs.
Market Analysis and Trends
Financial Services
Analysis of customer interest in integrated financial propositions, including car-care, home-care, home-buying, home-security, and personal finance.
Integrated propositions, financial services, customer interest, willingness to pay, core needs, market analysis, segmentation, personas, financial products
false
Market Analysis and Trends
Financial Services financial-services
Multiple Chart
Accenture
View slide
Slide features a diagram illustrating the overlap of Financial, Operational, and Commercial aspects within a common data platform, using a simple, clear design.
Investment Analysis
Professional Services
Describes A&M's integrated diligence process, illustrating how different aspects such as Financial, Operational, and Commercial are combined to guide investment and underwriting processes.
Integrated, Diligence, Financial, Operational, Commercial
false
Investment Analysis
Professional Services professional-services
Diagram
Alvarez & Marsal
View slide
Contains a circular flow diagram with icons representing different aspects of diligence such as Valuation, Commercial, and Tax. Clear, simple design with labeled segments and a central title.
Investment Analysis
Professional Services
This slide emphasizes the uniqueness of A&M's integrated diligence approach, showing how it combines various elements like Financial Accounting and Tax to create a comprehensive service.
Integrated, Diligence, Financial, Tax, Solution
false
Investment Analysis
Professional Services professional-services
Framework
Alvarez & Marsal
View slide
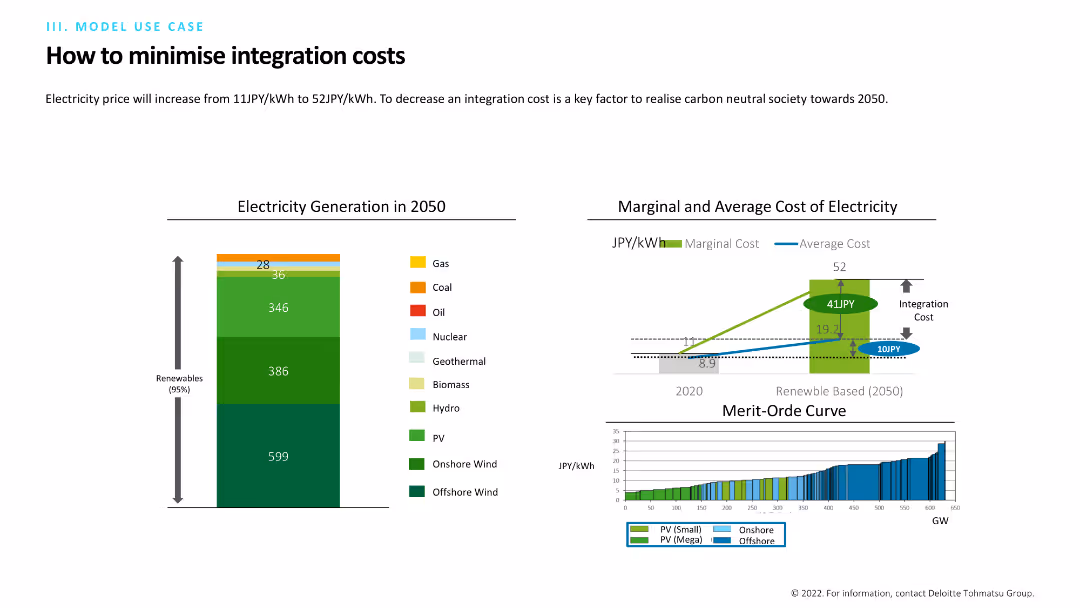
The slide includes a column chart showing electricity generation in 2050 by source (e.g., gas, coal, oil) and a line chart comparing marginal and average costs of electricity. Another chart shows the merit-order curve for renewables.
Operational Efficiency
Energy & Utilities
The slide discusses strategies to minimize integration costs in the energy sector by 2050, focusing on renewable energy and cost efficiency. It includes data on electricity generation and cost projections.
Integration costs, electricity, 2050, renewables, cost efficiency
false
Operational Efficiency
Energy & Utilities energy-and-utilities
Multiple Chart
Deloitte
View slide
A slide with two segments; the left side shows a circular diagram with sectors centered around client centricity, and the right side includes a descriptive statement on a black background.
Client Case Studies
Financial Services
This slide visually describes the integrated approach of the organization in serving global clients, emphasizing client centrality.
Integration, Client, Centricity, Global, Financial, Services, Organization, Approach
false
Client Case Studies
Financial Services financial-services
Diagram
Goldman Sachs
View slide
An image showing a diamond-shaped diagram with four core areas of Goldman Sachs, flanked by a sidebar detailing a partnership with Spotify, illustrating a case study approach.
Strategic Planning
Financial Services
This slide represents the integrated approach of Goldman Sachs, displaying its main operational divisions and highlighting a collaboration with Spotify. It details the multifaceted partnership encompassing investment, advisory, and wealth management, thus exemplifying the strategic relationships and comprehensive services the firm offers to its clients.
Integration, Operational Divisions, Spotify, Case Study, Investment, Advisory, Wealth Management
false
Strategic Planning
Financial Services financial-services
Text Only
Goldman Sachs
View slide
The slide features a complex diagram showing the ecosystem of Bank for Entrepreneurs and a list of capabilities with relevance to Private Banking business.
Strategic Planning
Financial Services
This slide describes the integration into SUB and the additional collaboration opportunities it creates, focusing on the Bank for Entrepreneurs ecosystem.
Integration, SUB, collaboration, ecosystem, Private Banking
false
Strategic Planning
Financial Services financial-services
Mixed Chart
Credit Suisse
View slide
The slide features a balanced layout with bullet points on the left and a column chart on the right. The column chart displays cost synergies from 2018 to 2022.
Operational Efficiency
Agriculture & Food Production
The slide discusses the rapid progress of organizational and cultural integration within Crop Science, highlighting achievements in cost and sales synergies, and specific targets.
Integration, synergies, cost savings, cultural integration, Crop Science, Bayer, operational excellence, financial targets, column chart
false
Operational Efficiency
Agriculture & Food Production agriculture-and-food-production
Mixed Chart
Credit Suisse
View slide
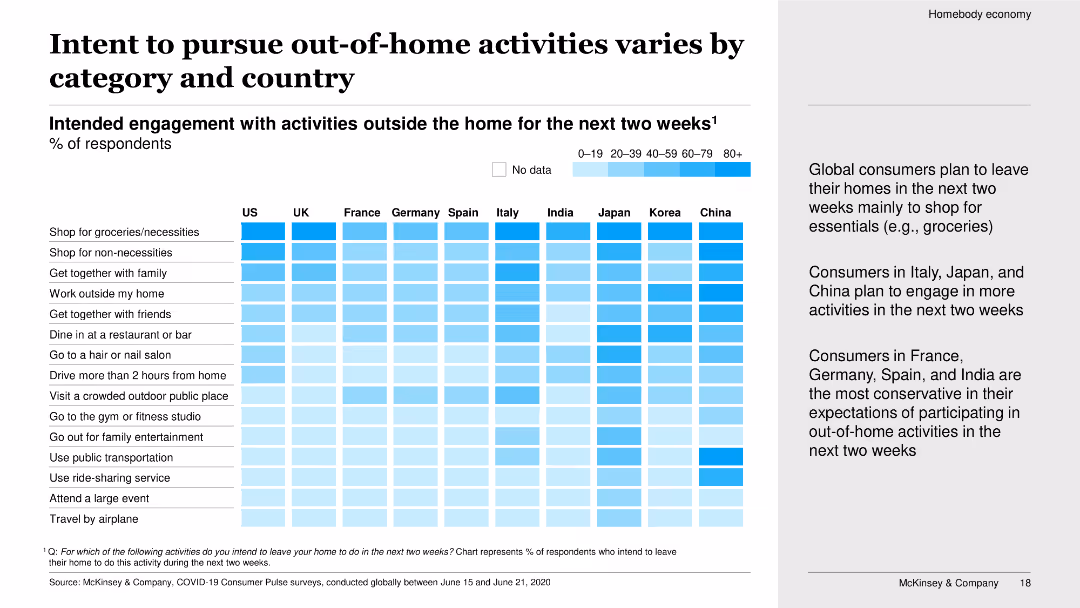
The slide features a heat map showing the intended engagement with various out-of-home activities over the next two weeks by respondents from different countries. It uses a gradient color scheme to represent different levels of engagement.
Market Analysis and Trends
Consumer Goods
The slide outlines the varying intentions of consumers in different countries to engage in out-of-home activities in the next two weeks. It highlights activities like shopping for necessities, dining out, and attending large events, showing significant differences between countries.
Intent to engage, out-of-home activities, heat map, country comparison, consumer intentions, short-term plans, COVID-19 impact, market analysis
false
Market Analysis and Trends
Consumer Goods consumer-goods
Boxed
McKinsey
View slide
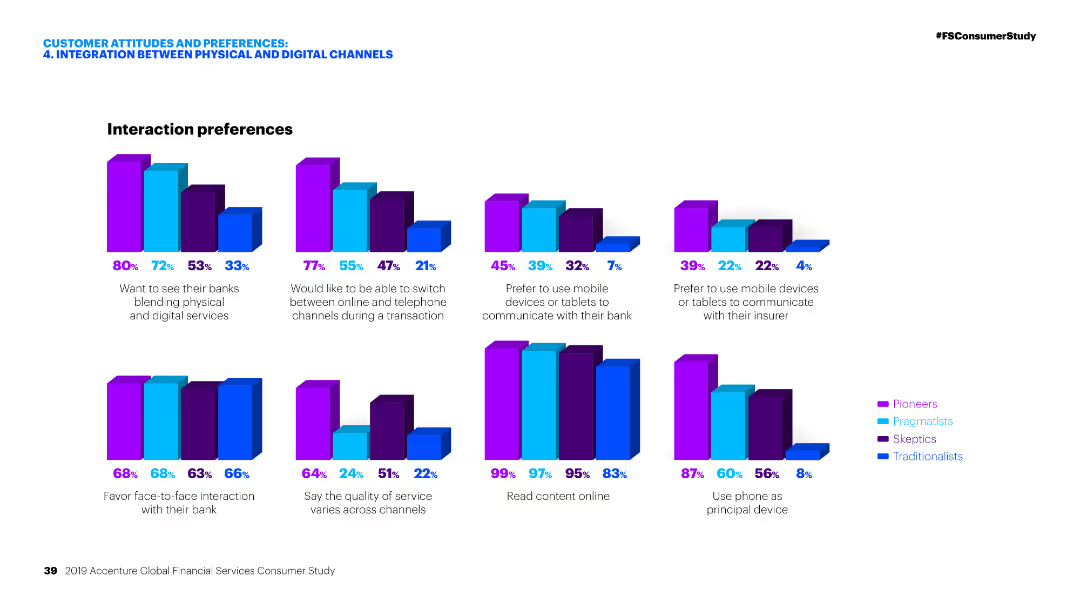
Multiple column charts depicting interaction preferences of different customer segments in banking and insurance contexts.
Customer and Market Segmentation
Financial Services
This slide presents various interaction preferences of customers when engaging with financial services, emphasizing the integration between physical and digital channels.
Interaction preferences, Financial services, Digital channels, Banking, Insurance
false
Customer and Market Segmentation
Financial Services financial-services
Multiple Chart
Accenture
View slide
Features multiple line graphs and column charts detailing NIM and NII developments across different banking segments, with a comparative analysis included on the right side.
Financial Performance
Financial Services
This slide presents the development of net interest margin (NIM) and net interest income (NII) across corporate, private, and financing sectors of the bank during Q4 2023. It provides insights into the financial performance and strategic positioning of the bank's core segments, emphasizing profitability and interest income optimization strategies.
Interest Income, Banking Segments, NIM, NII, Financial Analysis
false
Financial Performance
Financial Services financial-services
Multiple Chart
Deutsche Bank
View slide
Features line graphs and bar charts illustrating trends in net interest margins for different banking divisions, alongside data on interest-earning assets.
Financial Performance
Financial Services
This slide presents the trends in net interest margins across different bank divisions, highlighting stable financial management practices and the impact of external economic factors on performance metrics.
Interest Margins, Financial Stability, Banking Divisions, Economic Impact, Performance Metrics
false
Financial Performance
Financial Services financial-services
Multiple Chart
Deutsche Bank
View slide
Slide includes a column chart representing interest repayments over time as a percentage of Namibia's expense budget from 2017/18 to 2024/25. Each year is represented by a bar, with a line graph overlay showing the trend of interest payments and borrowing-related charges as a percentage.
Financial Performance
Government & Public Sector
Discusses trends in Namibia's interest repayments, analyzing their impact on the overall budget. Useful for financial planning and assessing fiscal sustainability in the public sector.
Interest Payments, Fiscal Planning, Debt Management, Namibia, Budget Analysis
false
Financial Performance
Government & Public Sector government-and-public-sector
Single Chart
PwC/Strategy&
View slide
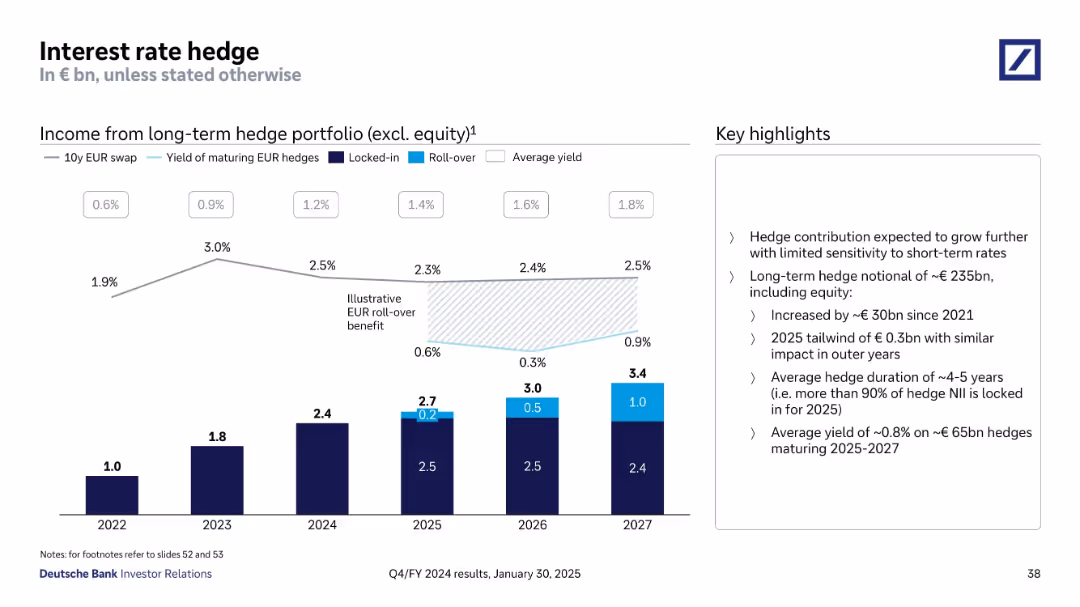
Bar and line charts showing income from long-term hedges with supporting bullet insights
Risk Assessment and Management
Financial Services
This slide explains the structure and benefits of Deutsche Bank’s long-term interest rate hedge portfolio, excluding equity. The chart highlights locked-in and rollover components, and the narrative emphasizes minimal short-term sensitivity, duration of ~4-5 years, and a €0.3bn expected benefit in 2025.
Interest Rate Hedge, Yield, Portfolio, Rollover, Locked-in, Duration
false
Risk Assessment and Management
Financial Services financial-services
Mixed Chart
Deutsche Bank
View slide
The slide has two donut charts showing 2023 and 2022 responses on interest rates and bond prices, with key data points.
Market Analysis and Trends
Financial Services
It illustrates the percentage of Canadians who correctly understood the impact of interest rates on bond prices, comparing 2022 to 2023.
Interest Rate, Bond Price, Knowledge, Canadians, Percentage, 2023, 2022, Chart, Financial, Trends
false
Market Analysis and Trends
Financial Services financial-services
Multiple Chart
IPSOS
View slide
Slide with five sets of column charts displaying 'Floating Loan Mix', 'Strong Retail Franchise', 'S&P Debt Ratings', and 'Core NIM' data. The charts compare TFC with peer medians and averages, using shades of purple and teal.
Risk Assessment and Management
Financial Services
The slide presents data on how the company manages interest rate risk, with comparisons to industry peers. It offers a look into various financial metrics that indicate the company's strategic positioning in terms of debt ratings and net interest margin.
Interest Rate, Risk Management, Financial Metrics, Debt Ratings, Net Interest Margin
false
Risk Assessment and Management
Financial Services financial-services
Multiple Chart
Goldman Sachs
View slide
Features column charts displaying hypothetical shifts in net interest income due to changes in the yield curve.
Risk Assessment and Management
Financial Services
This analytical slide explores the sensitivity of net interest income to changes in interest rates, presenting data projections up to 2026. It's designed for financial risk managers and analysts to assess the potential impact of interest rate fluctuations on the bank's earnings, aiding in strategic financial planning and risk mitigation efforts.
Interest Rates, Financial Risk, Projections, Banking, Sensitivity Analysis
false
Risk Assessment and Management
Financial Services financial-services
Multiple Chart
Deutsche Bank
View slide
With a split-view of bar charts, the slide displays comparative interest rate data for developed and emerging markets through visually distinct tables, highlighting current and prior year rates.
Investment Analysis
Financial Services
The slide acts as an analytical tool for assessing yield variations in sovereign currencies, key for financial strategists and investors monitoring interest rate trends and their impact on global markets.
Interest Rates, Sovereign Yields, Developed Markets, Emerging Markets, Currency, Financial Analysis, Comparative Tables
false
Investment Analysis
Financial Services financial-services
Multiple Chart
Morgan Stanley
View slide
The slide includes multiple charts, including a line chart, bar chart, and column chart. It shows trends over time.
Market Analysis and Trends
Financial Services
This slide analyzes the impact of interest rate changes on M&A activities, showing historical data and future forecasts.
Interest rate, leveraged finance, M&A, charts, trends
false
Market Analysis and Trends
Financial Services financial-services
Multiple Chart
JP Morgan
View slide
Two charts: one displays UK real wage growth with a forecast, and the other shows UK mortgages exposed to higher rates categorized by fixed and floating rates.
Risk Assessment and Management
Financial Services
The slide focuses on the sensitivity of the UK economy to interest rate changes, detailing real wage growth trends and the exposure of UK mortgages to higher rates. Used for economic impact analysis and risk assessment.
Interest rate, wage growth, mortgages, UK
false
Risk Assessment and Management
Financial Services financial-services
Multiple Chart
JP Morgan
View slide
Line charts of CHF 10y swap rate evolution and CHF forward yield curve, with bullet points on macroeconomic dynamics and implications.
Market Analysis and Trends
Financial Services
Analyzes the current interest rate environment, focusing on the trends in swap rates and yield curves, and their business implications.
Interest rates, CHF swap rate, yield curve, macroeconomics, business implications
false
Market Analysis and Trends
Financial Services financial-services
Multiple Chart
Credit Suisse
View slide
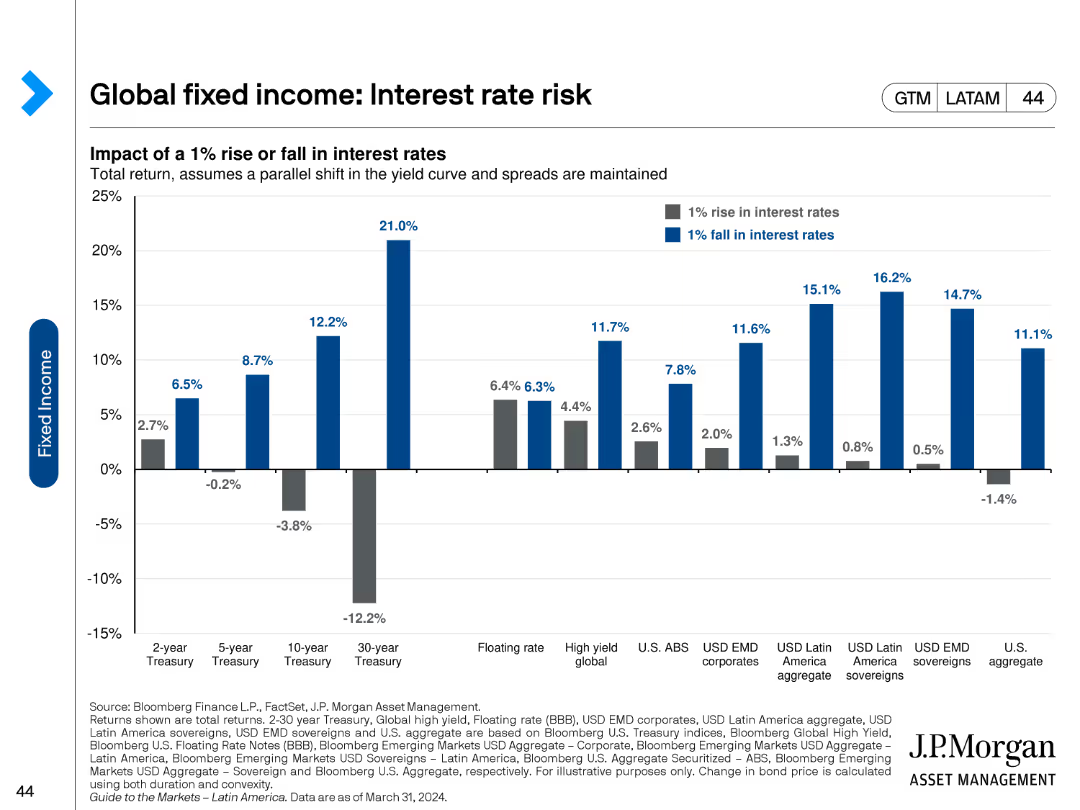
A column chart depicting the impact of a 1% rise or fall in interest rates on various fixed income assets. The chart includes blue and gray bars representing the rise and fall respectively, with detailed values for each asset category on the x-axis.
Risk Assessment and Management
Financial Services
This slide illustrates the potential effects of a 1% interest rate change on the total return of different fixed income instruments, highlighting the sensitivity of various assets like treasuries, corporates, and sovereigns to interest rate fluctuations.
Interest rates, fixed income, total return, sensitivity, risk
false
Risk Assessment and Management
Financial Services financial-services
Single Chart
JP Morgan
View slide
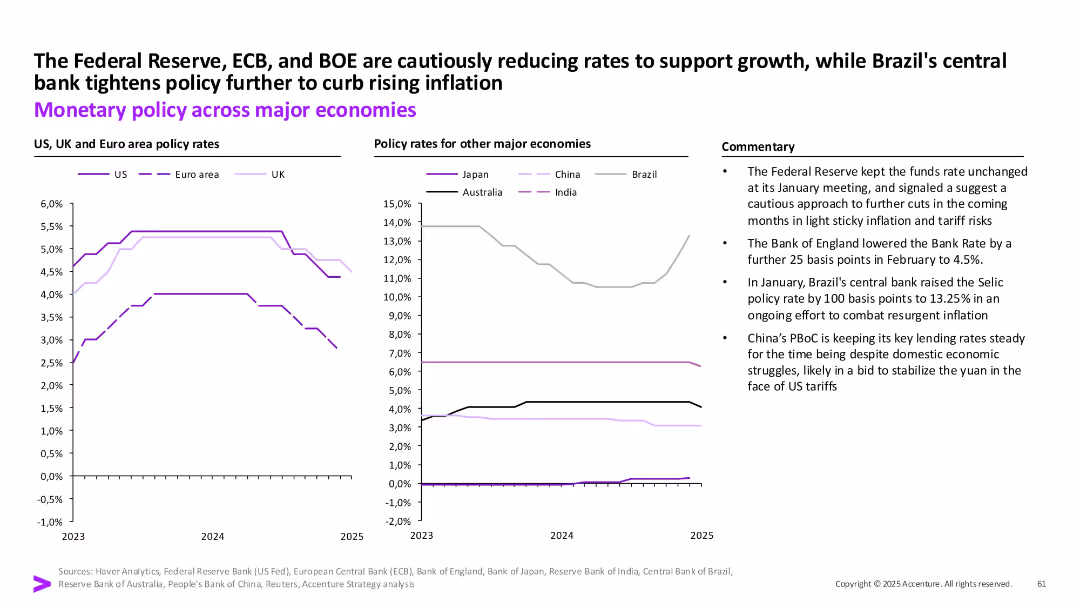
Two comparative line charts by region on policy rates with textual commentary.
Strategic Planning
Financial Services
The slide contrasts monetary policy decisions across major economies in response to inflation and growth concerns. The Fed, ECB, and BOE show rate reductions, while Brazil tightens and China remains steady.
Interest rates, inflation, central banks, Fed, ECB, BOE, Brazil, China, monetary policy
false
Strategic Planning
Financial Services financial-services
Multiple Chart
Accenture
View slide
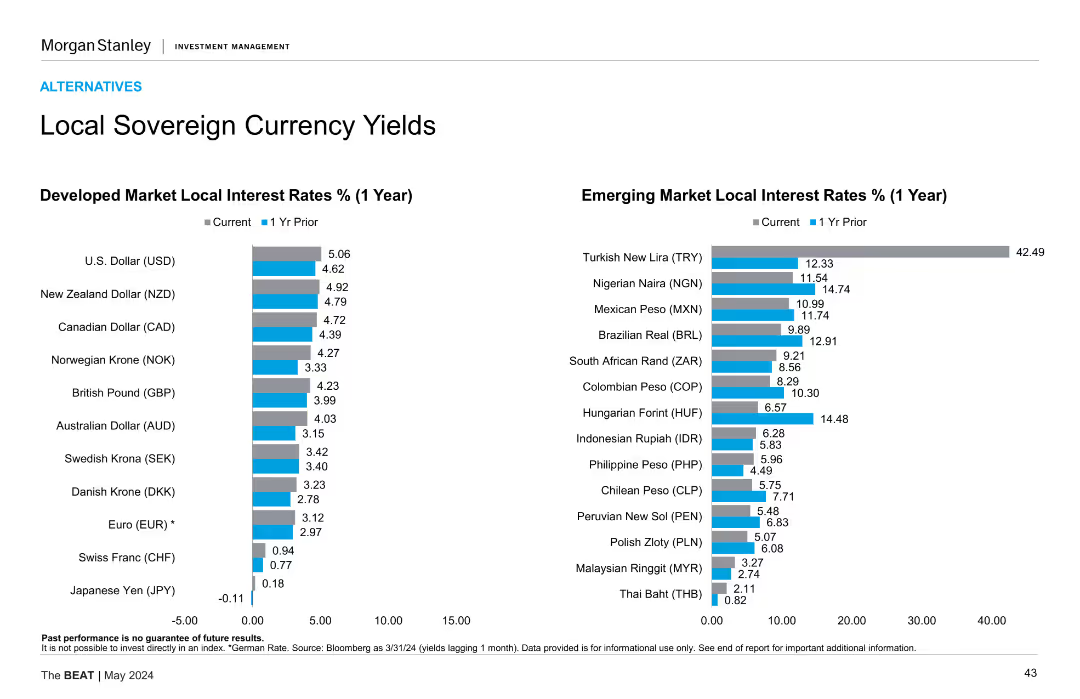
Two column charts comparing developed and emerging market local interest rates (1 year) with current and 1-year prior rates. Bars are vertical.
Market Analysis and Trends
Financial Services
Compares local interest rates for developed and emerging markets. Developed markets include USD, NZD, CAD, etc., while emerging markets include TRY, NGN, MXN, etc.
Interest rates, local currency, market
false
Market Analysis and Trends
Financial Services financial-services
Multiple Chart
Morgan Stanley
View slide
Features multiple column charts in blue tones, analyzing sensitivity to interest rate changes across currencies.
Financial Performance
Financial Services
Details how shifts in interest rates affect net interest income, used in strategic financial planning and risk management.
Interest rates, net interest income, sensitivity, financial planning, currency, risk management, banking
false
Financial Performance
Financial Services financial-services
Multiple Chart
Deutsche Bank
View slide
Slide includes a column chart segmented by segment and loans, accompanied by tables and descriptive texts.
Financial Performance
Financial Services
Focused on net interest income by business segment and detailed loan breakdown, complemented by metrics and lending highlights.
Interest, Income, Loans, Bar Charts, Metrics, Segments, Performance, Corporate, Wealth Management, Real Estate
false
Financial Performance
Financial Services financial-services
Mixed Chart
Goldman Sachs
Previous
Loading...
Hold On!
We are searching in our database
If nothing, comes up, please try different filters!
Column Chart
Heatmap
Chevron
Org Chart
Infographic
Callouts
Timeline
List
Graphic
Picture
Process Flow
Diagram
Paragraph
Map
Table
Framework
Subtitle
Takeaway Box
Icon
Other Chart
Radar Chart
Waterfall Chart
Mekko Chart
Pie Chart
Scatter Plot
Line Chart
Bar chart
Bullet points
Create a FREE account to continue browsing
Receive Instant Access to 1,000+ slides from companies like McKinsey, Google, and Goldman Sachs
First Name
Last Name
Email
Password
I agree to all
Terms & Privacy Policy
Thank you! Your submission has been received!
Oops! Something went wrong while submitting the form.
Have an account?
Sign in
Upgrade to PRO to Save slides
Advanced Search and Filters
Access to 15,000+ slides
Access to Category Pages
Save/Bookmark Slides
PowerPoint Template Library
Pick a Plan
MONTHLY
$12/month
Billed every month, Cancel anytime.
YEARLY
$9/year
Billed $108 annually, Cancel anytime.
Checkout for $12/month
Checkout for $108/yr
Secured by Stripe | AES-256 bit encryption